The effect of different video summarization models on the quality of video recommendation based on low-level visual features Yashar Deldjoo
Paolo Cremonesi
Politecnico di Milano Via Ponzio 34/5 Milan 20133, Italy
[email protected]
Politecnico di Milano Via Ponzio 34/5 Milan 20133, Italy
[email protected]
Markus Schedl
Massimo Quadrana
Johannes Kepler University Altenberger Street 69 Linz 4040, Austria
[email protected]
Politecnico di Milano Via Ponzio 34/5 Milan 20133, Italy
[email protected]
ABSTRACT Video summarization is a powerful tool for video understanding and browsing and is considered as an enabler for many video analysis tasks. While the effect of video summarization models has been largely studied in video retrieval and indexing applications over the last decade, its impact has not been well investigated in content-based video recommendation systems (RSs) based on lowlevel visual features, where the goal is to recommend items/videos to users based on visual content of videos. This work reveals specific problems related to video summarization and their impact on video recommendation. We present preliminary results of an analysis involving applying different video summarization models for the problem of video recommendation on a real-world RS dataset (MovieLens-10M) and show how temporal feature aggregation and video segmentation granularity can significantly influence/improve the quality of recommendation.
CCS CONCEPTS • Information systems → Recommender systems;
KEYWORDS Content-based video recommendation, temporal feature summarization, feature aggregation, shot segmentation granularity, evaluation ACM Reference format: Yashar Deldjoo, Paolo Cremonesi, Markus Schedl, and Massimo Quadrana. 2017. The effect of different video summarization models on the quality of video recommendation based on low-level visual features. In Proceedings of CBMI, Florence, Italy, June 19-21, 2017, 6 pages. Permission to make digital or hard copies of all or part of this work for personal or classroom use is granted without fee provided that copies are not made or distributed for profit or commercial advantage and that copies bear this notice and the full citation on the first page. Copyrights for components of this work owned by others than ACM must be honored. Abstracting with credit is permitted. To copy otherwise, or republish, to post on servers or to redistribute to lists, requires prior specific permission and/or a fee. Request permissions from
[email protected]. CBMI, June 19-21, 2017, Florence, Italy © 2017 Association for Computing Machinery. ACM ISBN 978-1-4503-5333-5/17/06. . . $15.00 https://doi.org/10.1145/3095713.3095734
https://doi.org/10.1145/3095713.3095734
1
INTRODUCTION AND CONTEXT
A video can be represented by a set of frame-level (visual) features X = [x1 , x2 , ..., xn ] ∈ Rd ∗n where xi ∈ Rd denotes the i-th frame with d-dimensional feature description and n is the total number of frames in the video. For a regular video, n is usually in the order of tens of thousands where consecutive frames share a lot of similarity in their visual characteristics, unless at transitioning frames from one shot to another shot. Techniques have been sought to organize video features into more compact forms as a first step for a number of tasks, including video retrieval and video classification [7, 8, 11, 12]. In this paper we focus on the problem of video summarization for the video recommendation domain [3, 18]. Content-based video recommender systems (RS) are a class of information filtering techniques that provide personalized video recommendations to users by building a profile of the user from the content-based descriptions of items/videos. Machine learning techniques are used to learn the user profile from both (i) the videos the user has previously interacted with (e.g., liked, bought etc.) and (ii) the features of each video. The user profile is a vector in the feature space and shows user’s interests to each of the feature components. We argue that in building video recommendation algorithms based on low-level visual features, quality of recommendations depends on how video features are represented across the video stream. The procedure typically adopted to extract visual features can be summarized into three steps: • Shot boundary detection is used to segment a video temporally and it is intrinsically linked to the way the video is produced. Its goal is to segment a video into meaningful parts, and thus it is very often the first step in algorithms that accomplish other video analysis tasks. A standard technique to detect shot boundaries is to calculate the similarity between every two consecutive frames. When the similarity goes below a certain threshold, a shot change is detected. A high similarity threshold would result in a fine-grained
CBMI, June 19-21, 2017, Florence, Italy segmentation, whereas a low threshold would yield a coarse segmentation. For example, for a random video in our dataset (see Section 2 and 3) a (histogram) similarity threshold of t = 0.45 results in 96 shots whereas a similarity threshold of t = 0.95 produces 1936 shots. The amount of information transferred into a recommender system can be largely different by choosing a fine-grained or coarse segmentation. • After a video is segmented into meaningful shots, each shot is represented by a feature descriptor calculated from one or more frames within the shot . In the former case, the selected frame is regarded as the key frame, whereas in the latter case, the function that combines the frames or features is known as an aggregation function. • After each shot has been represented with a descriptor of fixed length, the shots’ descriptors can be aggregated by using different aggregation functions. The key difference between this stage and the previous stage is that features across shots vary significantly over time, whereas the features within a shot do not change significantly. Therefore, the aggregation function that combines features across shots needs to be of different nature and should capture the underlying statistics of the features across the video stream. Based on the discussion above, we articulate the following highlevel research hypothesis: We can improve the quality of recommendation with respect to MSE in content-based video recommender system based on visual features by using a summarized model of the video that takes into account the importance of between-shot and within-shot feature aggregation and shot segmentation granularity. We articulate the research hypothesis along three research questions: RQ1: Sensitivity to Shot-Segmentation Granularity. We segment all videos in our movie dataset into shots in a coarse-to-fine fashion to determine an optimal shot segmentation level that can improve the quality of recommendation. RQ2: Effect of Shot Representation. As there exists considerable amount of temporal redundancies between shot frames, we investigate if features extracted from a single key frame of each shot result in the same quality of recommendation than averaging the features extracted from all the frames within the shot. RQ3: Effect of Video Representation: At this stage, a number of important questions are raised. First, the number of video shots produced after video segmentation is different on different videos depending on the video length, how the video is filmed (e.g. if it contains many or few camera movements) and how it is segmented (coarse or fine). The key question is how to combine these shot-level feature vectors which are different in number in different videos into a fixed length descriptor to represent each video? Second, is it sufficient to select a fixed number of shots in a random fashion and use the information from those shots as representation of the entire video? Third, as the variation of features across shots is significantly higher than within shots, which is the best aggregation strategy across shots? This paper does not assert to be proposing an entirely novel method as the other works in video and music indexing and retrieval have tried to, e.g. [8, 12, 14, 16]. However, we think it will be instructive in the future to explore many video summarization
Y. Deldjoo et al. schemes presented in this paper in the context of video recommendation based on visual features. In fact, to date the authors know about no other video recommender system based on visual features which has exploited the effect of these summarization models in the recommendation context. The contributions of this paper are two-fold: • We articulate specific problems related to video recommender systems based on visual features currently deployed. • We present preliminary results that show how temporal feature aggregation and video segmentation level can significantly influence/improve the quality of recommendation.
2
METHODOLOGY
The methodology adopted to evaluate the impact of using different video summarization models on the quality of video recommendation comprises of five steps: 1. 2. 3. 4. 5.
Video Shot Segmentation Visual Feature Extraction Within-Shot Feature Aggregation Between-Shot Feature aggregation Recommendation
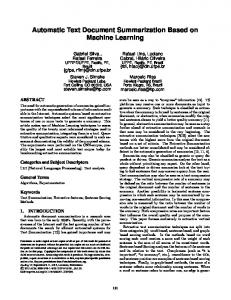
We perform feature aggregation in two levels: within and between shots, where in the former the effort is to reduce the redundancy that exist between frames of a shot (due to high correlation between successive frames) and in the latter the attempt is to take advantage of the diversity of feature values across shots (due to independence of frames across shots). We have evaluated the quality of recommendation with respect to following: (i) Shot-Segmentation Level, (ii) Within-Shot Feature Aggregation Type and (iii) Between-Shot Feature Aggregation Type. The flowchart of the methodology is shown in Figure 1.
2.1
Video shot segmentation
The initial step toward the goals presented in Section 2 and enable extraction of features is to segment video streams into shots. A great number of methods have been proposed in the past years [2, 10]. The color histogram distance is one of the most reliable variants used as a measure of (dis)similarity between consecutive video frames for the purpose of content-based video retrieval, object recognition, and others. The basic idea is that the video content intensity does not change rapidly within but across shots. Thus, hard cuts and other short-lasting transitions are detectable as a signal peak in the time series of the differences between intensity histograms of two consecutive frames. A histogram is computed for each frame in the video and the histogram intersection is used as the means of comparison (measure of local activity) according to Equation 1, s(ht , ht +1 ) =
Õ
min(ht (b), ht +1 (b))
(1)
b
where ht and ht +1 are histograms of successive frames and b is the index of the histogram bin. By comparing s with a predefined threshold and letting this threshold vary from a small value (0.45) to a large value (0.95), we segment the videos in our video dataset into shots from a coarse to fine fashion.
sh1
The effect of different video summarization models on the quality of video recommendation
Visual Feature Extraction
CBMI, June 19-21, 2017, Florence, Italy
Shot-level aggregation
Frame-level aggregation mean keyFrame
Shot Sampling
Visual Feature Extraction
Concatenation
Frame-level aggregation
mean
Visual Feature Extraction sh3
Visual Feature Extraction
Frame-level aggregation
Visual Feature Extraction
Histogram similarity threshold
mean
Abstract Model of Video
median
keyFrame
Density-Aware Shot Aggregation
Visual Feature Extraction
Standard Shot Aggregation
sh2
Visual Feature Extraction
Probability Distribution
mean keyFrame
Visual Feature Extraction
thr
Visual Feature Extraction
Temporal Video Segmentation
Within-Shot Feature Aggregation
Between-Shot Feature Aggregation
Figure 1: Elements of the video summarization model in our experiment. A video is first segmented into shots by using a coarseto fine segmentation granularity level. From each frame in one shot, a number of predefined visual features are extracted. The frame-level visual features are aggregated by using a within-shot aggregation method. Finally, the shot level features are aggregated into a fixed-length descriptor by using different between-shot aggregation strategies.
2.2
Visual features extraction
Table 1: Visual features used in our study.
In order to optimize the contribution of visual features to video recommendation, two categories of visual features are investigated: static features and dynamic features. • The static dimension includes cues that are salient because of a change over image space; for example, color variation of all pixels in an image [1]. • The dynamic dimension includes features that are salient because of change over time. In our experiments, we have selected four categories of low-level visual features quantified in six feature variations as described in Table 1. Two of these four feature categories capture the static aspect of videos, whereas the other two reflect the dynamic aspect [5, 10]. As for the motion feature, we use the standard optical
feature 1 2 3 4 5 6
color variance lighting key motion shot duration
aggregation within frame
type
mean median std -
static static dynamic dynamic dynamic dynamic
flow technique to estimate motion vectors in each video frame. The motion feature is represented by calculating the mean, median, and standard deviation of motion vectors. Regarding shot duration, we
CBMI, June 19-21, 2017, Florence, Italy
Y. Deldjoo et al.
measure the length of each shot (in terms of number of frames) as a characteristic of that shot (different from previous works which measure the average shot length on the entire video). Finally, all the features are normalized to the range [0-1] by using the min-max normalization scheme. Previous works have shown the effectiveness of these low-level visual features in recommendation and classification contexts [3, 4, 15, 17].
2.3
Within-shot feature aggregation
Table 2: Characteristics of the dataset used in the evaluation. rsize and csize are the average number of ratings per user and item respectively. dataset
#users
#items
#ratings
rsize
csize
density
ML-10M
27992
1459
281734
10.06
193.10
0.68 %
3
We select and compare the functioning of two within-shot aggregation functions: mean and key frame selection, where a key frame is chosen as the middle frame of a shot [19]. The reason for this choice is to investigate if it is sufficient to use a key frame for shot representation. This is a common approach in video indexing and retrieval applications and here we are comparing the performance in the context of recommendation.
3.1 Between-shot feature aggregation
In our experiments, we investigate three strategies: • Shot sampling. With shot sampling, a predefined number of shots are randomly selected and their corresponding feature vectors are concatenated to create a super vector of raw features. • Averaging aggregation. All feature vectors are aggregated using either mean or median. • Density-aware feature aggregation. In this approach, we estimate a probability density function (PdF) with B bins for each of the visual features across shots. For this, we map each of the six visual features in each shot, to one of B bins of a PdF. We repeat this step for all shots until the complete PdF is built for that particular feature. This results in six PdFs for six features used in our experiment. Then we concatenate the corresponding PdFs for each feature to create a super vector. The advantage of the PdF-approach is three-fold: (1) it considers all video shots, (2) it maps videos with different number of shots into a fixed length feature vector representation, (3) it captures the underlying statistics of the features across shots. We chose the number of histogram bins in our experiment 8, and 16 denoted by PdF 8 and PdF 16.
2.5
We employ 10-fold cross validation (CV) in our experiments. Ratings are therefore partitioned into 10 non-overlapping subsets. In each run, 90% of the ratings are included in the training set and 10% of the ratings are used for testing. The evaluation is conducted by comparing the Mean Squared Error (MSE) between the true rating rui and the predicted rating e rui Í (e rui − rui )2 MSE = (4) n where n is the number of ratings in the test set. Table 3: Comparison of the effect of within- (left to right) and between-shot (top to bottom) aggregation models on the quality of video recommendation. The results reported are MSE values based on 10-fold CV experiments. MSE Video Summarization Models
Recommendation Model
The recommendation score of an unrated item i for user u is computed as a linear model as shown in Equation 2, e rui = µ + bi + bu + pu fi
Evaluation Methodology and Metrics
between-shot aggregation
2.4
EXPERIMENTAL RESULTS
We evaluate the performance of the recommender system on the MovieLens-10M dataset [9], which contains user–item interactions of users with an up-and-running movie recommender system. For each movie in the dataset, we have extracted the video features from the corresponding trailer downloaded from YouTube, if available. The characteristics of the final dataset is shown in Table 2.
mean median shot sampling 8 shot sampling 16 PdF 8 PdF 16
within-shot aggregation key frame (1 frame) 0.797 0.797 0.806 0.771 0.770 0.756
mean (multiple frames) 0.796 0.793 0.813 0.772 0.771 0.755
(2)
where e rui is the estimated rating for user u on video i, fi ∈ Rn f is the feature vector of item i in which n f is the number of features and pu ∈ Rn f is the profile of user u, a weight vector which measures the user u’s taste on each of the feature vector components. The user profile pu is estimated by the ridge regression optimization model [13], shown in Equation 3, 1 minimize ∥rui − pu fi ∥22 + λ∥pu ∥22 (3) pu 2 where ∥.∥22 is the ℓ2 -norm and the constant λ > 0 is the regularization parameter. The user profile e pu is learnt in the training phase and used to predict unknown rating in the test phase.
3.2
Comparison of the Effect of Within- and Between-Shot Aggregation Models
The comparison of the effect of different video summarization approaches as a function of within- and between-shot aggregation models is shown in Table 3. Shot sampling 8 and 16 mean, respectively, 8 and 16 shots were sampled randomly from the videos under consideration in order to aggregate the shot feature vectors. PdF 8 and 16 refer the number of bins (8 or 16 bins) used in generation of feature histograms. We summarize the results based on Table 3 as follows:
The effect of different video summarization models on the quality of video recommendation 1. Within-shot Aggregation Model: • Best Model: It can be seen that the key frame and mean within-shot aggregation models perform almost similarly on all cases with negligible differences and it is hard to prefer one over the other. • Explanation: The result above can be explained by the fact the frames within shots contain a high-level of similarity in their visual appearance. • Assumption: From this point on, we will report all the results based only on key frame within-shot aggregation model. 2. Between-shot Aggregation Model: • Best Model: We performed a multiple comparison test based on the results reported in Table 3 with the goal of understanding best within-shot aggregation model. We used 1-way ANOVA to investigate whether there is a significant difference between the means of six between-shot aggregations models. Results are summarized in Figure 2, where we can see that the PdF16 between-shot aggregation approach outperforms other approaches with statistically significant difference (p < 0.01).
CBMI, June 19-21, 2017, Florence, Italy
with other approaches while using a descriptor length of eight times larger than mean and median. These result indicates that by building a portability density function (PdF) of the feature values across shots, we are able to collect more useful information about video content in terms of their visual content in comparison with the basic approaches which aggregate the features by using the basic mean and median of features or by sampling a random number of shots where in the latter case, our results have shown that the excess of features can serve as a degrading factor. • Explanation: One of the main weak points of shot sampling approaches is that they collect information from a certain number of shots (e.g. 8 or 16 shots). Indeed, the final video feature descriptor components in this approach contains the information about certain shots, not all. This can be a limitation compared with PdF-based approaches which with the same descriptor length, contain information about all shots. The other limitation of shot-sampling based approaches is that, if we wish to increase to number of shots (e.g. 64, 128), we may end up not finding videos containing that number of shots. This is a limitating factor specially for movie trailers which usually have a short video duration (note that we need to sample the same number of shots from all videos in order to create a fixedlength descriptor for all videos).
Multiple Pairwise Comparison Test (p