SMALLetGR 10.1177/1046496403260843 Strijbos al.OUP / FUNCTIONAL RESEARCH /ROLES April 2004 AND GROUP EFFICIENCY
THE EFFECT OF FUNCTIONAL ROLES ON GROUP EFFICIENCY: Using Multilevel Modeling and Content Analysis to Investigate ComputerSupported Collaboration in Small Groups JAN-WILLEM STRIJBOS ROB L. MARTENS WIM M. G. JOCHEMS
Open University of the Netherlands
NICK J. BROERS
University of Maastricht
The usefulness of roles to support small group performance can often be read; however, their effect is rarely empirically assessed. This article reports the effects of functional roles on group performance, efficiency, and collaboration during computer-supported collaborative learning. A comparison of 33 questionnaire observations, distributed over 10 groups in two research conditions (role and nonrole) revealed no main effect for performance (grade). A latent variable was interpreted as perceived group efficiency (PGE). Multilevel modeling yielded a positive, marginal effect for PGE. Groups in the role condition appear to be more aware of their efficiency as compared to groups in the nonrole condition, regardless of whether they performed well or poorly. Content analysis reveals more task-content focused statements in the role condition; however, this was not as we hypothesized (i.e., the premise that roles decrease coordination). In fact, roles appear to stimulate coordination that simultaneously increases the amount of task-content focused statements. Keywords: functional roles; computer-supported collaborative learning; computer-mediated communication; multilevel modeling; content analysis
Since the 1970s, small group dynamics have been intensively studied in educational contexts. Cooperative learning research focused initially on face-to-face cooperation at the elementary school level but was gradually extended to college and higher education setSMALL GROUP RESEARCH, Vol. 35 No. 2, April 2004 195-229 DOI: 10.1177/1046496403260843 © 2004 Sage Publications
195
196 SMALL GROUP RESEARCH / April 2004
tings. Design of cooperative learning pedagogy focused on promoting group cohesion and group responsibility to increase promotive intragroup interaction. Because of the technology push in the 1980s resulting from rapid developments in computer-mediated communication (CMC), social psychological orientations gradually lost the upper hand, giving rise to a new discipline called computer-supported collaborative learning (CSCL) in the 1990s. CSCL is situated at the crossroads of educational psychology, social psychology, computer science, and communication science. In effect, CSCL cannot yet be regarded as an established research paradigm (Koschmann, 1996) because theoretical debate, as well as large varieties in technological and pedagogical support of collaborative learning, still prevails. However, it has been shown that CSCL promotes metacognitive processes (Ryser, Beeler, & McKenzie, 1995), that representational guidance can aid collaboration (Suthers & Hundhausen, 2002), that reflective interaction can be promoted with a structured dialogue interface (Baker & Lund, 1997), that more elaborated problem solving is increased (Jonassen & Kwon, 2001), and that high-level interaction promotes higher levels of cognitive knowledge gain (Schellens & Valcke, 2002). Nevertheless, several researchers also identify large variations in the quality of interaction and of learning outcomes (Häkkinen, Järvelä, & Byman, 2001; Lehtinen, Hakkarainen, Lipponen, Rahikainen, & Muukkonen, 1999). On one hand, these are caused by differences in length of studies, technology used, group size, as well as differences in research methodology and the unit of analysis (Lipponen, 2001). On the other hand, the outcome of small group collaboration is mediated by the quality of group processes (Shaw, 1981). As the initial technological push slowly resides, small group dynamics have regained interest of the CSCL research community (Kreijns, Kirschner, & Jochems, 2003; Strijbos & Martens, 2001; AUTHORS’NOTE: The authors would like to thank Mimi Crijns and Ger Arendsen for their invaluable support and assistance in gathering the data and in conducting this study. Correspondence should be sent to Jan-Willem Strijbos, Open University of the Netherlands, Educational Technology Expertise Center, P.O. Box 2960, 6401 DL, Heerlen, the Netherlands; e-mail:
[email protected].
Strijbos et al. / FUNCTIONAL ROLES AND GROUP EFFICIENCY 197
Wood, 2001). In addition, it is gradually acknowledged that learning and collaboration reside in intragroup interaction (Strijbos, Martens & Jochems, in press), and thus, this is the primary process to be studied with respect to performance and to learning benefits in CSCL settings. THE USE OF ROLES TO SUPPORT COORDINATION DURING ASYNCHRONOUS CSCL
Group performance effectiveness depends, as group size increases, on the group’s use of increased resources and alternate opinions (process gains) and on the handling of increased coordination and group management processes (process losses) (Shaw, 1981). Conflicts regarding coordination are likely to occur in asynchronous CSCL settings; for example, the group members are not present at the same time or place (Benbunan-Fich & Hiltz, 1999). In addition, asynchronous communication is nonnatural in the sense that the immediacy of feedback, prone to face-to-face settings, is not present. Clearly, some support should be provided to help students overcome difficulties in group coordination. Several processes in small group dynamics can indirectly affect coordination and the delicate balance of process gains versus process losses. Group responsibility is proportionally related to group performance (i.e., a greater sense of responsibility can increase group performance), whereas the effects of norms and of status depend on whether these stimulate or impede group performance. Group cohesion has been shown to increase stability, satisfaction, and efficient communication, as well as negative effects such as social pressure, inter- and intragroup aggression or conflict and polarization (Forsyth, 1999). Group cohesion and responsibility are the basis of two key concepts in collaborative learning: positive interdependence (Johnson, 1981) and individual accountability (Slavin, 1980). Positive interdependence refers to the degree to which the performance of a single group member depends on the performance of all other members. Individual accountability refers to the extent to which group members are held individually
198 SMALL GROUP RESEARCH / April 2004
accountable for jobs, tasks, or duties that are central to group performance or efficiency. Because roles promote group cohesion and responsibility (Mudrack & Farrell, 1995), they can be used to foster positive interdependence and individual accountability (Brush, 1998). Roles can be defined as more or less stated functions, duties, or responsibilities that guide individual behavior and regulate intragroup interaction (Hare, 1994). In addition, roles stimulate members’ awareness of the overall group performance and each member’s contribution. “The opinions that others form about one’s contribution to the group effort will likely be influenced, in part, by which roles the focal group members play” (Mudrack & Farrell, 1995, p. 559). The use of roles appears to be most relevant when a group pursues a shared goal that requires a certain level of task division, coordination, and integration of individual activities. Three main categories of roles can be distinguished: individual roles, task roles, and maintenance roles, each of which is composed of several different roles (Mudrack & Farrell, 1995). However, these roles are based on a self-report inventory and pertain to roles that participants can perform during collaboration. Moreover, each participant performs several roles simultaneously, thus making it difficult to implement such roles in educational contexts. Nevertheless, these role descriptions can guide the design of roles for pedagogical purposes. Several pedagogical approaches, developed for cooperative learning, use roles to support coordination and intragroup interaction (Johnson, Johnson, & Johnson-Holubec, 1992; Kagan, 1994). These roles are either based on differences in individual expertise (content-based roles) (cf. Bielaczyc, 2001) or on individual responsibilities regarding group coordination (process-based roles) (cf. Kynigos, 1999). It can be questioned whether content-based roles are actual roles or merely rigid task division. Moreover, most roles developed for cooperative learning settings compose one single job, task, or duty, mainly because they were developed for face-toface collaboration in primary education. Although roles are widely regarded as an effective instructional strategy, in cooperative learn-
Strijbos et al. / FUNCTIONAL ROLES AND GROUP EFFICIENCY 199
ing and in CSCL, their effect has not been investigated systematically in both higher and primary education. If cooperative learning pedagogies, and more specifically roles, were used in higher or in distance education, they were not adapted, although students in these settings vary considerably in (prior) knowledge, experience, and collaboration skills. Moreover, the collaboration assignments in higher or distance education are more complex, they take place over an extended period of time (i.e., not restricted to classroom time), and thus, they require more explicit coordination than in primary or secondary education. Consequently, the previously mentioned uni-dimensional roles for face-to-face collaboration appear inadequate to support collaboration in higher or distance education, let alone asynchronous CSCL settings. Thus, explicit and detailed roles descriptions should be provided. The study reported in this article investigates the impact of from roles that counter process losses from coordination demands. We refer to these roles as functional roles. The roles are based on role descriptions in reports by Mudrack and Farrell (1995), Kagan (1994), and Johnson et al. (1992). In addition, they are adapted for an asynchronous CSCL setting in a higher/distance education context. The main research question can be summarized as the following: What is the effect of a prescribed functional roles instruction, as compared to no instruction, on group performance and collaboration? It is expected that roles will have a positive effect on group performance (grade) and on collaboration (efficiency) and that the amount of coordinative statements will decrease in favor of content-focused statements. The relationship between individual characteristics and group collaboration will be investigated, as well as the suggestion by Mudrack and Farrell (1995) that individual and group perception will be more unanimous in the role condition compared to the nonrole condition. Self-report questionnaires were used to measure students’perceptions of collaboration, and content analysis of communication trans- cripts was used to investigate actual behavior during intragroup collaboration.
200 SMALL GROUP RESEARCH / April 2004
ANALYSIS OF NONINDEPENDENT OBSERVATIONS AND SMALL SAMPLE SIZES
Before we proceed to the analyses and results of the self-report questionnaire data, it is important to note the implications of nonindependent observations with respect to the analysis of intragroup collaboration. This issue was only recently raised in CSCL and small group research. In research on cooperative learning, frequently the ANOVA procedure has been used to investigate the impact of an instructional strategy using individual level observations (see Slavin, 1995). This is no exception in some CSCL studies (Reiserer, Ertl, & Mandl, 2002). However, ANOVA appears not to be suited for this type of data. Stevens (1996) points out that the assumption of independence, between scores of members of the same small group, is violated. Students’ perceptions of group performance depends on all other members’ activities. Violation of independence increases as a function of the interdependence in a group, thus yielding a major increase of a Type 1 error. Stevens (1996) suggest either to test with a stricter level of significance (p < .01 or even p < .001) or to use the group average. Bonito (2002) discusses three alternative procedures that take nonindependence into account, with respect to the analysis of participation in small groups: the actor-partner interdependence model, the social relations model, and multilevel modeling (MLM). Another point is that, unlike a considerable amount of studies in social psychology, CSCL is not conducted in laboratory settings. Its naturalistic context adds to its ecological validity but simultaneously complicates analysis. Most CSCL studies suffer from a relatively small number of participants, and research designs in general do not exceed 20 participants (see Stahl, 2002). Furthermore, quantitative statistical analyses are rarely used. Analysis focuses on qualitative methodologies to explore intragroup interaction and the level of collaboration. MLM appears to be best suited to investigate questionnaire data that consists of self-report perceptions (cf. Bonito, 2002). However, MLM analyses with a small sample size (less than 50) are not often reported. Therefore, the methodological
Strijbos et al. / FUNCTIONAL ROLES AND GROUP EFFICIENCY 201
and analytical considerations will be discussed in more detail in the Method and Results section that covers the MLM analyses. CONTENT ANALYSIS
Analysis of written electronic communication transcripts has gained increased attention in CSCL in the past decade (Hara, Bonk, & Angeli, 2000; Lally & De Laat, 2003). In general, two approaches exist: the quantitative and the qualitative approaches. In the first approach, communication is coded and obtained frequencies and percentages are used in statistical comparisons. The latter deploys techniques such as phenomenography, ethnography, and participant observation techniques to reveal descriptive trends (Miles & Huberman, 1994). Large variations with respect to the unit of analysis exist; it can be a message, paragraph, theme, a unit of meaning, illocution, utterance, statement, sentence, or proposition. Common to all is that the unit is ill defined and arguments for choosing a specific unit lack (Strijbos, Martens, Prins, & Jochems, 2003). Furthermore, although it is acknowledged that reliability for a quantitative content-analysis procedure is essential—and many studies often report an intercoder reliability statistic—reliability is seldom addressed with respect to the unit of analysis (Rourke, Anderson, Garrison, & Archer, 2001). Nevertheless, examples of statistical comparison without any intercoder reliability being provided are not uncommon in CSCL research (Pata & Sarapuu, 2003). However, as Neuendorf (2002) states, “Without the establishment of reliability, content analyses measures are useless” (p. 141). Moreover, if the outcomes are used for statistical comparisons, quantitative content analysis requires that codes are mutually exclusive. Hence, more rigor with respect to reliability of both segmentation in unit of analysis and coding is essential to warrant the accuracy of observations (Strijbos, Martens, Prins, & Jochems, 2003). Irrespective of the segmentation reliability, units should still be meaningful with respect to coding. Or in other words, enable a researcher to answer the research question. We used a sentence or part of a compound
202 SMALL GROUP RESEARCH / April 2004
sentence as the unit of analysis. A procedure to segment transcripts in these units was developed, as was a procedure for coding. The reliability of both procedures and outcome of the analyses will be provided in the Results section. METHOD PARTICIPANTS
At the Open University of the Netherlands (OUNL), 57 students enrolled in a course on policy development (PD) and 23 students in a course in the subject domain of local government (LG). Eighty students enrolled (49 male and 31 female). Their ages ranged from 23 to 67 years (M = 34.4, SD = 9.03). Five students enrolled in both courses. Participants varied considerably in educational and professional background, which is common to higher or distance education. The course was successfully completed by 43 students, of which 33 returned both questionnaires and were included in this study. DESIGN OF STUDY
The study has a quasi-experimental, random, independent groups design. The experimental manipulation involved the introduction of a prescribed role instruction in half of the groups (R groups). The instruction aimed at promoting the coordination and the organization of activities that were essential for the group project, in half of the groups. The other half of the groups was left completely selfreliant regarding organization and coordination of their activities (NR groups). Each group initially consisted of four students, and throughout the course they communicated by e-mail. To assess the effects of roles on performance, group-level grades in both conditions are compared. To investigate the effect of roles on the perceived collaboration, each student’s perception of their team development, group process satisfaction, the task strategy, the level of intragroup conflict, the quality of collaboration, and the usefulness
Strijbos et al. / FUNCTIONAL ROLES AND GROUP EFFICIENCY 203
of e-mail has been measured. Finally, students’ attitudes toward collaboration and computer-mediated communication were measured prior to the course and after successful completion. MATERIALS
Instructions. Half of the groups were instructed to use functional roles: project planner, communicator, editor, and data collector (see Appendix A), the other half received a nondirective instruction (e.g., obvious, unspecific, and general information regarding planning and task division), and they were instructed to rely on their intuition or collaboration experiences (see Appendix B). Students in the R groups had to distribute the roles themselves and exerted their role for the full duration of the course (roles did not rotate). Instructions in both conditions were delivered as a short electronic text at the beginning of the course. They were also presented to students present during a face-to-face meeting at the start of the course. Intake questionnaire. The intake questionnaire consisted of two sections. One section combined several scales addressing individual characteristics such as attitudes, need for closure, and achievement motivation. All items were rated on a 5-point likert-type scale. These scales were all already previously tested, and their reliability ranged from .78 to .86. Reliabilities that will be reported further apply only to this study. Both attitude scales (Clarebout, Elen, & Lowyck, 1999) were reliable and measured at the intake and evaluation: attitude toward computer-mediated communication (intake: α = .78; 8 items) and attitude toward collaborative problem solving (intake: α = .70; 7 items). A scale to assess active or passive orientation to group work (α = .63; 6 items) was constructed and tested prior to this study (Strijbos, 2000). Need-forclosure questionnaire is developed by Kruglanski (cf. De Grada & Kruglanski, 1999), translated into a Dutch version by Cratylus (1994), the version that was used in this study. Need for closure consist of five subscales: need for structure, need for predictability, decisiveness, intolerance for ambiguity, and closed mindedness.
204 SMALL GROUP RESEARCH / April 2004
The subscales need for structure (α = .79; 8 items) and decisiveness (α = .67; 6 items) were sufficiently reliable to be used in further analyses. Achievement motivation (Hermans, 1976) was measured using the achievement subscale (P-scale) of this questionnaire (α = .86; 44 items). Information and communication technology experience was measured through several nonscaled questions adapted from Valcke (1999). Finally, background characteristics (such as received education or training, occupational group, and branch of industry) were collected using a standard OUNL questionnaire. Out of the 80 students that enrolled in the course, 75 students (93.8%) returned the intake questionnaire. The course was successfully completed by 43 students (53.8 %), of which 33 returned both the intake and the evaluation questionnaires (76.7 %). These figures indicate a high dropout rate, but this is not uncommon in a distance-education context (Martens, 1998). Evaluation questionnaire. The evaluation questionnaire consisted of 46 items, belonging to six scales that are rated on a 5-point likert-type scale: attitude toward computer-mediated communication, attitude toward collaborative problem solving, team development, group process satisfaction, intragroup conflict, and task strategy. In addition, students were requested to answer several questions on a 10-point scale (including perceived quality of collaboration and perceived usefulness of e-mail) and about 25 openended questions or opportunities for extended feedback. Results that will be reported in this article are restricted to the six scales, which were already previously tested (reliability ranged from .76 to .92), and to two questions that were rated on 10-point scale: perceived quality of collaboration and perceived usefulness of e-mail for collaboration. Reliabilities that will be reported further apply only to this study. Attitude toward computer-mediated communication in the evaluation had α = .84 (8 items) and attitude toward collaborative problem solving had α = .76 (7 items). Team development (α = .95; 10 items) provides information on perceived level of group cohesion, whereas group process satisfaction (α = .67; 6 items) provides the perceived satisfaction with general group functioning (both cf. Savicki, Kelley, & Lingenfelter, 1996; trans-
Strijbos et al. / FUNCTIONAL ROLES AND GROUP EFFICIENCY 205
lated into Dutch). Intragroup conflict (α = .68; 7 items) provides the perceived level of conflict between group members, and task strategy (α = .86; 8 items) indicates whether students perceive that their group deployed an appropriate strategy for the given task (both cf. Saavedra, Early, & Van Dyne, 1993; translated into Dutch). PROCEDURE
After course registration, students were informed that the research focused on investigating the group processes of students collaborating through e-mail and on determining the suitability of this format in distance education. Two weeks prior to the start of the course, students had to indicate whether they wanted to start with the group assignment in October 2000 or March 2001. Next, students were randomly assigned to groups, and geographical distance between group members was maximized to discourage faceto-face meetings. Prior to collaboration, a face-to-face meeting was organized for all students. A separate meeting was organized for each research condition. General information and the instructions in both conditions were provided during this meeting and electronically afterward. After the meeting, all remaining contact between students was virtual. Role groups were required to inform their supervisor about the assignment of the roles in their group within 2 weeks. Contact with the supervisor was restricted to a single group member in the role condition, whereas students in nonrole groups were all allowed to contact the supervisor. Supervisors were instructed to answer questions that focused on the content of the assignment. Under no circumstance were they to provide support regarding coordination and group management. If a request for support was received, students in the role condition were told to rely on the roles, whereas students in the nonrole condition were told to rely on their intuition or experiences with collaboration. Although students were instructed to use e-mail, it is by no means possible nor feasible to exclude customary communication channels, such as telephone and face-to-face contact. If used, students were requested to send transcripts to all group members to retain
206 SMALL GROUP RESEARCH / April 2004
transparency of communication. During collaboration, the telephone was used occasionally, but most contact was by e-mail. In spite of geographical distance, three groups organized a face-toface meeting. Five students participated in both courses and were placed in the same research condition. This did not pose difficulties in the final analyses. Some groups did not complete the course timely or were excluded from the research because only two group members remained (and thus were no longer included in the research). None of these five students finished both courses. RESULTS INVESTIGATION OF CORRELATIONS BETWEEN INDIVIDUAL CHARACTERISTICS AND DEPENDENT VARIABLES
Pearson correlations were computed to investigate whether the variables measured at the intake could be used as covariates. A correlation matrix was computed. No correlations were found between any of the variables measured on intake. Neither between these constructs and any dependent variables measured at the evaluation, nor between these constructs and grade, were any correlations found. It was concluded that none of the variables from the intake, signifying individual characteristics, could be used as covariates in any of the further analyses. EFFECT OF CONDITION ON GRADE
Grades were administered on a group level. A Mann-Whitney test was performed to investigate the difference between the role (M = 6.6, SD = .89) and nonrole (M = 7.4, SD = .54) conditions. A nondirectional test was performed. No main effect was observed for grade (z = –1.549, df = 4).
Strijbos et al. / FUNCTIONAL ROLES AND GROUP EFFICIENCY 207 TABLE 1: Mean and Standard Deviations of Dependent Variables by Experimental Condition Role (N = 14)
Quality of collaboration Usefulness of e-mail Team development Group process satisfaction Intragroup conflict Task strategy Attitude toward CMC Attitude toward CL
Nonrole (N = 19)
M
SD
M
SD
Min, Max
5.21 5.21 3.53 3.35 2.48 3.10 3.39 3.40
2.78 2.72 0.85 0.76 0.68 0.96 0.71 0.76
5.37 6.53 3.17 3.35 2.68 3.22 3.59 3.53
1.74 2.04 1.04 0.70 0.58 0.76 0.64 0.54
1, 10 1, 10 1, 5 1, 5 1, 5 1, 5 1, 5 1, 5
NOTE: CMC = computer mediated communication; CL = collaborative learning. DESCRIPTIVES AND CORRELATIONS BETWEEN DEPENDENT VARIABLES
Descriptives were computed for both conditions. A considerable spread of scores is indicated by standard deviations, occurring in both conditions (Table 1). Pearson correlations between these variables were computed for the entire sample (N = 33). Medium to high correlations (.45 to .89, p < .01) were found between all of the variables, except for attitude toward CMC and attitude toward CL. To avoid the problem of multiple testing (which will be addressed in more detail when the multilevel (ML) analyses are discussed), principal axis factoring was performed to investigate whether a possible latent variable existed. Table 2 shows the factor loading scores. Usefulness of e-mail attributes less to the common factor than all other variables (Extraction 1); therefore, a second extraction was computed excluding this variable (Extraction 2). The second extraction explains 79% of all common variance between the dependent variables. Based on the Extraction 2, factor scores were computed. The resulting factor can be interpreted as perceived group efficiency (PGE). Standardized factor scores were computed for all variables used in Extraction 2.
208 SMALL GROUP RESEARCH / April 2004 TABLE 2: Factor Extraction for Dependent Variables Factor Loading
Quality of collaboration Team development Group process satisfaction Intragroup conflict Task strategy Usefulness of e-mail
Extraction 1
Extraction 2
.908 .842 .811 –.900 .997 .601
.860 .884 .822 –.907 .989
MULTILEVEL MODELING
Before discussing the outcomes of our multilevel modeling analyses, a more detailed view on our dataset is required. Our sample consists of 10 groups, and the number of observations in each group varies between two and four. This design is skewed (i.e. the number of observations on Levels 1 (group) and 2 (individual) are not balanced (five groups with five observations each 5 × 5, 10 × 10, and so forth). Mok (1995) identifies three basic designs. Our design (Type C in terms of Mok), is less efficient in the so-called random component on both levels; however, ML analyses can be applied. Secondly, our sample size is rather small (N = 33). This has some implications for performing ML analyses, especially with respect to statistical power. Investigating the influence of roles on perceived levels of group efficiency (PGE) suggests the use of a t test or of its equivalent reformulation into an ordinary least squared regression model (OLS). However, OLS regression assumes that the residuals are independent, and this assumption is obviously violated because the scores of students in the same group will be more similar than the scores of students from different groups. Analysis showed the intraclass correlation coefficient, a measure of the dependency between scores within the same group, to be equal to .47. Failure to incorporate this interdependency among scores in a statistical model will lead to an underestimation of the standard errors of model parameters, resulting in a much larger than nominal probability of a Type 1 error (Snijders & Bosker, 1999).
Strijbos et al. / FUNCTIONAL ROLES AND GROUP EFFICIENCY 209 TABLE 3: Random Variance Estimates of the Random Intercept Model Parameter Group-level variance Individual-level variance Deviance = 86.000
Estimate
SE
.465 .526
.285 .155
Instead, a multilevel model (Equation 1) was constructed using CONDITION as a predictor of the dependent variable PGE, yielding a so-called random-intercept model (Snijders & Bosker, 1999): PGEij = y00 + β1 × CONDITIONj + U0j + eij
(1)
The score on PGE of person i in group j is the result of Equation 1, where y00 is a fixed intercept; β1 is the regression coefficient of group-level variable condition; CONDITION is a 0–1 indicator variable with 1 corresponding to a nonrole group; U0j is grouplevel variance; and eij is individual-level variance. Estimation of this model yielded the following fixed parameter values (with corresponding standard errors within parentheses): PGEij = .045 (.362) – .027 (.502) × CONDITION. An overview of the random parameters is provided in Table 3. The deviance reported in this table is equal to minus twice the log-likelihood and can be used for a formal test of the goodness of fit of the model. By comparing this deviance value with the deviance of the model without CONDITION as predictor (the so-called null or empty model), a significance test for CONDITION is provided. The effect of providing roles to group members is shown not to be significant (χ2 = .003, df = 1, p > .05). In general, at this point, no further ML analyses would have to be performed, unless there would be a theoretical ground to assume heteroscedasticity instead of the assumption of homoscedasticity underlying the fixed intercept model. To explain the implication of this assumption, we will briefly discuss model one. This model uses a fixed intercept (y00). This intercept corresponds to the zero (0) group of CONDITION. In each nonrole group, CONDITION is given the value one (1), and a constant of –0.027 is added to the
210 SMALL GROUP RESEARCH / April 2004
fixed intercept. Thus, the fixed intercept for nonrole groups takes a slightly lower value than does that of the role groups. Of course, the PGE score of each individual student depends on that individual’s score and on the group-dependent random effect (U0j). The model assumes that all group-dependent random-effects (U0j) values are taken from a normal distribution with an average of zero and variance σ2U0j and that the variance of U0j is equal for levels of CONDITION. This assumption is known as homoscedasticity. Opposed to homoscedasticity is the assumption of heteroscedasticity: the variance for group-dependent random effects (U0j) is unequal for both levels of CONDITION. Because roles, in theory, are likely to increase individual awareness of group efficiency, a theoretical foundation for the assumption of heteroscedasticity is provided. Heteroscedasticity can be included in a ML model by allowing a random slope—the regression coefficient of CONDITION is allowed to vary in both levels (see Snijders & Bosker, 1999, p. 119): PGEij = y00 + β1j × CONDITIONj + U0j + eij
(2)
In Equation 2, the intercept and the effect of CONDITION are allowed to vary for each group. Equation 2 can be transformed into Equation 3: PGEij = y00 + y10 × CONDITIONj + U0j + U1j × CONDITIONj + eij
(3)
In Equation 3, y00 + y10 × CONDITIONj represents the fixed part and U0j + U1j × CONDITIONj + eij the random part. Analysis of the fixed part of the model yielded the following results: PGE = .056 (.446) + .039 (.515) × CONDITION. Estimations of the random part of the model are provided in Table 4. The residual variance on group level has now been translated in a variance of the intercept (0.805), a variance of the regression slope (zero) and a covariance between values of U0j and of U1j values (–0.305). The estimation of the regression slope variance produced
Strijbos et al. / FUNCTIONAL ROLES AND GROUP EFFICIENCY 211 TABLE 4: Random Variance Estimates of the Random-Slope Model Group Level Parameter Variance intercept Variance slope Covariance slope and intercept
Estimate
SE
.805 .000 –.305
.629 .000 .331 Individual Level
Parameter Variance Deviance = 84.763
Estimate
SE
.518
.153
a value smaller than would be expected on the basis of the withingroup variability, and as a result, the ML-wiN (Version 1.10) program automatically inserts the value zero for this variance. However, in case of a limited number of observations, it is not uncommon that the estimated variance between groups will be small in comparison to the estimated variance within groups. This can be a consequence of the comparatively small power of the test. Thus, a closer look at the data is warranted. We looked at predictions of PGE generated for each group (R = role group, NR = nonrole group), based on, respectively, the model with random slope (RS), parameter (Equation 3), and the model without RS parameter (Equation 1). Results are provided in Table 5 (for descriptives, see Appendix C). If we leave out the RS parameter, predictions of estimates based on PGE become less extreme for the role groups (move closer toward zero), whereas predictions of estimates for the nonrole groups become more extreme (move further from zero). This is caused by the underlying assumption of equal population variances in the model without random slope. Population variance of the role condition is estimated as .82 for the model with random slope and as .62 for the model without random slope. Population variance of the nonrole condition is estimated as .14 with RS and .24 without RS. An F test for the homogeneity of variances was performed to investigate the hypothesis of equality of variances, both for the role
212 SMALL GROUP RESEARCH / April 2004 TABLE 5: PGE Prediction Estimates by Group With and Without Random-Slope Parameters Role Group
Model With RS
Model Without RS
PD 1 PD 2 PD 3 PD 4 LG 1
–.68 1.08 1.00 –.67 –.46
–.60 .92 .88 –.58 –.40
Group
Model With RS
Model without RS
PD 5 PD 6 PD 7 LG 2 LG 3
–.14 .60 .06 .00 –.44
–.19 .77 .08 .00 –.57
Nonrole
NOTE: PGE = perceived group efficiency; RS = random slope; PD = policy development; LG = local government.
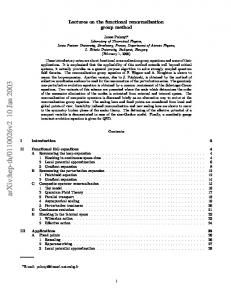
and nonrole groups; ANOVA was used for the model without random slope (F = 2.86, df = 4, p > .10) and for the model with random slope (F = 5.86, df = 4, .05 < p < .10). This difference is graphically represented in Figures 1 and 2. The results suggest to us that the assumption of homogeneity of variances leads to a distortion of a clearly discernable pattern in the data. CONTENT ANALYSIS
Before discussing the outcomes of the content analyses, it must be noted that the data consist of all contributions by all group members of the groups previously included in the MLM analyses, regardless whether they successfully finished the course or returned an evaluation questionnaire. Content analysis was performed on all e-mail messages contributed by 40 subjects equally distributed across research conditions (role and nonrole; N = 5 and n = 20). A segmentation procedure that would be systematic and independent of the coding categories was developed (Strijbos, Martens,
Strijbos et al. / FUNCTIONAL ROLES AND GROUP EFFICIENCY 213
Model estimates for PGE
1,0
,5
0,0
-,5
-1,0 R-groups Figure 1:
NR-groups
Model estimates of PGE Without Random Slope
1,5
Model estimates for PGE
1,0
,5
0,0
-,5 -1,0 R-groups
NR-groups
Figure 2: Model Estimates of PGE With Random Slope NOTE: PGE = perceived group efficiency; R = role; NR = nonrole.
Prins, & Jochems, 2003). Although the sentence as a unit of analysis is not uncommon (e.g. Fahy, Crawford, & Ally, 2001; Hillman, 1999), segmentation of compound sentences was added. The unit
214 SMALL GROUP RESEARCH / April 2004
was defined as a sentence or part of a compound sentence that can be regarded as a meaningful sentence in itself, regardless of coding categories. Punctuation and the word and mark potential segmentation, but this is only performed if both parts before and after the marker are a meaningful sentence. Intercoder reliability of two segmentation trials was .82 and .89 (proportion agreement) and was corroborated by a cross-validation check on an English-language dataset (.87). In addition, a coding scheme was constructed with five main categories—task coordination (TC), task content (TN), task social (TS), nontask (NT), and noncodable (NOC)—and 18 subcategories depicted in Table 6. Reliability on subcategory level (Cohen’s kappa) proved to be, on average, .60 (moderate), and, on main category level, .70 (substantial) (cf. Landis & Koch, 1977). Again, the issue of nonindependence has to be taken into account. For the questionnaire data, it was possible to reduce the number of dependent variables to a single factor to avoid the problem of multiple testing. Principal axis factoring of the five main categories, however, does not result in a factor that can be meaningfully interpreted; therefore, statistical comparisons were restricted to the number of messages, segments, and the frequency for each main category on the level of the group. As ANOVA is not appropriate, the Mann-Whitney test was performed to compare the research conditions (five groups in each condition). Results are depicted in Table 7. No main effect was observed for the amount of messages sent, but a significant difference was observed for the amount of segments (z = 2.402, df = 4, p < .05). Regarding the content of the communication, a main effect was observed in favor of the role condition. Significantly more TC (z = 1.776, df = 4, p < .05; one sided), TN (z = 1.984, df = 4, p < .05), TS (z = 2.121, df= 4, p < .05), and NOC statements (z = 2.619, df = 4, p < .05) were made in the role condition. A one-sided test was performed for TC; it was expected that roles would decrease TC in favor of TN. Finally, a significant positive correlation was found between the amount of TC and TN statements (.73, p < .01). Kendall’s tau was computed, and a correlation plot revealed that most role groups (PD 1-4, LG 1) cluster in
215
TN
TN
TC
TC
TC
TC
TC
TC
TC
Description
All statements with (a) a choice with no reference to time, the group, or individuals; (b) coordination, but time nor activity, is indicated; (c) asking for a reaction but the object is unclear; (d) request a life sign from group members; (e) information on contextual factors that affects individual contribution to group work. TU All types of statements regarding coordination in time, where time is indicated unspecifically. TS All types of statements regarding coordination in time, where time is indicated specifically. AU All types of statements regarding coordination on activity, where the activity is (to be or was) performed by the group. AS All types of statements regarding coordination on activities or division of activities, where it is indicated specifically who will perform that activity (i.e., by persons or by a (sub)group). TAU All types of statements regarding coordination in time and activities or division of activities, where either time, division, or both are indicated unspecifically. TAS All types of statements regarding coordination in time and activities or division of activities, where time and division are both indicated specifically. G All types of statements that concern the general goal, or assessment criteria regarding the group assignment. S All types of statements that concern the content of the task (i.e., analysis of a policy problem) such as questions, comments, requests, providing information, information sources, content issues, discussion of that content, and so forth.
G
Main Sub
Code
TABLE 6: Abbreviated Overview of the Content-Analysis Coding Categories
(continued)
I would like to know who will send me their comments on our report before Wednesday. As agreed, I expect that John Doe will send the analysis on Thursday. The assignment is about the public transport in Amsterdam. I believe that we have a different opinion about the interpretation of the analysis.
I will be on holiday from June 8 until June 26. Who will make an inventory of all pressure groups involved? As far as I know, John Doe will perform the analysis.
I will be in touch again soon.
Why is nobody responding? Please give your ideas.
Example
216 R
All statements that concern the layout, structure, and revision of the policy report.
Description
Example
We should delete section two and check for typing errors in three. TS G All statements that concern general functioning or attitude toward the group, without ref- That is more like it! erence to it or to individuals. TS GR All types of statements concerning group functioning, effort, or attitude toward the I think we as group did a great job in a virgroup, with reference to the group (i.e., use of we, all group members, or everybody). tual project team. TS IN All types of statements concerning an individual’s functioning, effort, or attitude toward John Doe, my compliments for your PERS another individual (i.e., with reference to names, he, she, I, you, they, (sub) Group 1). analysis. I have already met John Doe during the faceNT A All statements that concern the face-to face meeting at the start of the course and statements that concern acquaintance after the meeting (e.g., providing personal background to-face meeting. information). I am still struggling to find out how I am supNT T All statements that concern technical issues (i.e. how to use, problems, evaluative posed to operate Edubox. remarks about computers, e-mail, specific software, and missing or forgotten attachments). NT S All statements with a social orientation that are not related to the assignment (i.e., vaca- How was your holiday in France? tion, Christmas wishes). NT M All statements with an explicit reference to communication with the moderator or in We should ask the moderator if an analysis is which a group discusses the response. useful. NOC All types of statements that do not belong to any category specified (e.g., statements that Attached is a new schedule with the latest signal receipt of a message or attachment). deadlines and tasks. NOTE: Main = main code; Sub = subcode; TC = task coordination; TN = task content; NT = nontask; NOC = noncodable; G = general; TU = time unspecific; TS = time specific; AU = activity unspecific; AS = activity specific; TAU = time and/or activity unspecific; TAS = time and activity specific; S = social or specific; R = revision; GR = group; IN = individual; A = acquaintance; T = technical; M = moderator. See Strijbos, Martens, Prins, and Jochems (2003) for a detailed explanation of subcategories.
TN
Main Sub
Code
TABLE 6: (continued)
Strijbos et al. / FUNCTIONAL ROLES AND GROUP EFFICIENCY 217 TABLE 7: Mean, Standard Deviations, and Mann-Whitney Rank Scores for the Number of Messages, Number of Segments, and the Five Main Categories. Role (N = 20) Item Number of messages Number of segments Task coordination Task content Task social Nontask Noncodable
Nonrole (N = 20)
M
SD
Rank
M
SD
Rank
78.20 759.60 63.95 37.65 4.40 21.40 62.55
22.30 173.04 16.99 17.22 2.73 7.76 13.73
7.2 7.8 7.2 7.4 7.5 7.1 8.0
52.40 401.20 37.35 16.35 1.95 12.55 32.10
17.47 156.12 20.45 16.48 0.48 4.83 10.33
3.8 3.2 3.8 3.6 3.5 3.9 3.0
60 PD 4
Amount of task content (TN) statements
PD 3 50 PD 52 PD 40
30 PD 1 20 LG 1 LG 3 PD 6 PD 7
10 LG 2 0 0
20
40
60
80
100
Amount of task coordination (TC) statements
Figure 3:
Correlation of Task Coordination and Task Content Statements per Group NOTE: PD = policy development; LG = local government.
the upper right quadrant, whereas most nonrole groups (PD 5-7, LG 2-3) cluster in the lower left quadrant (see Figure 3). SUMMARY OF RESULTS
A Mann-Whitney test revealed no main effect of roles regarding grade. Examination of Pearson correlates revealed significantly
218 SMALL GROUP RESEARCH / April 2004
high, positive correlations between several variables that measured group functioning. Principal axis factoring was performed on the remaining dependent variables, and one factor was extracted. The factor was interpreted as the level of PGE. Next, multilevel analyses were performed. The intraclass correlation was regarded to be substantial enough to indicate the use of a multilevel model. Subsequent analyses revealed no difference between the role and nonrole condition regarding PGE using a fixed- or random-slope model. However, when the estimates of a model with random-slope parameters were compared to a model without random-slope parameters, a tendency was observed revealing a difference regarding the assumptions of homogeneity. Content analysis was performed on the e-mail communication that took place in the groups that were included in the multilevel analysis. All messages were divided in units of analysis and subsequently coded with one of five main categories. A Mann-Whitney test revealed more segments coded as TC, TN, TS, and NOC statements in the role condition. Finally, a significantly high, positive correlation was observed between TC and TN statements. DISCUSSION
In this study, the impact of functional roles, adapted for a computer-mediated context in a distance-education setting, was investigated. Such functional roles can be easily generalized to other content domains. The main research question was summarized as the following: What is the effect of a prescribed functional roles instruction, as compared to no instruction, on group performance and on collaboration? Roles did not affect group performance in terms of a group grade. However, this may primarily be due to the lack of variation (grades varied between 6 and 8.5 on a 10-point scale). Some groups were given the opportunity to revise the report that they had submitted for grading, which of course decreased the variance in the final grades. Whether the group performed well or poorly, the effect of
Strijbos et al. / FUNCTIONAL ROLES AND GROUP EFFICIENCY 219
the roles is better reflected by their self-report evaluation of perceived group efficiency. The MLM technique proved fruitful and showed that roles appear to affect the perceived level of group efficiency (i.e., to increase students’ awareness of intragroup interaction and collaboration). In the nonrole condition, participants appear to be less aware of these processes. The outcome of the content analysis corroborates this interpretation, as a significant difference was observed with respect to TS statements. Students in the role condition contributed more statements that expressed either a positive or negative evaluation or attitude in general toward the group or toward an individual group member. Furthermore, as hypothesized, more TN statements were observed in the role condition. However, the assumption that this would be because of a decrease in the amount of coordinative statements was not confirmed. In fact, in the role condition, the amount of coordinative statements also increased. Apparently, roles stimulated coordination, and as a result, TN statements increased as well. Students in the role condition contributed more TN and TC statements, as compared to students in the nonrole condition. In this study, the MLM analyses reveal that the functional roles appear to have stimulated the PGE, and the content analyses reflect that the functional roles stimulated the amount of coordinationand content-focused statements through cohesion (positive interdependence) and responsibility (individual accountability). The outcomes of the MLM analysis indicates that the groups in the role condition appear to be more susceptible to intragroup conflict and/ or to drop out. In the nonrole condition, the lack of interdependence or responsibility appears to have less detrimental effects on intragroup conflict and/or drop out. Perhaps their self-reliance provided nonrole groups with higher flexibility to cope with changes in the organization and in coordination of activities. Another possible explanation is that the descriptions of the functional roles were not sufficient to guide collaboration. The outcomes of the content analyses, however, clearly indicate that roles stimulated collaboration, expressed in more TC and TN statements.
220 SMALL GROUP RESEARCH / April 2004
We are confident to recommend the MLM technique, although it is not frequently used with small sample sizes. Nevertheless, it provides new possibilities for the analysis of nonindependent questionnaire data. The results, however, must be treated with some caution. This study was conducted in a setting of high ecological validity, but it is imperative to investigate natural collaborating groups in an educational setting—hence, the sample size is very likely to be small as it depends on the number of students that register for a course. Because many external sources that can potentially influence outcomes were beyond control, and because of the small sample size, it can be argued that a significance level of .05 < p < .10 is justified. In addition, perceptions in the nonrole condition are also affected by so-called free riders (i.e., group members that abstain from any effort to participate in collaboration), but these members tend to rate their perception of collaboration as a very positive one. Nevertheless, the interpretation of the MLM results should be kept in perspective. This favors the interpretation of these results as a marginal effect or as a tendency toward differences between the role and nonrole conditions. Following the suggestions by Mudrack and Farrell (1995), the role condition can be seen as a strong situation “in which most individuals will behave in similar ways. . . . There are clear expectations about appropriate behaviours and adequate incentives for these behaviours exist” (pp. 566567), whereas the nonrole condition is seen to reflect a weak situation that “is characterised by some ambiguity, and the definition of appropriate behaviours is more open to interpretation” (p. 567). Because of the ecological setting, the results may have been confounded by lack of clarity about time schedules, a lack of communication discipline, or a lack of externalization of expectations and norms regarding effort and input of group members prior to collaboration. It was confirmed that the Netherlands is a small country, as three groups organized a face-to-face meeting. After reviewing open-ended questions in the evaluation, it was concluded that the confounding effect of these meetings on the overall collaboration could be regarded as minimal.
Strijbos et al. / FUNCTIONAL ROLES AND GROUP EFFICIENCY 221
The reported data will be extended with a follow-up study in which, apart from the use of functional roles, the need for a time schedule, communication discipline, and expectations regarding input of group members are externalized prior to collaboration (currently these data are being analyzed). In the near future, it is planned to investigate other probable causes for PGE differences between groups in the role condition, such as role conflict and role ambiguity, and the efficiency of roles that may have spontaneously emerged in nonrole groups through group members’ previous collaboration experiences. It is clear that more systematic research regarding the use of functional roles in small groups and in CSCL is needed.
APPENDIX A Functional Roles Instruction Experience has revealed that roles can afford the work organization and communication between team members. Each member of the team is to exert one of these four roles: project planner, communicator, editor, or data collector. Project Planner Responsibility: project planning and project progress monitoring. Activities: • You are responsible for recording all activities to be performed and
associated deadlines;
• You will supervise these to make sure that all team members
comply;
• You will make an inventory about the group’s progress on a regular
basis, and you will communicate the outcome to the other team members; • You will stimulate active participation of all team members to the report;
222 SMALL GROUP RESEARCH / April 2004
• You are required to set up an agenda for discussion (Which aspects
need to be discussed, Which aspects have priority), make an inventory of discussion topics suggested by team members, and you will compose an overview of all suggestions and decisions taken; • You will initiate (and stimulate) discussion of the literature sources extracted from the database and additional information sources that your team has obtained (Which information sources are relevant?, How can certain information be used in the final report?); and • In case team members prefer to distribute literature sources extracted from the database or additional sources (for instance, the Internet), you are required—in collaboration with the team member that performs the role of data collector—to plan this distribution. Communicator Responsibility: communication with supervisor and progress reports. Activities: • Your supervisor will only contact the team member that performs • •
• • • •
•
this role, not the other team members. The e-mail address of your supervisor is ( . . . ); You will communicate the distribution of roles in your team to your supervisor; You are responsible to make an inventory of questions and problems that team members experience during the assignment and for communicating these to your supervisor and his or her answer to the remaining team members; You will construct an archive on the discussion of the literature, differences between perspectives, knowledge domains, and various theories that are introduced and discussed; You will construct an archive of the various versions of the report; You will initiate (and stimulate) discussion of the comments suggested by team members and changes made to the report; Every two weeks you will prepare a short progress report (half a page) that contains the most important decisions and/or developments. You will e-mail this progress report to your supervisor to keep him or her informed about the progress of your team; and You are responsible for submitting your team’s report to your supervisor.
Strijbos et al. / FUNCTIONAL ROLES AND GROUP EFFICIENCY 223
Editor Responsibility: editing the input from all team members into a shared report. Activities: • You will edit the input from all team members into a draft version of
the report and distribute it among team members. They are required to respond to this draft within a timeline that you have specified (for example, 5 days) with comments, questions, reformulations, additional information, and text formulation; and • You will revise each draft according to comments provided by team members. You will distribute the next version among team members with another request for comments and suggestions. Data collector Responsibility: inventory of the literature database and gathering of additional information. Activities: • You will make an inventory of the literature database that was pro-
vided. Based on this inventory, you will indicate about those aspects for which sufficient or relevant knowledge or information lacks. You will distribute this inventory and analysis among team members with a request for suggestions for additional literature; • Based on all comments and suggestions by team members on your inventory, you will adapt the list according to their suggestions; either from the literature database or additional information sources, such as library or Internet sources; and • You are responsible for providing the additional information sources to your other team members, and/or distributing these sources among team members for further study—in collaboration with the team member that performs the role of project planner.
224 SMALL GROUP RESEARCH / April 2004
APPENDIX B Nonrole Instruction You and your team members decide how you are going to work on the assignment. The timely completion of the policy report is the responsibility of your team. Below are some general guidelines on how you can proceed. It might be useful to pay attention to planning of activities and/or division of tasks. Planning: Differences in study pace can lead to irritation; for example, some students have a slower pace than others and may feel stressed by a higher pace. Also, it might be useful to pay attention to holidays; some students study during holidays and some do not. You might use a general planning or a planning that specifies parts of the assignment. Task division: It might be useful to make arrangements about each team member’s activities. This can either be general or specific. Is everybody going to do all tasks individually, or will the assignment be split in separate activities (one member collects data, one member writes), or will each task be divided in smaller parts between team members (one member collects data on X, one member collects data on Y)?
225
3.33 3.67 2.97 2.89 3.05 2.42 3.12 3.05
Quality of collaboration Usability of e-mail Team development Group process satisfaction Intragroup conflict Task strategy Attitude toward CMC Attitude toward CL
1.53 1.53 1.10 0.19 0.29 0.38 1.30 1.07
SD
Quality of collaboration Usability of e-mail Team development Group process satisfaction Intragroup conflict Task strategy Attitude toward CMC Attitude toward CL
SD 1.50 1.50 1.15 1.01 0.37 0.62 0.56 0.27
0.71 2.12 0.21 0.47 0.30 0.18 1.06 0.10
SD
7.00 7.25 4.00 3.87 1.85 3.93 3.87 3.82
M 0.00 1.71 0.00 0.52 0.26 0.16 0.52 0.39
SD
PD 6 (N = 4)
7.50 7.50 4.35 4.00 1.93 4.37 3.25 3.92
M
PD 2 (N = 2) 0.58 0.58 0.23 0.42 0.14 0.37 0.29 0.43
SD
5.67 7.33 3.23 3.44 2.76 3.33 3.42 3.48
M
2.31 1.15 1.19 0.58 0.79 0.97 0.56 0.54
SD
PD 7 (N = 3)
Nonrole Condition
8.67 8.33 4.33 4.27 1.57 4.12 3.45 4.05
M
PD 3 (N = 3) 2.08 2.65 0.57 0.44 0.21 0.40 0.75 0.82
SD
5.50 6.50 3.30 3.54 2.85 3.25 3.50 3.00
M
1.00 0.58 0.88 0.67 0.35 0.70 0.37 0.00
SD
LG 2 (N = 4)
3.33 3.00 3.16 2.67 3.05 2.41 3.41 3.09
M
PD 4 (N = 3)
NOTE: PD = policy development; LG = local government; CMC = computer-mediated communication; CL = collaborative learning.
M 4.75 5.25 3.22 3.12 2.92 3.00 4.06 3.92
Item
PD 5 (N = 4)
M
Item
PD 1 (N = 3)
Role Condition
APPENDIX C Mean and Standard Deviation for Dependent Variables by Condition and by Group.
2.65 2.08 0.72 0.67 0.54 0.67 0.31 0.58
SD
5.37 6.50 2.05 2.79 3.00 3.59 3.03 3.39
M
1.74 3.87 0.83 0.28 0.35 0.79 0.82 0.80
SD
LG 3 (N = 4)
4.00 4.33 3.10 3.11 2.62 2.57 3.67 3.05
M
LG 1 (N = 3)
226 SMALL GROUP RESEARCH / April 2004
REFERENCES Baker, M. J., & Lund, K. (1997). Promoting reflective interactions in a computer-supported collaborative learning environment. Journal of Computer Assisted Learning, 13, 175193. Benbunan-Fich, R., & Hiltz, S. R. (1999). Impacts of asynchronous learning networks on individual and group problem solving: A field experiment. Group decision and Negotiation, 8, 409-426. Bielaczyc, K. (2001). Designing social infrastructure: The challenge of building computersupported learning communities. In P. Dillenbourg, A. Eurelings, & K. Hakkarainen (Eds.), European perspectives on computer-supported collaborative learning: Proceedings of the 1st European conference on computer-supported collaborative learning (pp. 106-114). Maastricht, the Netherlands: University of Maastricht. Bonito, J. A. (2002). The analysis of participation in small groups: Methodological and conceptual issues related to interdependence. Small Group Research, 33, 412-438. Brush, T. A. (1998). Embedding cooperative learning into the design of integrated learning systems: Rationale and guidelines. Educational Technology Research & Development, 46, 5-18. Centre for Multilevel Modelling. (2003). ML-wiN (Version 1.10) [Computer software]. London: Institute of Education, Centre for Multilevel Modelling. Clarebout, G., Elen, J., & Lowyck, J. (1999, August). An invasion in the classroom: Influence on instructional and epistemological beliefs. Paper presented at the 8th biannual conference of the European Association of Research on Learning and Instruction (EARLI), Göteborg, Sweden. Cratylus. (1994). Need for closure (Dutch version). Amsterdam: Vrije Universiteit, Department of Social Psychology. De Grada, E., & Kruglanski, A. W. (1999). Motivated cognition and group interaction: Need for closure affects the contents and processes of collective negotiation. Journal of Experimental Social Psychology, 35, 346-365. Fahy, P. J., Crawford, G., & Ally, M. (2001). Patterns of interaction in a computer conference transcript. International Review of Research in Open and Distance Learning. Retrieved July 25, 2003, from http://www.irrodl.org/content/v2.1/fahy.html Forsyth, D. R. (1999). Group dynamics (3rd ed.). Belmont, CA: Wadsworth. Häkkinen, P., Järvelä, S., & Byman, A. (2001). Sharing and making perspectives in web-based conferencing. In P. Dillenbourg, A. Eurelings, & K. Hakkarainen (Eds.), European perspectives on computer-supported collaborative learning: Proceedings of the 1st European conference on computer-supported collaborative learning (pp. 285-292). Maastricht, the Netherlands: University of Maastricht. Hara, N., Bonk, C. J., & Angeli, C. (2000). Content analysis of online discussion in an applied educational psychology course. Instructional Science, 28, 115-152. Hare, A. P. (1994). Types of roles in small groups: A bit of history and a current perspective. Small Group Research, 25, 443-448. Hermans, H. J. M. (1976). PMT: Prestatie motivatie test handleiding [Achievement motivation questionnaire manual]. Amsterdam: Swets & Zeitlinger. Hillman, D. C. A. (1999). A new method for analyzing patterns of interaction. The American Journal of Distance Education, 13(2), 37-47.
Strijbos et al. / FUNCTIONAL ROLES AND GROUP EFFICIENCY 227 Johnson, D. W. (1981). Student-student interaction: The neglected variable in education. Educational Researcher, 10, 5-10. Johnson, D. W., Johnson, R. T., & Johnson-Holubec, E. (1992). Advanced cooperative learning. Edina, MN: Interaction Book Company. Jonassen, D. H., & Kwon, H. I. (2001). Communication patterns in computer mediated and face-to-face group problem solving. Educational Technology Research & Development, 49, 35-51. Kagan, S. (1994). Cooperative learning. San Juan Capistrano, CA: Kagan Cooperative Learning. Koschmann, T. (1996). Paradigm shifts and instructional technology: An introduction. In T. Koschmann (Ed.), CSCL: Theory and practice of an emerging paradigm (pp. 1-23). Hillsdale, NJ: Lawrence Erlbaum. Kreijns, K., Kirschner, P. A., & Jochems, W. M. G. (2003). Identifying the pitfalls for social interaction in computer-supported collaborative learning environments: A review of the research. Computers in Human Behaviour, 19, 335-353. Kynigos, C. (1999). Perspectives in analysing classroom interaction data on collaborative computer-based mathematical projects. In C. Hoadley & J. Roschelle (Eds.), Computer support for collaborative learning (CSCL) 1999 (pp. 333-340). Palo Alto, CA: Stanford University. Lally, V., & De Laat, M. (2003). Complexity, theory and praxis: Researching collaborative learning and tutoring processes in a networked learning community. Instructional Science, 31, 7-39. Landis, J., & Koch, G. (1977). The measurement of observer agreement for categorical data. Biometrics, 33, 159-174. Lehtinen, E., Hakkarainen, K., Lipponen, L., Rahikainen, M., & Muukkonen, H. (1999). Computer supported collaborative learning: A review of research and development (The J.H.G.I. Giesbers Reports on Education No. 10). Nijmegen, the Netherlands: University of Nijmegen, Department of Educational Sciences. Lipponen, L. (2001). Computer-supported collaborative learning: From promises to reality. Unpublished doctoral dissertation (Series B, Humaniora, 245). University of Turku, Turku, Finland. Martens, R. L. (1998). The use and effects of embedded support devices in independent learning. Doctoral dissertation, Utrecht, the Netherlands: Lemma. Miles, M. B., & Huberman, A. M. (1994). Qualitative data analysis: An expanded sourcebook. London: Sage. Mok, M. (1995). Sample size requirements for 2-level designs in educational research. Multilevel Modelling Newsletter, 7(2), 11-15. Retrieved May 17, 2002, from http:// multilevel.ioe.ac.uk/publref/new7-2.pdf Mudrack, P. E., & Farrell, G. M. (1995). An examination of functional role behaviour and its consequences for individuals in group settings. Small Group Research, 26, 542-571. Neuendorf, K. A. (2002). The content analysis guidebook. Thousand Oaks, CA: Sage. Pata, K., & Sarapuu, T. (2003). Framework for scaffolding the development of problem based representations by collaborative design. In B. Wasson, S. Ludvigsen, & U. Hoppe (Eds.), Designing for change (pp. 189-198). Dordrecht, the Netherlands: Kluwer Academic Publishers. Reiserer, M., Ertl, B., & Mandl, H. (2002). Fostering collaborative knowledge construction in desktop videoconferencing: Effects of content schemes and cooperation scripts in peer teaching settings [Electronic version]. In G. Stahl (Ed.), Computer support for col-
228 SMALL GROUP RESEARCH / April 2004 laborative learning: Foundations for a CSCL community (pp. 379-388). Hillsdale, NJ: Lawrence Erlbaum. Rourke, L., Anderson, T., Garrison, D. R., & Archer, W. (2001). Methodological issues in the content analysis of computer conference transcripts. International Journal of Artificial Intelligence in Education, 12, 8-22. Ryser, G. R., Beeler, J. E., & McKenzie, C. M. (1995). Effects of a computer-supported intentional learning environment (CSILE) on students’ self-concept, self-regulatory behaviour, and critical thinking ability. Journal of Educational Computing Research, 13, 375385. Saavedra, R., Early, P. C., & Van Dyne, L. (1993). Complex interdependence in task-performing groups. Journal of Applied Psychology, 78, 61-72. Savicki, V., Kelley, M., & Lingenfelter, D. (1996). Gender, group composition, and task type in small task groups using computer-mediated communication. Computers in Human Behaviour, 12, 549-565. Schellens, T., & Valcke, M. (2002). Asynchrone discussiegroepen: Een onderzoek naar de invloed op cognitieve kennisverwerving [Asynchronous discussion groups: Investigating the influence on cognitive knowledge gain]. Pedagogische Studieën, 79, 451-468. Shaw, M. E. (1981). Group dynamics: The psychology of small group behaviour (3rd ed.). New York: McGraw-Hill. Slavin, R. E. (1980). Cooperative learning in teams: State of the art. Educational Psychologist, 15, 93-111. Slavin, R. E. (1995). Cooperative learning: Theory, research and practice (2nd ed.). Boston: Allyn & Bacon. Snijders, T. A. B., & Bosker, R. J. (1999). Multilevel analysis. Londen: Sage. Stahl, G. (Ed.). (2002). Computer support for collaborative learning: Foundations for a CSCL community [Electronic version]. Hillsdale, NJ: Lawrence Erlbaum. Stevens, J. (1996). Applied multivariate statistics for the social sciences (3rd ed.). Hillsdale, NJ: Lawrence Erlbaum. Strijbos, J. W. (2000). Vragenlijst samenwerkingsoriëntatie [Questionnaire collaboration orientation]. Heerlen, the Netherlands: Open Universiteit Nederland. Strijbos, J. W., & Martens, R. L. (2001). Group-based learning: Dynamic interaction in groups. In P. Dillenbourg, A. Eurelings, & K. Hakkarainen (Eds.), European perspectives on computer-supported collaborative learning: Proceedings of the 1st European conference on computer-supported collaborative learning (pp. 569-576). Maastricht, the Netherlands: University of Maastricht. Strijbos, J. W., Martens, R. L., & Jochems, W. M. G. (in press). Designing for interaction: Six steps to designing computer-supported group-based learning. Computers & Education. Strijbos, J. W., Martens, R. L., Prins, F. J., & Jochems, W. M. G. (2003). Content analysis: What are they talking about? Manuscript submitted for publication. Suthers, D. D., & Hundhausen, C. D. (2002). The effects of representations in students elaboration in collaborative inquiry [Electronic version]. In G. Stahl (Ed.), Computer support for collaborative learning: Foundations for a CSCL community (pp. 472-480). Hillsdale, NJ: Lawrence Erlbaum. Valcke, M. (1999). Educational re-design of courses to support large groups of university students by building upon the potential of ICT. The Journal for the integrated study of artificial intelligence, cognitive science and applied epistemology, 16, 16-25.
Strijbos et al. / FUNCTIONAL ROLES AND GROUP EFFICIENCY 229 Wood, D. (2001, March 23). Contingent tutoring and computer based training. Keynote presented at the 1st European conference on computer-supported collaborative learning, Maastricht, the Netherlands.
Jan-Willem Strijbos is a Ph.D. candidate at the Educational Technology Expertise Center (OTEC) of the Open University of the Netherlands. He received his M.A. on educational psychology with a specific focus on small group dynamics in education at the University of Nijmegen in the Netherlands. Rob L. Martens is an associate professor at the Educational Technology Expertise Center (OTEC) of the Open University of the Netherlands. He received his Ph.D. from the Open University of the Netherlands in 1998. His research focuses on motivation and e-learning. Wim M. G. Jochems is a full professor in educational technology and general director of the Educational Technology Expertise Centre (OTEC) at the Open University of the Netherlands. He received his Ph.D. from Delft University of Technology in 1980. His research focuses on the implementation of educational technology in higher education. Nick J. Broers is an assistant professor of methodology and statistics at the University of Maastricht. He received his Ph.D. from the University of Nijmegen in 1994. His main interest concerns research in statistics education.