metals Article
The Effect of Initial Structure on Phase Transformation in Continuous Heating of a TA15 Titanium Alloy Xiaoguang Fan *, Qi Li, Anming Zhao, Yuguo Shi and Wenjia Mei State Key Laboratory of Solidification Processing, School of Materials Science and Engineering, Northwestern Polytechnical University, Xi’an 710072, China;
[email protected] (Q.L.);
[email protected] (A.Z.);
[email protected] (Y.S.);
[email protected] (W.M.) * Correspondence:
[email protected]; Tel.: +86-029-8846-0212 Academic Editor: Mark T. Whittaker Received: 20 April 2017; Accepted: 23 May 2017; Published: 1 June 2017
Abstract: The effect of initial structure on phase evolution in continuous heating of a near-α TA15 titanium alloy (Ti-6Al-2Zr-1Mo-1V) was experimentally investigated. To this end; three microstructures were obtained by multiple heat treatment: I-bimodal structure with 50% equaixed α, II-bimodal structure with 15% equiaxed α, III-trimodal structure with 18% equiaxed α and 25% lamellar α. Differential scanning calorimetry (DSC), dilatometry and quantitative metallography were carried out on specimens with the three initial structures at heating rates from 5 to 40 ◦ C/min. The transformation kinetics was modeled with the Johnson–Mehl–Avrami (JMA) approach under non-isothermal condition. It was found that there exists a four-stage transformation for microstructures I and III. The secondary and third stages overlap for microstructure II. The four stages of phase transformation overlap with increasing heating rate. In the presence of α laths, the phase transformation kinetics is affected by the composition difference between lamellar α and primary equiaxed α. Phase transformation is controlled by the growth of existing large β phase. Keywords: titanium alloy; phase transformation; microstructure; DSC; dilatometry
1. Introduction Titanium alloys have been gaining more applications in many industry fields due to the high specific strength, good thermal stability and excellent corrosion resistance [1]. The near-α TA15 titanium alloy which has moderate strength up to 400 ◦ C, excellent thermal stability, good weldability and low growth rate of fatigue crack has been widely used to manufacture structural components in airplanes. The mechanical properties of the titanium alloy are largely dependent on the microstructure [1–3]. The equiaxed and bimodal structures are commonly used for traditional α + β titanium alloys due to a balance in strength, ductility, creep and fatigue resistance (Table 1). The trimodal structure which consists of 10–20% equiaxed α, 30–50% lamellar α and transformed β matrix may also be required after secondary working due to its superior low-cycle fatigue resistance [4]. The diversity in microstructure results from the α-β phase transformation along with deformation induced morphology evolution. Thus, the microstructure can be modulated by optimizing hot working parameters (e.g., heating rate, heating path, heating temperature, strain, strain rate and cooling path). The phase evolution in hot working involves the α-to-β transformation in heating, the β-to-α transformation in cooling as well as the stress induced transformation during deformation. Numerous researches have been carried out on the phase transformation in cooling. Tang et al. [5] and Sun et al. [6] found that the α lamellae can nucleate in a sympathetic way or by interface instability during slow cooling. He et al. [7] examine the orientation relationship between α and β phase after β working
Metals 2017, 7, 200; doi:10.3390/met7060200
www.mdpi.com/journal/metals
Metals 2017, 7, 200
2 of 12
and found that the Burger’s orientation relationship is strictly obeyed. Though deformation has little influence on the orientation relationship, the deformation induced texture can result in variation selection and causes a strong texture of β phase [8]. Kherrouba et al. [9] examined the transformation kinetics of Ti-6Al-4V alloy by Johnson–Mehl–Avrami (JMA) model and suggested that growth of β lamellae may be controlled by the combination of solute diffusion and interface migration. The applied stress in machining and deformation can also cause phase transformation. Liu et al. [10] found that can trigger the formation of ω phase can be triggered even before plastic deformation. Jonas et al. [11] reported that dynamic transformation from α to β occurs in hot deformation of several titanium alloys, resulting in significant flow softening during deformation. Table 1. The mechanical properties of different microstructures for TA15 titanium alloy (compared to equiaxed structure). Microstructure Bimodal Trimodal
Yield Strength
Elongation
Fracture Toughness
Creep Strength
HCF Strength
LCF Strength
++ +
−/o −/o
+ +
+ +
+/o +
+ ++
From the point of microstructure control, the phase transformation in heating is as important as that in cooling and deformation. Wang et al. [12] used the dilatometry to investigate phase evolution in a TC21 alloy during continuous heating. They found that the phase transformation includes three stages, residual β → acicular α, acicular α → β and equiaxed α → β. The activation energy for α → β transformation was also estimated with the classical JMA equation. A similar transformation behavior was also reported for Ti-6Al-4V alloy by Sha and Guo [13]. Barriobero-Vila et al. [14] examined the element partitioning and related phase transformation kinetics in heating of a bimodal Ti-6Al-6V-2Sn alloy by in-situ high energy synchrotron X-ray diffraction. They found that partitioning of solutes leads to nonlinear variation of the lattice parameters of the β phase. Elmer et al. [15] examined the phase transition during welding of a Ti-6Al-4V alloy. They found that a large superheat is necessary for the completion of α-to-β transformation due to the high heating rate. The overall transformation mechanism may be diverse because the starting assumption determines the calculated parameters in JMA equation. Guo et al. [16] investigated the microstructural developments by deformation induced temperature rise in TA15 titanium alloy. A diffusion model was developed to depict the variation of particle size and volume fraction of equiaxed α under different heating rates. Chen et al. [17] investigated the phase transformation in continuous heating of a near-β titanium alloy. The phase transformation sequence and dominate mechanism were determined. The transformation kinetics and microstructural development in heating are not only dependent on the heating rate, but also greatly affected by the microstructure prior to heating, which needs further investigation. In this work, the effect of initial structure on the phase evolution in continuous heating of TA15 titanium alloy was investigated. To this end, multiple heat treatments were employed to obtain three different microstructures from a wrought billet. The phase transformation process was determined by metallographic observation, differential scanning calorimetry (DSC) and dilatometry. The microstructure evolution under different heating rate and initial structures was studied. The effect of initial structure on phase transformation kinetics was also measured. The results can be used for quantative control of phase constitution in hot working. 2. Material and Procedures 2.1. Material The as-received TA15 titanium alloy was a 1000 mm × 400 mm × 100 mm hot forged bar produced by western superconducting technologies Co., Xi’an, China. The chemical composition of the alloy was measured to be 6.69Al, 2.25Zr, 1.77Mo, 2.25V, 0.14Fe, 0.12O, 0.002H and balanced Ti (wt %) by
Metals 2017, 7, 200
3 of 12
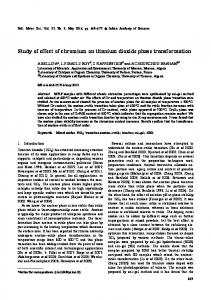
wet chemical analysis. The β transus temperature was determined to be 985 ◦ C by metallography. Metals 2017, 7, 200 3 of 12 50% The as-received material was annealed at 820 ◦ C to obtain a bimodal structure consisting of about equiaxed α within transformed β matrix (microstructure I, Figure 1a). The measured fraction and 50% equiaxed α within transformed β matrix (microstructure I, Figure 1a). The measured fraction particle size of the equiaxed α are about 0.5 and 12.5 µm, respectively. and particle size of the equiaxed α are about 0.5 and 12.5 μm, respectively. Two Two otherother microstructures were obtained by by heat treatments from microstructures were obtained heat treatments frommicrostructure microstructureI.I.Specimen Specimen with ◦ ◦ initially I was heated at the rate 10 ofC/min up up to 970 held withmicrostructure initially microstructure I was heated at theofrate 10 °C/min to 970C,°C, heldfor for30 30min minand and then cooled in the air to get a bimodal structure composed of about 15% equiaxed α within transformed β then cooled in the air to get a bimodal structure composed of about 15% equiaxed α within matrix (microstructure II,(microstructure Figure 1b). The of equiaxed decreased about 9.5 transformed β matrix II, grain Figuresize 1b). The grain sizeαofphases equiaxed α phases to decreased to µm. about 9.5 the μm.trimodal structure can be obtained by a near β hot working and a subsequent heat Usually, can be obtained by near a nearββregion hot working a subsequent heat of treatmentUsually, in the αthe + trimodal β region.structure The hot working in the aims and to control the fraction treatment in the α + β region. The hot working in the near β region aims to control the fraction of equiaxed α. The subsequent heat treatment produces the α lamellae. Thus, the material with bimodal equiaxed α. The subsequent heat treatment produces the α lamellae. Thus, the material with bimodal ◦ structure was reheated to 940 C and air cooled to obtain the trimodal structure (microstructure structure was reheated to 940 °C and air cooled to obtain the trimodal structure (microstructure III, III, Figure 1c). The volume fraction of primary equiaxed and lamellar α were about 18% and Figure 1c). The volume fraction of primary equiaxed and lamellar α were about 18% and 25%, 25%, respectively. respectively.
(a)
(b)
(c)
Figure 1. Optical microscopy images of the microstructures prior to heating: (a) microstructure I; (b)
Figure 1. Optical microscopy images of the microstructures prior to heating: (a) microstructure I; microstructure II; (c) microstructure III. (b) microstructure II; (c) microstructure III.
2.2. Metallographic Examination
2.2. Metallographic Examination
The φ 10 mm × 10 mm cylinder specimens were heated at the rates of 5 and 10 °C/min to the
The φ 10 mm × 10 mm specimens at thequenched rates of 5toand 10 ◦ C/min preset temperatures withcylinder a resistance furnace,were and heated then water freeze the highto the microstructure. The specimen with glass lubricant to prevent oxidation at presettemperature temperatures with a resistance furnace,was andcoated then water quenched to freeze the high temperature high temperature. The selected quenching were 750, oxidation 800, 860, 900, 940, temperature. 970 and microstructure. The specimen was coated withtemperatures glass lubricant to700, prevent at high 1100 °C.quenching The specimens were electrical mechanical grinded The selected temperatures weredischarge 700, 750,cut, 800, 860, 900, 940, 970 and andpolished, 1100 ◦ C. and Theetched specimens in a solution of 13% HNO 3, 7% HF and 80% H2O. Micrographs were taken on a LECIA DMI3000 were electrical discharge cut, mechanical grinded and polished, and etched in a solution of 13% microscope (LECIA, Shanghai, China). Moreover, the fine secondary lamellar α phases were HNO3 , 7% HF and 80% H2 O. Micrographs were taken on a LECIA DMI3000 microscope (LECIA, examined using a scanning electron microscopy TESCAN VEGA3 LMU (TESCAN, Shanghai, China). Shanghai, China). Moreover, the fine secondary lamellar α phases were examined using a scanning The volume fraction and size of the α phase were determined by image-pro plus software. The electron microscopy TESCAN (TESCAN, Shanghai, fraction fraction of the α phase was VEGA3 measuredLMU by the ratio of the area of α China). phase toThe the volume overall area on a and size of the α phase were determined by image-pro plus software. The fraction of the α phase micrograph. The Optical microscopy micrographs at 1000 times magnification were used to measure was measured by the of ratio of the area α phase to the overall area on a(SEM, micrograph. The Optical microscopy the fraction equiaxed α (f1of ). Scanning electronic microscopy TESCAN, Shanghai, China) images atat5000 magnification were employed measurethe thefraction fraction of equiaxed α lamellaeαin(fβ1 ). matrix micrographs 1000times times magnification were used totomeasure Scanning (f 2 ). The overall volume fraction of α is calculated by f = f 1 + (1 − f 1 ) × f 2 . The grain size of equiaxed α iswere electronic microscopy (SEM, TESCAN, Shanghai, China) images at 5000 times magnification measured to be the average diameter of the equiaxed α particles on the micrograph. Due to the of α employed to measure the fraction of α lamellae in β matrix (f 2 ). The overall volume fraction limitation of radiation heating, phase transformation at higher heating rate was examined by is calculated by f = f 1 + (1 − f 1 ) × f 2 . The grain size of equiaxed α is measured to be the average differential scanning calorimetry (DSC) and dilatometry. diameter of the equiaxed α particles on the micrograph. Due to the limitation of radiation heating, phase2.3. transformation at higher heating rate was examined by differential scanning calorimetry (DSC) Differential Scanning Calorimetry and dilatometry. The characteristic temperatures for phase transformation were measured by the differential scanning a Netzsch DSC-404 calorimeter (Netzsch, Shanghai, China). The specimens 2.3. Differentialcalorimetry Scanning with Calorimetry were φ 4 mm × 0.5 mm disks with different initial structures. The specimens were heated at 10, 20 The characteristic temperatures for phase and 40 °C/min up to 1100 °C respectively. All teststransformation were conducted were under measured the shieldingby of the highdifferential purity Ar flow. scanning calorimetry with a Netzsch DSC-404 calorimeter (Netzsch, Shanghai, China). The specimens
were φ 4 mm × 0.5 mm disks with different initial structures. The specimens were heated at 10, 20
Metals 2017, 7, 200
4 of 12
and 40 ◦ C/min up to 1100 ◦ C respectively. All tests were conducted under the shielding of high purity Ar flow. Metals 2017, 7, 200 2.4. Dilatometry
4 of 12
Dilatometry 2.4. Dilatometrywas carried out on a Netzsch DIL402C dilatometer (Netzsch, Shanghai, China). The specimens used in the experiment were φ 6 mm × 25 mm cylinders. The specimens were heated Dilatometry was carried out on a Netzsch DIL402C dilatometer (Netzsch, Shanghai, China). The at 5, 10 and 20 ◦used C/min upexperiment to 1100 ◦ C,were respectively. The whole process shielded under high purity specimens in the φ 6 mm × 25 mm cylinders. Thewas specimens were heated at 5, Ar flow with the flow rate of 50 mL/min. The change in the length of the specimen was recorded 10 and 20 °C/min up to 1100 °C, respectively. The whole process was shielded under high purity Ar and used flow to determine the linear expansion. with the flow rate ofthermal 50 mL/min. The change in the length of the specimen was recorded and used to determine the linear thermal expansion.
3. Results and Discussion 3. Results and Discussion
3.1. Microstructure Observations 3.1. Microstructure Observations
In continuously heating, there often exists a three stage phase transformation, including β In continuously heating, there oftenαexists a intermediate three stage phase transformation, including β β at decompostion at low temperature, lamellar to β at temperature and equiaxed α to decompostion at low temperature, lamellar α to β at intermediate temperature and equiaxed α to β high temperature. For initially microstructure I which was annealed at low temperature, the β-to-α at high temperature. For initially microstructure I which was annealed at low temperature, the β-totransformation at low temperatures has little influence on the microstructure. The microstructure after α transformation at low temperatures has little influence on the microstructure. The microstructure heated up to 700 ◦ C is close to the initial structure, as shown in Figure 2a. With increasing temperature, after heated up to 700 °C is close to the initial structure, as shown in Figure 2a. With increasing the primary equiaxed remains unchanged. Meanwhile, the lamellar α is slightly thickened (Figure 2b). temperature, the α primary equiaxed α remains unchanged. Meanwhile, the lamellar α is slightly Significant β-to-α transformation occurs with further heating. Blocks of β phases firstly appear between thickened (Figure 2b). Significant β-to-α transformation occurs with further heating. Blocks of β the equiaxed and lamellar α phases volume fraction of equiaxed decreases slightly phases firstly appear between the (Figure equiaxed2c). andThe lamellar α phases (Figure 2c). The α volume fraction equiaxed α decreases slightly while the lamellar α are2d). shortened significantly (Figure 2d). The whileofthe lamellar α are shortened significantly (Figure The transformation rate of lamellar α of lamellar is so high there exists a large of equiaxed α whendissolute the is so transformation high that thererate exists a largeαfraction ofthat equiaxed α when thefraction lamellar α has already lamellar α has dissolute (Figure becomes 2e). The size equiaxed α particles becomes more (Figure 2e). The sizealready of equiaxed α particles moreofinhomogeneously distributed when the inhomogeneously distributed when the equiaxed α began to dissolve. For diffusion controlled phase equiaxed α began to dissolve. For diffusion controlled phase transformation process, the dissolution transformation process, the dissolution rate of a secondary particle is inverse proportional to its rate of a secondary particle is inverse proportional to its radius. Therefore, the difference in particle radius. Therefore, the difference in particle size is strengthened during α-to-β size is strengthened during α-to-β transformation (Figure 2f). transformation (Figure 2f).
(a)
(d)
(b)
(c)
(e)
(f)
Figure 2. Optical microscopy micrographs of samples with initially microstructure I after heated up
Figure 2. Optical microscopy micrographs of samples with initially microstructure I after heated up to to (a) 700 °C; (b) 800 °C; (c) 860 °C; (d) 900 °C; (e) 940 °C and (f) 970 °C at 10 °C/min. (a) 700 ◦ C; (b) 800 ◦ C; (c) 860 ◦ C; (d) 900 ◦ C; (e) 940 ◦ C and (f) 970 ◦ C at 10 ◦ C/min.
Microstructure II was obtained by high temperature annealing followed by a rapid cooling. The microstructure is II more by the in heating. Metallographic Microstructure wasaffected obtained byphase high transformation temperature annealing followed by aobservation rapid cooling. suggests that the volume fraction of equiaxed α varies little until the heating temperature is high The microstructure is more affected by the phase transformation in heating. Metallographic observation enough to transform all α lamellae, as shown in Figure 3. On the other hand, the fraction, size and suggests that the volume fraction of equiaxed α varies little until the heating temperature is high morphology of the lamellar α change significantly.
Metals 2017, 7, 200
5 of 12
enough to transform all α lamellae, as shown in Figure 3. On the other hand, the fraction, size and morphology of the lamellar α change significantly. Metals 2017, 7, 200 5 of 12 Metals 2017, 7, 200
5 of 12
Figure 3. Optical microscopy micrographs of specimens with initially microstructure II after heated Figure 3. Optical microscopy micrographs of specimens with initially microstructure II after heated up Figure Optical microscopy of °C specimens with initially microstructure II after heated up to (a)3.750 °C; (b) 800 °C; (c)micrographs 860 °C; (d) 940 at 10 °C/min. to (a) 750 ◦ C; (b) 800 ◦ C; (c) 860 ◦ C; (d) 940 ◦ C at 10 ◦ C/min. up to (a) 750 °C; (b) 800 °C; (c) 860 °C; (d) 940 °C at 10 °C/min.
Figure 4 shows the change of lamellar α phase during continuous heating with initially Figure 4 shows change of lamellar α phase during continuous heating with α 700 phase during 4a). continuous microstructure II. The the lamellae varied little up to °C (Figure For Ti-6Al-4V alloy, theinitially β-to-α ◦ C (Figure 4a). microstructure II. The lamellae varied little up to 700 Ti-6Al-4V alloy, the β-to-α °C For alloy, the β-to-α transformation occurs around 500 °C. The metastable β phase may have already taken place before ◦ C. The metastable β phase may have already taken place before transformation occurs around 500 °C. it by metallographic β 700 °C. However, it is hard to measure observation. Barriobero-Vila et al. [14] 700 ◦°C. C. However, it is measure by observation. hard tothe measure by metallographic metallographic observation. Barriobero-Vila et al. reported an increase ofhard 3% into volumeititfraction of α phase at a heating rate of 5 °C/min for the[14] Ti◦ C/min for the reported increase of 3% in the volume fraction of α phase at a heating rate of 5 an increase of 3% in the volume fraction of α phase at a heating rate of 5 °C/min for the Ti6Al-4V alloy. The increase in volume fraction decreases to 1% at the heating rate of 20 °C/min. It can ◦ C/min. Ti-6Al-4V alloy. The increase in volume fraction decreases to 1% at the heating rate of 20 6Al-4V alloy. increase in volume fraction decreases to 1% atαthe heatingmore rate of 20 °C/min.which It can be found fromThe Figure 3a that the secondary grain boundary becomes continuous, It can be found from Figure 3a that the secondary grain boundary α becomes more continuous, be found from Figure 3a that the secondary grain boundary α becomes more continuous, which indicates the decomposition of residual β phase. However, the increase in α fraction is trivial which indicates theoverall decomposition of residual phase. However, the increase in α fraction is indicates the of residual β phase. However, the increase in α fraction isheating trivial comparing to decomposition the volume fraction of αβ lamellae (>60%). Meanwhile, the low trivial comparing thethe overall volume of α lamellae (>60%). Meanwhile, the low low heating comparing toprohibits thetooverall volume fraction of α lamellae Meanwhile, the temperature coarsening offraction α lamellae. As a (>60%). result, the microstructural change is temperature prohibits the coarsening of α lamellae. As a microstructural change is coarsening of α lamellae. As a result, the not significant. not significant. During temperature range of 700 to 900 °C, the volume fraction of lamellar α decreases slightly ◦ C, the volume fraction of lamellar α decreases slightly temperature of 700 toα900 °C, α with During temperature and therange fine lamellar disappeared (Figure 4b). They either transform to β phase with temperature and the fine lamellar α disappeared (Figure 4b). They either transform β fine lamellar α disappeared (Figure 4b). transform β phase or merge to become thicker lamellae, resulting in relatively thick α lamellae. The averagetothickness or merge to become thicker lamellae, resulting in relatively thick α lamellae. The average thickness become thickersignificantly. lamellae, resulting relatively α lamellae.of lamellar average of the lamellar α increases Abovein900 °C, the thick transformation α is greatly ◦ C, of the lamellar α increases significantly. Above 900 transformation α islamellae greatly α increases significantly. °C, the of lamellar α accelerated. Thin and short lamellae transform faster than the long and thick ones. The accelerated. Thin and short lamellae transform faster than the long and thick ones. The lamellae Thinby and lamellae and thick ones.then decreases become isolated theshort β matrix. Thetransform thickness of the lamellae increases first and become4c,d)). isolated bydissolution the β The thickness thickness then the decreases β matrix. The of isthe lamellae increases first andalong (Figure The of secondary α laths dominated by the shortening major (Figure 4c,d)). The dissolution of secondary α laths is dominated by the shortening along the major α axis, which can be taken as a reverse process of the growth of the Widmanstatten α. axis, which can be taken as a reverse process of the growth of the Widmanstatten α. reverse process of the growth of the Widmanstatten α.
Figure 4. Secondary electron images of the lamellar α from initially microstructure II after heated up Figure 4. °C; Secondary electron images of the°C. lamellar α from initially microstructure II after heated up to (a) 700 (b) 900 electron °C; (c) 940 °C; (d) Figure 4. Secondary images of 970 the lamellar α from initially microstructure II after heated up to to (a) 700 °C; (b) 900 °C; (c) 940 °C; (d) 970 °C. ◦ ◦ ◦ ◦ (a) 700 C; (b) 900 C; (c) 940 C; (d) 970 C.
In continuous heating of the trimodal structure (microstructure III), the primary equiaxed α and In continuous heatingwhen of thethe trimodal (microstructure the primary equiaxed α and lamellar α are unchanged heatingstructure temperature is below 700III), °C (Figure 5a). With increasing In continuous heating of the trimodal structure (microstructure III), the primary equiaxed α and lamellar α arethe unchanged when the heating temperature is below lamellar 700 °C (Figure 5a). With(Figure increasing temperature, significant increase in the fraction of secondary α is observed 5b), lamellar α are unchanged when the heating temperature is below 700 ◦ C (Figure 5a). With increasing temperature, the significant increase in the fraction of secondary lamellar α is observed (Figure 5b), which is often interpreted in terms of lamellae thickening. The residual β between the lamellar α temperature, the significant increase in the fraction of secondary lamellar α is observed (Figure 5b), which isofoften interpreted of lamellae thickening. Theαresidual β between the lamellar α consists a large fraction in ofterms thin and disordered secondary laths (Figure 6a). These α lathes which often interpreted in terms of lamellae thickening. Theαresidual β between the lamellar α consistsis of a large fraction thinwith and disordered secondary (Figure 6a). 6b. These α lathes transform preferentially to βof phase increasing temperature, aslaths shown in Figure Though the consists ofpreferentially a large fraction thin with and disordered secondary α laths (Figure 6a). 6b. These α lathes transform to βofphase increasing shown inand Figure Though the secondary α laths are stabilized by annealing at 940 temperature, °C, the lower as α stabilizer the higher specific secondary α they lathstransform are stabilized annealing 940 °C, theequiaxed lower α stabilizer theThe higher specific surface area, morebyrapidly thanatthe primary α (Figureand 6c,d)). dissolution surface area, they transform moretorapidly the microstructure primary equiaxed α (Figure The dissolution behavior of the α laths is similar that of than initially II. The α laths6c,d)). in microstructure III behavior of the α laths is similar to that of initially microstructure II. The α laths in microstructure III are formed by additional heat treatment. Their properties (chemical composition, morphology, are formedcoherency, by additional heatsimilar treatment. Their (chemical composition, interfacial etc.) are to the highproperties temperature α lamellae formed inmorphology, continuous interfacial coherency, etc.) are similar to the high temperature α lamellae formed in continuous heating of microstructure II.
Metals 2017, 7, 200
6 of 12
transform preferentially to β phase with increasing temperature, as shown in Figure 6b. Though the secondary α laths are stabilized by annealing at 940 ◦ C, the lower α stabilizer and the higher specific surface area, they transform more rapidly than the primary equiaxed α (Figure 6c,d)). The dissolution behavior of the α laths is similar to that of initially microstructure II. The α laths in microstructure III are formed by additional heat treatment. Their properties (chemical composition, morphology, interfacial coherency, etc.) are similar to the high temperature α lamellae formed in continuous heating of microstructure II. Metals 2017, 7, 200 6 of 12 Metals 2017, 7, 200
6 of 12
Figure 5. Optical microscopy images of the specimens after heated up from initially microstructure Figure 5. microscopy images ofofthe specimens after heated upup from initially microstructure III: Figure 5. Optical Optical microscopy specimens after heated from initially III: (a) 700 Water quenchedimages (WQ); (b)the 800 WQ; (c) 940 WQ; (d) 970 WQ.microstructure ◦ C, °C, ◦ C, °C, ◦ C, °C, ◦ C, °C, (a) 700 Water quenched (WQ); (b) 800 WQ; (c) 940 WQ; (d) 970 WQ. III: (a) 700 °C, Water quenched (WQ); (b) 800 °C, WQ; (c) 940 °C, WQ; (d) 970 °C, WQ.
Figure 6. Secondary electron images of the lamellar α with initially microstructure III: (a) 800 °C, WQ; Figure Secondary electron images of the α with initially microstructure III: (a) 800 °C, WQ; (b) 860 6. °C, WQ; (c) 900 °C, WQ; (d) 970 °C,lamellar WQ. Figure 6. Secondary electron images of the lamellar α with initially microstructure III: (a) 800 ◦ C, WQ; (b) 860 860 ◦°C, ◦ C, WQ; ◦ C, WQ. (b) C, WQ; WQ; (c) (c) 900 900 °C, WQ; (d) (d) 970 970 °C, WQ.
3.2. Analysis of Differential Scanning Calorimetry and Dilatometry 3.2. Analysis of Differential Scanning Calorimetry and Dilatometry 3.2. Analysis of Differential Scanninginvolve Calorimetry Dilatometry α-β phase transformations heat and absorption or heat release, which correlate to the α-β phase transformations involve heat absorption or heatand release, which correlate to the endothermic or transformations exothermic peaks in DSC curve. The starting ending temperatures involve heat absorption or heat release, which correlate of to the α-β phase endothermic or exothermic peaks in DSC curve. The starting and ending temperatures of the transformation be estimated from onset and offset points of theending peak. This method hasofbeen endothermic orcan exothermic peaks in the DSC curve. The starting and temperatures the transformation can be estimated from the onset andinoffset points of the peak. This methodTi-6Al-4V has been employed to investigate the phase transformation cooling heating transformation can be estimated from the onset and continuous offset points of theand peak. This of method has employed to investigate the phase transformation in continuous cooling and heating of Ti-6Al-4V titanium alloy [13,18]. been employed to investigate the phase transformation in continuous cooling and heating of Ti-6Al-4V titanium alloy [13,18]. DSCalloy curves of different initial structure heated at the rate of 10, 20 and 40 °C/min are given in titanium [13,18]. DSC of different initial heated the rate of 10,slight 20 and 40 °C/min are given in Figure 7. curves From DSC curves, it structure can be seen thatatat there exothermic peak DSC curvesthe of different initial structure heated the exists rate ofa10, 20 and 40 ◦ C/min arearound given Figure 7. From the DSC curves, it can be seen that there exists a slight exothermic peak around 500Figure °C at 7. theFrom heating 10 °C/min three initial This exothermic peak corresponds to the in the rate DSCofcurves, it canforbeall seen that therestructures. exists a slight peak around 500 °C at the heating rate of 10 °C/min for all three initial structures. This peak corresponds to the ◦ ◦ decomposition of residual β phase. The β-to-α temperature from 430 to 530 °C 500 C at the heating rate of 10 C/min for alltransformation three initial structures. Thisranges peak corresponds to the decomposition of residual β phase. The β-to-α transformation ranges from 430 to 530 ◦°C for a bimodal two-phase alloy [14] and it rangestemperature from 590 to 735 °C for a bimodal twodecomposition of residualTi-6Al-6V-2Sn β phase. The β-to-α transformation temperature ranges from 430 to 530 C for a bimodal two-phase Ti-6Al-6V-2Sn alloy [14] and it ranges fromto590 to 735 °Cstudy. for a bimodal two◦ phase TC21 alloy [12] at a heating rate of 5 °C/min, which are close the current However, as for a bimodal two-phase Ti-6Al-6V-2Sn alloy [14] and it ranges from 590 to 735 C for a bimodal phase TC21 alloy [12] atnot a heating rate ofit5is°C/min, which close to the the current study.range However, as the exothermic to are determine by DSC two-phase TC21peak alloy is [12] atsignificant, a heating rate ofimpossible 5 ◦ C/min, which are close to temperature the current study. However, the exothermic peak is not significant, it is impossible to determine the temperature range by DSC curves. as the exothermic peak is not significant, it is impossible to determine the temperature range by curves. DSC After curves.the first exothermic peak, the heat flux increases continuously and reach the first After the firstat exothermic peak, heat temperatures flux increases and for reach first endothermic 760 to 780 °C. The the starting of continuously endothermic the the bimodal After thepeak first exothermic peak, the heat flux increases continuouslypeak and reach the first endothermic peak at 760 to 780 °C. The starting temperatures of endothermic peak for the bimodal ◦ and trimodal structures are similar (