water Article
The Effect of Particle Size Distribution on the Design of Urban Stormwater Control Measures Willliam R. Selbig *, Michael N. Fienen, Judy A. Horwatich and Roger T. Bannerman Received: 20 October 2015; Accepted: 31 December 2015; Published: 6 January 2016 Academic Editors: Kelly Morgan and Monica Ozores-Hampton U.S. Geological Survey—Wisconsin Water Science Center, 8505 Research Way, Middleton, WI 53562, USA;
[email protected] (M.N.F.);
[email protected] (J.A.H.);
[email protected] (R.T.B.) * Correspondence:
[email protected]; Tel.: +1-608-821-3823; Fax: +1-608-821-3817
Abstract: An urban pollutant loading model was used to demonstrate how incorrect assumptions on the particle size distribution (PSD) in urban runoff can alter the design characteristics of stormwater control measures (SCMs) used to remove solids in stormwater. Field-measured PSD, although highly variable, is generally coarser than the widely-accepted PSD characterized by the Nationwide Urban Runoff Program (NURP). PSDs can be predicted based on environmental surrogate data. There were no appreciable differences in predicted PSD when grouped by season. Model simulations of a wet detention pond and catch basin showed a much smaller surface area is needed to achieve the same level of solids removal using the median value of field-measured PSD as compared to NURP PSD. Therefore, SCMs that used the NURP PSD in the design process could be unnecessarily oversized. The median of measured PSDs, although more site-specific than NURP PSDs, could still misrepresent the efficiency of an SCM because it may not adequately capture the variability of individual runoff events. Future pollutant loading models may account for this variability through regression with environmental surrogates, but until then, without proper site characterization, the adoption of a single PSD to represent all runoff conditions may result in SCMs that are under- or over-sized, rendering them ineffective or unnecessarily costly. Keywords: particle size distribution; stormwater; urban; sediment; solids; pollutant model
1. Introduction Environmental managers depend on accurate water quality data to help identify sources of pollutants in the urban environment so they may better choose stormwater control measures (SCMs) that optimize reduced risk to receiving waters. The selection process has historically centered on the efficiency at which a device or structure can remove pollutants from stormwater runoff. Predictive models are currently being used to evaluate the efficiency of SCMs, their optimal placement and their aggregated impact on water quality compliance at both the reach and watershed scale. Accurate representation of pollutant concentrations and the distribution of particles in runoff are especially important to assure these models provide useful results. Once tested, models can be one of the only cost effective approaches to developing watershed plans in urban areas when confronted with the high cost of monitoring every source and SCM. For example, the Wisconsin Department of Natural Resources (WDNR) has promulgated a series of stormwater performance standards that will require qualifying cities to reduce the annual total suspended solids (TSS) load in urban runoff from newly-developed areas by 80 percent [1]. Models are used by permittees to help implement various SCMs to meet reduction targets. Another example is the development of total maximum daily loads (TMDLs) for impaired waters under Section §303(d) of the Clean Water Act [2]. Urban areas around the country are subject to the development of TMDLs that require the use of models to calculate the maximum
Water 2016, 8, 17; doi:10.3390/w8010017
www.mdpi.com/journal/water
Water 2016, 8, 17
2 of 17
amount of pollutant a water body can receive in order to maintain beneficial use and serve as metrics with which successful implementation of SCMs is determined. In order to properly assess the pollutant removal capabilities of SCMs, the design and selection should account for accurate characterization of particle size, because it is one of the parameters having the greatest influence on sediment transport [3]. Inaccurate characterization of pollutant concentrations and distributions could generate erroneous results that can significantly reduce the effectiveness of watershed planning. The design of most SCMs available today generally makes use of settling as the primary form of treatment. The design of these structures is commonly based on theoretical principles that rely on assumed values when characterizing the range of particles they are designed to treat, such as density, distribution, flow rate, temperature and detention time [4]. The highly variable nature of urban runoff limits the adoption of a single particle size distribution (PSD), yet engineers and designers often resort to using some statistical representation of the average condition [5,6]. For example, Wisconsin and Minnesota recommend use of a generalized PSD reported by the Nationwide Urban Runoff Program (NURP) [7] when designing wet detention ponds (median particle diameter (d50) = 8 µm). Other regulating authorities call for the use of manufactured PSDs when sizing SCMs or to validate advertised removal efficiencies by manufacturers of proprietary stormwater technologies. The PSDs are often specified in state or local verification protocols. For example, the Washington Department of Ecology recommends use of U.S. Silica Sil-Co-Sil® 106 ground silica to be used during laboratory testing (d50 = 19 µm), whereas the city of Indianapolis requires the use of Oklahoma-110 silica sand (d50 = 90 µm) [8]. Under controlled laboratory conditions, simulating particles of known PSD, shape and density yields reliable performance results. In comparison, the dynamic distribution in the density gradient of inorganic and organic particles in urban runoff makes field validation of claimed removal efficiencies difficult. Given the wide range of median particle diameters for the NURP distribution, Sil-Co-Sil® 106 and Oklahoma-110, selection of a PSD becomes critical when determining the removal efficiency of various SCMs. Previous studies recognized the need for characterization of PSD in runoff from urban sources [9–11], yet it remains a parameter that is seldom measured [12]. Many of the studies reporting PSDs from urban areas indicate substantial variability, both within and between runoff events [5,6,9,13]. To complicate matters, differences in sample collection, processing, analytical and reporting methods have resulted in a wide range of concentrations and distributions from similar sources [5,14]. A synthesis of over 800 literature sources on best management practice (BMP) performance identified the need for better guidance on proper monitoring and reporting of stormwater BMPs [15]. Some variation can be attributed to a combination of site conditions and rainfall/runoff characteristics that are both temporal and spatial [16,17]; however, the correlation of PSDs in urban runoff to potential explanatory variables, such as land use, rainfall characteristics, seasonality and geography, is sparse. Consequently, comparisons amongst and between SCMs become less informative because of the high level of uncertainty in the measured data. Furthermore, inaccurate representation of particulate matter and pollutants in urban runoff can lead to the design of under- or over-sized structures, rendering them either ineffective or unnecessarily costly. One way to reduce uncertainty is to increase the number of samples used in data analysis [18]. This is often infeasible due to the associated increased costs of sampling campaigns. An alternative way to minimize uncertainty is to limit external sources common to methods used for sample collection, processing and analysis. Recent advancements in sample collection have greatly reduced variability and bias in urban runoff data (e.g., Selbig [6]), which have resulted in the ability to predict PSD through regression with common climatic variables [19]. While simulation of PSDs shows great promise, restrictions of the site-specific nature of the regression models limit their transferability; however, additional refinements may lead to continuous simulation of PSDs in existing urban pollutant loading models. This study shows how land use and source area-based characterization of PSD in urban stormwater should be used when designing SCMs that use settling as the primary method to achieve
Water 2016, 8, 17
3 of 17
pollutant reduction goals. An urban pollutant loading model was used to demonstrate how selection of the PSD in runoff influent to a simulated wet pond or catch basin can greatly alter the surface area needed to meet prescribed TSS reduction goals. Differences in SCM size were based on PSDs representing a single “one-size-fits-all” curve representative of all urban areas, PSDs that are specific to the modeled urban source areas or land use and seasonal PSDs developed using statistical regression with climate variables. Although the results are specific to each SCM, any device that uses PSD in the computation of sediment removal efficiency would likely produce similar results. The data presented herein are intended to help environmental managers understand some of the implications behind the selection of PSD datasets used in the design of SCMs for the removal of sediment in stormwater. 2. Materials and Methods Data were compiled from two previous studies characterizing particle size distributions in urban runoff: (1) the Environmental Protection Agency’s early attempt to characterize pollutants in urban stormwater as part of the Nationwide Urban Runoff Program (NURP) [20]; and (2) a comparison of PSDs in stormwater using different sample collection technologies [6]. 2.1. Site Description 2.1.1. Commercial Parking Lot The 2.4-hectare commercial parking lot served an adjacent shopping center complex (Figure 1). The asphalt-based surface was approximately five years old at the time of study. Runoff is collected into multiple storm-sewer inlets throughout the drainage area, then conveyed through a common concrete, 0.91-m diameter circular pipe. There were no catch basins or other sediment removing structures in the drainage network upstream of the monitoring location. Roof runoff was internally drained directly to the storm sewer, but was not part of the flow measured from the parking lot. A more complete summary of the geographic setting and physical description can be found in Selbig [21]. 2.1.2. Residential Basin The medium-density residential basin (Figure 1) drained 21.2 hectares into a 1.07-m diameter storm sewer. Pervious surfaces (lawns) made up 66 percent of the basin area, and impervious surfaces (streets, roofs, driveways) made up 34 percent. The asphalt-based street widths were typically 10 m from curb to curb. There were no catch basins in the storm drainage network. A more complete summary of the geographic setting and physical description can be found in Selbig and Bannerman [16]. 2.2. Development of PSDs 2.2.1. The Nationwide Urban Runoff Program Between 1979 and 1983, the U.S. Environmental Protection Agency (USEPA) began a comprehensive effort to characterize urban stormwater pollution in 28 cities across the United States as part of NURP [7]. Water quality samples at monitored locations were collected by use of autosamplers with a fixed sample intake in a storm sewer. In addition to measuring pollutant concentrations, settling tests were done on a number of NURP samples to derive a range of settling velocities for particles found in urban runoff. The following is a brief summary of the methods used to determine the NURP PSD; additional details can be found in USEPA [22].
Water 2016, 8, 17 Water 2016, 8, 17
4 of 17 4 of 17
Figure 1. Location of the residential basin (1) and commercial lot (2)parking study areas, Madison, Figure 1. Location of the residential basin (1) and parking commercial lot (2) study Wisconsin. areas, Madison, Wisconsin.
Settling velocities were determined by use of a settling column of 15.2 cm in diameter and 1.8 m high fitted with a series of sample ports spaced vertically throughout the column. Measurements of Settling velocities were determined by use of a settling column of 15.2 cm in diameter and 1.8 m solids concentration in the water were collected at each sampling port over time. The concentration high fitted with a series of sample ports spaced vertically throughout the column. Measurements of measured in samples from each port location representing the settling depth and the sample time solids concentration in the water were collected at each sampling port over time. The concentration were used to calculate a settling velocity. A probability plot of results from all samples described the measured in samples from each port location representing the settling depth and the sample time overall distribution of settling velocity. Resulting settling velocities were later converted to particle were used to calculate a settling velocity. A probability plot of results from all samples described the diameter using Stokes’ law [23]. The results of the Stokes’ law calculations showed a wide range in overall distribution of settling velocity. Resulting settling velocities were later converted to particle particle sizes in any sample of stormwater runoff. Analysis of these PSDs showed substantial diameter using Stokes’ law [23]. The results of the Stokes’ law calculations showed a wide range variability between separate storms at a single site, as well as between individual storms at different in particle sizes in any sample of stormwater runoff. Analysis of these PSDs showed substantial sites. Because site-to-site differences were of the same order as storm-to-storm variations at a variability between separate storms at a single site, as well as between individual storms at different particular site, all data were combined to develop a single PSD representing “typical” urban sites. Because site-to-site differences were of the same order as storm-to-storm variations at a particular stormwater runoff (Figure 2A,B). Although the final PSD was considered “typical”, it was intended site, all data were combined to develop a single PSD representing “typical” urban stormwater runoff only as an initial screening tool; recommendations for additional site-specific data were encouraged (Figure 2A,B). Although the final PSD was considered “typical”, it was intended only as an initial [22]. screening tool; recommendations for additional site-specific data were encouraged [22].
Water 2016, 8, 17 Water 2016, 8, 17
5 of 17 5 of 17
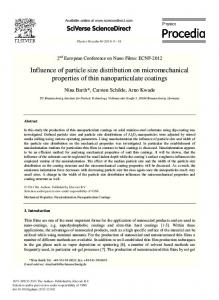
Figure2.2.Individual Individualevent eventand andmedian median(bold) (bold)particle particlesize sizedistributions distributionsmeasured measuredatatthe thecommercial commercial Figure parkinglot lot(A) (A)(n(n==20) 20)and andresidential residentialbasin basin(B) (B)(n(n==19) 19)compared comparedtotothe theNationwide NationwideUrban UrbanRunoff Runoff parking Program (NURP) (blue). Program (NURP) (blue).
2.2.2.Measured MeasuredDistributions DistributionsUsing UsingImproved ImprovedSample SampleCollection CollectionTechnology Technology 2.2.2. Stratificationofof sediment by particle size in a flowing water has column has previously been Stratification sediment by particle size in a flowing water column previously been identified identified as a potentially major source of variability and bias in urban stormwater [24–26]. In 2008, as a potentially major source of variability and bias in urban stormwater [24–26]. In 2008, the USGS the USGS adeveloped a depth-integrated sample as arm (DISA)toas a means collectsamples water quality developed depth-integrated sample arm (DISA) a means collect watertoquality from samplespoints from multiple points throughout thethereby water column, reducing biasthe associated with multiple throughout the water column, reducingthereby bias associated with stratification the stratification of solids in stormwater [24]. This is an important distinction from NURP sample of solids in stormwater [24]. This is an important distinction from NURP sample collection methods, collection methods, which acquired a water sample single point in thetesting water showed column. which acquired a water sample from a single point in thefrom watera column. Laboratory Laboratory showed that sediment the DISAconcentrations was able to within measure sediment concentrations within that the DISAtesting was able to measure 7 percent of the true value [27]. The 7 percent of the true value [27]. The DISA has been used to improve the characterization of sediment DISA has been used to improve the characterization of sediment concentrations and PSDs in urban concentrations andfrom PSDsseveral in urban stormwater several different source areas and stormwater runoff different urbanrunoff sourcefrom areas and land uses urban that have consistently land uses that have consistently shown large departures from the NURP PSD [6]. For brevity, this shown large departures from the NURP PSD [6]. For brevity, this paper presents measured PSDs paper presents measured PSDs from one source area (commercial parking lot) and one land from one source area (commercial parking lot) and one land use (residential), both illustrated use in (residential), both illustrated in Figure 2A,B, respectively. Figure 2A,B, respectively. Waterquality qualitysamples sampleswere werecollected collectedby byuse useofofan anautomated automatedsampler samplerand andDISA. DISA.Flow-paced Flow-paced Water sub-samples covering the storm hydrograph were combined into a single, composite sample. sub-samples covering the storm hydrograph were combined into a single, composite sample. Samples Samples were preserved at delivered 4 °C and delivered to the Wisconsin State Laboratory of Hygiene were preserved at 4 ˝ C and to the Wisconsin State Laboratory of Hygiene (WSLH)(WSLH) within within 48 h. Upon receipt of the sample, the WSLH determined the total mass of water 48 h. Upon receipt of the sample, the WSLH determined the total mass of water after correcting forafter the correcting the weight of the container. Thesieved sample was then wet a series of weight of thefor container. The sample was then wet through a series of sieved stackedthrough nylon mesh sieves, stacked nylon mesh sieves, which separated the solid-phase material from the sample into five which separated the solid-phase material from the sample into five separate particle size fractions: separate particle size fractions: ≥500, 250 to