Apr 25, 2012 - Some physical and mechanical properties of oil palm trunk (OPT, Elaeis guineensis) and rubberwood (Hevea brasiliensis) were investigated by ...
CELLULOSE CHEMISTRY AND TECHNOLOGY
THE EFFECT OF RELATIVE HUMIDITY ON THE PHYSICAL AND MECHANICAL PROPERTIES OF OIL PALM TRUNK AND RUBBERWOOD OTHMAN SULAIMAN,* MOHD FAHMI AWALLUDIN,* ROKIAH HASHIM* and MD. IBRAHIM H. MONDAL** *
Division of Bioresource, Paper and Coatings Technology, School of Industrial Technology, Universiti Sains Malaysia, 11800 Penang, Malaysia ** Visiting Scientist at Division of Bioresource, Paper and Coatings Technology, School of Industrial Technology, Universiti Sains Malaysia, 11800 Minden, Penang, Malaysia Received April 25, 2012 Some physical and mechanical properties of oil palm trunk (OPT, Elaeis guineensis) and rubberwood (Hevea brasiliensis) were investigated by exposing to relative humidity, and sorption, dimensional changes and compression strength were determined. Both OPT and rubberwood showed a sigmoidal relationship of relative humidity and equilibrium moisture content. The fiber saturation points of OPT and rubberwood were found in the ranges 22-25% and 25-27%, respectively. The percent swelling of OPT in both the tangential and radial directions was almost identical – of about 2.2%. On the other hand, the swelling of rubberwood was of about 5.7% in the tangential direction and of about 3.2% in the radial direction. The ratio of tangential to radial swelling for oil palm trunk ranged from 1.03 to 1.12, while that for rubberwood ranged from 1.56 to 2.09. The longitudinal specific compression strength of OPT and rubberwood was affected by the moisture content. Keywords: oil palm trunk, rubberwood, compression strength, relative humidity, swelling
INTRODUCTION Elaeis guineensis is a species of oil palm that originated in West Africa, and is now widely cultivated in Malaysia. In 2006, oil palm tree cultivations in Malaysia covered 4.17 million hectares.1 The oil palm tree is mainly cultivated for its fruit, which is produced over a period of about 25 years. At the end of its productive years, the plant will normally be replaced with a new tree. Replanting typically involves cutting and shredding the trees into small pieces and leaving them to decompose naturally. This approach leaves a large amount of oil palm biomass that could otherwise be converted into value-added products. As a result, this practice is gradually being phased out. In addition, new uses of OPT are being continuously explored. There is a serious interest in using OPT as a substitute for some wood products for structural applications. These include structural applications of oil palm for laminated veneer lumber as studied by Sulaiman et al.,2 Wahab et al.3 and
Nordin et al.4 Other structural applications include plywood,5 oil palm lumber6 and truss rafters.7 These studies indicate the considerable potential of oil palm for being used for structural purposes,which would consequently reduce the consumption of wood as a raw material and mitigate the environmental impacts of wood use. The anatomical structure of oil palm consists of vascular bundles and parenchyma cells. By comparison, hardwood consists of fibers, vessel, pores, parenchyma and ray parenchyma cells, while in softwood, the main constituent is the longitudinal tracheid. Oil palm belongs to the monocotyledon family and its growth depends on the expansion of the parenchyma cells and fibers within the vascular bundles. Such anatomical structure imparts variable density, increasing towards the outer periphery and height of the trunk, as indicated by Killman and Lim.8 The oil palm tree is considered a lignocellulosic material containing cellulose, hemicellulose and lignin like
Cellulose Chem. Technol., 46 (5-6), 401-407 (2012)
OTHMAN SULAIMAN et al. wood.9,10 Green OPT has high moisture content, ranging from 120% to more than 500%, as found by Lim and Gan.11 The different anatomical architecture and inherent variable density and high moisture content of the material are expected to influence the physical and mechanical properties. These physical and mechanical properties will also be influenced by the moisture conditions of the surrounding environment.12-14 As a hygroscopic material, OPT can adsorb or desorb moisture according to changes in the relative humidity and temperature of the surrounding environment. Since environmental conditions continuously change, repeated adsorption and desorption of moisture normally occur. A change in moisture can lead to changes of dimensions, as a result of swelling during adsorption and shrinkage during desorption. These parameters ultimately affect the dimensional stability and strength of the end-use materials. The amount of moisture adsorbed at a given relative humidity depends on a few factors, such as species of wood,15-17 type of raw materials18 and type of products.1 A study on such a relation has not been reported yet for oil palm.10,11 Therefore, the present investigation aimed to observe the effect of relative humidity on some physical and mechanical properties of never dried OPT, in comparison with rubberwood. EXPERIMENTAL Samples of 25 year-old oil palm trunk (OPT, Elaeis guineensis) were obtained from the Central Kedah Plywood Factory, one of the several plywood mills in Kedah, Malaysia. The samples were taken only from the outer 25% of the trunk, as measured from pith to bark, and only defect-free samples were used. The OPT samples were cut according to British Standard19 (BS 373:1957, 1986) and the resulting dimensions were 20 mm (tangential) x 20 mm (radial) x 60 mm (axial). The 25 year-old rubberwood (Hevea brasiliensis) samples were obtained from a rubberwood furniture factory in Kedah, Malaysia, and were cut to similar sizes to be used for comparison with the samples of OPT. Twenty identical OPT test samples were prepared to measure the dimensional and weight changes during the experimental period, while another one hundred samples were prepared for measuring the longitudinal compression strength as a function of fluctuating relative humidity. The moisture content of green OPT and rubberwood samples were initially of 230% and 75%, respectively. The samples were placed into a controlled relative humidity chamber and remained there for a cycle of three relative humidity stages, consisting in adsorption-desorption-adsorption. The
402
sorption cycle, performed according to the work of Hashim et al.,20 started with an adsorption event of incremental relative humidity, 65%75%80%90%. It was followed by a desorption step with a reduction in relative humidity – 90%75%65%50%30%. The final stage was an adsorption step with increasing relative humidity, 30%50%60%. The temperature of the relative humidity chamber was kept constant at 25 °C, considered to be room temperature in Malaysia. Once the weight of representative samples remained constant for a few days, it was assumed that the samples had attained equilibrium moisture content. In order to obtain the fiber saturation point (FSP) of OPT, ten OPT samples of the same size were oven-dried and left to soak in distilled water at 25 °C, until all samples reached constant weight and dimensions. For each respective relative humidity condition, when the samples reached equilibrium moisture content, twenty identical OPT samples were weighed and their dimensions were measured. Ten samples were placed back into the RH chamber to go through the next relative humidity condition, together with the samples prepared for the compression strength test. Then, another ten samples were submitted to the compression strength test. These steps were repeated for each relative humidity condition, until all one hundred OPT samples prepared for the compression strength test had been exposed to all ten relative humidity conditions, as mentioned before. In the final stage of this experiment, ten OPT samples, used to measure weight and dimensional changes as a function of fluctuating relative humidity, were oven-dried for 24 hours at 103±2 °C. The weights and dimensions of these samples were recorded. Longitudinal compression strength test also was carried out for these samples. All of the steps mentioned above were also applied for rubberwood, the experiments being conducted concurrently. The total number of the samples used was two hundred and forty – one hundred and twenty of each OPT and rubberwood, including the samples for FSP determination. The density was measured on the samples prepared for the longitudinal compression strength test, based on weight and volume, when the samples were in equilibrium, at a particular relative humidity. The specific gravity was calculated based on the density – specific gravity is the density of a test sample with respect to the standard density of water. In this case, the water density at 25 °C is of 0.997 g/cm³.21 Density (ρ) = M (g)/V (cm3) (1) where M is the weight of the sample and V is the volume. (2) Specific gravity (SG) = ρ (g/cm3)/ ρ (g/cm3) The equilibrium moisture content, hysteresis coefficient, tangential and radial shrinkage/swelling, ratio of tangential dimension to radial dimension and
Wood properties
longitudinal specific compression strength were then calculated as follows. Equilibrium moisture content: (EMC, %) = ((Mad – Mod (g))/(Mod(g)) × 100 (3) ad where M is the weight of the sample in equilibrium with atmospheric conditions and Mod is the oven-dry weight. Hysteresis coefficient (4): (HC) = EMCad (%)/EMCde (%) (at the same RH level) where EMCad is the equilibrium moisture content at adsorption stage, EMCde is the equilibrium moisture content at desorption stage and RH is relative humidity. Tangential shrinkage/swelling (5): (TgS, %) = (TDad – TDod (mm))/(TDod (mm)) × 100 where TDad is the tangential dimension of the sample in equilibrium with atmospheric conditions and TDod is the tangential dimension of the sample when ovendried. Radial shrinkage/swelling (6): (RdS, %) = (RDad – RDod (mm))/(RDod (mm)) × 100 where RDad is the radial dimension of the sample in equilibrium with atmospheric conditions and RDod is the radial dimension of the sample when oven-dried. Ratio of tangential dimension to radial dimension: (T/R) = (Tangential dimension (mm))/(Radial dimension (mm)) × 100 (7) Longitudinal specific compression strength: (CS) = Load/SG (N/mm2) (8) where SG is specific gravity of the sample in equilibrium under atmospheric conditions. Moisture content was calculated based on oven-dry weight. The longitudinal compression strength test was performed according to British Standards,19 using an Instron Universal Testing Machine Model 5582 with a testing speed of 0.01 mm/s. The results are presented in terms of specific compression strength by dividing it to specific gravity at a particular relative humidity. The purpose of this calculation is to eliminate the influence of densities on the compression strength of the tested samples, so that only the effect of relative humidity on the longitudinal compressive strength could be assessed. The anatomical structures of OPT and rubberwood were also observed. Samples with sizes of approximately 8 mm × 8 mm × 8 mm (length × width × height) were cut using a disposable steel knife. The samples were mounted on the stubs and then coated with a thin gold layer, using a putter coater. Images were obtained using a LEO Supra 50Vp ultra-high resolution analytical Field Emission-Scanning Electron Microscope (FE-SEM).
RESULTS AND DISCUSSION Theoretically, the relationship between wood
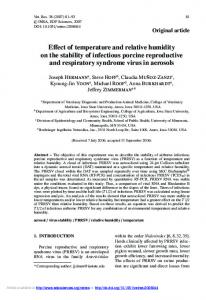
equilibrium moisture content (EMC) and relative humidity, while undergoing cycles of adsorption, desorption and adsorption, is sigmoidal.22 Starting from this theory, extrapolated graphs were plotted based on the experimental values, as shown in Figure 1. The graphs were extrapolated from 0% relative humidity until the fiber saturation point (FSP) obtained in this study. When the relative humidity increased, the EMC of OPT also increased. When the relative humidity decreased, the EMC of OPT also decreased. The EMC during desorption was found to be higher than the EMC during adsorption,17,23 an occurrence also observed for rubberwood. During the adsorption cycle at low relative humidity, water molecules were strongly bonded to cellulose, hemicelluloses and lignin.24 Initially, a monomolecular layer of water molecules was formed, but as more water molecules entered the cell wall and became attached, a polymolecular layer of water molecules was formed. At the same time, the cell wall swelled, creating more room for adsorption and this process continued until saturation. At high relative humidity, until FSP is reached, water is located exclusively in the cell wall, while the lumen is practically empty. Some condensation in the intermicellar and interfibral spaces within the cell wall might also occur. The hysteresis coefficient was calculated at relative humidities of 50%, 65% and 75%, and the values obtained have been listed in Table 1. The hysteresis coefficient for OPT was observed to be slightly higher than that of rubberwood. The effect of EMC changes on the radial and tangential swelling of OPT, compared to rubberwood, is shown in Figure 2. Each data point on the curve is the mean value of twenty samples. The FSP of OPT and rubberwood at 25 °C was obtained by measuring the maximum radial and tangential swelling and the weight of all samples soaked in distilled water taken when a constant reading was noted. A straight line, parallel to the χ-axis was drawn on the graph from the point where the maximum swelling percentage occurred. The point where this line crosses the straight line of the swelling readings as a function of in relative humidity, can be assumed as the FSP of the OPT and of rubberwood, accordingly. At this stage, the dimensional changes of OPT with fluctuating relative humidity, compared to rubberwood, can be observed clearly. The swelling percentages in the radial and tangential directions of OPT increased with the increase of EMC, but
403
OTHMAN SULAIMAN et al.
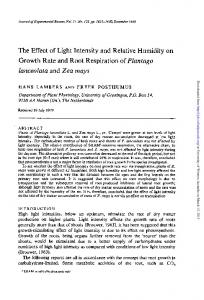
always remained below the FSP. The extrapolated curves indicate the estimated values of FSP for OPT and rubberwood, ranging from 22-25% and 25-27%, respectively. From Figure 2, it can be clearly seen that oil OPT swelled less in both radial and tangential directions, compared to rubberwood. The percent swelling of OPT, from the oven-dried state to the FSP, in the tangential direction was almost similar to that of the radial direction and this value was about 2.2%. This trend seems to be different for rubberwood, where the tangential swelling was higher (5.7%) than radial swelling (3.2%). The ratio of tangential to radial swelling (T/R) at each relative humidity value is shown in Table 2 as an
indicator of dimensional anisotropy.25 The T/R ratio for OPT ranged from 1.03 to 1.12, while that for rubberwood ranged from 1.56 to 2.09. The ratio T/R for OPT was somewhat lower than that of rubberwood, indicating that there was not much difference in the tangential and radial swelling of OPT. However, for rubberwood there was a significant difference between tangential and radial swelling – specifically, much higher swelling was observed in the tangential direction than in the radial direction. All the above results could be explained by the difference in the anatomical structure of OPT and rubberwood, as shown in Figure 3.
Table 1 Hysteresis coefficients for oil palm trunk and rubberwood Relative humidity (%) 50 65 75
Oil palm trunk 0.90 0.67 0.89
Rubberwood 0.92 0.65 0.86
Table 2 Ratio of tangential dimension to radial dimension of oil palm trunk and rubberwood at relative humidity Ratio of tangential dimension to radial dimension (%) Relative humidity (%) Oil palm trunk Rubberwood 65 1.12 1.94 75 1.11 1.81 st 1 Adsorption 80 1.04 1.88 90 0.93 1.95 75 1.04 1.60 65 1.16 1.91 Desorption 50 1.04 2.09 30 1.14 1.91 50 1.03 1.70 nd 2 Adsorption 60 1.03 1.56 N.B. Each value is the mean of 20 parallel measurements
(a) Figure 1: Relationship between equilibrium moisture content and relative humidity of oil palm trunk (a), and rubberwood (b)
404
(b)
Wood properties
(a)
(b) Figure 2: Relationship between radial swelling (a) and tangential swelling (b) with equilibrium moisture content of oil palm trunk and rubberwood
Parenchyma Metaxylem Vessel
Phloem
Metaxylem 100µm
20µm
Fiber
(a)
(b)
Ray parenchyma Starch granule in longitudinal parenchyma
Ground tissue parenchyma
100µm
Vessel
20µm
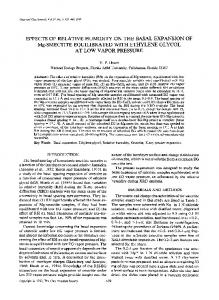
(c) (d) Figure 3: Field Emission-Scanning Electron Micrographs (FE-SEM) of oil palm trunk (a, b, c) and rubberwood (d)
405
OTHMAN SULAIMAN et al.
The vascular bundles of oil palm can be seen to include metaxylem vessels, parenchyma and fiber (Figure 3a). Phloem is also apparent in the vascular bundles, as shown in Figure 3b. The vascular bundle is surrounded by ground tissue parenchyma (Figure 3c). Most of the parenchyma cells are cubical and spherical in shape with extremely thin walls and a large lumen. The fiber cell wall is thicker, compared to that of ground tissue parenchyma. The thicker cell wall has more influence on dimensional changes than does the thinner parenchyma wall. The spherical parenchyma and cylindrical fibers of OPT contributed more or less to the approximate similarity of the shrinkage/swelling values in both radial and tangential directions. Figure 3d shows a cross-section of a rubberwood sample, with vessels, longitudinal parenchyma and ray
parenchyma. The thickness of the rubberwood cell wall is much more homogenous than that of oil palm. Compared to rubberwood, OPT has no radially oriented cells, such as ray parenchyma. The presence of ray parenchyma, which represents strips of cells extending inward from the bark, in rubberwood, probably reduced the swelling of the cells in the radial direction and contributed to the dissimilarity between swelling in the tangential and radial directions. The parallel orientation of microfibrils along the axis of the cell wall and the strands in the fiber walls being bent around the pits, which predominate in the radial walls of the fibers, rather than being parallel to the long axis of the fiber, are also believed to be one of the factors accounting for this difference.26
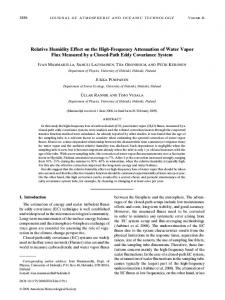
Figure 4: Relationship between longitudinal specific compression strength and relative humidity of oil palm trunk and rubberwood Table 3 Longitudinal specific compression strength of oil palm trunk and rubberwood at different relative humidity Longitudinal specific compression strength Relative (N/mm²) humidity (%) Oil palm trunk Rubberwood 65 46.35 46.59 75 36.72 42.14 st 1 Adsorption 80 35.32 40.99 90 29.81 34.77 75 27.46 43.90 65 30.97 46.92 Desorption 50 32.73 57.41 30 33.75 71.38 2nd 50 33.41 59.01 Adsorption 60 27.53 57.20 N.B. Each value is the mean of 10 parallel measurements
The average specific gravity values obtained for the green OPT and rubberwood were of 0.41
406
and 0.51, respectively. The specific gravity value for OPT is similar to that reported by Lim and
Wood properties Gan11 for samples taken from the peripheral region. Table 3 shows the average specific compression strength values based on specific gravity at each particular relative humidity. The specific compression strength of OPT did not follow any order, it was random or fluctuated with increasing relative humidity; again in the case of rubberwood, it decreased with the increase of relative humidity. Oil palm is known to have variable specific gravity7 and hence it affected compression strength. The correlation between the specific compression strength and the relative humidity of OPT and rubberwood is shown in Figure 4. The specific compression strength of OPT seems to be slightly sensitive to changes in relative humidity, which may be attributed to higher amounts of parenchyma (Figure 3), lower specific gravity (Table 3), and lower FSP (Figure 2) in OPT, compared to rubberwood. CONCLUSIONS The percentage of equilibrium moisture content of oil palm trunk and rubberwood increased with the increase in relative humidity and vice versa. The swelling of oil palm trunk and rubberwood in radial and tangential directions increased with the increase in relative humidity, until the fiber saturation point was reached, which means both oil palm trunk and rubberwood are anisotropic. The radial and tangential swelling and fiber saturation point of oil palm trunk were found lower, compared to those of rubberwood. Oil palm trunk also showed a similar behavior in radial and tangential swelling, whereas rubberwood behaved the other way round – a greater swelling was observed in the tangential direction, compared to the radial direction. The hysteresis coefficient of oil palm trunk was slightly lower than that of rubberwood. The longitudinal specific compression strength of oil palm trunk and rubberwood was influenced by the moisture content, until the fiber saturation point, where the oil palm trunk was found to be weaker than rubberwood. ACKNOWLEDGEMENTS: We are grateful to the Ministry of Higher Education in Malaysia for the FRGS (203/PTEKIND/671016) research grant and to the Central Kedah Plywood Factory for the oil palm samples.
REFERENCES
1
M. Anis, H. Kamaruddin and W. H. Hasamudin, Procs. The 7th National Conference on Oil Palm Tree Utilisation (OPTUC), Kuala Lumpur, 2007, pp. 3-11. 2 O. Sulaiman, N. Salim, R. Hashim, L. H. M. Yusof, W. Razak, N. Y. M. Yunus, W. S. Hashim and M. H. Azmy, Mater. Design, 30(9), 3572 (2009). 3 R. Wahab, H. W. Samsi, A. Mohamed and O. Sulaiman, J. Sustain. Dev., 1(3), 109-113 (2008). 4 K. Nordin, M. J. Ariff, M. Ahmad, H. W. Samsi, A. H. Salleh, Z. Jalaludin, Management of Environmental Quality: An International Journal, 15(5), 484 (2004). 5 O. Sulaiman, R. Hashim, R. Wahab, H. W. Samsi and A. Mohamed, Holz Roh Werkst., 66(1), 5 (2008). 6 J. M. T. P. Ratnasingam, M. Manikam and S. R. Farrokhpayam, Asian J. Appl. Sci., 1(4), 334 (2008). 7 M. Z. Jumaat, A. H. A. Rahim, J. Othman and M. S. Midon, Constr. Build. Mater., 20, 812 (2006). 8 W. Killman and S. C. Lim, Procs. National Symposium on Oil Palm By-Products in Agro-based Industries, Kuala Lumpur, 1985, pp. 18-42. 9 P. F. Akmar and J. F. Kennedy, Wood Sci. Technol., 35, 467 (2001). 10 M. Husin, R. Ramli, A. Mokhtar, W. W. H. Hassan, K. Hassan, R. Mamat and A. A. Aziz, Malaysian Palm Oil Board Bulletin, Palm Oil Developments, 2002. 11 S. C. Lim and K. S. Gan, FRIM Timber Technol. Bulletin, (2005). 12 S. Merakeb, F. Dubois and C. Petit, Wood Sci. Technol., 43, 575 (2009). 13 J. Y. Wang and P. A. Cooper, Holz Roh Werkst., 63, 417 (2005). 14 Y. Ishimaru, K. Arai, M. Mizutani, K. Oshima and I. Iida, J. Wood Sci., 47, 185 (2001). 15 B. Time, Holz Roh Werkst., 60, 271 (2002). 16 L. D. Hartley and F. A. Kamke, Wood Sci. Technol., 26, 83 (1992). 17 A. M. Eligon, A. Achong and R. Saunders, J. Mater. Sci., 27, 3442 (1992). 18 H. Hamdan, C. A. S. Hill, A. Zaidon, U. M. K. Anwar and M. Abd Latif, J. Trop. For. Sci., 19(1), 18 (2007). 19 BS 373: 1957, Standard methods of testing small clear specimens of timber, British Standard Institution London, 1986. 20 R. Hashim, R. J. Murphy, D. J. Dickinson, and J. M. Dinwoodie, Forest Prod. J., 47(1), 61 (1997). 21 J. Kestin, M. Sokolov and W. A. Wakeham, J. Phys. Chem., 7(3), 941 (1978). 22 W. Simpson, Wood and Fiber, 12(3), 183 (1980). 23 H. A. Spalt, Forest Prod. J., 7, 331 (1957). 24 J. Walker, in “Primary Wood Processing Principles and Practice”, edited by J. C. F. Walker, Springer, The Netherlands, 2006, pp. 69-91. 25 R. Arevalo and R. E. Hernandez, Holzforschung, 55(6), 590 (2001). 26 G. J. Ritter and R. L. Mitchell, Paper Industry, 33(10), 1189-1193 (1952).
407