Cane variety and age, month of harvest and the different ... tion ofspecific chemical species which enter the factory with ... ICUMSA method but at pH values of 4, 7 and 9. Phenolic levels were also determined on the extracts .... Percent by mass.
Proceedings of The South African Sugar Technologists' Association - June 1992
THE EFFECT OF SOME SELECTED FACTORS ON THE COLOUR IN CANE By G. R. E. LIONNET
Sugar Milling Research Institute, Durban
Abstract Cane variety and age, month of harvest and the different constituents of the cane were selected for investigation. All these factors were found to influence the colour and phenolic levels. Time of harvest generally had a large effect, with high colours at the beginning and end of the season. Clear evidence of varietal effects was also obtained and the results showed that the different constituents of the clean stalk, more particularly rind, have marked effects on colour. Tops and particularly trash had a very large influence. The age of the cane was the least important of the factors. The phenolic content of the cane was also affected by the time of harvest and by the constituents. It correlated well with colour. Introduction Colour is an important quality parameter of both raw and refined sugars and, as such, has been the subject of many investigations. Several authors have separated colour into two broad categories. The first consists of colour entering the factory with the cane and includes the coloured compounds themselves together with the colour precursors. The second category consists of the colour formed during the sugar recovery operation and covers the effects of a number of processes, such as thermal degradation, the destruction of reducing sugars and Maillard type reactions. It should be noted that the cane composition has a significant effect on the colour formed in the factory. Many of the colour generating processes occurring during the sugar recovery operation depend on the presence and concentration of specific chemical species which enter the factory with the cane. Monosaccharides, for example, are involved in colour formation through Maillard-type reactions and through thermal degradation. If the term "precursor", as applied to the first colour category, is taken to have a wide meaning, then it is evident that the cane itself has a preponderant effect on colour. Recent work (Smith, 1990; Lionnet, 1991) has shown that there is little change in colour from cane to syrup and that VHP sugar colour, under normal South African processing conditi.ons, averages about 6% ofthe syrup colour. The overriding determinant of sugar colour is thus the cane colour itself. There is therefore a need to investigate all the factors that can affect cane colour. These can be divided into two groups, namely controllable, for example variety and presence of extraneous matter, and uncontrollable factors such as climatic conditions. This work deals only with some of the controllable factors. Experimental The following controllable factors were selected for investigation: (a) Month of harvest. It has been shown (Lionnet, 1987) that the time of the year has a pronounced effect on the 121
colour of cane syrups. It is therefore essential to include this factor. (b) Cane variety. It is generally recognised (Anon., 1990) that cane variety can have an effect on colour. It was therefore decided to work with NC0376, N12, Nl4 and N 16 which are four of the most popular varieties in South Africa. (c) Cane constituents. The various constituents of the cane plant, such as tops, trash and rind, are known (Lionnet, 1986; Reid and Lionnet, 1989) to affect colour. This investigation therefore involved the separate analysis of tops, trash, rind, node and internode. Tops, including green leaves, were separated by breaking off at the natural breaking point while trash (all leaves and sheaths beneath the natural breaking point) was collected manually. The clean stalk was peeled manually to yield the rind. The peeled stalk was then divided into nodes and internodes. (d) Cane age. Although there appears to be no definite evidence as to the effect ofcane age on colour, it is generally thought that this factor has an influence. Cane age was therefore included. The average stalk mass and diameter (measured at three points along the length of the clean stalk) were recorded as were the masses of the rind, nodes and internodes. The cane required for this work was supplied by the South African Sugar Association Experiment Station. In all cases it was fresh and free of any disease or pest. Furthermore, the cane used here was grown, as far as possible, under similar conditions, particularly with respect to fertilisation. The various constituents were shredded and analysed by the Direct Analysis of Cane method. Subsamples of the extract were used for the determination of colour by the ICUMSA method but at pH values of 4, 7 and 9. Phenolic levels were also determined on the extracts by the Folin Ciocalteu and Liebermann methods.
Results
Number of observations A fairly large number of tests is needed for the investigation of the selected factors. The number of tests done with respect to variety, month cut and cane age is shown in Tables 1 and 2. As can be seen from these tables, it has not always been possible to cover all the combinations fully.even though this project was done over a period of two years. Because of this and because this work deals with an agricultural, heterogeneous material, it is expected that the scatter in the results will be larger than that found from tests done under laboratory or even factory conditions. It will therefore be necessary to accept lower levels of statistical significance.
Proceedings of The South African Sugar Technologists' Association - June 1992 Table 1 Matrix of variety and month cut
s_taI,=.:.:..k.::ool:.:ou=r:...:(~pH~7..:...1 .:....:(T.:..:OOu8Mda==::.=:...1
---,
26 ....
Variety Month NC0376 January February March April May June July August September October November December
• •• •
NI2
NI4
NI6
•• •
••
•
• •• •••
••• •
• • •
• •
•
•
• •
•
•
•
• •
• •
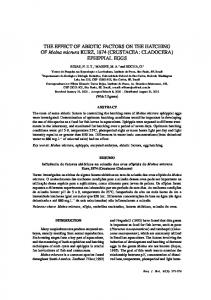
• 6 L---1._....L__.L..-~"""_....L__..L.._~_....J..._..I.___I_....J 1 2 3 4 6 6 7 8 9 10 11 12
Month out FIGURE 1 Clean stalk colour as a function of variety and month cut. Table 2 Matrix of variety and age
Age (months) 8 9 10 II 12 13 14 IS 16 17 18 19 20
II
It is evident that the month during which the cane has been cut has an important effect, a result found by Lionnet (1987) in previous work. NI6 has the highest and NC0376 the lowest colour. The varietal effect is not insignificant and pH 7 colours for 15 month old cane of the four varieties are shown in Table 3. The varieties NC0376 and NI2 show similar colours but the two other varieties have colours which are about 30% higher.
Variety NC0376
NI2
•• •
•
•• • •
• • • •• •
NI4
NI6
•
•
•• •••
••
•
• •
• •
Table 3
• •
•
• •
•
• • •
Colours (pH 7) for 15 month old clean stalks
The average cane age was 14 months for each variety. Although the distribution with respect to month cut is not uniform, averaging of the results should still be meaningful.
Cane stalk The data have been used to regress the clean stalk colour against variety, month cut and cane age. The four varieties have been represented as follows. Two dummy variables, VI and V2, have been used with the respective values of 0 and 0 indicating NC0376, 0 and 1 indicating N12, 1 and 0 indicating NI4 and finally 1 and 1 indicating N16. Age is in months. Month cut is represented by M= I for January, M=2 for February and so on. Previous results have shown that a (M)2 term can also be required. It is possible to use trigonometric functions for processes which are cyclic in nature (Smith, 1991 Personal communication; Hoekstra, 1974). Although the results obtained by the two approaches were similar, the latter is more correct and has been used. Clean stalk, pH 7 colour = 10763 + 3078 VI + 815 V2 + 42 Age + 3609 Cos(30M) + 1680Sin(30M) (1) (n=37; r=0,73) Equation I was, obtained and has been used to calculate the clean stalk colour (pH 7) for 12 month old cane of each variety. This has peen plotted in Figure I. 122
Variety
Average of Jan to Dec
% Difference with respect to NC0376
NC0376 NI2 NI4 NI6
II 530 12 170 14630 IS 272
+ 6% + 27% + 32%
The age effect is less important. The results obtained here show that the pH 7 colour of clean stalks of the NC0376 variety increases by about 1,3%per month ofage, for a range of ages of 8 to 15 months. A test done at a later stage on different cane of the same variety showed an increase of about 1,7% per month, over the same range. The corresponding values for the other varieties are not very different and it appears that the pH 7. colour of clean stalks of the four varieties tested here increases by about 1,5%per month of age over the range of 8 to 15 months.
Rind, nodes and internodes Since the clean stalk consists of rind, nodes and internodes, it is interesting to look at each of these constituents separately. The percentage masses are given in Table 4. The contributions of the nodes and rind to the mass of the clean stalk are quite significant and it is expected that they will have a marked effect on colour. The results have been used to regress colour against variety, month cut and age, as was done with the clean stalk. Equations 2, 3 and 4 were obtained.
Proceedings of The South African Sugar Technologists' Association -June 1992 Table 4
• Nodes are about 4 times and rind about 5 to 6 times more coloured than the internodes. . • An age effect, although small, is also present. It is also possible to calculate a mass of colour. This is usually done as shown in equation 5. . brix % material 100' X colour (5) mass matenal X
Mass percentages of rind, nodes and internodes in clean stalks Percent by mass Variety NC0376 N 12 N 14 N 16
Rind
Nodes
Internodes
30 32 29 29
16 12 15 15
54 56 56 56
Rind, pH 7 colour = 23236 + 7435 VI + 4484 V 2 + 16 Age + 7893 Cos(30M) + 1989 Sin(30M) (2) (n= 37; r=0,74) Nodes, pH 7 colour = 18365 + 3296 VI + 448 V 2 + 52 Age + 7604 Cos(30M) + 4703 Sin(30M) (3) (n=37; r=0,73) Internodes, pH 7 colour = 5816 + 1788 VI + 104 V 2 - 91 Age + 1237 Cos(30M) + 955 Sin(30M) (4) (n=37; r=0,73) Age was generally the least statistically significant variable in these regressions. It is again evident that both month cut and variety have significant effects. Rind colours have been plotted against month cut in Figure 2. 60R ...1...;,:nd:....;O:.:.oI..:..0u,:......:;(pH:......:..:71:,..:(:,..ThouBanda....:...;.;..:.......;..;.:I:......:..:
Equation 5 has been used to calculate the masses of pH 7 colour in internodes, nodes and rind as percentages of the mass of colour in the clean stalk. This is shown in Table 6. The results in this table clearly indicate the importance of the rind as far as the stalk colour is concerned, since it contributes about 50% of the total colour but constitutes 30% of the mass of the stalk while contributing only 22% of the total mass of pol in the stalk. Table 6 Mass of colour in internodes, nodes and rind as percentages of the mass of colour in the clean stalk Variety
Internodes
Nodes
Rind
NC0376 NI2 NI4 NI6
28 24 27 28
25 21 24 22
47 55 49 50
--,
Cane diameter and rindcontent
16 101....-_1_--'-_-I-_....L..._..L-_1....----L_--'-_,.-L-_....L...---J
1
3
2
6
6
7
8
9
10
11
12
Month cut
The impact of the rind on stalk colour is clearly evident. from the previous results. It is therefore interesting to look at some of the factors which influence the rind content of the stalk. It can be shown that, if certain assumptions are made, the percentage mass of the rind can be expressed in terms of the stalk diameter (d) and the rind thickness (t), The relationship is shown by equation 6. Mass rind % mass stalk = 100[d2-(d-2t)2]/d2 (6) Rind % stalk values have been plotted versus stalk diameter in Figure 3 and results, calculated from equation 6 for rind thicknesses of 1,8; 2,0 and 2,2 mm, have been plotted on the graph.
FIGURE 2 Rind colour as a function of variety and month cut.
Average colours (pH 7) for the nodes, internodes and rind are shown in Table 5. The following points can be made from the results in Figure 2 and Table 5.
Rind S stalk
6Or-----------------------, 46
Table 5 Average pH 7 colour for internodes, nodes and rind Variety NCo376 NI2 NI4 NI6
Internodes 4710 4730 6300 . 6310
Nodes
Rind
18860 18950 22420 22520
22880 27 170 30620 34900
• Month cut has an effect on 'all three constituents but the effect is very pronounced with rind and node. • The varietal effect is also present, being again most evident on rind. For example the rind colour for Nl6 is 52% higher than that of NC0376. 123
2.1
2.3
2.6
2.7
2.9
3.1
cane diameter (em) FIGURE 3 Rind % stalk (mass basis) as a function of stalk diameter.
Proceedings of The South African Sugar Technologists' Association - June 1992
, Most of the points fall between the lines representing the 1,8 and 2,2 mm rind thicknesses. It can therefore be concluded that the rind removed during these tests was approximately 2,0 mm thick. Furthermore it is evident that the rind, as defined here, is an important constituent of the clean stalk, ranging from about 25 to 35% of the mass of the stalk. Stalk diameter has an effect on the mass percentage of the rind, as would be expected. Thus the smaller the stalk diameter the higher the percentage of rind, as shown in Figure 3. The results also indicated that both variety and age have an effect on cane diameter. Nl2 had the smallest (23 mm) and Nl4 the highest (26 mm) diameters and diameter generally decreased with age. These effects are however small and it appears that the varieties investigated here tend to have relatively small stalk diameters and thus high rind contents.
Table 8 Indicator values
Internodes Nodes Rind Stalk Tops Trash
Averaged pH 7 colours
Internodes Nodes Rind Clean stalk Tops Trash
NI4
NI6
6,1 4,5 6,9 6,0 2,3 2,2
5,3 3,5 4,8 4,5 2,5 2,0
7,1 4,5 5,3 5,4 2,5 3,1
5,6 4,2 4,2 4,4 2,6 2,3
, Phenolics
Table 7
Materials
NI2
The following points can be made: • The IV's for tops and trash are similar but lower than those found in the stalk. There is thus some indication that the colourants found in tops and in trash could be different from those found in the stalk itself. • According to the rough classification given above, the IV's are generally greater than 5 in the stalk, thus indicating the presence of pigments. In tops and trash the values are between 2 and 3 which indicates the presence of other types of colour bodies. • Varietal effects are not apparent with tops and trash, but a small varietal effect in the stalk could be present.
Tops and trash The results were used in multilinear regressions to test for possible effects of variety, age and month cut on colour. The only statistically significant effects were those of age and month cut on the colour of tops. Again colour was higher at the beginning and end of the season and increased by about 3% per month of age. The most important effect of tops and trash however is the very high level of colour that these materials bring with them. Averaged pH 7 colours are shown in Table 7.
NCo376
pH 7 Colour 5500 20700 28900 13400 139700 640000
It is however more meaningful to compare the masses of colour, as defined by equation 5. In that case I%, by mass, of tops or trash added to the cane would increase the mass of pH 7 colour by 4 and 15% respectively. Tops and trash contents are not readily available but Lamusse (1987) quoted 2,6 and 4,4% as the 1986/87 average for 3 South African mills. This would then represent an increase in the mass of colour of about 75%.
Many workers have shown that phenolics play an important role as far as colour is concerned. Two different empirical reactions (Morel du Boil, 1989) have been used to measure the phenolic content, namely the Folin Ciocalteu and Liebermann reactions. The Folin Ciocalteu test (caffeic acid as standard) depends upon the reaction of tungsten and molybdenum compounds and is a measure of the oxidative properties of the phenolic compound. The Liebermann reaction (gallic acid as standard) depends on the coupling of phenol with diazotised sulphanilic acid and gives a measure of molecular sites of high electron density, that is potential adsorptive sites. These could have an effect on decolourisation processes such as ion exchange. It should be noted that many non-phenolic substances can interfere with both reactions. The interpretation of the results of such blanket empirical analytical methods must therefore be cautious. The Folin and Liebermann phenolics in the clean stalk, expressed as ppm on brix, were regressed against variety, age and month cut. The results are shown in equations 7 and 8. Folin phenolics in stalk = 3262 + Jl8 VI - 184 V2 (ppm on brix) + 55 Age + 655 Cos(30M) - 46 Sin(30M) (7) (n=36; r=0,60) Liebermann phenolics in stalk = 652 + III VI - 18 V2 (ppm on brix) + 128 Cos(30M) + 36 Sin(30M) ......(8)
(n=36; r=0,67) All the variables shown in equations 7 and 8 are statistically significant at least at 10%. Age was not significant in equation 8. The variable with the highest significance (> 5%), in both cases, was month cut, indicating again the importance of climatic effects. The effects of variety and of month cut are shown graphically in Figure 4, for 12 month old cane. The larger of the two effects is the climatic one, with the phenolic content increasing by as much as 55% at the beginning and end of the season, while the varietal effect accounts for maximum differences of around 20%.
Indicator values Indicator value (IV) is the ratio ofcolour at pH 9 to colour at pH 4. Several groups of researchers have used this ratio as an indication of the type of colourant present. It should be noted however that the conclusions could be misleading ifthe interpretation is too rigid. Low IV's (1-3)are associated with high molecular weight colourants and with compounds such as melanoidins, caramels and alkaline degradation products of fructose. Enzymatic colour formation also results in low IV's. Phenolic, flavonoids and other plant pigments tend to show high (5-13) IV's. The averaged values obtained in this work are shown in Table 8. 124
Proceedings of The South African Sugar Technologists' Association - June 1992 6000 ,..:FoI:...ll --::.:phenoI.:..:......;:....I08:..::.....:I.::.,:IJP:....m_o_n_br_l....:xl
-,
3000 L-----L_-L._-L.._..L.----JI...---l.._....I-_..l...-_.l..----l...:...-.....J
1
2
3
4
6
6
7
8
9
10
n
~
Month cut FIGURE 4 Folin phenolics in clean stalk as a function of variety and month cut.
Since phenolics have been associated with colour, their concentrations (ppm on brix) have been regressed against pH 7 colour. Generally, the correlations between these two quantities were positive and statistically significant, confirming the relationship between them. Averaged phenolic contents (ppm on brix) of the various constituents are shown in Table 9. Table 9 Folin (F) and Liebermann (L) phenolics in the cane constituents NI2
Nco376
F Internodes Nodes Rind Stalk Tops Trash
L
F
2070 400 2220 800 4790 3860 7460 890 9360 3570 580 4200 21160 2310 19660 70540 12060 60220
NI6
NI4 L
F
L
410 1040 1370 710 3020 11250
2700 6000 10 340 4850 30040 85930
540 1210 1610 870 3920 19310
F
L
460 2210 4770 920 8310 1340 3940 720 16560 2340 78600 16900
As was found with colour, rind shows high levels. It is also evident that tops and trash can contribute large amounts of phenolics. It is also interesting to look at the ratio of the Folin response to the Liebermann response. The values obtained here for the internodes, nodes and trash showed averages of 5,1 while the averages for rind and tops were 7,1. These values agree reasonably well with those in B- and C-molasses (Morel du Boil, 1989), where the ratios were approximately constant at 5,0 to 5,5. Ratios averaging 5,0 were found in syrup (Lionnet, 1987). It would therefore appear that there are no large changes during the process. Conclusions Four factors, namely the month during which the cane was cut, the variety, the cane age and the cane constituents were selected for investigation. A basic requirement of this type of work is that the factors not investigated must not have significant effects. Although attempts were made to ensure this, some interference is possible. In view of this, only large effects are considered meaningful here. Except for cane age, all the selected factors were found to affect colour. Time of harvest was found to have a statistically highly significant effect, with clean stalk colours being higher by up to 100% at the beginning and end of the season. This factor
also had an effect on the colour of tops which showed a 50% increase at the beginning and end of the season. Trash was the only constituent which showed colour levels independent of the time of harvest. The phenolic content of the cane stalk was also found to be affected by the time of the year. In 12 month old clean stalks, the phenolic content was about 45% higher at ~he beginning and end of the season when compared to midseason levels. There is therefore clear evidence that the seasonal factor has a pronounced effect on the colour of the cane stalk, with trash being the only constituent not affected. This effect persists through the process in factories, resulting in higher liquor and sugar colours at the beginning and end of the season (Smith, 1990; Lionnet, 1987). Clear evidence of varietal effects was also obtained. Generally NC0376 showed the lowest and Nl6 the highest colours the maximum difference being about 30%. The diffe~ences were not the same for all the cane constituents. In the case of rind, which showed the most pronounced varietal effect, Nl2 was 20% higher than NC0376 and N14 35% and N16 50% higher. It is clear that the different constituents of the cane have marked effects on colour. Rind, as defined here, was 30% of the stalk mass but contributed 50% of the mass of colour in the stalk. Stalk diameters for 4 varieties representing about 85% of the cane planted in Mauritius, were obtained (Soopramanien, 1991 Personal communication). These ranged from 2,6 em for M695/69 to 3,8 em for M3035/66, indicating that stalks tend to be larger in Mauritius. Tops and trash showed extremely high levels of colour and could add 75% to the mass of colour found in the stalk. Not much can be done, relatively quickly on the industrial scale, to reduce the effect of the rind on colour but the influence of tops and trash can be controlled. Age of the cane was generally the least statistically significant factor. Some indication was obtained that stalk colour increases by about 1,5% per month, for a range of ages of 8 to IS months. This effect is small particularly when compared to that of the seasonal factor or to that from tops or trash. Indicator values of 2 to 3 were found in tops and trash. Nodes, internodes and rind showed values of 4 to 5 which are indicative of the presence of pigments. Generally the values found in this work were lower than those reported by Lionnet (1986). Both the Folin and Liebermann phenolics correlated well with colour, confirming the importance of this class of compounds as far as colour is concerned. Cane variety, cane age and month cut all affected the concentration of phenolics as would be expected from the results obtained with colour. Again the month cut had the most significant effect. N12 had the lowest and N 14 the highest levels of phenolics. This varietal effect is different to the one for colour, where NC0376 was lowest and N 16 highest. Again, the levels found in tops and trash were much higher than those found in the internode, node and rind. Acknowledgements All the cane for this work was supplied by the South African Sugar Association Experiment Station, through Mr R McIntyre, to whom the author is particularly indebted. The experimental work required by this project was particularly long and tedious and almost all of it was done by Mr P Ramsuraj. Mr M Achary carried out the analytical work for
125
Proceedings of The South African Sugar Technologists' Association - June 1992
the determination of the phenolic compounds and the Analytical Division of the SMRI measured the colours. The author would like to acknowledge their contributions. REFERENCES Anon. (1990). Basic research activitiesat the Experiment Station.S Afr Sug J 74: 24-25. Hoekstra, RJ (1974). The useof trigonometric functions in agronomic analysis. Proc S A/;' Sug Techno! Ass 48: 99-106. Lamusse, JP (1987). Sixty-second annual review of the milling season in Southern Africa (1986-1987). Proc S Afr Sug Techno! Ass 61: 42-61. Lionnet, GRE (1986). An analytical approach for the determination of colour and other impurities in cane. Proc S Afr Sug Techno! Ass 60: 62-65. Lionnet, ORE (1987). Impurity transfer during A massecuite boiling. Proc S Afr Sug Techno! Ass 61: 70-75. . Lionnet, ORE (1991). Sixty-sixth annual review of the milling season in Southern Africa (1990-1991). Proc S Afr Sug Techno! Ass 65: 1-18. Moreldu Boil, PO (1989). The effect of heat on molasses and crystal colour. Some empirical colour related measurements. SMRI Tech Rep 1540, 14 June 1989. 29 pp. Reid, MJ and Lionnet, ORE (1989). The effect of tops and trash on cane milling based on trials at Maidstone. Proc S Afr Sug Techno! Ass 63: 3-6. Smith, IA (1990). A survey of colour input and formation in process. Proc S AIr Sug Techno! Ass 64: 213-216.
126