This article was downloaded by: [VA Healthcare System, Pittsburgh], [Malcolm McNeil] On: 15 July 2015, At: 08:25 Publisher: Routledge Informa Ltd Registered in England and Wales Registered Number: 1072954 Registered office: 5 Howick Place, London, SW1P 1WG
Aphasiology Publication details, including instructions for authors and subscription information: http://www.tandfonline.com/loi/paph20
The effect of speaking rate on serialorder sound-level errors in normal healthy controls and persons with aphasia a
ab
ab
Tepanta R.D. Fossett , Malcolm R. Mcneil , Sheila R. Pratt , acd
Connie A. Tompkins
& Linda I. Shuster
e
a
Department of Communication Science & Disorders, University of Pittsburgh, Pittsburgh, PA, USA b
Geriatric Research Education and Clinical Center, VA Pittsburgh Healthcare System, Pittsburgh, PA, USA
Click for updates
c
Center for the Neural Basis of Cognition, University of Pittsburgh, Pittsburgh, PA, USA d
Carnegie Mellon University, Pittsburgh, PA, USA
e
Department of Speech Pathology & Audiology, West Virginia University, Morgantown, WV, USA Published online: 14 Jul 2015.
To cite this article: Tepanta R.D. Fossett, Malcolm R. Mcneil, Sheila R. Pratt, Connie A. Tompkins & Linda I. Shuster (2015): The effect of speaking rate on serial-order sound-level errors in normal healthy controls and persons with aphasia, Aphasiology, DOI: 10.1080/02687038.2015.1063581 To link to this article: http://dx.doi.org/10.1080/02687038.2015.1063581
PLEASE SCROLL DOWN FOR ARTICLE Taylor & Francis makes every effort to ensure the accuracy of all the information (the “Content”) contained in the publications on our platform. However, Taylor & Francis, our agents, and our licensors make no representations or warranties whatsoever as to the accuracy, completeness, or suitability for any purpose of the Content. Any opinions and views expressed in this publication are the opinions and views of the authors, and are not the views of or endorsed by Taylor & Francis. The accuracy of the Content should not be relied upon and should be independently verified with primary sources of information. Taylor and Francis shall not be liable for any losses, actions, claims, proceedings, demands, costs, expenses, damages, and other liabilities whatsoever or howsoever caused arising directly or indirectly in connection with, in relation to or arising out of the use of the Content.
Downloaded by [VA Healthcare System, Pittsburgh], [Malcolm McNeil] at 08:25 15 July 2015
This article may be used for research, teaching, and private study purposes. Any substantial or systematic reproduction, redistribution, reselling, loan, sub-licensing, systematic supply, or distribution in any form to anyone is expressly forbidden. Terms & Conditions of access and use can be found at http://www.tandfonline.com/page/termsand-conditions
Aphasiology, 2015 http://dx.doi.org/10.1080/02687038.2015.1063581
Downloaded by [VA Healthcare System, Pittsburgh], [Malcolm McNeil] at 08:25 15 July 2015
The effect of speaking rate on serial-order sound-level errors in normal healthy controls and persons with aphasia Tepanta R.D. Fossetta*, Malcolm R. Mcneila,b, Sheila R. Pratta,b, Connie A. Tompkinsa,c,d and Linda I. Shustere a
Department of Communication Science & Disorders, University of Pittsburgh, Pittsburgh, PA, USA; Geriatric Research Education and Clinical Center, VA Pittsburgh Healthcare System, Pittsburgh, PA, USA; cCenter for the Neural Basis of Cognition, University of Pittsburgh, Pittsburgh, PA, USA; d Carnegie Mellon University, Pittsburgh, PA, USA; eDepartment of Speech Pathology & Audiology, West Virginia University, Morgantown, WV, USA
b
(Received 13 September 2014; accepted 1 June 2015) Background: Although many speech errors can be generated at either a linguistic or motoric level of production, phonetically well-formed sound-level serial-order errors are generally assumed to result from disruption of phonologic encoding (PE) processes. An influential model of PE predicts that speaking rate should affect the relative proportion of these serial-order sound errors (anticipations, perseverations, exchanges). These predictions have been extended to, and have special relevance for persons with aphasia (PWA) because of the increased frequency with which speech errors occur and because their localisation within the functional linguistic architecture may help in diagnosis and treatment. Supporting evidence regarding the effect of speaking rate on phonological encoding has been provided by studies using young normal language (NL) speakers and computer simulations. Limited data exist for older NL users and no group data exist for PWA. Aims: This study tested the phonologic encoding properties of Dell’s model of speech production, which predicts that increasing speaking rate affects the relative proportion of serial-order sound errors (i.e., anticipations, perseverations and exchanges). Methods & Procedures: The effects of speech rate on the error ratios of anticipation/ exchange (AE), anticipation/perseveration (AP) and vocal reaction time (VRT) were examined in 16 normal healthy controls (NHC) and 16 PWA without concomitant motor speech disorders. The participants were recorded performing a phonologically challenging (tongue twister) speech production task at their typical and two faster speaking rates. Outcomes & Results: A significant effect of increased rate was obtained for the AP but not the AE ratio. Significant effects of group and rate were obtained for VRT. Conclusion: Although the significant effect of rate for the AP ratio provided evidence that changes in speaking rate did affect PE, the results failed to support the modelderived predictions regarding the direction of change for error-type proportions. The current findings argued for an alternative concept of the role of activation and decay in influencing types of serial-order sound errors. Rather than a slow activation decay rate, the results of the current study were more compatible with an alternative explanation of rapid activation decay or slow build-up of residual activation.
*Corresponding author. Email:
[email protected] Present affiliation for Tepanta R.D. Fossett is Department of Speech and Language Pathology, Loyola University Maryland. Present affiliation for Linda I. Shuster is Department of Communication Sciences & Disorders, Grand Valley State University. © 2015 Taylor & Francis
2
T.R.D. Fossett et al.
Downloaded by [VA Healthcare System, Pittsburgh], [Malcolm McNeil] at 08:25 15 July 2015
Keywords: phonologic encoding; speech production; aphasia; serial-order errors; speech rate
Speech production is not an error-free process for normal healthy control (NHC) speakers or for persons with aphasia (PWA). The phonologic encoding (PE) of speech production involves the selection, retrieval and sequencing of sounds appropriate for the intended target production. Errors in PE, including phonological paraphasias (e.g., serial-order errors, including transposition (exchange), anticipation and perseveration errors (Schwartz, Saffran, Bloch, & Dell, 1994)), frequently occur in both healthy (Boomer & Laver, 1973; Cohen, 1973; Frisch & Wright, 2002; MacKay & James, 2004) and disordered speakers (Blumstein, 1973; Schwartz et al., 1994; Wilshire & McCarthy, 1996). At least one dominant speech production model (Dell, 1986) has identified linguistic (e.g., phonemic similarity) and motor-level (e.g., speaking rate) variables that might influence accurate sound production. Dell proposed a model that describes processing at the semantic, syntactic, morphologic and phonologic levels, but is most completely specified at the PE level. This theoretical account specifies how serial order is maintained, the relationship between specific variables (e.g., speaking rate) identified as relevant for serial-order behaviour and how whole segment serial-order (anticipations, perseverations, exchanges) errors occur. The model proposes the mechanism of bi-directional spreading activation between/among processing levels, and emphasises the excitatory characteristics of processing within this framework. Spreading activation and decay rates reflect the rate of processing among levels and based on the model, the rate of processing in the lexical network is assumed to be constant. Bi-directional spreading activation allows for feedback among processing levels. Here the focus is limited specifically to the level of phonologic encoding and associated phonemes. Unique to this model and specifically related to the temporal nature of spreading activation are predictions regarding phonological encoding and the manipulation of processing time. Serial-order errors may result as a consequence of the manner in which activation spreads. Serial-order is maintained as a function of turning off the activation of previously produced target units, activating the immediate target unit and priming the future activation of targets to be produced (Martin & Dell, 2004). For example, an anticipation error is likely when there is altered activation of the current target unit and priming of the activation of a future phoneme target. A perseverative error is likely with altered activation of the current target unit and failure to extinguish the activation of a previous target unit (Martin & Dell, 2004, p. 351). Altered activation strengths along with the rate of activation affect relative activation levels of other target and competing units, and also influence the residual activation of recently produced targets. Weak connections enhance the effect of residual activation and lead to more perseverative errors. Reduced activation strength (such as that resulting from aphasia) creates an environment that is vulnerable to disruption (Martin & Dell, 2004). Schwartz et al. (1994) and Dell, Burger, and Svec (1997) proposed that speaking rate and aphasia influence the occurrence of serial-order errors and that these variables are associated with reduced connection strength, as compared to an intact, future-oriented system. According to the Dell (1986) model, the interaction of speaking rate and spreading activation can affect PE such that predicted ratio patterns of anticipations, exchanges and perseverations may occur. Dell predicted that anticipation errors would be more likely at slower speaking rates because the increased time for encoding allows the sound selected in error to be activated, experience activation decay and then rebound to a high enough level to be re-selected in its appropriate location. At fast speaking rates, an exchange error
Downloaded by [VA Healthcare System, Pittsburgh], [Malcolm McNeil] at 08:25 15 July 2015
Aphasiology
3
is likely because activation from an anticipated sound does not have time to decay and rebound and thus cannot be chosen again for its intended location. Consequently, Dell predicted that the ratio of sound-level exchange to anticipation errors should decrease at slower speaking rates. Perseveration errors occur more frequently at faster speaking rates because of the decreased amount of time between previously encoded units and current targets. Though there were methodological differences in determining error ratios, the speaking rates themselves and whether speaking rate manipulation was within or between subjects, results of examined error patterns in young NHCs, from both Dell (1986) and Dell, Burger, et al., (1997) provided some support for these predictions. These predictions contrast the perspective of McNeil and Kent (1990) who asserted that manipulating speaking rate should selectively affect speech motor processes. Alternatively, Levelt (1989) suggested that speaking rate potentially affects all aspects of PE, physical production of the message (including pause insertion) and manipulation of the actual duration of produced units. Levelt’s model does not make predictions regarding speaking rate, aphasia and the occurrence of serial-order errors. It should be noted that the studies of Dell (1986) and colleagues (Dell, Burger, et al., 1997) do not address motor planning/programming processes, nor provide measures to indicate the time course of such processing (i.e., vocal reaction time (VRT)), relative to articulation. Thus, changes in performance as a result of the speaking rate manipulation may have resulted from changes in the available time for PE, motor response planning or both. Vocal reaction time has been used to capture the time course of stages of information processing (Fozo & Watson, 1998; Schmidt & Lee, 2014). In speech production, this includes cognitive-linguistic processing (Kello, 2003) and response preparation (Klapp, 2003; Maas & Mailend, 2012) for motor-level processes. Previous investigations have yielded conflicting results regarding the effects of pre-speech initiation response time on production accuracy (Deal & Darley, 1972; Mailend & Maas, 2013; Towne & Crary, 1988) in patients with impaired PE and/or motor-speech. Towne and Crary (1988) examined verbal reaction time in three patients with post-stroke, left-hemisphere lesions (one anterior, two posterior) in a single-word reading task with both a delay and no delay condition. Of the two participants who produced both correct and incorrect responses, production accuracy increased in the delay condition for the participant with the anterior lesion. Verbal reaction times for the posterior participant, who produced incorrect responses, did not differ from the control group reaction times in either delay condition. Verbal reaction times prior to the initiation of speech for the patient with the anterior lesion were longer than that of the control group. Faster verbal reaction times were obtained in the delay condition for all participants. Deal and Darley (1972) reported no effect of delay on phonemic accuracy in 12 participants identified as speakers with apraxia of speech (AOS). In a delayed picture-word interference task including healthy controls and participants with aphasia and AOS and aphasia only, Mailend and Maas (2013) reported no significant VRT differences between the participants with aphasia without motor speech disorder and their healthy control participants. However, other studies examining speech production involving controls (Dell, Burger, et al., 1997) and/or neurologically impaired participants (Schwartz et al., 1994) have not controlled for or otherwise evaluated the effect of response time on speech production performance, including phonological encoding. Dell’s (1986) model has been theoretically and experimentally extended to aspects of semantic and phonological performance in PWA (Dell, Schwartz, Martin, Saffran, & Gagnon, 1997; Martin, Dell, Saffran, & Schwartz, 1994; Schwartz et al., 1994). Dell, Burger, et al. (1997) proposed that aphasia should lower the ratio of anticipation and
Downloaded by [VA Healthcare System, Pittsburgh], [Malcolm McNeil] at 08:25 15 July 2015
4
T.R.D. Fossett et al.
perseveration errors (AP proportion) (calculated as the number of anticipations/number of anticipations + perseverations). Martin and Dell (2004) and Dell, Burger, et al. (1997) have suggested that the brain damage in aphasia reduces connection weights and that both faster speaking rates and brain damage in aphasia result in less activated targets. Thus, it is reasonable to hypothesise different serial-order error ratios between NHCs and PWA as well as differences depending on speaking rate. It is expected that with increasing speaking rates and aphasia, PWA should produce significantly more perseveration and exchange errors than NHCs and that all participants should produce more of these error types at faster speaking rates. It is expected that faster than normal speaking rates will differentially affect PWA because of the presence of brain injury and the demands of increased speaking rate. There is evidence that phonological errors associated with aphasia (regardless of aphasia type) are similar to those of normal slips of the tongue (Buckingham, 1992; Schwartz et al., 1994) and include serial-order errors as well as sound substitutions (Blumstein, 1973). However, interpretation of the level of processing disruption associated with the sound-level errors in PWA has been questioned due to several factors, including the common co-occurrence of dysarthria or AOS with aphasia and the precision of perceptual analyses (McNeil & Kent, 1990; Odell, McNeil, Rosenbek, & Hunter, 1990). The perceptual analyses in most studies have used broad phonetic transcription to describe sound-level production errors, though there is evidence to suggest that this level of precision may obscure the accurate interpretation of such errors (Odell et al., 1990). McNeil, Robin, and Schmidt (2009) argued for the use of narrow phonetic transcription for speech production errors when perceptual analysis is used so that detailed characteristics of the speech error might be captured rather than categorising only the phonological category in which it is perceived. Without broad phonetic transcription it is not possible to determine if sound production errors are errors that can be attributed solely to the level of PE (McNeil et al., 2009; Shuster & Wambaugh, 2000). However, some researchers espouse an interaction between phonologic and phonetic processing and have questioned whether different types of sound errors can be attributed to a specific stage of phonologic–phonetic processing (Laganaro, 2012; Pouplier, Marin, & Waiti, 2014). An argument against this obligatory interaction is that these error types do show double dissociations. That is, persons with PE errors but without evidence of motor impairments (dysarthria or AOS) are frequently encountered. Likewise, persons without PE errors but with motor speech disorders also do occur (McNeil et al., 2009). Phonological-level errors should include serial-order errors, and potentially phoneme substitutions1 (errors of selection) that are without distortions (McNeil et al., 2009; Van Der Merwe, 2009). Speech production errors that result from disruption to motor planning and motor programming processes (i.e., most dysarthria types and AOS) should result in temporally or spatially disrupted speech (including delayed speech onset), and as supported by perceptual (Haley, Bays, & Ohde, 2001), acoustic and physiologic investigations (McNeil & Kent, 1990), result in sound-level errors that are perceived or measured as distortions. A variety of speech errors are associated with the impairments of aphasia, apraxia and the dysarthrias. McNeil and Kent (1990) and McNeil et al. (2009) state that speech errors have traditionally been used for classification within these neurological impairments. McNeil et al. proposed that some speech errors can be confidently attributed to either the linguistic or motor levels; however, many error types can be generated at either level. For example, a speech error characterised as a sound substitution might result from an incorrectly selected phoneme, a motor planning error where degrees of co-articulation are assigned or from a timing error during articulatory execution. From the perspective of
Downloaded by [VA Healthcare System, Pittsburgh], [Malcolm McNeil] at 08:25 15 July 2015
Aphasiology
5
McNeil and Kent (1990), only errors that are the result of an incorrectly selected phoneme, or an error in slot construction or assignment may be assigned to a linguistic level. These researchers suggest that sound-sequencing errors can be attributed to only the linguistic level and distortion errors only to the motor level. Currently, accepted criteria for differential diagnosis of AOS from phonologic paraphasias (Wambaugh, Duffy, McNeil, Robin, & Rogers, 2006) include reference to the type of produced sound error (distorted vs. phonologic paraphasia). Thus, this perspective suggests little confidence can be placed in level assignment of any errors other than non-distorted serial-order and distortion errors until more definitive knowledge about the linguistic–motoric interaction is known and can be incorporated into the descriptions and explanations of various disorders. Dell (1986) and others (Acheson & MacDonald, 2009) have identified phonologic similarity as one variable that might affect accurate sound production, as phonologically similar items, have fewer distinguishing features (Roelofs, 1999) and a higher percentage of errors for response accuracy when place and manner are shared (Rogers & Storkel, 1998). Roelofs (1997) posited that featural similarity effects occur because features are part of the phonetic/mental syllabary (a store that is important for translation of phonologic to phonetic information) and target phonemes and the substituting erred phoneme typically share features. Thus, there is both experimental and theoretical support that manipulation of phonologic similarity may influence PE. Indeed, PE errors occur spontaneously in conversational speech but erred productions may be enhanced in experimental tasks by manipulating phoneme similarity (Wilshire, 1999). PE error rates ranging from 4% to 13% have been obtained in tasks manipulating phoneme similarity and repetition pattern in NHC middle-aged adult speakers, with higher percentages in tasks that also require multiple stimulus repetitions (Wilshire, 1999). Wilshire (1999) reported a high proportion of anticipation errors (about 78%), but few perseveration errors (about 22%) in these NHC speakers. Because many of the results paralleled those found with other elicitation methods (Baars, Motley, & MacKay, 1975; Dell, 1986), Wilshire argued for the validity of using the tongue twister paradigm for investigations of PE. The current study examined the effects of speech rate on the ratio of phonological sequencing errors—anticipation/exchange (AE) and anticipation/perseveration (AP) errors, in NHCs and in PWA who were without concomitant motor speech disorders. It is assumed that errors produced without distortion represent errors of PE. Each error ratio was calculated with the anticipation error count in the numerator and the exchange and perseveration error counts in the denominator for the AE (anticipations/exchanges) and AP (anticipations/perseverations) error ratios, respectively. Significant differences and interactions for speaking rate (normal, fast, faster) and participant group (NHC, PWA) were examined. It was predicted that there would be a significant decrease in the ratio of AP (anticipation/perseveration) errors with increased speaking rates for both participant groups. A significant interaction was predicted between speaking rate and group, with PWA producing significantly more perseveration errors than NHC at the faster than typical speaking rates, due to the rate manipulation as well as brain damage. Similarly, it was predicted that AE (anticipation/exchange) errors would decrease with increasing speaking rate for both groups and there would be a significant interaction between speaking rate and group with a significantly lower AE ratio at the faster rate for the PWA than NHC. Finally, it was predicted that there would be no difference in vocal reaction time across speaking rate for either group, as well as no significant interactions. The predictions of the model have special relevance for persons with aphasia (PWA)
6
T.R.D. Fossett et al.
because of the increased frequency with which speech errors occur in this population and because understanding the mechanism may influence diagnosis and intervention. Methods Participants
Downloaded by [VA Healthcare System, Pittsburgh], [Malcolm McNeil] at 08:25 15 July 2015
Demographic information Thirty-two adult (16 NHC and16 PWA) native speakers of English volunteered as participants. The NHC and PWA ranged in age between 41–75, (M = 60; SD = 10.2) and 36–77 (M = 56, SD = 11.08), respectively. The mean years of education were 16.38 and 15.19 for the NHCs and the PWA, respectively. Table 1 presents demographic information for all participants and the lesion data for the PWA when it was available from medical records. Screening measures The NHCs were without a history or evidence of speech, language, cognitive or neurologic deficits as indicated by self-report and measured by a large battery of standardised speech, language and cognitive tests administered by a licensed and professionally certified speech-language pathologist as reported below. The PWA met the criteria for the definition of aphasia (inefficiency with verbal symbolic processing) as proposed by McNeil and Pratt (2001) and were selected based on their performance on the Revised Token Test (RTT; McNeil & Prescott, 1978) and the shortened version of the Porch Index of Communicative Abilities (SPICA; DiSimoni, Keith, & Darley, 1980), a multi-modality Table 1. (PWA).
Demographic information for normal healthy controls (NHC) and persons with aphasia
NHC 1 2 3 4 5 6 7 8 9 10 11 12 13 14 15 16 M SD
Age
Education
63 58 75 72 55
14 12 18 12 16
67 73 72 53 66 62 56 49 41 53 47 60 10.2
16 16 16 16 16 18 16 18 18 18 22 16.38 2.45
PWA 1 2 3 4 5 6 7 8 9 10 11 12 13 14 15 16
Age
Education
51 52 65 46 70
14 16 16 18 14
70 51 52 50 60 66 53 45 77 36 48 56 11.08
16 16 20 18 12 16 12 12 16 13 14 15.19 2.34
Lesion data L post. temporal; L inferior parietal — — L MCA; L frontotemporal Periventricular white matter; chronic ischemic effect L temporal and frontal — — L frontotemporal extending into BG — — L BG; posterior parietal L MCA distribution L post. temporal-parietal Ant. and post. L MCA; L putamen —
Notes: Years of education represents a minimum number of years as some participants had completed additional education that did not result in another degree (i.e., post graduate work). Ant. = anterior; BG = Basal Ganglia; L = Left; MCA = Middle Cerebral Artery; Post. = posterior
Downloaded by [VA Healthcare System, Pittsburgh], [Malcolm McNeil] at 08:25 15 July 2015
Aphasiology
7
measure of language processing. This measure included the following verbal subtests: naming, imitative naming, object functions and sentence completion. Additionally, prior to the experimental task, all participants were administered a sentence repetition task consisting of eight non-phonologically challenging sentences. Participants were required to repeat at least six of the eight sentences without fillers (e.g., “uh” or “something”) and with the same number of syllables as the target sentence to be included in the study. All participants passed a pure tone audiometric screening at 30 dB HL in at least one ear and demonstrated word recognition scores above 67% on the Picture Identification Task (PIT; Wilson & Antablin, 1980). They performed within the range of NHCs on nonverbal reasoning skills (above the 5th percentile) as measured by the Raven’s Coloured Progressive Matrices (RCPM; Raven, 1965, 1988) and verbal intermediateterm memory as measured by the Story-Retelling (immediate/delayed) subtest from the Arizona Battery for Communication Disorders in Dementia (ABCD; Bayles & Tomoeda, 1993). The NHCs performed above the cut-off score of the 1st percentile for auditory language processing as measured by the 55-item version (Arvedson, McNeil & West, 1986) of the Revised Token Test (RTT) (McNeil & Prescott, 1978) and ranged from the 2nd to 100th percentile for NHC participants (M = 48.44, SD = 28.89). The PWA ranged from the 2nd to 91st percentile (M = 74.50, SD = 25.75) for left-hemisphere braindamaged PWA. SPICA percentiles (estimated using the full 180-item PICA (Porch, 1981) normative data for PWA) ranged from 57 to 96 (M = 80.81, SD = 11.11) for the PWA. The PWA were administered some subtests from the short version of the Boston Diagnostic Aphasia Examination (BDAE; Goodglass, Kaplan, & Barresi, 2001) summarised in Table 2. The shortened version of the Boston Naming Test (BNT; Kaplan, Goodglass & Weintraub, 2001) was administered and yielded a mean percentage score of 81.5 (SD = 16.26) with a range of 40–100. Based on these measures, the language production abilities of the PWA ranged from mild to moderate severity. Screening and descriptive data for all participants are summarised in Tables 1 and 2. Subtests from the Apraxia Battery for Adults-2 (ABA) (Dabul, 2000) and the Dysarthria Examination Battery (DEB; Drummond, 1993) were administered to all participants to elicit behaviours from which the presence of AOS and dysarthria were judged. Twelve participants with dysarthria or AOS were excluded. The presence of dysarthria was independently perceptually judged by the first and second authors, both licensed and certified speech-language pathologists experienced in the diagnosis of motor speech disorders. These judgments considered speech and voice characteristics that contribute to the diagnosis of a motor speech disorder (Darley, Aronson, & Brown, 1969a, 1969b). Criteria for determining the presence/absence of AOS were also based on characteristics defined by McNeil et al. (2009), and included the following: prolonged vowel and consonant durations in multisyllabic words, increased inter-segment durations and the presence of sound-level distortions (including distorted serial-order phoneme errors) and distorted sound substitutions. Measures of phonologic processing and working memory span are summarised in Table 2 of supplemental data. As expected, the PWA performed significantly more poorly than the NHC on all of these measures as tested with ANOVA and nonparametric procedures. Stimuli The stimuli consisted of 36 phonologically challenging “tongue twister” sentences (12 experimental and 24 fillers) previously used by Fossett, McNeil, and Pratt (2000) and adapted from previously published stimuli and children’s literature (supplemental data).
a
100 100 100 100 94 100 68 100 100 100 100 100 100 97 100 94 97.06 8.03
Word comp
90 100 100 100 100 90 80 100 100 90 90 100 100 100 90 100 95.63 6.29
Commands 67 100 100 83 83 67 67 100 100 100 100 100 100 100 100 100 91.69 13.51
Complex ideational material 100 100 100 100 100 100 100 100 100 100 83 100 100 100 100 100 98.94 4.25
Oral expressions 100 100 80 100 100 100 100 100 100 60 100 100 80 100 100 100 95.00 11.55
Automatised sequences 100 100 50 100 100 100 100 100 100 50 100 100 100 50 100 100 90.63 20.16
Repetition of single words
Descriptive data for persons with aphasia (PWA) on the Boston Diagnostic Aphasia Examination (BDAE).
Note: aWord comp = word comprehension; bBNT short = Boston Naming Test (15 item short version).
1 2 3 4 5 6 7 8 9 10 11 12 13 14 15 16 M (SD)
Participant
Table 2.
90 100 100 100 100 100 90 100 100 100 90 100 90 100 100 100 97.50 4.47
Repetition of short sentences
Downloaded by [VA Healthcare System, Pittsburgh], [Malcolm McNeil] at 08:25 15 July 2015
87 87 73 100 60 86 73 93 93 40 86 100 66 100 80 80 81.50 16.26
BNT short
b
8 T.R.D. Fossett et al.
Downloaded by [VA Healthcare System, Pittsburgh], [Malcolm McNeil] at 08:25 15 July 2015
Aphasiology
9
Experimental and filler stimuli were seven or eight syllables in length. Sentence production difficulty for experimental stimuli was increased beyond that of the filler sentences by the presence of similar and repeating phonemes. Filler stimuli were included to discourage early responses (i.e., responding before the signal to produce the experimental sentence). The stimuli were produced by a male speaker seated in a sound attenuated booth and recorded at a rate of approximately 3 syllables per second, with a head-mounted condenser microphone (Crown CM 312) and digitised on a Macintosh desktop computer at a rate of 22 kHz. Using sound-editing software (Superscope), the productions were equalised across sentences for intensity and duration (range 3–4 s). After editing, an independent listener transcribed the sentences orthographically and if any word within a sentence was not identified correctly the sentences were re-edited until another independent listener was able to identify all words within all sentences correctly. The stimuli were presented electronically from a Dell laptop computer, using the E-Prime 2.0 software (Psychology Software Tools, Pittsburgh, PA, USA; Schneider, Eschman, & Zuccolotto, 2002). Experimental procedures Each participant was evaluated individually in a quiet room (laboratory, hospital or nursing care facility, or participant’s home) after providing informed consent in compliance with primary and site-specific Institutional Review Board requirements. All of the screening and experimental procedures were completed within two weeks and within 3 sessions for all but two participants with PWA (4 and 5 sessions). Most PWA and NHCs completed the protocol in about 3½ hrs. Participants repeated each experimental sentence one time in each of three speaking rate conditions: typical, fast and faster. Rate conditions were defined relative to each participant’s own speaking rate. All experimental and filler sentences were presented in each speaking rate condition. Both the sentences and task instructions were presented from the computer with signals routed through a portable audiometer (Maico MA 25) to insert earphones (EarTone 3A). The presentation level was 55 dB HL unless a participant requested a higher level. A 100 ms, 1000 Hz tone followed all stimuli that were to be produced by the participants (experimental sentences only) and the participants were asked to begin their responses as quickly as possible after hearing the tone. A 6-inch horizontal line intersected by three vertical lines was displayed on the computer screen and the examiner pointed to a vertical line to indicate the target speaking-rate for each condition. The examiner also controlled the inter-stimulus presentation rate to allow for anticipated variability in production time among participants. One channel of the portable audiometer was monitored to ensure that the stimuli were presented as intended and that participants were responding to target stimuli and not fillers. Prior to starting the experiment, participants were given 32 practice sentences. The sentences were presented randomly within rate condition, and condition order was counterbalanced across participants. A 2-min break was provided after every 36 trials and before instructions to produce the stimuli at the next rate (See online supplemental data for instructions). Rate compliance was encouraged as necessary, with both spoken (e.g., “go a little faster”) and non-spoken cues (i.e., pointing to the appropriate mark on the visual scale). Participants’ productions and all of the experimental and filler stimuli were recorded with a head-mounted condenser microphone (Crown CM 312) positioned 1 in from the corner of the mouth and connected to a Tascam Porta 02MKII audio recorder. Participants
10
T.R.D. Fossett et al.
also wore an omni-directional lavalier microphone (Audio-Technic ATR335) that was connected to the computer via a response box that activated a trigger when a production was initiated.
Downloaded by [VA Healthcare System, Pittsburgh], [Malcolm McNeil] at 08:25 15 July 2015
Response recording and analysis Productions were digitised with the Computerized Speech Laboratory (CSL; Kay Elemetrics, Lincoln Park, NJ, USA) at a sampling rate of 25 kHz. Recordings included the tone cue through the end of the participant’s production (plus 1 sec post-termination of production when possible) with an allowable maximum sample length of 12 sec. Stimuli were digitised to facilitate analysis should any portion of the participant’s production be unintelligible. Data organisation Because the questions addressed in this study were based on assumptions about the timecourse, mechanisms of spreading activation and the phonological error proportions related to changes in speaking rate, the responses collected from the fast and faster conditions were re-categorised to reflect actual produced speaking rate for each response relative to the participant's typical speaking rate productions. All tokens were categorised as “typical” that were produced up to the M + 1 SD of the “typical” speaking rate, regardless of the conditions at which the token was originally elicited. That is, productions that were elicited at the “faster” condition but that fell within the M + 1 SD of the individual participant's typical rate productions were re-categorised and analysed as “typical” rate productions. Responses produced faster than the M + 1 SD of the “typical” rate and up to the M + 1 SD of those originally categorised “fast” were categorised as “fast”. Any responses that exceeded the M + 1 SD of the original fast rate were categorised or recategorised as “faster”. Transcription and transcription reliability All utterances were transcribed by the first author with broad phonetic transcription unless perceived to be distorted, in which case they were narrowly transcribed using the phonetic transcription conventions of Shriberg and Kent (1995). Inter- and intra-rater reliabilities were obtained on 16% of the target stimuli (2 tokens from each rate condition) for each participant (transcripts were based on fewer tokens for some participants due to insufficient erred productions). Transcription procedures are detailed in the supplemental data. Inter-rater reliability results for broad phonetic transcription yielded point-to-point agreement of 94% and 88% for the NHC and PWA groups, respectively. Agreement regarding the presence of a distortion and thus a need for narrow phonetic transcription was 55%. Identification of the same distorted phoneme was high for both the NHC (100%) and PWA (95%) groups. Similar inter-rater agreements were achieved for identification of the specific distortion (i.e., same diacritic symbol) with 100% and 91% for NHC and PWA participants, respectively. Error coding and error coding reliability Subsequent to transcription, error type was coded. Categories included non-distorted and distorted serial-order errors (i.e., anticipation, perseveration and exchange errors). Other
Downloaded by [VA Healthcare System, Pittsburgh], [Malcolm McNeil] at 08:25 15 July 2015
Aphasiology
11
sound error types were coded for descriptive purposes (See supplemental data for definitions and scoring rules for all error types). The data contributing to the serial-order error ratios in this study are limited to those determined to be produced without distortion (but see Buchwald & Miozzo, 2012 for a contrasting perspective). Inter-rater reliability was obtained on 25% of erred stimuli at each speaking rate for four participants from each group. The percentage of agreement at each speaking rate for NHC participants regardless of error type was 100% and for PWA it ranged from 53% to 79% with an average of 70%. Inter-rater agreement was 53% for serial-order errors for PWA at the faster speaking rate and 79% and 75% for typical and fast rates, respectively.
Phonological error opportunities To determine the proportion of phonological error types produced, it was necessary to first determine the number of opportunities for each error type to occur within a target sentence. Thus, each sound from each phonetically transcribed target sentence was judged as to whether or not that sound could replace or exchange positions with any other sound in the sentence and not violate the phonotactic rules of American English (e.g., a schwa could not replace a vowel in a stressed syllable, because the schwa sound only occurs in unstressed syllables). The error opportunities (potential errors) in each of the 12 target stimuli for each phonological error type and the rules used to determine phonological error opportunities are detailed in Table 3 of the Supplemental data.
Acoustic measurement For a response to be eligible for acoustic analysis it had to contain the same number of syllables as the target, be without false starts, speech interruptions (i.e., “um”), non-speech interruptions (i.e., coughs) or place holder words (i.e., “something” or “ahhh”). Productions containing non-words, phonological errors and distortions were included as long as they met other inclusion criteria. Vocal reaction time (VRT) and speaking rate based on total duration were measured from waveform and wide-band spectrogram (286 Hz bandwidth) displays using the CSL acoustic analysis software. Information from both the waveform and the spectrogram was used to guide measurement decisions. The VRT was defined as the time from the offset of the tone to the initiation of sound production. VRT measurements included erred productions as they were intended to reflect the time course within which compromised processing occurred. Total duration was defined as the time from the initiation to termination of production of the experimental sentence and speaking rate was based on syllables per s. Inter- and intra-judge reliability from two judges was obtained on 17% and 44% of the target stimuli for NHC and PWA, respectively, using Pearson Product Moment or Spearman Rho correlation coefficients. For NHC, inter- and intra-judge reliability for VRT ranged from .97 to 1.0 (M = .99; M = .99), respectively. For PWA, both inter- and intra-judge reliability for VRT was 1.0. Speaking rate decisions were based on the total duration of the produced sentence. Inter-judge reliability for speaking rate for NHC was 1.0 and intra-judge reliability ranged from .98 to 1.0 (M = .99). Inter-judge speaking rate reliability ranged from .98 to 1.0 (M = .99) and intra-judge reliability was 1.0 for PWA.
12
T.R.D. Fossett et al.
Results
A total of 69% (399/576) of the productions from NHCs and 27% (157/576) of the productions from PWA were eligible for acoustic and perceptual analyses. The total number of re-categorised sentences for the typical, fast and faster speaking rates was 139, 185 and 75 for the NHC participants and 66, 62 and 29 for the PWA, respectively. See the Supplemental data (Table 4) for eligibility criteria and total number of recategorised sentences for individual NHC and PWA at each speaking rate. Data description
Error Percentage
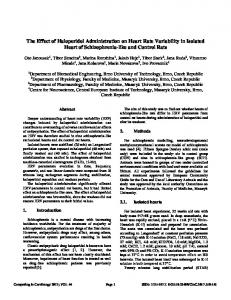
The mean percentage of errors (number/opportunity) either remained the same or increased with increasing speaking rate for all error types for NHC, except for a decrease in the mean percentage of perseveration errors from the “fast” to “faster” speaking rate conditions. For PWA, the mean percentages of errors varied with increases in anticipation errors, decreases in perseveration errors with increasing speaking rate and decreased exchange errors from the typical to fast speaking rates, but an increase from the fast to faster speaking rates. Figures 1 and 2 present the pattern of performance on each of the 1.4% 1.2% 1.0% 0.8% 0.6% 0.4% 0.2% 0.0%
Anticipations Exchanges Perseverations
Typical
Fast
Faster
Speaking Rate
Figure 1. Percentage of each error type relative to the opportunities for the error to occur for normal healthy controls (NHC).
1.4% Error Percentage
Downloaded by [VA Healthcare System, Pittsburgh], [Malcolm McNeil] at 08:25 15 July 2015
Analyses Missing data
1.2% 1.0%
Anticipations
0.8%
Exchanges
0.6%
Perseverations
0.4% 0.2% 0.0% Typical
Fast
Faster
Speaking rate
Figure 2. Percentage of each error type relative to the opportunities for the error to occur for persons with aphasia (PWA).
Aphasiology
13
Statistical analyses Arcsine transformations were applied to normalise error-data distributions for sound error types. An alpha level of .05 was used for all comparisons. ANOVA results for the AP ratio revealed a significant main effect for rate, F(2,46) = 4.773, p = .01, η2 = .17, and a nonsignificant main effect for group, F(1,23) = .512, p = .48, η2 = .02, (power = .11), and no significant interaction, F(2,46) = 1.477, p = .24, η2 = .06, (power = .30). Post hoc analyses with a Bonferroni adjustment for multiple comparisons revealed a significant (p = .02) increase in the AP ratio between the typical and faster rate. There were no significant differences between typical and fast or fast and faster rates for either group. The NHC average transformed AP error ratios ranged from .674 to 1.373 (M = .910, SD = .173) for the typical speaking rate, and .739–1.585 (M = 1.013, SD = .210) and .837–2.288 (M = 1.355, SD = .437) for the fast and faster speaking rates, respectively. The PWA average transformed AP error ratios ranged from .612 to 2.083 (M = .995, SD = .392), .833–2.083 (M = 1.251, SD = .373) and .625–2.430 (M = 1.222, SD = .604), for the typical, fast and faster speaking rates, respectively. Figure 3 illustrates the performance of both groups on the transformed AP error ratio. The general pattern of performance for each group is consistent with that for the AE ratio (Figure 4). Results from a two-way repeated measures ANOVA for the AE error ratio revealed no significant main effect for rate, F(2,46) = 1.727, p = .19, η2 = .07; or group, 2.0
Averaged Arcsine Transformed Values
Downloaded by [VA Healthcare System, Pittsburgh], [Malcolm McNeil] at 08:25 15 July 2015
error types (number/opportunity). Although the experimental questions in this study are specific to the serial-order errors produced without distortion, the error summary for all categories, at each speaking rate, along with the raw number of each serial order error type produced for individuals in both groups are presented in the Supplemental data (Tables 5–10).
1.5
1.0
0.5 NHC PWA 0.0 Typical
Fast Speaking Rate
Faster
Figure 3. Arcsine transformation values for the anticipation to perseveration error ratio for normal healthy controls (NHC) and persons with aphasia (PWA) across the three speaking rates.
14
T.R.D. Fossett et al.
Averaged ArcsinTransformed Values
Downloaded by [VA Healthcare System, Pittsburgh], [Malcolm McNeil] at 08:25 15 July 2015
2.0
1.5
1.0
0.5 NHC PWA 0.0 Typical
Fast
Faster
Speaking Rate
Figure 4. Average arcsine transformed values for the anticipation to exchange error ratio for normal healthy controls (NHC) and persons with aphasia (PWA) across the three speaking rates.
F(1,23) = .907, p = .35, η2 = .04 (power = .10). The NHC average transformed AE error ratios ranged from .643 to 1.322 (M = .910, SD = .183) for the typical speaking rate, and .692–1.414 (M = 1.043, SD = .198) and .692–1.860 (M = 1.127, SD = .379) for the fast and faster speaking rates, respectively. The PWA average transformed AE error ratios ranged from .285 to 1.679 (M = .995, SD = .403), .794–1.890 (M = 1.203, SD = .345) and .618–2.553 (M = 1.116, SD = .592) for the typical, fast and faster speaking rates, respectively. Figure 4 illustrates performance across speaking rates with the arcsinetransformed data. The observed power for the AE error ratio calculation for the main effect of rate was .34 with a η2 of .07. Given these power and effect size calculations, a post-hoc power analysis estimated that 56 participants would be necessary in each group to attain a power of .80. To provide evidence that the participants met the experimental task demand to initiate speech immediately after the signal cue in order to limit PE preparation/processing time, a secondary analysis explored VRT data between groups and across rates. Normality assumptions were met and a two-way repeated measures ANOVA revealed a significant main effect of rate, F(2,44) = 13.81, p = .00, η2 = .39, and group, F(1,22) = 10.16, p = .00, η2 = .32, and no significant interaction, F(2,44) = .99, p = .38, η2 = .04 (power = .21). Overall, longer VRTs were produced at the typical speaking rate (M = .604 ms) compared with the fast (.504 ms); which were significantly longer compared to the faster (.447 ms) rates. The significant group difference resulted from an overall longer VRT for the PWA (M = .606 ms) than the NHC participants (M = .432 ms) at each rate. Discussion Serial-order speech error predictions for both the NHC and PWA were based on the assumptions and predictions of the interactive spreading activation models of Dell (1986)
Downloaded by [VA Healthcare System, Pittsburgh], [Malcolm McNeil] at 08:25 15 July 2015
Aphasiology
15
and Dell, Burger, et al. (1997). The primary assertion is that speaking rate manipulation can affect PE as evidenced by a change in the ratio of phonologic errors in those studies. Current study results also provided evidence of change in the ratio of serial-order errors with changes in speaking rate. Results revealed a significant increase in the AP ratio (defined as anticipations/perseverations) from the typical to faster speaking rate condition, though this finding was in the opposite direction of that predicted by Dell, Burger, et al., (1997). The results revealed an increase in the number of anticipatory relative to perseveration errors with increased speaking rate. These results replicated the higher anticipation to perseveration ratio for NHCs (Garnham, Shillcock, Brown, Mill, & Cutler, 1981) and PWA (Blumstein, 1973; Wilshire & McCarthy, 1996). In contrast, though speaking rate effects were not investigated, Schwartz et al. (1994) and Kohn and Smith (1990), each reported more perseverations than anticipations in a single person with aphasia. Contrary to our prediction, no significant group differences were obtained in the current study. This finding is in concert with those of Wilshire and McCarthy (1996) in which a single person with aphasia and impaired PE produced a ratio of anticipations to perseverations within the range of the NHCs. Both theory (Buckingham, 1980; Dell, Schwartz, et al., 1997) and experimental evidence across language domains (Dell, Burger, et al., 1997; Martin et al., 1994; Wilshire & McCarthy) suggest that this finding is not untenable, as it has been proposed that aphasia and normal language processing exist on a continuum (aka, the continuity hypothesis) (but see Ruml, Caramazza, Capasso, & Miceli, 2005 for an alternative perspective). Both participant groups in this study produced errors of PE, and the pattern of error ratios remained the same between groups. The lack of differences in the error ratio patterns suggest that the model’s postulated assumptions about the effect of brain damage in aphasia on the mechanism of spreading activation is incorrect or that the effect of speaking rate on the behaviour of spreading activation was insufficient to reveal the effects. Additionally, other variables that may have contributed to the lack of group differences include aphasia severity level and the restricted number of analysable errors resulting from response exclusion criteria. Dell, Burger, et al. (1997) and Martin and Dell (2004) hypothesised that anticipation errors result from the co-occurrence of disrupted activation to the current target and to an upcoming unit in the plan. Anticipation errors occur when an upcoming phoneme is more highly activated than the current target. One hypothesis regarding the increase in anticipation rather than perseveration errors with increased speaking rate in this study is that the construction of the phonologically challenging sentences promoted an imbalance between the turn-on and prime functions described by Dell, Burger, et al. (1997). That is, elements in the “future” receive activation from the plan, but are also primed with anticipatory activation. The phoneme similarity and manipulation of repeated phonemes that make the current study stimuli phonologically challenging may further prime future elements, and contribute to higher activation levels than that of the intended target. However, Dell, Burger, et al. (1997) obtained different results using phonologically challenging phrases, but with young healthy controls. It also is possible that the increase in speaking rate was not sufficient in magnitude to highlight the effects of a slow decay rate. According to the model, slow decay would promote exchanges and perseveration errors over anticipation errors as the activation of the selected unit remains high enough to be re-selected. If achieved speaking rates were insufficient in the current study, the activation level of the selected unit may have had time to decay but not sufficiently rebound, reducing chances that the unit would be re-selected. This would result in the production of more anticipation errors.
Downloaded by [VA Healthcare System, Pittsburgh], [Malcolm McNeil] at 08:25 15 July 2015
16
T.R.D. Fossett et al.
The rate of activation decay during processing has been identified as a variable that may contribute to serial-order errors. For example, Stemberger (1989) proposed that children have a slower rate of activation decay than adults, based on the higher rates of perseveration errors. This suggestion counters Dell, Burger, et al. (1997), who hypothesised that the AP findings in children are due to decreased connection strength. An alternative to the proposal of slow decay, however, is the possibility of fast decay. If the rate of activation decay is generally rapid, the tendency for increased perseveration or exchange errors might not be observable unless speaking rates were exceedingly rapid. The alternative possibility of fast decay has been suggested by others relative to naming errors in PWA (Martin et al., 1994) and is acknowledged by Dell, Burger, et al. (1997) relative to the potential effects of aphasia on AP. Thus, although Dell (1986) proposed that slow rates of activation decay would allow for higher numbers of perseveration errors, fast activation decay and/or slow re-bound of activation following activation decay are plausible alternatives that would accommodate the current study results. However, the alternative explanation of fast decay, as presented here, is not specific to the effects of aphasia, as in the current study no group differences were obtained relative to the serialorder and speaking rate questions. It is unclear whether severity of aphasia contributed to the findings in this study. In a study examining perseverative behaviour in both healthy and impaired persons, Helm-Estabrooks, Ramage, Bayles, and Cruz (1998) concluded that perseverative behaviour was related to impairment severity. Based on assessment measures, PWA in this study presented with a mild-moderately impaired profile. It is an empirical question as to whether a more impaired group of PWA might have resulted in different findings. Using a spreading activation model similar to that of Dell (1986), Martin et al. (1994) suggested that decreased connection strength explained production differences between a single person with aphasia and simulations of the production performance of NHC participants. They further indicated that relative to aphasia, brain damage usually is associated with weak connections. Martin and Dell (2004) suggested that reduced connection strengths result in lower activation levels of target items and thus residual activation of previously selected items may more easily achieve high enough levels to allow for re-selection. However, decreased connection strength would not explain the current findings as no group differences were obtained on the serial-order speaking rate questions and there is no reason to posit low connection strength in the NHCs. Other methodologic factors also may account for the discrepancies between predicted and achieved results. Though error coding reliability for serial-order errors was 100% regardless of speaking rate for NHCs and was acceptable for the typical and fast speaking rates for PWA, it was lower at the faster speaking rate for PWA. This may reflect the challenge of interpreting error type in the presence of other non-serial order errors (i.e., sound deletion), which may frequently occur at increased speaking rates in PWA. Low error coding reliability at the faster speaking rate for PWA may have obscured findings of a change in the error ratios at this speaking rate. Furthermore, inclusion/exclusion criteria utterances limited the number of analysable utterances, thereby affecting the overall error rate. As asserted by Schwartz et al. (1994), perseveration errors are associated with higher overall error rates. Thus, the lower overall error rates in this study may have contributed to the increased AP ratio at faster speaking rates. For the current study error rates, defined as the produced number of non-distorted serial-order errors/serial-order error opportunities, ranged from .2% to 1.2% for NHCs and from .1% to 1.3% for PWA, with the lowest error rate at the faster speaking rate. Additionally, the fewest number of analysable tokens occurred at the fast and faster speaking rates for the PWA. For two reported experiments,
Downloaded by [VA Healthcare System, Pittsburgh], [Malcolm McNeil] at 08:25 15 July 2015
Aphasiology
17
Wilshire (1999) reported an overall error percentage of 4.5% and 7.8% of words with sound errors. In Wilshire (1999), potentially relevant methodological issues included broad rather than narrow phonetic transcription, allowing for the inclusion of distorted serial-order errors, and no obvious exclusion of sound substitution errors. Serial-order errors perceived to be distorted were excluded from analyses in the current study and may have contributed to the low overall error rate. It is not clear how the overall error percentages from the current study and Wilshire (1999) would compare had the same inclusion/exclusion criteria been applied. Pouplier et al. (2014) have provided findings they interpret as challenging the utility of perceptual identification and error categorisation. Furthermore, most previous AP error ratio findings were obtained from young to middle aged NHC speakers in varied production tasks. Few studies have examined the AP error ratio in the elderly (but see Vousden & Maylor; 2006) or in groups of PWA. Notably, Vousden and Maylor did not obtain an AP effect for their older participants because they had difficulty manipulating their speaking rate. Analysis of the AE serial-order error ratio revealed no significant main effect or interactions. As the outcome of this analysis was dependent on the behaviour of two types of errors, an examination of the raw data for both groups is essential in order to interpret the results. The data revealed that few exchange errors were produced in total across all speaking rate conditions. Across all three speaking rates, there were 7 exchange errors for PWA and 23 for the NHC group. Exchanges represented 9%, 6% and 6% of the serial-order errors at the typical, fast and faster speaking rates for PWA and 16%, 9% and 15% of the data for NHCs at those rates, respectively. Thus, the frequency of occurrence of exchange errors was low even under presumed error-producing conditions (phonologically challenging phrases, increased speaking rate and aphasia). Previous studies have similarly reported the infrequency of occurrence of exchange errors (i.e., Dell, 1986; Vousden, Brown, & Harley, 2000). Results from the current study, however, do not provide support or counter evidence for the AE ratio prediction because of the statistical low power. The effect of speaking rate on the presence of serial-order exchange errors has not been adequately tested. From a theoretical perspective, based on the sheer paucity of relevant errors, this lack of evidence may raise questions about the influence of temporal processing and the behaviour of spreading activation relative to the frequency and conditions under which exchange errors occur. According to Dell (1986), exchange errors are not independent of the occurrence of anticipation or perseveration errors. He asserted that the production of an exchange error is related to the integrity of all processing functions and is affected by the degree of anticipatory or perseveratory bias during processing. Although the lack of statistical power in this study limits interpretation, conceptually, reliably identified non-distorted exchange errors continue to be differentially diagnostic when they occur as they are unambiguously attributable to the level of PE, though their rare occurrence does diminish their clinical value. We are unaware of any speech production model that posits appropriate retrieval of a phoneme sized unit, which then activates and sequentially mis-orders an erroneous packet of gestures (or more than one in the case of an exchange error), which faithfully represent another phoneme-sized unit. Given the limited frequency of occurrence of serial-order sound exchange errors in two human experimental studies, it may be that they are less interesting than other serialorder error types, but still theoretically important because when they do occur more than in NHCs, they are markers of the compromised processing. This study also examined the effect of speaking rate on VRT. The primary purpose of this measurement was to provide evidence that participants had responded immediately
Downloaded by [VA Healthcare System, Pittsburgh], [Malcolm McNeil] at 08:25 15 July 2015
18
T.R.D. Fossett et al.
after the tone cue and no significant effects of rate or group were predicted. The results, however, revealed significant effects of speaking rate and group, with means for the PWA group longer than those of NHC participants at all speaking rates. Although other studies have investigated the effects of speaking rate on PE (Dell, 1986; Dell, Burger, et al., 1997; Vousden & Maylor, 2006; Wilshire & McCarthy, 1996), none have provided evidence that participants responded immediately after the cue to speak. Failure to initiate speech immediately after stimulus presentation could allow additional processing time for PE and might not validly reflect only the effect of the speaking rate manipulation. The decrease in VRT with the demand of increasing speaking rate is thought to reflect a decrease in preparation time with a concomitant reduced response time as a result of the time pressure to respond. This finding continues to allow for the possibility that speaking rate manipulation affects both PE and pre-articulatory processing. As PWA were screened for motor-level deficits, the finding of a group main effect for VRT was not predicted. Data from Towne and Crary (1988) suggested that participants with more posterior lesions produced verbal reaction times similar to NHC participants. Insufficient lesion data (9/16 PWA) was obtained in this study to interpret the contribution of lesion site to these findings. Longer reaction times in PWA relative to NHCs have been reported on language tasks (Bose, Van Lieshout, & Square, 2007; Dunn, Russell, & Drummond, 1989), regardless of modality. Additionally, McNeil and Kent (1990) revealed that participants described as having conduction aphasia with no clinically identifiable concomitant AOS or dysarthria, did demonstrate some deficits in motor control. The most parsimonious explanation for this finding is that they had concomitant, but subclinical, motor speech involvement. Thus, despite the fact that the PWA in this study did not demonstrate motor speech deficits on the screening measures, unambiguous assignment of the increased level of response planning to either PE or motor speech processing is not addressed by these data. Summary Although the results for one of two serial order ratios were significantly affected by speech rate, the finding was in the opposite direction (a rise in AP ratio) of that predicted by the models of Dell (1986) and colleagues (Dell, Burger, et al., 1997). Additionally, no significant main effect of group and no significant interactions were obtained. The data in this study do not provide conclusive evidence to differentiate the effects of speaking rate manipulation on phonologic encoding to phonetic encoding processes. The results of the current study may have implications for the speaking rate assumptions of Dell (1986) and Dell, Burger, et al. (1997) as the AP error ratio results challenged the assumption regarding the effect of speaking rate on the proportions of some serialorder errors. The effect of speaking rate on the AE error ratios neither challenged nor provided support for the assumptions of the models, as non-significant results were obtained. The current findings argue for an alternative concept of the role of activation and decay in influencing types of serial-order sound errors. Rather than a slow activation decay rate (Dell, 1986), the results of the current study are more compatible with an alternative explanation of rapid activation decay or slow build-up of residual activation. The finding of a speaking rate effect as reflected in a change in the proportion of one serial-order phoneme error ratio provided evidence that speaking rate change or the available encoding time can affect the proportion of serial-order phoneme errors produced. Whereas the speaking rate manipulation may have affected more than serial-order phoneme errors, the error patterns represented are unlikely to represent errors generated at
Downloaded by [VA Healthcare System, Pittsburgh], [Malcolm McNeil] at 08:25 15 July 2015
Aphasiology
19
other than the level of PE. Some caution is suggested for the generalisation of these results to non-experimental conditions as the data were obtained with experimentally manipulated stimuli designed to elicit speech production errors through the manipulation of repeated and similar phonemes, a condition not typically encountered in everyday speech production. The results of this study, with a main finding different than that predicted, generate further questions regarding the effect of speaking rate on phonological serial-order error ratios. To disambiguate the effects of speaking rate manipulation of PE versus phonetic encoding processes, a future study should replicate the current study and further investigate speaking rate effects on PE in participants with a motor-speech deficit but no cognitive-linguistic deficits. Given the low reliability for some measures reported in this study, continued exploration of the utility of narrow phonetic transcription in distinguishing among errors is warranted. Future investigations should also maximise error opportunity (i.e., controlling for error rate) given the large of amount of data which needed to be excluded in this study. Furthermore, it is suggested that as strategies for rate manipulation may differ among individuals (Tsao, Weismer, & Iqbal, 2006), additional measures of rate change such as articulation rate and pause time should be addressed. These additional measures may provide additional information regarding response time planning not captured by the methods used in this study. Acknowledgements The data presented in this manuscript represent data collected for the doctoral dissertation of the first author. Although this study was completed at the University of Pittsburgh, Malcolm R McNeil and Sheila R. Pratt provided resources and facilities through the Geriatric Research Education and Clinical Center in the VA Pittsburgh Healthcare System. Nonetheless, the contents of this manuscript do not represent the views of the Department of Veterans Affairs or the United States Government. A portion of the data presented in this manuscript was also included in an abstract submitted to the Academy of Aphasia and previously published in Brain & Language (2007). The authors wish to acknowledge the multiple recruitment sites involved in facilitating data collection for disordered participants, with special acknowledgement to Drs. Nadine Martin and Myrna Schwartz at Temple University and Moss Rehabilitation Hospital, respectively, and Dr. Julie Wambaugh, at the VA Salt Lake City Healthcare System. Additionally, they wish to thank Dr. Julie A. Fiez in the Department of Psychology at the University of Pittsburgh for her contributions to the project.
Disclosure statement No potential conflict of interest was reported by the authors.
Funding This research was supported by a National Institutes of Health (NIH) F31 Pre-doctoral Fellowship award [grant number 1 F31 DC005940-01] and by the Provost’s Development and Faculty of Arts and Sciences (FAS) African American Summer Graduate Research Awards from the University of Pittsburgh.
Supplemental data Supplemental data for this article can be accessed at http://dx.doi.org/10.1080/02687038.2015. 1063581
Note 1.
Distortions can also be perceived of as sound-level substitutions and therefore substitutions cannot unambiguously be attributed to the PE level of production (McNeil et al., 2009). These authors proposed that distorted sound substitutions or distorted sound sequencing errors occur
20
T.R.D. Fossett et al. when both phonological and motor-level processing are disturbed. The differential diagnostic value of undistorted sound sequencing errors is that they, as compared with other error types, can more confidently be attributed to disruption of the PE (linguistic-symbolic) level of production (McNeil et al., 2009). The models of Dell (1986, 1988) and Dell and colleagues (Dell, Burger, et al., 1997) are consistent with this level of error assignment.
Downloaded by [VA Healthcare System, Pittsburgh], [Malcolm McNeil] at 08:25 15 July 2015
References Acheson, D. J., & MacDonald, M. C. (2009). Twisting tongues and memories: Explorations of the relationship between language production and verbal working memory. Journal of Memory and Language, 60, 329–350. doi:10.1016/j.jml.2008.12.002 Arvedson, J. C., McNeil, M. R., & West, T. L. (1986). Prediction of revised token test overall, subtest, and linguistic unit scores by two shortened versions. In Clinical Aphasiology Conference (pp. 57–63). Rockville, MD: BRK. Baars, B. J., Motley, M. T., & MacKay, D. G. (1975). Output editing for lexical status in artificially elicited slips of the tongue. Journal of Verbal Learning and Verbal Behavior, 14, 382–391. doi:10.1016/S0022-5371(75)80017-X Bayles, K. A., & Tomoeda, M. S. (1993). Arizona battery for communication disorders of dementia. Tucson, AZ: Canyonlands. Blumstein, S. E. (1973). A phonological investigation of aphasic speech. Paris: Mouton. Boomer, D. S., & Laver, J. D. M. (1973). Slips of the tongue. In V. Fromkin (Ed.), Speech errors as linguistic evidence (pp. 120–131). Paris: Mouton & Co. N.V., Publishers. Reprinted from the British Journal of Disorders of Communication 3(1), 1968). Bose, A., Van Lieshout, P., & Square, P. A. (2007). Word frequency and bigram frequency effects on linguistic processing and speech motor performance in individuals with aphasia and normal speakers. Journal of Neurolinguistics, 20, 65–88. doi:10.1016/j.jneuroling.2006.05.001 Buchwald, A., & Miozzo, M. (2012). Phonological and motor errors in individuals with acquired sound production impairment. Journal of Speech, Language, and Hearing Research, 55, S1573–S1586. doi:10.1044/1092-4388(2012/11-0200) Buckingham, H. W. (1980). On correlating aphasic errors with slips-of-the-tongue. Applied Psycholinguistics, 1, 199–120. doi:10.1017/S0142716400000849 Buckingham, H. W. (1992). Phonological production deficits in conduction aphasia. In S. E. Kohn (Ed.), Conduction aphasia (pp. 77–116). Hillsdale, NJ: Lawrence Erlbaum Associates. Cohen, A. (1973). Errors of speech and their implication for understanding the strategy of language users. In V. Fromkin (Ed.), Speech errors as linguistic evidence (pp. 88–92). Paris: Mouton & Co. N.V., Publishers. Reprinted from Zeitschrift fur Phonetik 21 (1/2): 177-81. CSL Computerized Speech Lab Model 4300B Software (Version 5.X). (1994). Lincoln Park, NJ: Kay Elemetrics Corp. Dabul, B. (2000). Apraxia battery for adults - 2. Tigard, Oregon: C.C. Publications. Darley, F. L., Aronson, A. E., & Brown, J. R. (1969a). Clusters of deviant speech dimensions in the dysarthrias. Journal of Speech and Hearing Research, 12, 462–496. doi:10.1044/jshr.1203.462 Darley, F. L., Aronson, A. E., & Brown, J. R. (1969b). Differential diagnostic patterns of dysarthria. Journal of Speech and Hearing Research, 12, 246–269. doi:10.1044/jshr.1202.246 Deal, J. L., & Darley, F. L. (1972). The influence of linguistic and situational variables on phonemic accuracy in apraxia of speech. Journal of Speech-Language-Hearing Research, 15, 639–653. doi:10.1044/jshr.1503.639 Dell, G. S. (1986). A spreading-activation theory of retrieval in sentence production. Psychological Review, 93, 283–321. doi:10.1037/0033-295X.93.3.283 Dell, G. S. (1988). The retrieval of phonological forms in production: Tests of predictions from a connectionist model. Journal of Memory and Language, 27, 124–142. doi:10.1016/0749-596X (88)90070-8 Dell, G. S., Burger, L. K., & Svec, W. R. (1997). Language production and serial order: A functional analysis and a model. Psychological Review, 104, 123–147. doi:10.1037/0033-295X.104.1.123 Dell, G. S., Schwartz, M. F., Martin, N., Saffran, E. M., & Gagnon, D. A. (1997). Lexical access in aphasic and nonaphasic speakers. Psychological Review, 104, 801–838. doi:10.1037/0033295X.104.4.801 DiSimoni, F. G., Keith, R. L., & Darley, F. L. (1980). Prediction of PICA overall score by short versions of the test. Journal of Speech and Hearing Research, 23, 511–516. doi:10.1044/jshr.2303.511
Downloaded by [VA Healthcare System, Pittsburgh], [Malcolm McNeil] at 08:25 15 July 2015
Aphasiology
21
Drummond, S. S. (1993). Dysarthria examination battery. Tucson, AZ: Communication Skill Builders. Dunn, N. D., Russell, S. S., & Drummond, S. S. (1989). Effect of stimulus context and response coding variables on word retrieval performances in dysphasia. Journal of Communication Disorders, 22, 209–223. doi:10.1016/0021-9924(89)90017-8 Fossett, T. R. D., McNeil, M. R., & Pratt, S. R. (2000). The effects of speaking rate on phonological encoding in normal adults. Manuscript in preparation. Pittsburgh. PA: University of Pittsburgh. Fozo, M. S., & Watson, B. C. (1998). Task complexity effect on vocal reaction time in aged speakers. Journal of Voice, 12, 404–414. doi:10.1016/S0892-1997(98)80049-0 Frisch, S. A., & Wright, R. (2002). The phonetics of phonological speech errors: An acoustic analysis of slips of the tongue. Journal of Phonetics, 30, 139–162. doi:10.1006/ jpho.2002.0176 Garnham, A., Shillcock, R. C., Brown, G. D. A., Mill, A. I. D., & Cutler, A. (1981). Slips of the tongue in the London-Lund corpus of spontaneous conversation. Linguistics, 19, 805–817. Goodglass, H., Kaplan, E., & Barresi, B. (2001). The assessment of aphasia and related disorders (3rd ed.). Philadelphia, PA: Lippincott Williams & Wilkins. Haley, K. L., Bays, G. L., & Ohde, R. N. (2001). Phonetic properties of aphasic-apraxic speech: A modified narrow transcription analysis. Aphasiology, 15, 1125–1142. doi:10.1080/ 02687040143000537 Helm-Estabrooks, N., Ramage, A., Bayles, K. A., & Cruz, R. (1998). Perseverative behaviour in fluent and non-fluent aphasic adults. Aphasiology, 12, 689–698. doi:10.1080/02687039808249566 Kaplan, E., Goodglass, H., & Weintraub, S. (2001). Boston Naming Test-2 (BNT-2) (2nd ed.). Austin, TX: Pro-Ed. Kello, C. T. (2003). Patterns of timing in the acquisition, perception, and production of speech. Journal of Phonetics, 31, 619–626. doi:10.1016/S0095-4470(03)00017-2 Klapp, S. T. (2003). Reaction time analysis of two types of motor preparation for speech articulation: Action as a sequence of chunks. Journal of Motor Behavior, 35, 135–150. doi:10.1080/ 00222890309602129 Kohn, S. E., & Smith, K. L. (1990). Between-word speech errors in conduction aphasia. Cognitive Neuropsychology, 7, 133–156. doi:10.1080/02643299008253440 Laganaro, M. (2012). Patterns of impairments in AOS and mechanisms of interaction between phonological and phonetic encoding. Journal of Speech, Language, and Hearing Research, 55, S1535– S1543. doi:10.1044/1092-4388(2012/11-0316) Levelt, W. J. M. (1989). Speaking: From intention to articulation. Cambridge, MA: The MIT Press. Maas, E., & Mailend, M.-L. (2012). Speech planning happens before speech execution: Online reaction time methods in the study of apraxia of speech. Journal of Speech-Language-Hearing Research, 55, S1523–S1534. doi:10.1044/1092-4388(2012/11-0311) MacKay, D. G., & James, L. E. (2004). Sequencing, speech production, and selective effects of aging on phonological and morphological speech errors. Psychology & Aging, 19, 93–107. doi:10.1037/0882-7974.19.1.93 Mailend, M.-L., & Maas, E. (2013). Speech motor programming in apraxia of speech: Evidence from a delayed picture-word interference task. American Journal of Speech Language Pathology, 22, S380–S396. doi:10.1044/1058-0360(2013/12-0101) Martin, N., & Dell, G. S. (2004). Perseverations and anticipations in aphasia: Primed intrusions from the past and future. Seminars in Speech and Language, 25, 349–362. doi:10.1055/s-2004-837247 Martin, N., Dell, G. S., Saffran, E. M., & Schwartz, M. F. (1994). Origins of paraphasias in deep dysphasia: Testing the consequences of a decay impairment to an interactive spreading activation model of lexical retrieval. Brain and Language, 47, 609–660. doi:10.1006/brln.1994.1061 McNeil, M. R., & Kent, R. D. (1990). Motoric characteristics of adult aphasic and apraxic speakers. In G. R. Hammond (Ed.), Advances in psychology: Cerebral control of speech and limb movements (pp. 349–386). New York, NY: Elsevier. McNeil, M. R., & Pratt, S. R. (2001). Defining aphasia: Some theoretical and clinical implications of operating from a formal definition. Aphasiology, 15, 901–911. doi:10.1080/02687040143000276 McNeil, M. R., & Prescott, T. E. (1978). Revised token test. Austin, TX: Pro-Ed. McNeil, M. R., Robin, D. A., & Schmidt, R. A. (2009). Apraxia of speech: Definition, differentiation and treatment. In M. R. McNeil (Ed.), Clinical management of sensorimotor speech disorders (pp. 311–344). New York, NY: Thieme Medical Publishers.
Downloaded by [VA Healthcare System, Pittsburgh], [Malcolm McNeil] at 08:25 15 July 2015
22
T.R.D. Fossett et al.
Odell, K., McNeil, M. R., Rosenbek, J. C., & Hunter, L. (1990). Perceptual characteristics of consonant production by apraxic speakers. Journal of Speech and Hearing Disorders, 55, 345–359. doi:10.1044/jshd.5502.345 Porch, B. E. (1981). Porch index of communicative ability. Palo Alto, CA: Consulting Psychologists Press Psychological Software Tools. Pouplier, M., Marin, S., & Waiti, S. (2014). Voice onset time in consonant cluster errors: Can phonetic accommodation differentiate cognitive from motor errors? Journal of Speech, Language, and Hearing Research, 57, 1577–1588. doi:10.1044/2014_JSLHR-S-12-0412 Raven, J. C. (1965). The coloured progressive matrices. New York, NY: The Psychological Corporation. Raven, J. C. (1988). Raven’s coloured progressive matrices (CPM). San Antonio, TX: Pearson. Roelofs, A. (1997). The WEAVER model of word-form encoding in speech production. Cognition, 64, 249–284. doi:10.1016/S0010-0277(97)00027-9 Roelofs, A. (1999). Phonological segments and features as planning units in speech production. Language and Cognitive Processes, 14, 173–200. doi:10.1080/016909699386338 Rogers, M. A., & Storkel, H. L. (1998). Reprogramming phonologically similar utterances: The role of phonetic features in pre-motor encoding. Journal of Speech Language, and Hearing Research, 41, 258–274. doi:10.1044/jslhr.4102.258 Ruml, W., Caramazza, A., Capasso, R., & Miceli, G. (2005). Interactivity and continuity in normal and aphasic language production. Cognitive Neuropsychology, 22, 131–168. doi:10.1080/ 02643290442000031 Schmidt, R. A., & Lee, T. D. (2014). Motor learning and performance. From principles to application (5th ed.). Champaign, IL: Human Kinetics. Schneider, W., Eschman, A., & Zuccolotto, A. (2002). E-Prime’s user guide. Pittsburgh, PA: Psychology Software Tools. Schwartz, M. F., Saffran, E. M., Bloch, D. E., & Dell, G. S. (1994). Disordered speech production in aphasic and normal speakers. Brain and Language, 47, 52–88. doi:10.1006/brln.1994.1042 Shriberg, L. D., & Kent, R. D. (1995). Clinical phonetics (2nd ed.). Boston, MA: Allyn & Bacon. Shuster, L. I., & Wambaugh, J. L. (2000). Perceptual and acoustic analyses of speech sound errors in apraxia of speech accompanied by aphasia. Aphasiology, 14, 635–651. doi:10.1080/ 026870300401360 Stemberger, J. P. (1989). Speech errors in early child language production. Journal of Memory and Language, 28, 164–188. doi:10.1016/0749-596X(89)90042-9 Towne, R. L., & Crary, M. A. (1988). Verbal reaction time patterns in aphasic adults. Consideration for Apraxia of Speech, Brain & Language, 35, 138–153. doi:10.1016/0093-934X(88)90105-8 Tsao, Y.-C., Weismer, G., & Iqbal, K. (2006). The effect of intertalker speech rate variation on acoustic vowel space. Journal of the Acoustical Society of America, 119, 1074–1082. doi:10.1121/1.2149774 Van Der Merwe, A. (2009). A theoretical framework for the characterization of pathological speech sensorimotor control. In M. R. McNeil (Ed.), Clinical management of sensorimotor speech disorders (pp. 1–25). New York, NY: Thieme Medical Publishers. Vousden, J. I., Brown, G. D. A., & Harley, T. A. (2000). Serial control of phonology in speech production: A hierarchical model. Cognitive Psychology, 41, 101–175. doi:10.1006/cogp.2000.0739 Vousden, J. I., & Maylor, E. A. (2006). Speech errors across the lifespan. Language and Cognitive Processes, 21, 48–77. doi:10.1080/01690960400001838 Wambaugh, J. L., Duffy, J. R., McNeil, M. R., Robin, D. A., & Rogers, M. A. (2006). Treatment guidelines for acquired apraxia of speech: A synthesis and evaluation of the evidence. Journal of Medical Speech-Language Pathology, 14, xv–xxxiii. Wilshire, C. E. (1999). The “tongue twister” paradigm as a technique for studying phonological encoding. Language and Speech, 42, 57–82. doi:10.1177/00238309990420010301 Wilshire, C. E., & McCarthy, R. A. (1996). Experimental investigations of an impairment in phonological encoding. Cognitive Neuropsychology, 13, 1059–1098. doi:10.1080/ 026432996381782 Wilson, R. H., & Antablin, J. K. (1980). A picture identification task as an estimate of the wordrecognition performance of nonverbal adults. Journal of Speech and Hearing Disorders, 45, 223–238. doi:10.1044/jshd.4502.223