sensors Article
The Effect of the Accelerometer Operating Range on Biomechanical Parameters: Stride Length, Velocity, and Peak Tibial Acceleration during Running Christian Mitschke *
ID
, Pierre Kiesewetter and Thomas L. Milani
Department of Human Locomotion, Chemnitz University of Technology, 09126 Chemnitz, Germany;
[email protected] (P.K.);
[email protected] (T.L.M.) * Correspondence:
[email protected]; Tel.: +49-371-531-32196 Received: 11 November 2017; Accepted: 4 January 2018; Published: 5 January 2018
Abstract: Previous studies have used accelerometers with various operating ranges (ORs) when measuring biomechanical parameters. However, it is still unclear whether ORs influence the accuracy of running parameters, and whether the different stiffnesses of footwear midsoles influence this accuracy. The purpose of the present study was to systematically investigate the influence of OR on the accuracy of stride length, running velocity, and on peak tibial acceleration. Twenty-one recreational heel strike runners ran on a 15-m indoor track at self-selected running speeds in three footwear conditions (low to high midsole stiffness). Runners were equipped with an inertial measurement unit (IMU) affixed to the heel cup of the right shoe and with a uniaxial accelerometer at the right tibia. Accelerometers (at the tibia and included in the IMU) with a high OR of ±70 g were used as the reference and the data were cut at ±32, ±16, and at ±8 g in post-processing, before calculating parameters. The results show that the OR influenced the outcomes of all investigated parameters, which were not influenced by tested footwear conditions. The lower ORs were associated with an underestimation error for all biomechanical parameters, which increased noticeably with a decreasing OR. It can be concluded that accelerometers with a minimum OR of ±32 g should be used to avoid inaccurate measurements. Keywords: operating range; accelerometer; stride length; peak tibial acceleration; running velocity; wearable sensors
1. Introduction With the further advancement of sensor technologies and data analyzing techniques, micro-electro-mechanical sensors (MEMS) have become useful tools for biomechanical research and clinical practice [1]. It has been reported that these wearable motion sensors are an inexpensive alternative to optoelectronic systems and force plates, that they are simple to handle, cost-effective, and are suitable for field measurements [2–6]. When using these sensors, spatio-temporal and kinetic parameters during walking and running can be analyzed in clinical as well as in sportive applications. For kinetic measurements, for example, when investigating the impact loads on lower limbs during running under various conditions (e.g., footwear conditions or the influence of fatigue), the peak tibial acceleration (PTA) was examined by some authors using MEMS [7–20]. Thereby, unidirectional accelerations along the longitudinal axis of the tibia, as well as medio-lateral and anterior-posterior accelerations of the tibia were examined. Furthermore, the determination of stride frequency, of walking or running velocity (runVel), and of stride length (strLen) have also been the focus of research that utilizes MEMS [21–25]. To investigate these biomechanical parameters, individually configured sensors or commercially available inertial measurement units (IMUs: e.g., Shimmer, Achillex, or XSens) were used, which combine accelerometers and gyroscopes. In this Sensors 2018, 18, 130; doi:10.3390/s18010130
www.mdpi.com/journal/sensors
Sensors 2018, 18, 130
2 of 12
context, Provot et al. [26] compared a calibrated industrial accelerometer (considered as the gold standard) to an IMU accelerometer in two tests: (a) on a shaker, and (b) on the distal anteromedial aspect of the subject’s tibia during running at 3.33 m/s. They concluded that IMUs can be used for valid measurements of tibial acceleration during running. Besides the different sensor types, sensor locations, and the various sampling rates, sensors with considerably different accelerometer operating ranges (ORs) have also been used. When investigating walking or running, some studies used ORs between ±2 and ±70 g, with g being the acceleration of gravity [27–32]. However, high accelerations act on the sensor in vertical and anterior–posterior directions during the swing phase and in the first 50 ms after foot strike [11,32]. These accelerations can distinctly exceed the gravitational acceleration of 1 g. For instance, vertical accelerations of 24.62 ± 4.1 g were measured with a heel-mounted IMU accelerometer during heel strike, when running at 3.5 ± 0.1 m/s in a neutral running shoe (PUMA FAAS 500) [32]. If the accelerations exceeded the accelerometer OR, a lower accuracy and an underestimated variability of biomechanical parameters derived from accelerometer signals could result. In this context, Ziebart et al. [33] investigated the influence of accelerometer OR and of a sampling rate on peak acceleration during seven jumping tasks. They used a tri-axial accelerometer (Model 7267A, Endevco Corporation, San Juan Capistrano, CA, USA) with a high OR of ±260 g as the reference and compared the peak accelerations with two commercially available tri-axial accelerometers with an OR of ±6 g (device1: ActiGraph GT3X+, ActiGraph LLC, Pensacola, FL, USA and device2: X6-2mini, Gulf Coast Data Concepts, Waveland, MS, USA). They found that the peak impact acceleration was underestimated by up to 35%. Furthermore, the underestimation error was greater for tasks with a greater impact acceleration. It is currently still unclear whether, and to what extent, high accelerations can influence the accuracy of running parameters when exceeding the accelerometers’ OR. However, this information is necessary to determine whether differences in the investigated biomechanical parameters strLen, runVel, and in the PTA between conditions are caused by measurement errors due to an accelerometer OR that is too low, or by the investigated conditions themselves. In addition, the sensor signal characteristics of the IMU accelerometer, which is affixed to the heel cup of a running shoe, can be influenced by the midsole stiffness of footwear [5]. The authors found that a decreasing midsole stiffness resulted in an increasing delay in specific signal characteristics, when determining the time of foot touchdown. At this time, it is still unclear whether the accuracies of strLen and runVel are also influenced by altering acceleration signal characteristics due to a change in midsole stiffness. Since acceleration variables are related to running injuries, information about whether the ORs influences running parameters is highly relevant and could assist coaches, researchers, and clinicians in selecting the most appropriate accelerometer specification for their investigations. Therefore, the aim of the present study was to investigate the influence of the accelerometer OR on running parameters when reducing the OR stepwise from ±70 g to ±8 g. We hypothesized that the rapid and short spikes at the beginning of ground contact and the high accelerations during the swing phase influenced the accuracy of strLen (H1), runVel (H2), and PTA (H3) significantly, depending on the footwear conditions. The running parameters were determined based on previously published methods, and accelerometers with a high OR of ±70 g were used as the reference. 2. Materials and Methods 2.1. Participants Twenty-one recreational male heel strike runners (age: 24.4 ± 4.2 years; height: 178.2 ± 4.0 cm; weight: 74.1 ± 6.5 kg; running experience: 8.9 ± 3.3 years; training hours: 3.5 ± 1.7 h per week), free of injury for the last six months, participated in this study. High force rising rates can be observed after foot touchdown during rearfoot running [34], which results in a higher PTA for rearfoot runners than for forefoot runners [11]. Therefore, to determine the greatest effect of the reduced OR, only
Sensors Sensors2018, 2018,18, 18,130 130
33of of12 12
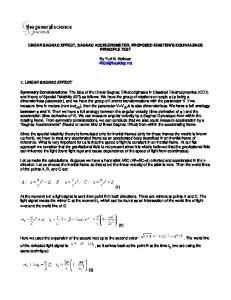
103-17-HS-CM-Bodenkontakt-25082015), and participants gave written informed consent to their heel strike runners were investigated. This study was approved by the university’s Ethics Committee participation in the study. (V-103-17-HS-CM-Bodenkontakt-25082015), and participants gave written informed consent to their participation in the study. 2.2. Test Procedure 2.2. Test Procedure During the test, participants wore three different commercially available running shoes, which wereDuring provided our laboratorywore in men’s size 8: commercially Adidas AdiStar (ADIDAS); PUMA Speed 600 the by test, participants threeUK different available running shoes, which (PUMA); Asicsby Gel Nimbus 12 (ASICS). an individual warm-up and familiarization with600 the were provided our laboratory in men’sAfter UK size 8: Adidas AdiStar (ADIDAS); PUMA Speed measurement setup, five repeated trials were recorded on a 15-m indoor track in the three footwear (PUMA); Asics Gel Nimbus 12 (ASICS). After an individual warm-up and familiarization with the conditions. The footwear conditions were investigated inaa15-m randomized order. running speed measurement setup, five repeated trials were recorded on indoor track in The the three footwear was individual and self-selected (onwere average 3.60 ± 0.4in m/s), however it order. was constant (range: ±0.1 was m/s) conditions. The footwear conditions investigated a randomized The running speed for each subject, for all of the 15 trials (three footwear conditions, each having five trials). Running individual and self-selected (on average 3.60 ± 0.4 m/s), however it was constant (range: ±0.1 m/s) speed monitored light barriers placed 4conditions, meters apart. for eachwas subject, for allusing of thetwo 15 trials (three footwear each having five trials). Running speed was monitored using two light barriers placed 4 meters apart. 2.3. Experimental Setup 2.3. Experimental Setupconfigured IMU, combining a biaxial accelerometer (ADXL278, Analog Devices, An individually OR ±70 and a biaxial gyroscope (IDG-650, InvenSense, ±2000 deg/s), was affixed to the Devices, heel cup An g) individually configured IMU, combining a biaxialOR accelerometer (ADXL278, Analog of the right shoe (Figure 1). Wobble-free sensor fixation was achieved using double-sided adhesive OR ±70 g) and a biaxial gyroscope (IDG-650, InvenSense, OR ±2000 deg/s), was affixed to the heel cup tape inelastic The sensitive axes of the was IMUachieved accelerometer measured the horizontal of the and rightan shoe (Figurestrap. 1). Wobble-free sensor fixation using double-sided adhesive tapeforward direction (acc_x) and the vertical (acc_z) acceleration of the shoe. The two sensitive axes of and an inelastic strap. The sensitive axes of the IMU accelerometer measured the horizontal—forward the gyroscope measured the angular velocities in the sagittal andsensitive the frontal direction—(acc_x) and the vertical (acc_z) acceleration of the shoe. (ω1), The two axes planes. of the Furthermore, to measure accelerations along the longitudinal axis of the tibia (acc_T), double-sided gyroscope measured the angular velocities in the sagittal (ω1), and the frontal planes. Furthermore, adhesive was used to attach uniaxial lightweight accelerometer (ADXL78, Analog Devices, OR to measuretape accelerations along thea longitudinal axis of the tibia (acc_T), double-sided adhesive tape ±70 g) to the shavedaskin at thelightweight medial aspect mid-distance between the malleolus andOR the ± plateau of was used to attach uniaxial accelerometer (ADXL78, Analog Devices, 70 g) to the right tibia [12,35]. An elastic strap was used to stabilize the accelerometer and to prevent excessive the shaved skin at the medial aspect mid-distance between the malleolus and the plateau of the movements due An to its ownstrap weight. All sensors operated synchronously, and the data were right tibia [12,35]. elastic was used to stabilize the accelerometer and to prevent excessive transmitteddue by cable to a data logger, which recorded these data. Theand data logger was secured in a movements to its own weight. All sensors operated synchronously, the data were transmitted waist belt. To avoid any effects from a sampling rate that was too low, the sensor sampling rate was by cable to a data logger, which recorded these data. The data logger was secured in a waist belt. setavoid to 1000 which the minimum requirements measure theserate parameters To anyHz, effects fromexceeds a sampling rate that was too low, theto sensor sampling was set toaccurately 1000 Hz, [32]. which exceeds the minimum requirements to measure these parameters accurately [32].
Figure1.1.AAschematic schematicrepresentation representationof ofthe thesensor sensorsetup. setup. Sensitive Sensitive axes axes of of the theaccelerometer accelerometer in inthe the Figure heelcup cupinertial inertialmeasurement measurement unit unitare arerepresented representedby byarrows: arrows:horizontal horizontal forward forward direction direction (acc_x) (acc_x) heel andvertical verticalacceleration acceleration(acc_z). (acc_z). The The angular angular velocity velocity of of the the shoe shoe was wasmeasured measuredin inthe thesagittal sagittal(ω1) (ω1) and and frontal plane using a gyroscope. The accelerometer, located at the tibia, measured accelerations and frontal plane using a gyroscope. The accelerometer, located at the tibia, measured accelerations alongthe thelongitudinal longitudinalaxis axisof ofthe thetibia tibia(acc_T). (acc_T). along
2.4. Data Analyses
Sensors 2018, 18, 130
4 of 12
2.4. Data Analyses Data from the sensors were analyzed in post-processing using MATLAB R2016b (MathWorksTM, Natick, MA, USA). Prior to all of the processing steps, the data were filtered using a zero-lag Butterworth low-pass filter (accelerometers: 4th order at 200 Hz; gyroscopes: 4th order at 50 Hz) to remove noise. In the next step, accelerations measured with an OR of ±70 g were cut at ±32, ±16, and at ±8 g when exceeding their respective thresholds. After the data cutting, running parameters were calculated for all four ORs (±70, ±32, ±16, and ±8 g) separately, as described below. To separate the strides of the right foot in continuous data, the accelerometer signal of the IMU at the heel cup (vertical axis) was 80 Hz zero-lag high pass filtered and the first peak in the filtered signal was defined as the foot touchdown [5,36]. For each stride, the orientation angle of the shoe in the sagittal plane (θ) was calculated using integrated data from ω1. A nulling algorithm was then applied to the orientation angle of the shoe to eliminate errors resulting from integration offset and from drift error [32]. The time of two consecutive flat shoe phases (flat relative to the ground) was detected by finding the lowest absolute angular velocity in ω1 for each stride. The shoe orientation angles at these reference times were used in a linear drift model to eliminate the drift error and the integration offset. Based on Sabatini et al. [21] and Mitschke et al. [32], acc_x, acc_z, and the orientation angle θ were used to calculate the resulting horizontal acceleration (acc_hor) of the right shoe (see Equation (1); Figure 1). acc_hor = acc_x·cos(θ) − acc_z·sin(θ)
(1)
Subsequently, the horizontal velocity of the shoe (v_x) was calculated using a numerical integration of acc_hor. To eliminate the drift error and the integration offset of the shoe velocity, the velocity of the shoe during the flat shoe phases was assumed to be temporarily equal to zero [37]. Therefore, velocity was reset to zero as the stride start condition and for error back-propagation with a linear drift model [32,38]. The mean running velocity (runVel) was calculated by averaging v_x over time between two consecutive flat shoe phases. Furthermore, the stride length (strLen) between two consecutive flat shoe phases was calculated using integrated data from v_x. For kinetics, the positive peak tibial acceleration (PTA) was defined as the maximum acceleration value of the accelerometer at the tibia (Figure 1: acc_T) [12,35]. 2.5. Footwear Conditions To quantify the shoe midsole stiffness, shoes were tested in a servo-hydraulic testing device (HC10; Zwick GmbH & Co. KG; Ulm, Germany) as described in Schwanitz and Odenwald [39]. Each footwear condition underwent a total of ten load tests of 103 load cycles each. Load cycles were applied to the heel of each running shoe by a spherically shaped stamp (50 mm). The load-time profile was derived from biomechanical measurements of ground reaction force while running at a velocity of 3.5 ± 0.1 m/s [40]. For each footwear condition, midsole deformation at the 101st load cycle was analyzed for each of the ten test sessions. Internal studies have shown that the cycles after the 100th cycle represent reliable results when testing shoes mechanically [41]. The sampling rate was 1000 frames per second, and the data were analyzed using MATLAB R2016b (MathWorksTM, Natick, MA, USA) in post-processing. The midsole stiffness in the rearfoot area between 1000 and 1500 N was calculated for each footwear condition using Equation (2). stiffness =
1500 N − 1000 N deformationF=1500 N − deformationF=1000 N
(2)
2.6. Statistical Analyses To compare footwear stiffness, the mean and standard deviations (mean ± SD) were calculated. Given that parameters were normally distributed, a one-way analysis of variance (ANOVA) followed
Sensors 2018, 18, 130
5 of 12
by Bonferroni post hoc tests were used to determine whether differences existed between mechanical footwear characteristics. The level of significance was set to an alpha of 0.05. Furthermore, the means of the five trials for each subject and for each footwear condition were used to calculate the group means and the standard deviations (mean ± SD), and the 95% confidence intervals (95% CI) for strLen, runVel, PTA, and all ORs. Due to normal distribution, paired sample t tests were used to compare the reference (±70 g) with the three lower ORs (±32, ±16, and ±8 g) for strLen and runVel for each of the three footwear conditions. In addition, Wilcoxon tests were used to compare the reference with the lower OR for PTA for each footwear condition. A Bonferroni correction was used to adjust the p-values (p = 0.05/3/3 = 0.006) in relation to the number of comparisons between the investigated OR (n = 3) and the investigated biomechanical parameters (n = 3). The effect size (Cohen’s d) was calculated to quantify the magnitude of differences between the shoe characteristics and the magnitude of differences between the biomechanical parameters examined with different ORs. The coefficients were interpreted as a trivial effect (d < 0.2), a small effect (d < 0.5), a medium effect (d < 0.8), and a large effect (d ≥ 0.8) [42]. Additionally, mean differences (MDs), relative mean differences in percent (MD_rel), and root mean square errors (RMSEs) were calculated between the reference OR and each of the lower ORs. 3. Results 3.1. Footwear Characteristics All pair-wise comparisons reached statistical significance (p < 0.001). Cohen’s d showed large effects (d ≥ 0.8) in all footwear conditions. The lowest rearfoot stiffness was found for ASICS (156.9 ± 0.1 N/mm) and the highest stiffness was found for ADIDAS (210.3 ± 0.4 N/mm) (Table 1). Table 1. Group mean ± standard deviation (SD) for rearfoot stiffness of the three footwear conditions; statistical significance (p < 0.05) and large effects (d ≥ 0.8) were found in all footwear conditions.
Footwear Condition ADIDAS PUMA ASICS
Stiffness (N/mm) Mean
SD
210.3 177.8 156.9
0.4 0.4 0.1
3.2. Biomechanical Parameters: Stride Length, Running Velocity, and Peak Tibial Acceleration For each footwear condition, results of the strLen and the runVel calculations, as well as the PTA values are represented in Figures 2–4 for the reference OR and for the lower ORs. When comparing the OR of ±70 g and ±32 g, no significant differences were found for runVel for all three footwear conditions (Table 2). Distinctly greater differences to the reference were found using the ORs of ±16 g and ±8 g. Setting the OR to ±16 g resulted in significant differences, up to 3.48% (ADIDAS: MD: 0.13 m/s; p < 0.001), and large effects (d ≥ 0.86) for all three footwear conditions. When using an OR of ±8 g, a significantly lower runVel of up to 9.68% (ADIDAS: MD: 0.36 m/s; p < 0.001) was found. When comparing strLen, calculated using ORs of ±70 g and ±32 g, no significant effects were found for ADIDAS, PUMA, or ASICS (Table 2). When using sensors with a lower OR, strLen calculations resulted in significant differences for all footwear conditions (MD > 2.62 cm; MD_rel > 0.99%; p < 0.001), showing large effects for all comparisons (d > 0.84). The highest strLen difference between the reduced OR and the reference was found for Adidas. An OR of ±8 g resulted in a 9.68% lower stride length in comparison to the reference OR (MD: 26.15 cm; p < 0.001). No significant differences were found for PTA when comparing an OR of ±70 g and ±32 g, and of ±70 g and ±16 g for all footwear conditions (Table 2). The comparison of the OR ±70 g
Sensors 2018, 18, 130
6 of 12
and ±8 g revealed significant differences for all footwear conditions of at least 9.76% on average (ASICS: MD: 0.61 g), which resulted in a medium effect (d = 0.60). The greatest difference between the OR of ±70 g and ±8 g was found for ADIDAS (MD: 2.65 g; MD_rel: 28.17%; p = 0.002; d = 0.65). In general, we130found that with higher midsole stiffnesses, the differences increased between6 of the Sensors 2018, 18, 12 Sensors 2018,OR 18, 130 reference and ±16 g, as well as between the reference OR and ±8 g (Figure 4 and Table 2). 6 of 12
Figure 2. A boxplot of the three footwear conditions for running velocity (runVel), calculated with 2. A boxplot of the three footwear footwear conditions for running velocity (runVel), calculated calculated with Figure 2. different accelerometer operating ranges of ±70, ±32, ±16, and ±8 g. Significant differences between different accelerometer accelerometeroperating operatingranges rangesofof±±70, ±16, different 70, ±±32, 32, ± 16, and and ±8 ±8g. g. Significant Significant differences differences between stride lengths are marked with ** (p < 0.001). are marked marked with with ** ** (p (p