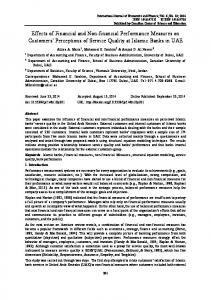
The Effects of Interface and Context on Mapping Financial Statement ...
Recommend Documents
21 Nov 2012 - of action and related aspects in detail, and the reader is referred .... not available; PL, placebo; TCZ, tocilizumab; TNF, tumour necrosis factor; for trial acronyms see respective ... decreases are not maintained throughout the 4week
Jul 31, 2015 - On 8 September 2015, the transaction documents for the Multi-Currency Sukuk Programme has been duly execu
Mar 14, 2017 - A total of 120 participants completed questionnaires, where ... within financial domains (e.g., positive scenarios such as salary and negative ones such as gamble to ... (e.g., holiday travel, betting on horses and buying a car).
Sep 30, 2015 - ASSETS. Cash and cash equivalents. 18. 29,297,126. 52,153,878. 32,169,625. Restricted Deposit with CBN. 6
Thirty Seventh International Conference on Information Systems, Dublin 2016. 1. Impact of XBRL on Financial Statement. Structural Comparability. Research-in- ...
volume fraction, polymer matrix and filler moduli. A .... size for both matrix and filler were evaluated. ..... [5] Zuiderduin WCJ, Westzaan C, Hue´tink J, Gaymans.
security Risk Context Statement (RCS) has been developed, and aims to: .... open sources, which may include publicly ava
the user can learn financial statement analysis most effectively by performing the analysis on real-world companies. Wah
1970; Rubin-Rabson, 1937; Schlabach, 1975) and use of incentives (Rubin-. Rabson, 1941.) ... ronments (Chaffin et al., 2002; Ginsborg, 2002; Lehmann and Ericsson,. 1998 .... recall the musical material in performance on a concert stage.
ticket booking mobile solution using a computer software. CMap tool. Keywords â Cognitive Mapping; Concept Map; User. Interface Design; Object-Action ...
Keywords: Financial statement presentation, fair value measurement, heuristic-systematic ... This is generally consistent with current income statement format.
May 8, 2008 - Useful discussions with Preet M. Singh, formerly of Case Western Reserve University (CWRU) ... M. Manoharan, J.J. Lewandowski: Acta Metall.
Sep 25, 2016 - period, market value of banks' shares stood at JDs 6 billion while total market ... Accordingly, this study aims to answer the following questions: ... policies that affect the accounting disclosure of the company's profits and its ...
students: (1) are employing tools that they are more familiar and comfortable with
... pro forma financial statements, and the facilitation of financial decision making.
F .... accounting texts (Harrison, Horngren & Thomas, 2010; Kimmel, Weygandt .
Electronic copy of this paper is available at: http://ssrn.com/abstract=622921. 2. Financial Statement Effects of Adopting International Accounting Standards: The.
aim is to analyze how poverty risks and early income career at adult age are influenced by different neighborhood contexts in early youth. We use Swedish ...
Dec 19, 2016 - Bradley, & Hamm, 1993), facial expressions (e.g., Schacht &. Sommer, 2009a) ..... Action Coding System (Ekman & Friesen, 1978). The correspond- ..... Hinny is the offspring of a male horse and a female donkey. neutral ibex.
The variables used in the analysis are Gross Profit Margin, Operating Profit Margin, Net Profit. Margin, Return on Equity (ROE), Return on capital Employed ...
Dec 31, 2015 - quoted prices (unadjusted) in active markets for identical assets and liabilities (Level 1) and the lowes
these types of elements of comparison (e.g., 1031 .... The Internal Revenue Code Section 1031 provides that no gain or loss will be recognized (taxed) on.
Sep 25, 2014 - Published by Canadian Center of Science and Education. 201 ... their performance or what many writers would call balanced scorecards (e.g., ...
Keywords: Financial development, financial structure, Economic growth, Co ... financial intermediation and its role between debtor and creditor, capital formation, ...
by Lewis and Clark during their expedition;. "perceived ... scientific discovery and subscribed to the aims ...... tile Indians, and the manliness of the Corps of.
financial risk management has no effect on the firm value. In addition, ..... Effect of The Enterprise Risk Management Implementation on. The Firm Value of ...
The Effects of Interface and Context on Mapping Financial Statement ...
Jan 4, 2009 - and Cash Equivalents, at Carrying Valueâ provides two child elements to the parent ... not break down beyond Cash and Cash Equivalents.
Interacting with Interactive Data: The Effects of Interface and Context on Mapping Financial Statement Elements to the XBRL U.S. GAAP Taxonomy Roger Debreceny School of Accountancy Shidler College of Business University of Hawai‘i at Mānoa [email protected] Stephanie Farewell Department of Accounting University of Arkansas at Little Rock [email protected] Nolan Kido School of Accountancy Shidler College of Business University of Hawai‘i at Mānoa [email protected] Our thanks to the Shidler College of Business at the University of Hawai‘i at Mānoa for funding; Michael McDonald and Adam Massey for programming; John Turner, Martin Hutchinson, Stuart Rowan and Matthew Boyle at Corefiling Limited for support of the experiment. First Draft‐Please do not cite. All comments welcome and appreciated. 1
4‐Jan‐09
Interacting with Interactive Data: The Effects of Interface and Context on Mapping Financial Statement Elements to the XBRL U.S. GAAP Taxonomy Abstract The Securities and Exchange Commission has mandated the phase‐in of an interactive data format termed XBRL (eXtensible Business Reporting Language). Given that successful mapping of financial statement line items to the XBRL taxonomy is critical to the accuracy of the instance document, it is important to understand factors that influence mapping success. We study the impact of how the navigation method used to locate financial statement line items within the U.S. GAAP Taxonomy impacts the effectiveness and efficiency of the mapping task. In a between‐subjects experiment, we investigate three navigation methods: hierarchical, direct search and the availability of both hierarchical and direct search. We assess the influence of line‐ item complexity on effectiveness and efficiency as a within‐subjects variable. Results indicate that the use of direct search leads to a decrease in time taken, a significant increase in incorrect answers and overconfidence in those incorrect answers. Complexity leads to a significant decline in accuracy across navigation methods. We further find that the presence of context does not affect mapping effectiveness or efficiency. The results of the study are important to corporations as they begin to prepare tagged financial statements and to financial statement consumers such as auditors, the SEC and investors.
2
4‐Jan‐09
Interacting with Interactive Data: The Effects of Interface and Context on Mapping Financial Statement Elements to the XBRL U.S. GAAP Taxonomy 1. Introduction On December 17, 2008, the Securities and Exchange Commission (SEC) passed a rule mandating filers to adopt what the SEC terms “interactive data.” This rule—which represents a critical change to the disclosure environment of U.S. capital markets— requires largei filers to furnish XBRL‐tagged financial statements to the Commission beginning with their first quarterly filing ending on or after June 15, 2009(SEC 2008c). The eXtensible Business Reporting Language (XBRL) is a knowledge representation language for reporting business metadata (Debreceny and Gray 2001; Kernan 2008). The focus of the first stage of adoption is on the core financial statements. While the financial statements will be tagged at the line item level the notes and disclosures that accompany the financial statements will be tagged at the block level in year 1. In later years, the Commission requires other disclosures such the Notes to the Financial Statements to be prepared in more detail. In preparation for this change, XBRL U.S. has prepared a large dictionary of more than 12,000 financial statement concepts organized in a taxonomical format. The basis for this taxonomy is the current U.S. GAAP (XBRL US 2008a). The first stage in compliance with the rule will require filers to match line items on their existing financial statements to the elements within the XBRL U.S. GAAP taxonomy. While U.S. GAAP requires a degree of consistency in form and appearance, financial statements can possess significant entity‐level variation. In some cases, filers will align particular disclosures with the U.S. GAAP taxonomy. In other cases, because of the importance of their entity‐specific disclosures, filers will extend the U.S. GAAP taxonomy to allow them to report these material disclosures. The process of mapping financial statements to the taxonomy is clearly a significant factor in the success of the SEC’s adoption of interactive data and XBRL. Some corporations covered by the rule have participated in a pre‐existing, voluntary filing program (e.g., Coca Cola, GE and 3M). Many of these filers have gone through the mapping process multiple times as the U.S. GAAP taxonomy has matured over the years. However, the voluntary filers represent only a fraction of the companies affected by the SEC mandate. More than 90% of filers ultimately affected by the SEC mandate have not gone through the process of 3
4‐Jan‐09
mapping the financial statements to the U.S. GAAP taxonomy. For any given financial statement element, the process requires that users make one of four choices. They must either (1) locate an element in the taxonomy within the hierarchical financial statement structure that precisely matches the semantic meaning of the financial statement line item; or (2) locate an element in the taxonomy that precisely matches the semantic meaning of the financial statement line item and use a firm‐level extension to the U.S. GAAP taxonomy to report a material difference in the label of the taxonomy element; or (3) determine that the item exists elsewhere in the taxonomy and must be extended to be placed within the hierarchical structure, or finally (4) determine that no element exists in the taxonomy for the particular financial statement line item and that a new XBRL taxonomy element is required in a firm‐specific extension. These are challenging choices for the filer. The accuracy of the filer’s report to the commission, termed an “instance document,” is dependent on the successful mapping of the financial statements to the taxonomy. Given the complexity of the taxonomy, limited guidance available and overall lack of experience with the task, errors can occur. In a mock audit of United Technologies, Boritz and No (2008) found that over 50% of the elements contained in an instance document furnished under the SECs Voluntary Filing Project were from an extension taxonomy and that several extensions were redundant with approved taxonomy elements. (Boritz and No 2008). Further, Boritz and No (2007) found the significant use of extension taxonomies across all firms’ instance documents furnished under the SEC Voluntary Filing Project (Boritz and No 2007). It is possible that filers will create unnecessary extensions due to their inability to interact with the taxonomy to create an accurate mapping. The process by which a company chooses to map the financial statements to the taxonomy may have a significant impact on the accuracy of the mapping. A company may choose to locate line items within the hierarchical structure of the taxonomy or to utilize the search feature located within taxonomy viewing software (XBRL US 2008b). Errors in mapping will reduce the usability of the instance document data. For example, creating new tags rather than simply adding a new label hinders comparability. Further, unnecessary extensions will reduce rather than enhance transparency. XBRL US is the organization that supports the U.S. GAAP Taxonomy. They, along with commercial vendors, provide a tool to present alternative interfaces into the taxonomy. The interface mechanisms include a hierarchical structure and a search tool. Human‐computer 4
4‐Jan‐09
interaction (HCI) theory suggests that the quality of user mapping under these alternative interfaces will vary. An important characteristic in the HCI literature is the effect of context. It is possible that the presence or absence of context for a financial statement line item will affect the accuracy of the mapping process. The effectiveness and efficiency of the mapping task is also dependent on the complexity of the particular financial statement line item. To control for this, we manipulate complexity at three levels: low, medium and high. We test these factors in an experiment with senior undergraduates and postgraduates in accounting. We find that the effectiveness and efficiency of subjects drops sharply as complexity increases. We also find that the interface we provide to the subject influences their effectiveness and efficiency. We do not find that providing context for a particular financial statement element improves subjects’ mapping effectiveness and efficiency. This study makes a significant contribution to the literature on interactive data, XBRL and user interaction with complex and multifaceted taxonomies. It is the first to assess the implications of filers working with the U.S. GAAP XBRL taxonomy. The taxonomy is at the core of the SEC’s adoption of “interactive data.” A critical success factor in the rollout of XBRL is the way in which filers align their pre‐XBRL financial statements to the elements in the U.S. GAAP taxonomy. The paper will be of interest to policy makers notably at the SEC, filers, auditors, members of the XBRL community and HCI practitioners. We organize the remainder of the paper as follows: The next section presents the background and motivation. The third section sets out the relevant theory and our hypotheses. Section four contains the research method. The fifth section contains the results. Our final section provides a discussion of the results including implications for instance document consumers, software designers and policy setters.
2. Background and Motivation XBRL The eXtensible Business Reporting Language (XBRL) is a non‐proprietary computer readable mark‐up language for the exchange of business and financial information. It is compatible across hardware and software platforms. XBRL tagged financial information “does not provide any more data than standard financial statements; it provides the data in a format that computers can sort, group and categorize. When used correctly, XBRL changes the appearance and 5
4‐Jan‐09
improves the delivery mechanism for financial statements, but it does not alter their meaning” (XBRL US 2008b, 6, hereafter referred to as Preparers Guide). XBRL consists of several related components. The XBRL Specification (currently version 2.1) defines the structure. The taxonomy is the data dictionary that defines the reporting concepts. Further, the taxonomy defines how the items relate to other items in the taxonomy in terms of presentation and calculation. The instance document reports the financial facts of a particular entity for a period. The instance document maps to a taxonomy. Finally, style sheets format the instance document for viewing. The benefits of XBRL include interoperability, decreased costs and increased efficiency (Debreceny and Gray 2001). Another key benefit of XBRL is the meta‐data tags. The taxonomy‐ defined data tags and the instance document contain meta‐data about the information within the tags. Specifically, XBRL tags provide information about the time period, precision, units and the reporting entity. Inherent in XBRL is the ability to validate the content of the instance document based on taxonomy‐defined relationships. In addition, a key benefit of XBRL is its extensibility to meet individual reporting needs. However, extensibility can be a detriment if it reduces comparability. XBRL has been adopted around the world for internal and external reporting. Most applications have been mandated by governments for required governmental and regulatory filings. Like the U.S. Securities and Exchange Commission, a number of countries have conducted XBRL pilot programs and/or now require the use of XBRL. XBRL‐adopting countries include Australia, Belgium, Canada, China, Denmark, France, Germany, Ireland, Israel, Japan, Korea, Luxembourg, the Netherlands, New Zealand, Norway, Singapore, Spain, Sweden, Thailand and the United Kingdom (XBRL International 2008). Mandated filings allow government agencies to achieve significant cost savings by eliminating the need to re‐key information. XBRL Adoption by the SEC United States Securities and Exchange Commissioner Christopher Cox has been instrumental in the agency's adoption of interactive data, XBRL. The agency initiated a voluntary filing project in March 2005. To date over 75 companies have participated in furnishing tagged financial documents (SEC 2008a, 7). On December 17, 2008 the U.S. Securities and Exchange Commission
6
4‐Jan‐09
(SEC) approved a rule that which requires registrants to “provide interactive data reports starting with their first quarterly report for fiscal periods ending on or after June 15, 2009” (SEC 2008c). The rule will be phased in over a three year period. Previously, on August 19, 2008, the SEC announced that the new Interactive Data Electronic Application (IDEA) would replace the EDGAR system and leverage interactive data's benefits for investors (SEC 2008b). To comply with the SEC mandate, a company must furnish an instance document with their required filings. At the same time the company must make the instance document available on its company website. While the initial XBRL U.S. GAAP taxonomy used by the earliest voluntary filers included approximately 4,000 data tags, the current version of the taxonomy includes over 12,000 data tags. A significant number of the new tags have been added for footnotes despite the fact that only block tagging of footnotes is required in the initial stages of implementation. XBRL‐tagged data is not intended to provide a different amount of information from that contained within the traditional financial statements it is only intended to provide information in a format that facilitates electronic exchange. Consistent with the voluntary filing program rules, the new SEC rule requires that a label in the instance document align with its corresponding item in a traditional financial statement. Companies may not aggregate data. To meet this requirement many companies will be faced with a choice between extending the taxonomy by adding new elements or by changing data labels. The SEC rule addresses this issue by limiting the use of extensions. Guidance suggests users find an existing taxonomy element that matches the definition of the financial statement item and change the label rather than create a new element. It is believed the user software will allow for the detection and evaluation of the necessity and validity of such extensions. Importance of Mapping Task Currently, most firms follow a paper‐centric view of preparing XBRL instance documents. As such, the U.S. GAAP financial statements are prepared in a traditional manner prior to preparation of the instance document. This is followed by mapping the financial statements to the appropriate taxonomy and creating an instance document, as shown in Figure 1. The taxonomy mapping and instance document creation may be accomplished within the firm or outsourced. Regardless of whether the process is done in‐house or outsourced, the accurate mapping of the financial statements to the taxonomy and any extension taxonomy is critical to 7
4‐Jan‐09
the accuracy of the instance document. For example, errors in mapping could lead to items being mapped to the wrong element as defined in the taxonomy or to the creation of unnecessary elements in an extension. Errors of any type will decrease the reliability and usability of the instance document. Insert Figure 1 about here The first step in the mapping process, after preparation of the GAAP‐compliant financial statements, is to locate the financial statement items in the relevant taxonomy. Within the U.S. GAAP taxonomy there are six industry entry points into the taxonomy (Banking and Savings Institutions, Brokers and Dealers, Commercial and Industrial, Insurance and Real Estate). The entry points group financial statement concepts that share common relationships. These entry points are designed to increase the efficiency of locating elements for a particular industry. Regardless of the entry point chosen, the entire taxonomy of over 12,000 elements is available for use in the mapping task. Preparers should ensure that the definition of an element accurately describes the financial reporting concept regardless of where the concept appears (i.e. within a financial statement hierarchy or disclosure group). “When deciding whether an element is the most appropriate for the particular concept in the financial statements, the definition is the single most important piece of information preparers should consider, but it should not be the only information considered” (XBRL US 2008b, 21). Preparers must also consider data type, period type and Authoritative References. While Authoritative References are not comprehensive, they do serve to distinguish elements. As such, they should not be used as a check‐list for GAAP compliance or as primary evidence in the decision whether an element is an appropriate match. Relationships (presentation, calculation and dimensions) also provide secondary evidence on the accuracy of an element mapping to a financial reporting concept. If an appropriate element cannot be located in the taxonomy, preparers are required to extend the taxonomy. There are many additional reasons to extend the taxonomy including: changing the label that is displayed for a particular fact, changing the ordering within a parent‐child relationship and creating new groups. The process of creating an instance document should begin only after the mapping process is completed and the accuracy and presentation of the mapping have been verified. 8
4‐Jan‐09
Interface issues The U.S. GAAP taxonomy was designed to allow for elements to appear in the hierarchical structure of financial statements for each particular industry entry point. Inherent in XBRL taxonomy editors/creators and instance document creation software is the ability to drill‐down and expand the hierarchical financial statement structure of the taxonomy to locate the element of interest. By arranging the elements by financial statement and presenting them in common financial statement order users are provided with a context to help locate elements effectively and efficiently. The context allows users to reduce the search space. The user can quickly reduce the search space from 12,000+ elements to a small subsection on a particular financial statement. However, this same reduced space may falsely lead users to the conclusion that an element does not exist and that extension is necessary. In addition, most software provides a directii search feature for locating elements. The U.S. GAAP Preparers Guide suggests that users search for items that are not located in the hierarchical structure prior to extending the taxonomy (XBRL US 2008b, 28). The CoreFiling XBRL viewer provided on the XBRL US website (viewer.xbrl.us) provides both hierarchical and search features (see Figure 2). In the left‐hand pane the hierarchical structure is illustrated whereby users can drill‐down through the structure of the taxonomy. The bottom pane shows the search feature. Information to facilitate the decision on the appropriateness of the element such as details on the references, properties, relationships and locations in the taxonomy tree is shown in the right‐hand pane. Insert Figure 2 about here Mapping Example To illustrate the mapping task we will use the most recent approved version of the U.S. GAAP taxonomy and enter through the Commercial and Industrial entry point.iii In Figure 3, panel A shows an abbreviated balance sheet and panel B displays an abbreviated income statement. Selected financial statement line items will be used to illustrate the mapping process. Insert Figure 3 about here Drilling down and expanding the sections of the “Statement of Financial Position, Classified” for “Assets,” “Assets, Current,” "Cash, Cash Equivalents and Short‐term Investments,” and "Cash 9
4‐Jan‐09
and Cash Equivalents, at Carrying Value” provides two child elements to the parent “Cash and Cash Equivalents, at Carrying Value.” See Figure 4 for the expanded taxonomy elements shown in the left‐hand (Network Browser) pane. As evidenced by the balance sheet, this company does not break down beyond Cash and Cash Equivalents. To decide whether this element matches the line item preparers cannot simply rely on the label, they must also read the definition included in the taxonomy. In so doing a preparer should reach the conclusion that this item does match the relevant concept.iv However, because the label does not match the desired label, the preparer would extend the taxonomy by altering the preferred label for rendering the financial statement. The process would continue line‐by‐line down the balance sheet. For the second balance sheet item (“Accounts Receivable, net, current”), a preparer would expand “Assets, Current,” “Receivables, Net, Current,” and find the element “Accounts Receivable, Net, Current”. Upon reading the definition of that element, the preparer should reach the conclusion that this element is an accurate match to the balance sheet item and thus no extension would be required. In the current liabilities section, the preparer would encounter “Dividends payable.” After expanding the current liabilities section in the hierarchy, the preparer would not find a “Dividends payable” element. Although there is an “Interest and Dividends Payable” element, this element is not a precise match for the financial statement line item. While an initial inclination might be to add a child element called “Dividends Payable” to the “Interest and Dividends Payable” parent, this would be a mistake. A preparer must first search the taxonomy to see if a “Dividends Payable” element is included elsewhere before adding additional elements. Upon conducting a search, a preparer would find a “Dividends Payable” element within the Disclosures section of the taxonomy. As defined, this element does capture the meaning of the “Dividends Payable” line item. Therefore, the preparer should copy and paste the element into a new relationship group (extension) and create new calculation relationships for this element. The first line item in the revenue section on the Income Statement is “Passenger Revenue”. This item maps to the taxonomy element “Passenger Revenue.” However, the second Income Statement line item “Passenger Revenue, Affiliated Airlines” cannot be found within the taxonomy by drilling down through the hierarchy or by using the search feature. Therefore, a preparer would need to extend the taxonomy by creating a new group and inserting the element “PassengerRevenueAffiliatedAirlines” as a child of “SalesRevenueNet” appearing in the presentation below the “PassengerRevenue” element and adding the appropriate calculation relationship. 10
4‐Jan‐09
Insert Figure 4 about here. Thus in our abbreviated example a preparer would encounter items that: (1) map to existing taxonomy elements, (2) map to existing taxonomy elements, but require extension to change the label, (3) map to taxonomy elements which exist outside the financial statement section of the taxonomy and must be placed in the appropriate hierarchical location and (4) require extension to create elements which do not exist in the taxonomy.
3. Hypotheses The primary focus of this study is on the impact of user interface and context on the effectiveness and efficiency of preparers in mapping financial statements to the U.S. GAAP XBRL taxonomy. We are particularly interested in how users will interact with the various tools available to complete their mapping tasks. There is little guidance in the accounting literature on the impact of interface on decision‐making. A strand in the literature addresses the way semantic representation of underlying accounting information affects user information processing tasks (Dunn and Grabski 2000; Dunn and Gerard 2001; Debreceny and Bowen 2005). These studies show that increased semantic expressiveness increases decision‐maker performance. A second strand considers the influence of information format on decision‐ making. These studies address the effect of factors like disclosure format (e.g. financial statement recognition in notes versus disclosure in the financial statements) on end‐user performance in tasks such as financial statement analysis (Elliott 2006; Nelson and Tayler 2007). These studies show that emphasis and format do affect decision‐making performance. Hodge et al. (2004) show that the availability of search tools, such as those facilitated by XBRL, that assist users to find financial statement disclosures improves end‐user decision‐making performance. A third and considerably more limited strand, investigates the effect of information presentation structure on decision‐making performance. Peng et al. (2007) research the way users interact with data warehouses organized in a hierarchical fashion. The multidimensional hierarchies in a data warehouse have some similarity to those in XBRL taxonomies. In an experimental test, the authors find that predictions of signals (neutral/directional) at higher levels of the aggregation hierarchy influence decision‐making. Users who receive neutral signals are less likely to drill down into the aggregation hierarchy than those who receive directional signals.
11
4‐Jan‐09
Taken in the aggregate, these studies show that factors such semantic expressiveness, presentation format and system signalling do influence the quality of end‐user decision‐making performance. Unfortunately, these studies do not bear directly on alternative perspectives of interacting with accounting information represented in taxonomic form. Thus, we rely on theory from the long tradition of Human Computer Interaction (HCI). However, even this literature is somewhat limited for our purposes. Much of the HCI theory relates to navigation and information retrieval in a semi‐structured hypertext environment (Chen and Rada 1996; McDonald and Stevenson 1996, 1998, 1999; McKnight et al. 1993). This literature has much in common with and draws from research on navigation strategies in the physical world where humans use a variety of cues and cognitive processes to navigate complex structures (Passini 1984). We rely on this literature to motivate our hypotheses on the effect of interface and context. Interface Since prior literature identifies the navigation tools available to the user to be a significant factor in determining mapping success (Tung et al. 2003), we expect differences across the three interface conditions. There is a general expectation for users with multiple interface tools to have higher accuracy (Xu 2007) and higher speed (Hsu and Schwen 2003) than users with a single interface tool, although the literature is not unanimous with regard to speed (Padovani and Lansdale 2003). Concerning our experiment, we expect subjects having both the hierarchy and search navigation tools to be more accurate, more confident and faster than subjects who have only one navigation tool. The comparison between exclusive use of a hierarchy versus exclusive use of a search tool is less clear. We are unable to identify any prior studies explicitly testing the effect of a hierarchy tool versus a search tool. The literature on search tools contains conflicting evidence and criticism regarding external generalizability (Hsieh‐Yee 2001; Jansen and Spink 2006) while the literature on hierarchical organization is largely focused on the determinants of general usability and information‐retrieval (Fensel and Brodie 2004). The literature on hierarchy provides an indication that the structure of an information hierarchy is a critical factor in its usability (Pike and Gahegan 2007), but few direct comparisons between a hierarchy and alternate form of information‐retrieval exist. Within the hierarchy, we expect the 12
4‐Jan‐09
quality of the topic clustering and the amount of description for each element to influence mapping success (Zizi and Beaudouin‐Lafon 1995) while limitations with regard to the rigidity of the hierarchical design may contribute to lower success in the conditions lacking search (Brewster and O'Hara 2007). One stream of literature points to a probable performance benefit from search tools. Our search function includes all text within the descriptions of individual elements along with the name of the elements themselves. Using a search engine, subjects who are familiar with a verbose description of a financial statement item but not familiar with the specific name of the element within the hierarchy, would be able to search for the appropriate text descriptors (Eriksson 2007; Saba 2007). Subjects limited to the hierarchy only condition would be unable to use their knowledge of a verbose description to identify the proper element. In line with previous experimental literature in interacting with hypertext and cognate HCI domains, we take a multi‐faceted approach to the determination of user performance. We thus hypothesize that subjects in the search condition will outperform subjects in the hierarchy condition with respect to accuracy of the mapping process; confidence in conducting the mapping and speed in completing the task. H1a
The time spent in mapping financial statement items to elements within the U.S. GAAP XBRL taxonomy will be lowest for subjects in the hierarchy+search condition and highest for subjects in the hierarchy condition.
H1b
The level of confidence in mapping financial statement items to elements within the U.S. GAAP XBRL taxonomy will be highest for subjects in the hierarchy+search condition and lowest for subjects in the hierarchy condition.
H1c
The level of accuracy in mapping financial statement items to elements within the U.S. GAAP XBRL taxonomy will be highest for subjects in the hierarchy+search condition and lowest for subjects in the hierarchy condition.
Context Context has been shown to be a determinant of information retrieval success (Melucci 2008; Bai et al. 2007) as the addition of context can influence a subject's judgment regarding relevant 13
4‐Jan‐09
terminology (Lau et al. 2008). Context has also been shown to improve performance across all levels of user experience (Finkelstein et al. 2002). We expect context to be particularly important in “overlapping and near miss elements” (Piwowarski et al. 2007). In these situations, subjects may find an element that is a close—on the same branch within the XBRL taxonomy—but not precise match to the desired financial statement item. The presence of context will thus allow these subjects to use the “local context” of the closely‐related element to identify the precise matching element (Xu and Croft 2000). Thus, we hypothesize that subjects provided with context related to the financial statement items will be more accurate, more confident and faster than subjects provided with no context. H2a
The time spent in mapping financial statement items to elements within the U.S. GAAP XBRL taxonomy will be lower for subjects who receive the surrounding context for those items.
H2b
The level of confidence in mapping financial statement items to elements within the U.S. GAAP XBRL taxonomy will be higher for subjects who receive the surrounding context for those items.
H2c
The level of accuracy in mapping financial statement items to elements within the U.S. GAAP XBRL taxonomy will be higher for subjects who receive the surrounding context for those items.
Interestingly and importantly, an extensive literature search did not disclose theoretical guidance that would allow us to hypothesize the effect of any interaction between interface and context.
4. Method Design We test the hypotheses in a 3x2x3x24 experiment. There are two between‐subjects manipulations. First, we test the effect of three user interfaces to the taxonomy. Second, we test the presence and absence of context for the particular financial statement line item that is to be mapped to the taxonomy. There are two within‐subjects variables, complexity and task. Complexity is trifurcated as low, medium and difficult. We give the subjects 24 mapping tasks. 14
4‐Jan‐09
Experimental Interface We develop two applications. The first application consists of three versions of the U.S. GAAP taxonomy viewer that correspond to the three interfaces (hierarchy, hierarchy + search and search). CoreFiling, the provider of the U.S. GAAP taxonomy tool, develops and hosts these at private URLs. In our instructions, we point the subject to the URL appropriate to their interface condition. The second is a Web‐based application that takes subject through a pre‐experimental training and then gives the subject the experimental mapping tasks. We automatically collect a variety of task‐relevant data from this application. Task We develop 24 mapping tasks that the subjects must undertake. In each case, we ask the subject to map a financial statement line item to the XBRL U.S. GAAP taxonomy.v Prior to conducting the experiment, we pre‐tested the mapping tasks with experts in the XBRL community and accounting doctoral students at a large state University. Correct answers were determined by unanimous consent of pre‐test subjects. For each task where the pre‐test answers differed, the correct answer was determined by unanimous consent of the authors. We have two versions of each task. For those in the “no‐context” condition, we give the financial statement element in isolation. For those in the “context” condition, we place the financial statement element in context with the surrounding facts. Figure 5 shows a typical mapping task as presented to the subject, with (Panel A) and without (Panel B) context. Insert Figure 5 about here. We vary the complexity of the mapping tasks in two ways. The first is whether there is an exact match between the financial statement line item and any element within the taxonomy. For eight of the 24 mapping tasks there is no direct match to the taxonomy. The second measure of complexity is the level of information retrieval difficulty for items for which there is a match in the taxonomy. For subjects in the two groups with access to the hierarchy, we measure the number of hierarchical levels required to arrive at the correct taxonomy level. For subjects in the two groups with access to search, we measure the number of items presented in the search results before the correct element is displayed.
15
4‐Jan‐09
Given that, by design, the information retrieval mechanisms vary across experimental group, we cannot employ a consistent measure of complexity. We trifurcate complexity into low, medium and high. We define a task as low complexity if a matching element appears within the taxonomy within 5 levels on the hierarchical structure or if the search displays the matching element as a 100% match within the first 5 results returned. Eight of the eleven low complexity items appear first in the search results list. We define a task as medium complexity if the matching element appears in the taxonomy under any of the following conditions: (1) requires a change in the element name (i.e. singular/plural, verb tense, synonym) to return the appropriate result when using the search engine, (2) appears between results 6 and 13 in the search results list, (3) requires between 6 and 13 clicks to be displayed in the hierarchical structure. We define a task as high complexity under any of the following conditions: (1) requires an extension to the taxonomy, (2) requires more than 15 clicks in the hierarchical structure, (3) appears 14+ in the search results. Only one high complexity task, “fuel costs”, exists in the taxonomy while the other seven require extension. There are eleven low, five medium and eight high complexity tasks. We build several patterns of the 48 questions (24 questions presented with/without context). We allocate these patterns to experimental subjects randomly, to minimize order‐effects. For each task, we ask the subject three specific questions in sequence. The answer to the first question: “Is there a match in the financial statement section of the taxonomy?”, determines the second question. If the subject responds “Yes” to the first question, the subject will be asked the second question: “Which element is a match?”. If the subject responds “No” to the first question, the subject will be asked the second question: “Which element is the parent for the new element?”. Regardless which of the second questions is asked, the subject will then answer the third question, “What is your level of confidence in this answer?”vi Dependent Variables In line with previous information retrieval studies, we employ multiple measures of performance. First, although we employ 24 mapping tasks for each subject, we set the maximum time for the mapping component of the experiment at thirty minutes. This duration— which was determined based on the results of our pre‐test—was specifically established to prevent all subjects from finishing every task. We use the average time taken per mapping task (TIME) as our first measure of performance. Second, we measure the level of self‐rated 16
4‐Jan‐09
confidence with the mapping task (CNFDC). Third, we measure the accuracy of the mapping task. Our accuracy measure is complicated by the fact that each mapping task requires the preparer to make one of four choices: (1) map to existing taxonomy elements, (2) map to existing taxonomy elements, but require extension to change the label, (3) map to taxonomy elements which exist outside the financial statement section of the taxonomy and must be placed in the appropriate hierarchical location and (4) require extension to create elements which do not exist in the taxonomy. To account for varying views of correctness, we create two distinct accuracy measures. The first view is extremely tight (CRRCT_TGT). In order to be correct by this measure, the subject must choose the precise taxonomy element we identified as the correct answer to the mapping task and be both syntactically and semantically correct. Three examples demonstrate the level of precision necessary to receive a correct answer by this measure: 1) In a small number of cases, the subject would choose the incorrect answer to our first question (“Is there a match in the financial statement section of the taxonomy?”), but choose the precisely correct answer for the mapping task. For our tight measure, these answers were scored as wrong (syntactic error). For example, for questions 27 (with context) & 28 (without context), the correct answer for the first question was “No” because there was no direct match to any element in the financial statement section of the taxonomy. For the second question, the correct answer was to extend the taxonomy and place a child element within the existing parent “Salaries and Wages”. Any subjects who answered “Yes” to the first question were scored as wrong even if they correctly identified “Salaries and Wages” for the second question. 2) Any tasks for which a subject chose a taxonomy element in the disclosure section of the taxonomy when the correct element was available in the financial statement section of the taxonomy (i.e. improper extension) were also scored as incorrect. For example, the answer to questions 23 (with context) & 24 (without context) was “Accumulated Other Comprehensive Income (Loss) Net of Tax”. Two subjects chose the disclosure section element “Post‐ Confirmation Accumulated Other Comprehensive Income (Loss) Net of Tax.” Because there was a more‐precise, existing element in the financial statement section of the taxonomy, these two subjects were scored as incorrect.
17
4‐Jan‐09
3) If a subject chose an element that was very close to the correct element, but at an imprecise level of detail (i.e. one level higher or lower on the hierarchy), they were scored as incorrect. For example, the answer to questions 17 (with context) & 18 (without context) was “Accounts Payable”. Subjects who selected “Accounts Payable and Accrued Liabilities”, which is one level higher than “Accounts Payable”, were scored as incorrect. For our second measure of accuracy, we use an extremely loose view of correctness and ignore any syntactic or semantic errors (CRRCT_LSE). To be scored as correct under the loose condition, a subject would need to answer either question #1 or question #2 correctly. For example, a subject who correctly answered “Yes” to question #1, but chose the wrong element for question #2, would still receive credit for a correct answer. A subject who incorrectly answered “No” to question #1, but chose the correct element for question #2, would also receive credit for a correct answer. We collect additional descriptive data on errors that we report below in the results section. Independent Variables We have three binary variables for each of the user interfaces, viz: hierarchy alone (HRCHY) both hierarchy and search (HRCHY_SRCH) and search alone (SRCH). CNTXT is a binary variable that measures the absence/presence of context. Complexity is captured by the ternary variable CMPLX (0 = Low, 1 = Medium, 2 = High). Environmental variables We test for and control a number of environmental variables. An important environmental determinant of performance is the level of self‐efficacy, deriving from Social Cognitive Theory. Bandura (1994) defines self‐efficacy “as people's beliefs about their capabilities to produce designated levels of performance that exercise influence over events that affect their lives. Self‐ efficacy beliefs determine how people feel, think, motivate themselves and behave” (Bandura 1997; Locke and Latham 1990). Self‐efficacy positively affects decision makers’ performance via effort direction, duration and intensity (Bonner 2008, 221). There are several thoroughly tested computer self‐efficacy metrics (Marakas et al. 2007; Marakas et al. 1998b; Downey and McMurtrey 2007). Computer self‐efficacy has been shown to be a significant determinant of performance with computers (Compeau et al. 1999), computer 18
4‐Jan‐09
usage (Munro et al. 1997) and, importantly, search performance (Holscher and Strube 2000; Palmquist and Kim 2000; Lazonder et al. 2000). The literature differentiates between application‐specific and general computer self‐efficacy. We utilize a computer self‐efficacy instrument developed by Marakas et al. (2007). We use both a general measure of computer self‐efficacy (EFFCY_GEN) and a measure of self‐efficacy for Internet usage and information retrieval and search (EFFCY_INT)vii. The design of the hierarchy in the U.S. GAAP taxonomy follows the well‐understood, shared information structure of financial accounting. We expect accounting self‐efficacy to influence mapping success (Clark and McCabe 2007; Guarino 1997). Since prior knowledge and subject content have been shown to affect the subjects' use of navigation tools (Minetou et al. 2008), we also expect the level of accounting knowledge and self‐efficacy to change the nature of the relationship between interface (or context) and mapping success (Hu et al. 2007). In the absence of common measures of accounting self‐efficacy, we develop such a metric (EFFCY_ACC)viii. We draw on guidance from Marakas et al. (2007) and Bandura (1997). We develop 22 questions that cover the full range of relevant accounting knowledge for the task in this experiment. Questions include “I believe I can correctly place the items “dividends paid” and “dividends received” within the statement of cash flows,” “I believe I have the ability to understand the accounting policies in financial statements” and “I believe I have the ability to analyze financial statements for investment purposes.” As reported below, the resulting accounting self‐efficacy metric is robust (Cronbach’s Alpha = .972). Subjects' self‐efficacy ratings may be influenced by relative success during the mapping process (Marakas et al. 1998a; David et al. 2007) as part of the reciprocal relationship between self‐ efficacy and performance. Therefore, we measure both computer and accounting self‐efficacy several weeks prior to the experiment. As a secondary measure of knowledge, we measure the number of classes in computing (CMP_CLASS) and accounting (ACC_CLASS). As a measure of general academic achievement, we collect the cumulative GPA (GPA). We also test for gender (GNDR), years of work experience (WORKYRS) and whether the subject is a native English speaker (NTVSPKR). We summarize the variables employed in the time‐series regression below in Figure 6. Insert Figure 6 about here 19
4‐Jan‐09
Participants Participants in the experiment are 92 studentsix drawn from accounting majors in undergraduate (81) and postgraduate (11) classes at two large state universities in the USA. The undergraduate subjects receive course credit for participation in the experiment, although credit is not dependent on performance in the experiment. Data collection The experimental environment collects the time spent on each question, the level of confidence, whether a match exists in the taxonomy for the given financial statement term and the relevant taxonomy element. Judgment must be exercised in the determination of mapping quality. Following the aforementioned scoring method, one of the authors identifies the correctness of the mapped taxonomy element. As well as determination of the tight and loose semantic matches (CRRCT_TGT and CRRCT_LSE), the author also assesses if an incorrectly chosen element was at least located in the correct financial statement and (when applicable) the number of levels from the correct element in the aggregation hierarchy.
5. Results Biodata There are 92 subjects in the experiment. We show the allocation of subjects to experimental cell in Panel A of Table 1. We show the descriptive statistics in Panel B of Table 1. All of the undergraduate subjects had completed the equivalent of three semesters of financial accounting (Introductory Financial Accounting, Intermediate Financial Accounting 1 and Intermediate Financial Accounting 2) and many had completed a fourth semester (Advanced Financial Accounting). All of the postgraduate accounting students were in their last semester in a Master’s in Accountancy program and possessed more experience and coursework than the undergraduate subjects. Subjects had completed a significant number of accounting courses (mean = 6.5, SD = 4.1)x. 61% were female with an average age of 27 (SD = 7.0) and 3.72 (SD = 5.34) average years of work experience. Insert Table 1 about here.
20
4‐Jan‐09
Descriptives Most subjects were able to complete the full complement of mapping tasks within the designated time. There was considerable variation in the time taken for mapping tasks, ranging from a few seconds to nearly 25 minutes. The average time spent on each mapping task was less than 2 minutes, with high complexity tasks taking 25% longer than low or medium tasks. Subjects make the correct syntactic and semantic mapping choice for 29% of the tasks (CRRCT_TGT). When we look past syntactic errors and apply somewhat loose conditions on the semantic match from financial statement element to taxonomy element, the average mapping is correct in 67% of the tasks (CRRCT_LSE). In general, subjects are quite confident in their choices. A more intricate picture emerges when we drill down by interface, context and level of complexity. We show this breakdown in Table 2. There are some interesting and counter‐ theoretical trends in this analysis. First, while the presence of context does improve the quality of mapping, the effect is not strong. In some cases, such as in the search only group, the presence of context actually reduces mapping quality. Second, complexity clearly provides a stress test of the subject’s ability to map across the three interfaces. Overall, there is a substantial drop in performance from the low to high complexity tasks (80% reduction in CRRCT_TGT and 39% for CRRCT_LSE). Third, the interface condition is associated with clear differences in the level of user mapping performance, particularly under conditions of moderate and high task complexity. In all but one case, members of the Search group are less effective than either the Hierarchy or Hierarchy+Search groups. There is little difference between the latter two groups. It appears that the mere presence of a hierarchy substantially improves mapping performance. Interestingly and importantly, the differences in mapping performance are contrary to differences in the level of confidence. Although the search group is always more confident than either the Hierarchy or Hierarchy+Search groups, the search group is always the least accurate in mapping. Insert Table 2 about here
21
4‐Jan‐09
Regression results In Panel A of Table 3, we show panel, time‐seriesxi Logit analyses for CRRCT_TGT and CRRCT_LSE as dependent variables and panel, time‐series OLS regressions for time taken (TIME) and confidence (CNFDC)xii. Recall that we had no theoretical support to understand the interactions between interface, context and complexity. We explore all the two‐ and three‐way interactions for each dependent variable. As we find no statistically significant results, we do not report these interactions. We summarize the hypotheses and the results of the regression analyses in Panel B of Table 3. When considering the effect of interface (H1) we find somewhat mixed results. In terms of the amount of time expended, subjects in the “Hierarchy‐only” group (HRCHY) took the greatest time and there was no statistical difference between the HRCHY_SRCH and SRCH groups. In terms of confidence (CNFDC), we found only limited support for our predictions. As we predicted, the HRCHY group had the lowest level of confidence. The effect of HRCHY_SRCH membership was not significant. The effect of SRCH group membership was significant but in the opposite direction to our prediction. Insert Table 3 about here Recall that we have two measures of mapping effectiveness – one that imposes a strict semantic and syntactic rule on identification of the appropriate taxonomy element (CRRCT_TGT) and a second that looks past syntactic and minor semantic errors (CRRCT_LSE). We had predicted that the “Hierarchy‐only” group (HRCHY) would have the lowest level of mapping effectiveness with the HRCHY_SRCH having the highest level. Our predictions received only partial support for CRRCT_TGT and were not supported for CRRCT_LSE. The effects for HRCHY_SRCH and SRCH group membership were significant for both accuracy measures while the effects of HRCHY were significant only for the CRRCT_LSE dependent variable. Under both measures, membership of the SRCH group gave rise to the poorest mapping outcomes. The results for HRCHY and HRCHY_SRCH were mixed. Subjects in the search‐only group were the least accurate and having access to the search tool did not give the HRCHY_SRCH group a clear‐cut advantage over the HRCHY group. Overall, we can claim only partial and limited support for our H1 hypothesis. In general, we find little support for our predictions for context (CNTXT) (H2). Only H2B is supported (CNFDC). In contrast with our prediction, the presence of contextual information does not significantly improve mapping performance. However, it is possible this result is 22
4‐Jan‐09
dependent upon the specific items chosen for the mapping tasks. For example, it is likely that the vast majority of subjects would be able to correctly place “Accounts Receivable” into the correct section of the balance sheet even in the absence of context. With substantially more difficult mapping tasks or less knowledgeable subjects, context may well play a significant role in performance. Additional Robustness Tests and Analyses. Recall that we collected a number of control variables including: general computer self‐efficacy (EFFCY_GEN), Internet usage self‐efficacy (EFFCY_INT), software usage self‐efficacy (EFFCY_SWARE), accounting self‐efficacy (EFFCY_ACC), number of accounting classes (ACC_CLASS), number of computing classes (CMP_CLASS), cumulative grade point average (GPA), number of years of work (WORKYRS) and whether the subject was a native speaker of English (NTVSPKR). We show the pair‐wise correlations in Table 4. The only control variable that correlates with the principal dependent variables (CRRCT_TGT and CRRCT_LSE) is whether the subject is a native speaker. We then iteratively ran the regressions shown in Table 3 by introducing each of the control variables. NTVSPKR was the only significant control variable and it was only significant in two regressions. Subjects identified as a native‐English speaker were both more confident and more accurate (as measured by CRRCT_TGT but not CRRCT_LSE). In neither of these regressions did introduction of the NTVSPKR control variable change the outcomes described in the previous subsection. Insert Table 4 about here. Implications There are three striking and clear conclusions from these experimental results. First, regardless of interface, mapping accuracy drops sharply as the level of complexity increases. For high complexity tasks, users’ choices were exactly correct in only 10% of the cases (CRRCT_TGT) and approximately correct in half the cases (CRRCT_LSE). Further research is needed to understand more about this marked reduction in effectiveness. Is this because of the subject group? Would professionals with some years of experience be significantly more productive? Is it because of the unquestionable complexity of the taxonomy itself, with more than 12,000 terms and different information structures? Or is it technology dependent? Would a different tool for interaction with the taxonomy result in a better outcome? 23
4‐Jan‐09
The second principal conclusion is that providing subjects with context did not markedly improve mapping efficiency and effectiveness. As discussed previously, it is possible this result is dependent upon the specific items chosen for the mapping tasks. Tasks involving financial statement items that are industry‐specific or seldom‐used may render context important. It is also likely that naive consumers of financial statements would benefit more from context than would the subjects of this experiment. The third conclusion is that our theory‐based predictions on the relative effectiveness of user interface did not receive support from the experimental results. In particular, the availability of a search tool seems to degrade mapping effectiveness. When we view the combined outcomes for confidence (CNFDC) and mapping quality (CRRCT_TGT and CRRCT_LSE), it appears that the presence of a search tool lulls subjects into a false sense of security. While subjects using the search tool are more likely to believe that they have found the correct answer – perhaps based on the ranking provided by the search results – they are, in fact, less likely to be correct. We can speculate that search subjects have not paid enough attention to the cues embedded in the reference and other linkbase data. There is evidence for this in the post‐experimental questionnaire. We asked subjects: “When reviewing possible choices of elements from the U.S. GAAP taxonomy, which information did you rely on?” The information choices, as shown in Figure 2, were the following metadata: Element name, Documentation Label, Relationships, Tree locations, Standard Label and References. Even though those in the search‐only group did not have a drop‐down hierarchy for navigation, they could still view how a particular element related to other elements or its general location in the aggregation hierarchy by clicking on the “Relationships” or “Tree Locations” tabs, respectively. We scored responses to this question on a six point Likert scale from 0=Never to 5=Always. While there was little difference in the three groups’ usage information for elements such as documentation (HRCHY = 2.73; HRCHY_SRCH: =2.69; SRCH: = 2.75) there was a marked difference for use of the relationships (HRCHY = 3.17; HRCHY_SRCH: =2.62; SRCH: = 1.96) or the tree locations metadata (HRCHY = 2.83; HRCHY_SRCH: =2.28; SRCH: = 1.93). Since all subjects had equal access to all metadata, there appears to be a connection between over‐confidence stemming from use of the search tool and ignoring the metadata.
24
4‐Jan‐09
6. Conclusions The SEC mandate requiring filers to provide financial statement data in XBRL format represents a significant change in the corporate disclosure environment for U.S. capital markets. While there are numerous advantages to standardized, machine‐readable financial statements, these benefits accrue only if there is a consistent process by which to accurately map line items from paper financial statements to the correct elements in the XBRL U.S. GAAP taxonomy. The results of our experiment raise concerns for corporations preparing to implement XBRL filings and for consumers of XBRL‐tagged financial statements. Our paper is subject to a number of limitations. First, we use accounting students rather than preparers at filers as subjects in the experiment. As Elliott et al. (2007) note, it is important to match the subjects’ knowledge and ability with the task integrative complexity. Given the number of accounting classes taken, the level of accounting self‐efficacy and the responses to the post‐experiment questionnaire, it does appear that our subjects were appropriate for the task. Second, the mapping task is artificial. The real process of mapping would consist of a complete set of financial statement items for a given corporation rather than a set of distinct tasks. Although the experimental items were chosen specifically because they consisted of concepts which are easy to understand, it is possible that the availability of an entire financial statement would increase the mapping accuracy of a subject who otherwise provided the wrong element. Third, the subjects received only moderate levels of training and were required to undertake 24 independent mapping tasks in a limited amount of time. With additional training and unlimited time, it is possible that the subjects would map more accurately. In spite of these limitations, we believe the results of this paper provide fertile ground for future research. The comparison of a search tool versus a hierarchy for information retrieval tasks should be replicated in other disciplines possessing taxonomical structuresxiii to determine if search causes a general degradation in performance or if detrimental effects are specific to financial accounting. Given that companies are required to use the most recent version of the U.S. GAAP taxonomy, further research into the impact of the taxonomical design and organization would provide ongoing benefits with every alteration to U.S. GAAP.
25
4‐Jan‐09
Whereas all of the experimental items were taken from items on the face of financial statements, real filings will require the mapping of items in the footnotes and disclosures. Although further research is needed to identify any differences between face and non‐face items, it is likely that disclosures and footnotes will be harder to map properly. A follow‐up experiment can investigate these differences as well as the effect of unnecessary extensions on financial statement consumers.
Within XBRL, a detailed analysis of the filings by companies in the voluntary filer program may reveal patterns of unnecessary extensions as well as explicit mistakes within the instance documents. When combined with the results from Boritz and No (2007, 2008), our results call for increased scrutiny of instance documents and particularly during the initial stages of filing. The level of difficulty inherent to the mapping process also speaks to a need for an audit or assurance process to verify instance documents as well as comprehensive training program for preparers at filing companies. The amount and nature of training required may well depend upon the interface provided to the preparer as well as the extent of organizational learning created from experience with previous filings.
Overall, we believe the results of our experiment provide three substantial contributions to the literature. First, user interface is a significant determinant of information retrieval accuracy, speed and confidence. Second, the complexity of mapping tasks varies greatly and the level of complexity affects mapping performance. Third, financial regulators and filing companies should take great care to ensure that instance documents are prepared in an accurate and consistent manner.
26
4‐Jan‐09
7. References Bai, J., J.‐Y. Nie, G. Cao and H. Bouchard. 2007. Using query contexts in information retrieval. Paper read at Proceedings of the 30th annual international ACM SIGIR conference on Research and development in information retrieval. Bandura, A. 1994. Self‐efficacy. In Encyclopedia of human behavior, edited by V. S. Ramachaudran. New York: Academic Press, 71‐81. ———. 1997. Self‐efficacy: The exercise of control. New York: W. H. Freeman. Bonner, S. E. 2008. Judgment and Decision Making in Accounting. Upper Saddle River, NJ: Prentice Hall. Boritz, J. E. and W. G. No. 2007. SEC's XBRL Voluntary Filing Program on EDGAR: The Case for Quality Assurance. Waterloo, ON: University of Waterloo. ———. 2008. Auditing XBRL‐Related Documents: The Case of United Technologies Corporation. SSRN, 23 October 2008 [cited 20 December 2008]. Available from http://ssrn.com/abstract=1288376. Brewster, C. and K. O'Hara. 2007. Knowledge representation with ontologies: Present challenges‐‐Future possibilities. International Journal of Human‐Computer Studies 65 (7):563‐568. Chen, C. and R. Rada. 1996. Interacting With Hypertext ‐ A Meta‐Analysis Of Experimental Studies. Human‐Computer Interaction 11 (2):125‐156. Clark, K. L. and F. G. McCabe. 2007. Ontology schema for an agent belief store. International Journal of Human‐Computer Studies 65 (7):640‐658. Compeau, D., C. A. Higgins and S. Huff. 1999. Social cognitive theory and individual reactions to computing technology: A longitudinal study. MIS Quarterly 23 (2):145‐158. David, P., M. Song, A. Hayes and E. S. Fredin. 2007. A cyclic model of information seeking in hyperlinked environments: The role of goals, self‐efficacy and intrinsic motivation. International Journal of Human‐Computer Studies 65 (2):170‐182. Debreceny, R. and G. L. Gray. 2001. The production and use of semantically rich accounting reports on the Internet: XML and XBRL. International Journal of Accounting Information Systems 2 (1):47‐74. Debreceny, R. S. and P. L. Bowen. 2005. The Effects on End‐User Query Performance of Incorporating Object‐Oriented Abstractions in Database Accounting Systems. Journal of Information Systems 19 (1):43‐74. Downey, J. P. and M. McMurtrey. 2007. Introducing task‐based general computer self‐efficacy: An empirical comparison of three general self‐efficacy instruments. Interacting with Computers 19 (3):382‐396. 27
4‐Jan‐09
Driscoll, J. C. and A. C. Kraay. 1998. Consistent Covariance Matrix Estimation with Spatially Dependent Panel Data. Review of Economics and Statistics 80:549‐560. Dunn, C. L. and G. J. Gerard. 2001. Auditor efficiency and effectiveness with diagrammatic and linguistic conceptual model representations. International Journal of Accounting Information Systems 2 (4):223‐248. Dunn, C. L. and S. V. Grabski. 2000. Perceived Semantic Expressiveness of Accounting Systems and Task Accuracy Effects. International Journal of Accounting Information Systems 1 (2):79‐87. Elliott, W. B. 2006. Are Investors Influenced by Pro Forma Emphasis and Reconciliations in Earnings Announcements? Accounting Review 81 (1):113‐133. Elliott, W. B., F. D. Hodge, J. J. Kennedy and M. Pronk. 2007. Are M.B.A. Students a Good Proxy for Nonprofessional Investors? Accounting Review 82 (1):139‐168. Eriksson, H. 2007. The semantic‐document approach to combining documents and ontologies. International Journal of Human‐Computer Studies 65 (7):624‐639. Fensel, D. and M. L. Brodie. 2004. Ontologies: A Silver Bullet for Knowledge Management and Electronic Commerce. Finkelstein, L., E. Gabrilovich, Y. Matias, E. Rivlin, Z. Solan, G. Wolfman and E. Ruppin. 2002. Placing search in context: the concept revisited. ACM Trans. Inf. Syst. 20 (1):116‐131. Guarino, N. 1997. Understanding, building and using ontologies. International Journal of Human‐ Computer Studies 46 (2‐3):293‐310. Hodge, F. D., J. J. Kennedy and L. A. Maines. 2004. Recognition versus Disclosure in Financial Statements: Does Searchable Technology Improve Transparency? Accounting Review 79 (3):687‐703. Holscher, C. and G. Strube. 2000. Web search behavior of Internet experts and newbies. Computer Networks 33 (1‐6):337‐346. Hsieh‐Yee, I. 2001. Research on Web search behavior. Library & Information Science Research 23 (2):167‐185. Hsu, Y.‐c. and T. M. Schwen. 2003. The effects of structural cues from multiple metaphors on computer users' information search performance. International Journal of Human‐ Computer Studies 58 (1):39‐55. Hu, B., S. Dasmahapatra, D. Dupplaw, P. Lewis and N. Shadbolt. 2007. Reflections on a medical ontology. International Journal of Human‐Computer Studies 65 (7):569‐582. Jansen, B. J. and A. Spink. 2006. How are we searching the World Wide Web? A comparison of nine search engine transaction logs. Information Processing & Management 42 (1):248‐ 263. 28
4‐Jan‐09
Kernan, K. 2008. XBRL Around the World. Journal of Accountancy 206 (4):62‐66. Lau, R. Y. K., P. D. Bruza and D. Song. 2008. Towards a belief‐revision‐based adaptive and context‐sensitive information retrieval system. ACM Trans. Inf. Syst. 26 (2):1‐38. Lazonder, A. W., H. J. A. Biemans and I. G. J. H. Wopereis. 2000. Differences between novice and experienced users in searching information on the World Wide Web. Journal of the American Society for Information Science 51 (6):576‐581. Locke, E. and G. Latham. 1990. A Theory of Goal Setting and Task Performance. Englewood Cliffs, NJ: Prentice‐Hall. Marakas, G. M., R. D. Johnson and P. F. Clay. 2007. The Evolving Nature of the Computer Self‐ Efficacy Construct: An Empirical Investigation of Measurement Construction, Validity, Reliability and Stability Over Time. Journal of the Association for Information Systems 8 (1):15‐46. Marakas, G. M., M. Y. Yi and R. D. Johnson. 1998a. The Multilevel and Multifaceted Character of Computer Self‐Efficacy: Toward Clarification of the Construct and An Integrative Framework for Research. Info. Sys. Research 9 (2):126‐163. ———. 1998b. The multilevel and multifaceted character of computer self‐efficacy: Toward clarification of the construct and an integrative framework for research. Information Systems Research: ISR: A Journal of the Institute of Management Sciences 9 (2):126‐163. McDonald, S. and R. J. Stevenson. 1996. Disorientation in hypertext: The effects of three text structures on navigation performance. Applied Ergonomics 27 (1):61‐68. ———. 1998. Navigation in hyperspace: An evaluation of the effects of navigational tools and subject matter expertise on browsing and information retrieval in hypertext. Interacting with Computers 10 (2):129‐142. ———. 1999. Spatial versus Conceptual Maps as Learning Tools in Hypertext. Journal of Educational Multimedia and Hypermedia 8 (1):43‐64. McKnight, C., A. Dillon and J. Richardson, eds. 1993. Hypertext, A Psychological Perspective. New York: Ellis Horwood. Melucci, M. 2008. A basis for information retrieval in context. ACM Trans. Inf. Syst. 26 (3):1‐41. Minetou, C. G., S. Y. Chen and X. Liu. 2008. Investigation of the Use of Navigation Tools in Web‐ Based Learning: A Data Mining Approach. International Journal of Human‐Computer Studies 24 (1):48‐67. Munro, M. C., S. L. Huff, B. L. Marcolin and D. R. Compeau. 1997. Understanding and measuring user competence. Information & Management 33 (1):45‐57. Nelson, M. W. and W. B. Tayler. 2007. Information Pursuit in Financial Statement Analysis: Effects of Choice, Effort and Reconciliation. Accounting Review 82 (3):731‐758. 29
4‐Jan‐09
Padovani, S. and M. Lansdale. 2003. Balancing search and retrieval in hypertext: context‐specific trade‐offs in navigational tool use. International Journal of Human‐Computer Studies 58 (1):125‐149. Palmquist, R. A. and K.‐S. Kim. 2000. Cognitive style and on‐line database search experience as predictors of Web search performance. Journal of the American Society for Information Science 51 (6):558‐566. Passini, R. 1984. Wayfinding in Architecture. New York: Van Rostrand. Peng, J., R. E. Viator and S. Buchheit. 2007. An Experimental Study of Multidimensional Hierarchical Accounting Data: Drill‐Down Paths Can Influence Economic Decisions. Journal of Information Systems 21 (2):69‐86. Pike, W. and M. Gahegan. 2007. Beyond ontologies: Toward situated representations of scientific knowledge. International Journal of Human‐Computer Studies 65 (7):674‐688. Piwowarski, B., P. Gallinari and G. Dupret. 2007. Precision recall with user modeling (PRUM): Application to structured information retrieval. ACM Trans. Inf. Syst. 25 (1):1‐1. Saba, W. S. 2007. Language, logic and ontology: Uncovering the structure of commonsense knowledge. International Journal of Human‐Computer Studies 65 (7):610‐623. SEC. 2008. Interactive Data To Improve Financial Reporting; Proposed Rule. Securities and Exchange Commission, 10 June 2008a [cited 1 December 2008]. Available from www.sec.gov/rules/proposed/2008/33‐8924fr.pdf. ———. 2008. SEC Announces Successor to EDGAR Database: “IDEA” Will Make Company and Fund Information Interactive. Securities and Exchange Commission, 19 August 2008b [cited 1 December 2008]. Available from www.sec.gov/rules/proposed/2008/33‐ 8929.pdf. ———. 2008. SEC Approves Interactive Data for Financial Reporting by Public Companies, Mutual Funds. Securities and Exchange Commission 2008c [cited 19 December 2008]. Available from www.sec.gov/news/press/2008/2008‐300.htm. Tung, L.‐L., R. Debreceny, Y.‐G. Chan, A. T.‐L. Chan and S. E.‐B. Le. 2003. Interacting with hypertext: an experimental investigation of navigation tools. Electronic Commerce Research and Applications 2 (1):61‐72. XBRL International. 2008. Progress Report, November 2007 2008 [cited 10 December 2008]. Available from www.xbrl.org/ProgressReports/2007_11_XBRL_Progress_Report.pdf. XBRL US. 2008. U.S. GAAP Taxonomies 1.0 and Supporting Documentation. XBRL US 2008a [cited 20 December 2008]. Available from http://www.xbrl.us/Pages/US‐GAAP.aspx. ———. 2008. XBRL U.S. GAAP Taxonomy Preparers Guide. XBRL US 2008b [cited 2008]. Available from www.xbrl.us/Documents/PreparersGuide.pdf
30
4‐Jan‐09
Xu, J. and W. B. Croft. 2000. Improving the effectiveness of information retrieval with local context analysis. ACM Trans. Inf. Syst. 18 (1):79‐112. Xu, Y. 2007. The dynamics of interactive information retrieval behavior, Part I: An activity theory perspective. Journal of the American Society for Information Science and Technology 58 (7):958‐970. Zizi, M. and M. Beaudouin‐Lafon. 1995. Hypermedia exploration with interactive dynamic maps. International Journal of Human‐Computer Studies 43 (3):441‐464.
31
4‐Jan‐09
Figure 1: XBRL Extension Taxonomy and Instance Document Creation Process
Source: U.S. GAAP Preparers Guide, 2008, 3. Blue lines represent Information and Information Flow; Orange lines represent Process and Process Flow
32
4‐Jan‐09
Figure 2: XBRL Taxonomy Viewer Interface
33
4‐Jan‐09
Figure 3: Financial Statements Mapping Example Panel A: Balance Sheet Assets Current Assets: Cash and Cash Equivalents Accounts Receivable, net, current Inventories Other Current Assets Current Assets of Discontinued Operations Held for Sale Total Current Assets Property, Plant and Equipment Total Assets Liabilities Current Liabilities: Accounts Payable and other accrued liabilities Current portion of long‐term borrowing Dividends payable Total Current Liabilities Long Term Liabilities: Deferred income taxes Other long‐term debt Minority interests Total Long Term Liabilities Total Liabilities Stockholders' Equity Common Stock Retained Earnings Accumulated other comprehensive loss Total Stockholders' Equity Total Liabilities and Stockholders' Equity
Panel B: Income Statement Revenues: Passenger Revenue Passenger Revenue Affiliated Airlines Cargo Net Revenues Operating Expenses: Aircraft Fuel Salaries and related costs Aircraft maintenance supplies Landing Fees Aircraft rent Depreciation and amortization Total Operating Expenses Operating Income Income taxes Net Income
Time taken per mapping task. Confidence level in mapping (0 to 1 in .1 intervals). Correctness – Tight (0 = No, 1= Yes) Correctness ‐ Loose (0 = No, 1= Yes) Hierarchy condition (0 = No, 1= Yes) Hierarchy + Search condition (0 = No, 1= Yes) Search condition (0 = No, 1= Yes) Context condition (0 = No‐context, 1 = Context) Question complexity (0 = Low, 1 = Medium, 2 = High) General computer self‐efficacy, standardized Internet computer self‐efficacy, standardized Software usage self‐efficacy, standardized Accounting self‐efficacy, standardized Number of accounting classes Number of computing classes Cumulative grade point average Number of years of work Native speaker of English (0 = No, 1= Yes)
Expected Sign
+ ‐
+ + + + + + + + ‐
4‐Jan‐09
Table 1: Descriptive Information about Subjects Panel A: Allocation to Experimental Manipulation Interface
Number of mapping tasks completed (max = 24). Winsorised at p=.03 in regressions shown below.
4‐Jan‐09
Table 2: Mean of Dependent Variables by Condition Interface
Variable
TIME CNFDC CRRCT_TGT CRRCT_LSE TIME Hierarchy+ CNFDC Search CRRCT_TGT HRCHY_SRCH CRRCT_LSE TIME CNFDC Search SRCH CRRCT_TGT CRRCT_LSE TIME CNFDC Total CRRCT_TGT CRRCT_LSE Hierarchy HRCHY
A large filer is defined as a company with greater than $5 billion of market capitalization. Direct search refers to typing in search terms and executing a key word search, whereby results are returned according to how well they match the search terms. Firms are responsible for ensuring they are using the most recent version of the taxonomy because periodic revisions are expected. It would be impossible to complete the mapping process accurately without knowing the company’s internal definition for the financial statement line items. The tasks and solutions are available from the corresponding author. For question #1, subjects were given a drop‐down box with two choices, “Yes” and “No. For question #2, subjects were given a text‐box field in which to copy+paste their answer. For question #3, subjects were given a drop‐down box with decile choices from 0%‐100%. We measure the number of computer classes taken (Mean = 1.9, SD = 0.9). We find that it is strongly positively correlated with general computer self‐efficacy (0.281, p