electronic transition of Ge2, which is the topic of the present work. Early13â16 ab initio ..... where the upper sign refers to the e levels and the lower to the f levels.
JOURNAL OF CHEMICAL PHYSICS
VOLUME 116, NUMBER 10
8 MARCH 2002
Exploring the Bermuda triangle of homonuclear diatomic spectroscopy: The electronic spectrum and structure of Ge2 David A. Hostutler, Haiyang Li,a) and Dennis J. Clouthierb) Department of Chemistry, University of Kentucky, Lexington, Kentucky 40506-0055
Ghassan Wannous Laboratoire de Spectrome´trie Ionique et Mole´culaire (associe´ au CNRS U.M.R. 5579, Universite´ Claude Bernard-Lyon1, 43 Bd du 11 Novembre 1918, 69622 Villeurbanne Cedex, France
共Received 19 September 2001; accepted 6 November 2001兲 The optical spectrum of jet-cooled Ge2 has been observed for the first time. Laser-induced fluorescence 共LIF兲 and wavelength resolved emission spectra were recorded using the pulsed discharge technique with a tetramethylgermane precursor. Analysis of the spectra yielded the vibrational constants e⬙ ⫽287.9(47), e x ⬙e ⫽0.81(55), e y e⬙ ⫽0.0037(18), ⬘e ⫽189.0(15), e x e⬘ ⫽6.41(30), and T e⬘ ⫽20 610.8(16) cm⫺1. High-resolution rotationally resolved spectra of several bands of 74Ge2 show two strong P and R branches and two very weak Q branches. We have assigned 3 ⫺ the band system as a Hund’s case 共c兲 ⍀ ⬘ ⫽1⫺⍀ ⬙ ⫽1 transition from the ground 3 ⌺ ⫺ g state to a ⌺ u excited state. The bond lengths derived from the rotational constants are r 0⬙ ⫽2.3680(1) Å and r ⬘e ⫽2.5244(18) Å, an ⬃0.16 Å increase on electronic excitation. Arguments are presented for assigning the transition to a 2g 2u → 2g u g electron promotion, although the observed increase in the bond length is much less than predicted by previous ab initio calculations. The absence of the ⫹ 0⫹ u – 0 g component in the spectra has been attributed to an excited state predissociation. © 2002 American Institute of Physics. 关DOI: 10.1063/1.1431281兴 I. INTRODUCTION
rally occurring isotopes with significant abundances greatly complicates the spectroscopy. In recent years, we have been studying the electronic spectra of small polyatomic germanium-containing transient molecules, because of their relevance to semiconductor growth processes and the general interest in multiple bonding in these species. During the course of our work on H2CGe 共Ref. 10兲 and GeCH,11,12 which were produced in a discharge jet from a tetramethylgermane precursor, we also recorded a new set of LIF bands in the 485– 450 nm region, which could not be assigned to any known molecule. These bands have turned out to be the first rotationally analyzable electronic transition of Ge2, which is the topic of the present work. Early13–16 ab initio studies all agree that the ground state valence orbital configuration of Ge2 is 2g 2u ( 3 ⌺ ⫺ g ), similar to that of Si2 and the opposite of the 4 0g ( 1 ⌺ ⫹ g ) ground state of C2, due to the greater tendency of carbon to hybridize.17 The most recent high level Ge2 ab initio calculations18 –22 predict the ground state bond length, vibrational frequency, and dissociation energy to be in the range of 2.375–2.44 Å, 259–289 cm⫺1, and 221–259 kJ mol⫺1, respectively. The most extensive predictions come from the ab initio studies of Balasubramanian19 in which the properties of 16 low-lying electronic states have been calculated. The valence orbital configurations ( 2g 2u ), ( 1g 3u ), and ( 4 ) give rise to several low energy excited states. The first allowed electronic transition in the UV-visible is predicted to ⫺1 3 ⫺ be the 3 ⌺ ⫺ u – X ⌺ g band system at 20 979 cm , with a bond length of 2.93 Å and a vibrational frequency of 152 cm⫺1. A plethora of other bound and dissociative electronic excited states are found between 700 and 33 000 cm⫺1. In early experimental work, Ge2 was detected by mass
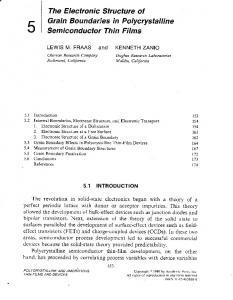
A perusal of the reference work by Huber and Herzberg1 shows that the ground state structures of most of the main group homonuclear diatomic molecules are well established, as illustrated in Fig. 1. Notable exceptions include He2, which has only a single (J⫽0) bound rotational level2 and Ba2, which is only very weakly bound.3,4 Of more interest is the curious fact that the structures of Ga2 , In2, Tl2, and Ge2 have not been experimentally determined, although these molecules are predicted to have bound electronic states.5– 8 As shown in the shaded area of Fig. 1, these elements lie within a small contiguous area of the periodic table, which we have whimsically designated the Bermuda triangle9 of homonuclear diatomic spectroscopy. Although these molecules are known to exist, their ground state bond lengths have not been experimentally determined and their electronic spectra are largely unknown. The paucity of data in the Bermuda triangle seems primarily due to experimental problems. Gallium is a liquid near room temperature and indium is a very soft metal, so that powerful laser ablation techniques are difficult to apply to these elements. The high toxicity, very small rotational constant, very large spin–orbit effects, and low dissociation energy (D e ⫽0.43⫾0.04 eV兲7 have evidently discouraged studies of Tl2. Ge2 is more tractable, with low toxicity, readily available ablation targets, and reasonable spin–orbit and rotational constants, although the presence of five natua兲
Present address: Laser Spectroscopy Laboratory, Anhui Institute of Optics and Fine Mechanics, P.O. Box 1125, Hefei, Anhui 230031, People’s Republic of China. b兲 Author to whom correspondence should be addressed. 0021-9606/2002/116(10)/4135/7/$19.00
4135
© 2002 American Institute of Physics
Downloaded 15 Oct 2007 to 128.135.12.127. Redistribution subject to AIP license or copyright, see http://jcp.aip.org/jcp/copyright.jsp
4136
Hostutler et al.
J. Chem. Phys., Vol. 116, No. 10, 8 March 2002
FIG. 1. The main group of the periodic table showing the bond lengths 共in Å兲 of homonuclear diatomic molecules. The shaded squares denote molecules whose bond lengths are unknown.
spectrometry,23 and the vibrational frequency was assigned to a Raman band at 274 cm⫺1 in matrix isolation experiments.24 Chemiluminescence observed in interactions of germanium molecular beams with oxygen donor molecules has been attributed to reactions with the dimer.25,26 The ground state dissociation energy of Ge2 has been measured mass spectrometrically18 with D° 0 ⫽260.4⫾7.0 kJ mol⫺1. The increased spin–orbit splitting in the heavier group 14 diatomics (Ge2 , Sn2, and Pb2) approaches Hund’s case 共c兲 coupling so that the ground state is separated into ⫹ 3 widely spaced 1 ⫾ g and 0 g components and the ⌸ u state into ⫾ 0 u , 1 u , and 2 u components. In 1994, Weltner and co-workers27 obtained infrared absorption spectra of Ge2 in matrices, which they assigned to the 3 ⌸ u 关 1 u ( v ⬘ ⫹ ⫺1 ⫽0,1,2,3) 兴 – 3 ⌺ ⫺ and g (X 0 g ) transition with T 0 ⫽711 cm ⫺1 an upper state vibrational frequency of 308 cm . Shortly thereafter, the Neumark group28,29 studied the low-lying states of Ge2 and Ge⫺ 2 by negation ion zero electron kinetic energy 共ZEKE兲 spectroscopy. Term values and vibrational frequencies were determined for the Ge2 3 ⌺ ⫺ g ground and 1 1 ⫹ A 3⌸ u , a 1⌬ g , b 1⌺ ⫹ g , c ⌸ u , and d ⌺ g low-lying excited states, and the zero-field splittings of the ground state 0 ⫹ g and 1 g and first excited state ( 3 ⌸ u )2 u , 1 u , and 0 ⫾ u components were measured. Most recent mass spectrometry and photoionization studies30–33 of germanium clusters have provided the ionization potential 共7.58 –7.76 eV兲 of Ge2 and shown that the diatomic molecule is usually a minor product in the laser ablation of germanium metal. There have been no previous reports of electronic absorption or emission spectra of Ge2 in the gas phase. II. EXPERIMENT
Ge2 was produced in the previously described supersonic discharge jet34 using tetramethylgermane 共TMG兲 or isotopically enriched (CH3兲4 74Ge 共74TMG兲 as the precursor. The TMG was cooled to ⫺20 °C and the vapor entrained in 30 psi of argon before expansion through an electromagnetic pulsed valve 共General Valve, series 9兲 into vacuum. At the appropriate time in the gas expansion, a glow discharge was struck across a pair of stainless steel ring electrodes mounted at the exit of the pulsed valve, fragmenting the precursor and producing a variety of reactive intermediates including H2CGe, HCGe, Ge2, and C2. A small reheat tube35 was
added to the end of the discharge jet, which increased the Ge2 signal and decreased the background glow from the electric discharge. In some experiments, the diffusion pump was isolated from the vacuum chamber, in order to increase the extent of the rotational structure in the spectra. The jet-cooled products were interrogated 5–10 mm downstream of the discharge by detecting laser-induced fluorescence 共LIF兲 through appropriate bandpass filters with a high gain photomultiplier 共EMI 9816QB兲. Low-resolution 共0.1–0.5 cm⫺1兲 LIF spectra were excited by an excimer pumped grazing incidence dye laser 共Lumonics HyperDye 300兲 and calibrated with e´talon transmission fringes 共FSR ⫽0.65 cm⫺1兲 and various neon and argon optogalvanic transitions. High-resolution 共0.04 cm⫺1兲 LIF spectra were obtained in the same apparatus using a dye laser 共Lambda Physik FL3002E兲 equipped with an angle-tuned etalon. Wavelength calibration to an accuracy of 0.005 cm⫺1 in the 490– 470 nm region was carried out using the I2 LIF and Raman shifting technique previously reported.36 Wavelength resolved fluorescence spectra of 74Ge2 were recorded by laser excitation of the most intense bandhead, collecting the laser excited emission with f /1.5 optics, and imaging it onto the entrance slit of a 0.55 m scanning monochromator equipped with a computer-controlled three grating turret and a cooled photomultiplier 共RCA C31036A兲 detector. Spectra from the stronger 2–0 and 1–0 bands were obtained with a 12 001/mm grating blazed at 750 nm with a bandpass of 0.45 nm. The emission spectrum from the weaker 0–0 band was recorded with an 1800 l/mm grating blazed at 400 nm with a bandpass of 1.35 nm. The emission spectra were calibrated to an estimated accuracy of ⫾3 cm⫺1 by recording known emission lines from neon and argon pulsed discharge lamps delayed approximately 100 s after the LIF signal. TMG 共Aldrich兲 was used as received. 74TMG was synthesized as previously described10 by the reaction of dimethyl cadmium 共Aldrich兲 with 74GeCl4, which was obtained from the high temperature reaction of isotopically enriched 74 Ge metal 共Isoflex, 99.7%兲 with chlorine gas. III. RESULTS AND ANALYSIS A. Vibrational structure
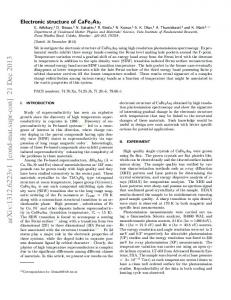
The Ge2 spectrum was difficult to reproduce, as it depended strongly on the experimental conditions, was often contaminated with bands of C2, and was always accompanied by a wavelength-independent LIF background signal of comparable intensity. Discharge jet experiments with GeCl4, GeF4, and CH3GeCl3 precursors were unsuccessful, hexamethyldigermane 关 (CH3兲3Ge–Ge共CH3兲3兴 gave only weak signals, and laser ablation experiments using a Ge rod gave only marginally stronger spectra. With tetramethylgermane, the best precursor, a weak low-resolution LIF spectrum was observed in the 20 500–22 000 cm⫺1 region, as illustrated in Fig. 2. The vibrational progression commences with a very weak 0–0 band at 20 562 cm⫺1, with subsequent irregular intervals of 174 –132 cm⫺1. As shown in Fig. 3, each band is red-degraded with a set of almost equally spaced band heads to the blue, which have vibrational level dependent separations. An experiment with the precursor isotopically enriched
Downloaded 15 Oct 2007 to 128.135.12.127. Redistribution subject to AIP license or copyright, see http://jcp.aip.org/jcp/copyright.jsp
J. Chem. Phys., Vol. 116, No. 10, 8 March 2002
4137
The electronic spectrum of Ge2
TABLE I. LIF band heads, isotope splittings, ground state energy levels and vibrational parameters 共in cm⫺1兲 for the ground and excited state of 74Ge2 . LIF data a
Assignment Band head 0–0 1–0 2–0 3–0 4 –0 5–0 6 –0 7–0 8 –0 9–0 10–0 FIG. 2. A portion of the low-resolution LIF spectrum of Ge2.
in 74Ge gave the much simpler spectrum shown in the top trace of Fig. 3, proving that the multiple heads are due to the various germanium isotopomers. Germanium has five naturally abundant isotopes ( 70Ge⫽21.23%, 72Ge⫽27.66%, 73 Ge⫽7.73%, 74Ge⫽35.94%, and 76Ge⫽7.44%) and a calculation of the expected relative abundances of the various isotopic modifications of Ge2 gave the pattern shown at the bottom of Fig. 3, providing very strong evidence that the spectrum is due to the homonuclear diatomic molecule Ge2. Careful scrutiny of the low-resolution LIF spectra shows several anomalies. The vibrational spacings of the 74Ge band heads are irregular and appear to be perturbed beyond v ⬘ ⫽4. The 70Ge2 – 74Ge2 isotope splittings are more regular, giving a good linear plot with upper state vibrational quantum number 共see inset Fig. 3兲 except for the 7–0 and 8 –0 bands, which have smaller than expected isotope shifts. There is also a series of spurious bands, including a fairly strong feature at 21 574 cm⫺1 which overlaps the 7–0 band, as shown in Fig. 2. These bands are red-degraded and show some rotational structure at low resolution but do not show obvious germanium isotope splittings, so they cannot be
FIG. 3. Low-resolution LIF spectra of the 3–0 band obtained from isotopically enriched (TM74Ge) and unenriched 共TMG兲 tetramethylgermane precursors. The inset shows a plot of the 70Ge2 – 74Ge2 isotope splitting versus upper state vibrational quantum number for the various bands in the LIF spectrum.
20 561.65 20 735.44 20 899.67 21 050.41 21 187.6 21 319.3 21 452.1 21 591.5 21 715.6 21 849.8 21 983.5
Emission data Isotope splitting
v⬙
Energyc
v⬙
Energyc
共0.0兲 0.8 1.8 2.5 3.1 4.1 5.0 5.1 6.2 7.4 8.5
1 2 3 4 5 6 7 8 9 10 11
288.9 575.0 853.1 1139.3 1417.9 1696.4 1972.4 2247.7 2521.2 2794.6 3067.1
12 13 14 15 16 17 18 19
3337.4 3607.7 3872.1 4139.0 4403.4 4666.0 4927.3 5190.8
b
Parameter
X 3⌺ ⫺ g
e ex e ey e Te
287.9共47兲d 0.81共55兲 0.0037共18兲 0.0
3
⌺⫺ u
189.0共15兲d 6.41共30兲 ¯ 20 610.8共16兲
a
The band heads quoted to two decimal places are from high-resolution spectra of 74Ge2 . b Average isotope splitting for the five observed band heads 共see Fig. 2兲. The value for v ⬘ ⫽0 is extrapolated from the linear fit in the inset of Fig. 3. c Measured energy relative to v ⬙ ⫽0. d Values in parenthesses are standard errors of 1 right justified to the last digit.
definitely attributed to Ge2. The assignments, measured LIF band head frequencies, isotope splittings, and excited state vibrational parameters for 74Ge2 are reported in Table I. Using the 74TMG precursor, low-resolution emission spectra were recorded by exciting various bands in the LIF spectrum, with typical examples shown in Fig. 4. Simple vibrational progressions were observed with a fundamental frequency of 289 cm⫺1. We have fitted the low-resolution LIF and emission data to the anharmonic expression:
FIG. 4. Low-resolution emission spectra of 74Ge2 . The spectra are plotted as displacement from the excitation transition given in parentheses at zero wavenumbers. The vertical leaders identify the lower state vibrational quantum number. The emission spectra were obtained by exciting the 2–0 共top兲, 1–0 共middle兲, and 0–0 共bottom兲 transitions.
Downloaded 15 Oct 2007 to 128.135.12.127. Redistribution subject to AIP license or copyright, see http://jcp.aip.org/jcp/copyright.jsp
4138
Hostutler et al.
J. Chem. Phys., Vol. 116, No. 10, 8 March 2002
FIG. 5. The 3–0 LIF band of jet-cooled 74Ge2 at high resolution. The vertical leaders identify the lower state J quantum number. The branch labeled Q is actually a composite of the Q e f 共longer leaders兲 and Q f e 共shorter leaders兲 branches. The simulation was calculated for a rotational temperature of 25 K.
The observed rotational structure of the 74Ge2 bands is consistent with a transition from the electronic ground state 3 ⫺ 3 3 ⫺ of the types 3 ⌺ ⫺ u – ⌺ g or ⌸ u – ⌺ g or a transition from the 3 low-lying first excited state of the types 3 ⌺ ⫺ g – ⌸ u or 3 3 ⌸ g – ⌸ u . There is substantial evidence that the lower state is actually the electronic ground state. First, the vibrational frequency of 287.9共47兲 cm⫺1 observed in the emission spectra agrees very well with the ZEKE value28 of 286共5兲 cm⫺1, whereas the 3 ⌸ u excited state has a vibrational frequency of 308 cm⫺1. Second, a transition from the first excited state is unlikely under jet-cooled conditions, although the lowest 2 u ⫹ component is only 337 cm⫺1 above the X 3 ⌺ ⫺ level. g 0 More importantly, one of the Q branches clearly starts at J ⫽1, a level that does not exist in 3 ⌸ u 2 u . Finally, if the transition originated in the 1 u level of the 3 ⌸ u excited state at 711 cm⫺1, we would also expect ⌬⍀⫽⫾1 transitions, which are not observed. Assuming that the transitions originate from the ground 3 3 ⫺ state 1 ⫾ g levels, we can eliminate the ⌸ u – ⌺ g possibility,
¯ ⫽T e ⫹ e⬘ 共 v ⬘ ⫹0.5兲 ⫺ e x e⬘ 共 v ⬘ ⫹0.5兲 2 ⫺ 关 e⬙ 共 v ⬙ ⫹0.5兲 ⫺ e x e⬙ 共 v ⬙ ⫹0.5兲 2 ⫹ e y e⬙ 共 v ⬙ ⫹0.5兲 3 兴 .
共1兲
Only the 0–0 through 4 –0 LIF bands were fitted, due to the perturbations previously discussed. With a 0–0 bandhead frequency of 20 561.65 cm⫺1, the frequencies of the emission bands were calculated from the vibrational energy levels given in Table I and all satisfactorily fitted to within the estimated measurement error of 3 cm⫺1. The fitted vibrational constants are reported in Table I. Searches from 750– 335 nm did not reveal any further band systems.
B. Rotational structure
We have recorded high-resolution rotationally resolved spectra of the 0–0, 1–0, 2–0, and 3–0 bands of 74Ge2 . Band spectra taken without the diffusion pump at relatively high rotational temperatures exhibit simple rotational structure consisting of two R and two P branches. With more efficient jet cooling, a weak Q branch is also evident, as illustrated in Fig. 5. From theory, we expect the ground state symmetry to 3 ⫺ 3 ⫺ 3 3 ⫺ be 3 ⌺ ⫺ g , with allowed ⌺ u – ⌺ g or ⌸ u – ⌺ g electronic transitions. If the combining levels are Hund’s case 共b兲 3 ⌺ ⫺ states or if the upper state is Hund’s case 共a兲 3 ⌸, then complex spectra with as many as 18 or 27 branches, respectively, are expected. The much simpler observed spectra indicate that the ground state is near case 共c兲 coupling, in which the only good quantum numbers are J and ⍀. In case 共c兲, the ⫹ X 3⌺ ⫺ g state is split into substates designated X 0 g (⍀⫽0 ⫾ levels兲 and X 1 g (⍀⫽⫾1 levels兲. The energy interval be⫾ tween the lower 0 ⫹ g and the quasidegenerate 1 g pair is only ⫺1 114 cm , as is readily apparent in the ZEKE spectra.28 The weak Q branches indicate that the bands involve a ⌬⍀⫽0 transition, rather than ⌬⍀⫽⫾1 transitions which would have strong Q branches. Further rotational analysis 共vide infra兲, shows that the first lines start at J ⬙ ⫽1 indicating a ⍀ ⫽1⫺⍀⫽1 transition.
3 ⫺ FIG. 6. A schematic diagram of the rotational structure of a 3 ⌺ ⫺ u – X ⌺g transition. Horizontal dashed lines indicate a parity levels that are not populated for a homonuclear diatomic molecule with zero nuclear spin. Vertical solid lines denote strong branches and vertical dotted lines denote weak Q branches. The labels on the left-hand side denote the e/ f parity, the ⫹/⫺ total parity, and the s/a parity of the populated levels.
Downloaded 15 Oct 2007 to 128.135.12.127. Redistribution subject to AIP license or copyright, see http://jcp.aip.org/jcp/copyright.jsp
J. Chem. Phys., Vol. 116, No. 10, 8 March 2002
The electronic spectrum of Ge2
TABLE II. The molecular constants 共in cm⫺1兲 for ⌺⫺ u excited state constants
74
Ge2 . LIF band
3
0–0
1–0
2–0
3–0a
Tv
20 560.701共2兲
20 734.990共2兲
20 899.257共1兲
B ⬘v
0.070 831共5兲
0.069 674共4兲
0.068 268共3兲
D ⬘v ⫻108 q ⬘v ⫻105
5.8共2兲 12.4共2兲
7.8共2兲 10.0共1兲
7.7共1兲 6.1共1兲
rms error
0.0058
0.0059
0.0042
59
65
71
21 050.060共1兲 关21 050.063共1兲兴 0.066 859共4兲 关0.066 737共2兲兴 7.7b 3.2c 关⫺20.1共5兲兴 0.0062 关0.0058兴 34 关48兴
# of transitions
4139
X 3⌺ ⫺ g state constants B 0⬙ D ⬙0 ⫻108 q ⬙0 ⫻105 B e⬘ ␣ e⬘
0.081 340共8兲d 4.4共8兲e 16.5共15兲c 0.071 57共10兲 0.001 33共4兲
Constants in brackets were obtained by fitting the whole band 共see text兲. Fixed at the value of the 2–0 band. c Fixed at this value obtained by extrapolation from the other bands. d From fitting combination differences, e Fixed at the value from a separate fit of the 2–0 band. a
b
as strong Q-branch transitions to the ⍀⫽2 and ⍀⫽0 levels of the upper state would also be expected. The most plausible assignment is then 3 ⌺ u – X 3 ⌺ ⫺ g , for which an energy level diagram is shown in Fig. 6. The 74Ge isotope has I ⫽0, so half of the rotational levels 共the levels of a parity兲 are missing due to the effect of nuclear statistics. The general rotational selection rules are ⌬⍀⫽0, ⫾1, ⌬J⫽0(e↔ f ), and ⫾1(e↔e, f ↔ f ). However, it is found37 that 3 ⌺ – 3 ⌺⌬⍀ ⫽⫾1 transitions are usually very much weaker than those 3 ⫺ with ⌬⍀⫽0, so that the 3 ⌺ ⫺ u – X ⌺ g bands of room temperature Ge2 would be expected to consist of six strong branches, each with a line separation of approximately 4B. At lower temperatures additional weak Q branches, indicated in Fig. 6 by the dotted lines, may be observed. If the population of the upper X 1 ⫾ g levels is sufficiently depleted in a ⫹ supersonic expansion, then only the 0 ⫹ u – X 0 g subband consisting of P and R branches with alternate lines missing would be expected, as is observed in the spectra of jet-cooled diatomic tin38 and lead.39 Our jet-cooled spectra have all the characteristics of a ⍀ ⬘ ⫽1⫺⍀ ⬙ ⫽1 transition of a homonuclear diatomic molecule with zero nuclear spin, including the weak Q branches whose first lines start at J ⬙ ⫽1 and missing alternate lines in each branch. We assign the electronic transition as ⫹ 3 ⫺ 3 ⫺ ⌺ u – ⌺ g , although there is no evidence of the 0 ⫹ u – X 0g subband. The absence of transitions from the lowest energy component is unusual but no other assignment is consistent with the experimental observations. Several experiments ⫹ were undertaken to try and observe the 0 ⫹ u – X 0 g subband or verify its absence. Attempts to cool Ge2 to very low temperatures so that only the X 0 ⫹ g component was populated appeared to diminish but did not completely eliminate the LIF signals, in part because of experimental problems with oper-
ating the discharge at very high backing pressures. However, our experience with highly energetic discharge jet sources suggests that it can be quite difficult to cool out the populations from higher vibrational levels or spin–orbit components, so these results were considered inconclusive. Pumping the chamber with only the roughing pump increased the extent of the rotational structure in the four strong branches but did not reveal any new subbands. 3 ⫺ With the electronic transition assigned as 3 ⌺ ⫺ u – ⌺g (⍀ ⬘ ⫽1⫺⍀ ⬙ ⫽1), the four bands observed at high resolution were rotationally analyzed. Initially, we failed to recognize the presence of the weak Q-branch lines in the jetcooled spectra, so it was difficult to establish the correct rotational numbering. However, the strong P and R branches in all four bands were readily identified as they were very regular, with no obvious perturbations. Since all the bands were assumed to originate from the same lower level, the rotational numbering was varied until a consistent set of ground state combination differences was obtained. Identification of weak Q-branch lines in the 3–0 and 2–0 bands recorded with jet cooling confirmed the original assignments. Since Ge2 is a Hund’s case 共c兲 molecule and we have no information on the ⍀⫽0 levels, we obtained the molecular constants by treating the triplet state components as independent electronic states. The observed bands were modeled as 1 ⌸ – 1 ⌸ transitions with the term value expression: F 共 J 兲 ⫽B v J 共 J⫹1 兲 ⫺D v 关 J 共 J⫹1 兲兴 2 ⫾ 12 q v J 共 J⫹1 兲 ,
共2兲
where the upper sign refers to the e levels and the lower to the f levels. The ground state constants were obtained by a simultaneous fit of combination differences from all four bands, with D 0 fixed at 4.4⫻10⫺8 cm⫺1, from a preliminary analysis of the 2–0 band which had the most extensive rota-
Downloaded 15 Oct 2007 to 128.135.12.127. Redistribution subject to AIP license or copyright, see http://jcp.aip.org/jcp/copyright.jsp
4140
Hostutler et al.
J. Chem. Phys., Vol. 116, No. 10, 8 March 2002
TABLE III. Ab initio predictions and experimental data for the electronic states of Ge2 . Theorya
Experimentb
⫺1
⫺1
⫺1
T e 共cm 兲 r e 共Å兲 e 共cm 兲 T 0 共cm 兲
State
⌸ u 共II兲 32 663 ⬍29 200 ⌺⫺ u 共II兲 1 ⌬u 29 078 3 ⫺ 24 634 ⌺ g 共II兲 3 ⌸ u 共II兲 24 357 3 ⫺ 20 979 ⌺u 1 ⌸g 17 465 3 ⌸ g 共II兲 17 373 3 ⌸g 13 995 3 ⌬u 13 534 10 840 d 1⌺ ⫹ g c 1⌸ u 5794 5521 b 1⌺ ⫹ g a 1⌬ g 3982 A 3⌸ u 0⫺ u 0⫹ u 1u 2u 767 X 3⌺ ⫺ 1g g 1
3.25
125
2.86 3.68
156 100
r e 共Å兲
Parameter
0g
0
2.93 2.95 2.69 2.67 2.88 2.41 2.35 2.44 2.50
2.34 2.44
152 99 165 167 162 258 269 192 255
251 259
20 611
10 650 4943 4941 3308 1305 1193 711 337 114 0
c
2.5244
c
189
303⫾5 204⫾7 276⫾3
Sn2
Pb2
( 2g 2u )
r e⬙ 共Å兲 e⬙ 共cm⫺1兲
2.246 510.98
X state 2.3680 (r 0 ) 287.9
2.748 186.2
2.9271 110.09
r e⬘ 共Å兲 ⌬r 共Å兲 e⬘ 共cm⫺1兲 T 0 共cm⫺1兲
2.643 0.397 279.28 24 151.86
H statea ( 2g u g ) 2.5244 0.1564 189.0 20 560.701
3.156 0.408 86.6 17 688
3.0718 0.145 159.41 19 805.67
r e⬘ 共Å兲 ⌬r 共Å兲 e⬘ 共cm⫺1兲 T 0 共cm⫺1兲 a
K statea ( 1g 2u 1u ?) 2.349 0.103 462.6 30 768.77
Si2 state notation.
3.08e 2.3680
c
287.9c 286⫾5
a
Reference 19. From Ref. 28 except as noted. c This work. d Reference 29. e Reference 27. b
tional structure. The resulting rotational constant obtained by fitting 75 combination differences with an overall standard deviation of 0.0060 cm⫺1 was B 0 ⫽0.081 340(8) cm⫺1. Subsequently, the upper state constants were determined by a separate least-squares analysis for each band, varying the band origin, T v , the rotational constant, B v , the centrifugal distortion constant, D v , and the ⍀ doubling constant, q v , in each case. The results are summarized in Table II and tables of the measured rotational transition frequencies, residuals, and assignments for each band have been deposited with EPAPS.40 Only the 3–0 band had any detectable perturbations. It was readily fitted using the standard term value expression, but the ⍀ doubling constant, q 3 , had an anomalous value of ⫺20.1(5)⫻10⫺5 cm⫺1. By fixing q 3 at the value of 3.2 ⫻10⫺5 cm⫺1, obtained by extrapolation from the values for the v ⬘ ⫽0 – 2 levels, we found that all of the f levels and the low J e levels could be satisfactorily fitted, but the e levels with J⬎9 showed a strong heterogeneous perturbation, with a residual of ⫺0.20 cm⫺1 at the highest value of J ⬘ ⫽29. A simulation of the 3–0 band, using the constants that fit the perturbations 共Table II兲, a rotational temperature of 25 K, and the 1 ⌸ – 1 ⌸ intensity expressions given by Kovacs,41 is shown in the bottom panel of Fig. 5. The agreement with experiment is excellent. IV. DISCUSSION
The available ab initio predictions19 and experimental for the electronic states of Ge2 are summarized in data 27–29
Ge2
e 共cm 兲
d
X⫺0.014 X⫹0.036
Si2
⫺1
3
c
TABLE IV. Experimental data for the homonuclear Group 14 diatomic molecules.
Table III. It is tempting to assign the observed transition as 3 ⫺ the electronically allowed 3 ⌺ ⫺ u – X ⌺ g band sysem pre⫺1 dicted at 20 979 cm with a vibrational frequency of 152 cm⫺1, comparable to the experimental values of T e ⫽20 611 cm⫺1 and ⬘e ⫽189 cm⫺1. However, the predomdinant electronic excitation is 2g 2u → 2g u g , involving promotion of an electron from a u bonding orbital to a g antibonding orbital, which should result in a substantial increase in bond length, as predicted by theory 共0.49 Å兲.19 From the constants given in Table II, the bond lengths of Ge2 were calculated as r ⬙0 ⫽2.36880(1) Å and r ⬘e ⫽2.5244(18) Å, an increase of only ⬃0.16 Å on electronic excitation. Either the ab initio value is very much in error, or we have observed a different electronic transition. The only other predicted 19 3 ⫺ ⌺ u – X 3⌺ ⫺ to be ‘‘below 29 200 g transition is estimated ⫺1 cm .’’ Further insight can be obtained from the electronic spectra of the other group 14 diatomics, as summarized in Table IV. Si2 has two allowed electronic absorption transitions42– 44 2 2 3 ⫺ in the near ultraviolet, the H 3 ⌺ ⫺ u – X ⌺ g ( g u 2 → g u g ) band system between 412 and 372 nm and a 2 2 1 2 3 ⫺ stronger K 3 ⌺ ⫺ u – X ⌺ g ( g u → g u u ) system between 325 and 308 nm. The H – X transition involves a ⬃0.4 Å increase in bond length and a 45% decrease in vibrational frequency, whereas the K – X system has a ⬃0.1 Å decrease in bond length and a 10% decrease in vibrational frequency on electronic excitation. Sn2 has a strong, well-characterized ⫹ 38 F 0⫹ u – X 0 g band system in the 540– 490 nm region which is analogous to the H – X system of Si2. For Pb2, two band ⫹ systems have been thoroughly studied.39,45 The C 0 ⫹ u – X 0g 2 2 1 3 system near 650 nm is primarily due to the g u → g u ( 3 ⌸ u ) electron promotion, with an ⬃0.16 Å decrease in the bond length and a 16% increase in the vibrational frequency. The F – X system shows an ⬃0.15 Å incease in the bond length and a puzzling 45% increase in the vibrational frequency. Ab initio calculations46 suggest that the F state is 2 2 2 primarily 3 ⌺ ⫺ u due to the g u → g u g excitation, although the change in the bond length is more suggestive of the K state of Si2. Interpretation of the Pb2 spectra is com-
Downloaded 15 Oct 2007 to 128.135.12.127. Redistribution subject to AIP license or copyright, see http://jcp.aip.org/jcp/copyright.jsp
J. Chem. Phys., Vol. 116, No. 10, 8 March 2002
plicated by a strong F – C state avoided crossing and substantial configuration mixing. Although it is possible to assign the Ge2 spectrum as 3 ⫺ ⌺ u (II) – X 3 ⌺ ⫺ g , analogous to the K – X band system of Si2, with a comparable decrease in bond length, the energies are too dissimilar 共Table IV兲 for the assignment to be credible. We conclude that the Ge2 spectrum arises from the 2g 2u 3 ⫺ → 2g u g ( 3 ⌺ ⫺ u (I) – X ⌺ g ) electron promotion, but that the upper state is analogous to that of Pb2 rather than Si2 or Sn2. Perhaps there is an avoided crossing between two ⍀⫽1 states that displaces the upper state Ge2 potential, as in Pb2, causing the anomalously small increase in the bond length on electronic excitation. The most plausible explanation for the absence of rotational transitions from the ground state 0 ⫹ g component is that the excited state 0 ⫹ u component interacts with a dissociative upper state of the same symmetry. The electronically allowed 共⌬⍀⫽0兲 interaction would lead to predissociation of the 0 ⫹ u component of the triplet state, greatly reducing the fluorescence quantum yield. Thus, al⫹ though 0 ⫹ u – 0 g transitions do occur, they are not observable with LIF detection. The large variations in the upper state ⍀-doubling parameters are indicative of irregular interactions between electronic states. The perturbations in the 3–0 band and the anomalous isotope splittings in some of the higher bands are also evidence of interactions between excited state rovibronic levels. A possible mechanism for the heterogeneous perturbation in the 3–0 band would be interaction with the 3 ⫺ 0⫹ u component of the v ⫽4 level of the ⌺ u (I) state with the e levels of the ⍀⫽1 component of v ⫽3. With the vibrational frequency and anharmonicity given in Table II, a constant ⫹ ⫺1 1⫾ would bring the two sets of u ⫺0 u splitting of ⬃140 cm levels into near resonance. Assuming that the 0 ⫹ u levels are predissociated, as discussed previously, they must mix rather weakly with the 1 ⫹ u levels, since the latter still fluoresce quite strongly. We are aware that our discussion of the nature of the electronic excited states of Ge2 raises as many questions as it answers. It is clear that there are a variety of complications not observed in the spectra of either Si2 or Sn2. Whether an avoided crossing is responsible for the small change in the Ge2 bond length on electronic excitation is an open question. ⫹ Predissociation of the excited state 3 ⌺ ⫺ u (I)0 u level is also only one plausible mechanism to account for the experimental observations. Ab initio studies that could provide reliable answers to these questions would be most welcome. ACKNOWLEDGMENTS
One of the authors 共D.A.H.兲 thanks Dr. Anthony Merer for very useful discussions. D.J.C. is indebted to Fritz Grein and K. Balasubramanian for useful correspondence. The authors thank Dr. Corey Evans for conducting some of the laser ablation experiments on Ge2. G.W. acknowledges helpful discussions with Alain Bernard 共Observatoire de Lyon兲 and Roger Bacis. This research was supported by the National Science Foundation. 1
K. Huber and G. Herzberg, Molecular Spectra and Molecular Structure, Constants of Diatomic Molecules 共Van Nostrand, New York, 1979兲, Vol. 4.
The electronic spectrum of Ge2
4141
R. J. Gdanitz, J. Chem. Phys. 113, 5145 共2000兲, and references therein. A. R. Allouche, M. Aubert-Fre´con, G. Nicolas, and F. Spieglemann, Chem. Phys. 200, 63 共1995兲. 4 M. A. Lebeault, J. Viallon, V. Boutou, and J. Chevaleyre, J. Mol. Spectrosc. 192, 179 共1998兲. 5 T. K. Gosh, K. Tanaka, and Y. Mochizuki, J. Mol. Struct. 451, 61 共1998兲. 6 K. Balasubramanian and J. Li, J. Chem. Phys. 88, 4979 共1988兲. 7 Y. Han and K. Hirao, J. Chem. Phys. 112, 9353 共2000兲. 8 J. Harris and R. O. Jones, Phys. Rev. A 18, 2159 共1978兲. 9 C. Berlitz, The Bermuda Triangle 共Doubleday, Garden City, NY, 1974兲. 10 D. A. Hostutler, T. C. Smith, H. Li, and D. J. Clouthier, J. Chem. Phys. 111, 950 共1999兲. 11 T. C. Smith, H. Li, and D. J. Clouthier, J. Am. Chem. Soc. 121, 6068 共1999兲. 12 T. C. Smith, H. Li, D. J. Clouthier, C. T. Kingston, and A. J. Merer, J. Chem. Phys. 112, 8417 共2000兲. 13 G. Pacchioni, Mol. Phys. 49, 727 共1983兲. 14 J. E. Northrup and M. L. Cohen, Chem. Phys. Lett. 102, 440 共1983兲. 15 G. Pacchioni, Chem. Phys. Lett. 107, 70 共1984兲. 16 I. Shim, H. M. Nagarathna-Naik, and K. A. Gingerich, Int. J. Quantum Chem. 29, 975 共1986兲. 17 W. Kutzelnigg, Angew. Chem. Int. Ed. Engl. 23, 272 共1984兲. 18 J. E. Kingcade, H. M. Nagarathna-Naik, I. Shim, and K. A. Gingerich, J. Phys. Chem. 90, 2830 共1986兲. 19 K. Balasubramanian, J. Mol. Spectrosc. 123, 228 共1987兲. 20 P. W. Deutsch, L. A. Curtiss, and J. P. Blaudeau, Chem. Phys. Lett. 270, 413 共1997兲. 21 E. F. Archibong and A. St-Amant, J. Chem. Phys. 109, 962 共1998兲. 22 P. J. Bruna and F. Grein, Mol. Phys. 74, 1133 共1991兲. 23 J. Drowart, G. De Maria, A. J. H. Boerboom, and M. G. Inghram, J. Chem. Phys. 30, 308 共1959兲. 24 F. W. Froben and W. Schulze, Surf. Sci. 156, 765 共1985兲. 25 J. M. Parson, J. H. Wang, C. C. Fang, and B. S. Cheong, Chem. Phys. Lett. 152, 330 共1988兲. 26 B. S. Cheong, J. H. Wang, C. C. Fang, and J. M. Parson, J. Chem. Phys. 92, 4839 共1990兲. 27 S. Li, R. J. Van Zee, and W. Weltner, Jr., J. Chem. Phys. 100, 7079 共1994兲. 28 C. C. Arnold, C. Xu, G. R. Burton, and D. M. Neumark, J. Chem. Phys. 102, 6982 共1995兲. 29 G. R. Burton, C. Xu, C. C. Arnold, and D. M. Neumark, J. Chem. Phys. 104, 2757 共1996兲. 30 P. Jackson, K. J. Fisher, G. E. Gadd, I. G. Dance, D. R. Smith, and G. D. Willett, Int. J. Mass Spectrom. Ion Processes 164, 45 共1997兲. 31 A. Wucher, R. Heinrich, R. M. Braun, K. F. Willey, and N. Winograd, Rapid Commun. Mass Spectrom. 12, 1241 共1998兲. 32 S. Yoshida and K. Fuke, J. Chem. Phys. 111, 3880 共1999兲. 33 K. Fuke and S. Yoshida, Eur. Phys. J. D 9, 123 共1999兲. 34 H. Harjanto, W. W. Harper, and D. J. Clouthier, J. Chem. Phys. 105, 10189 共1996兲. 35 D. L. Michalopoulos, M. E. Geusic, P. R. R. Langridge-Smith, and R. E. Smalley, J. Chem. Phys. 80, 3556 共1984兲. 36 D. J. Clouthier and J. Karolczak, Rev. Sci. Instrum. 61, 1607 共1990兲. 37 G. Gouedard and J. C. Lehmann, J. Phys. B 9, 2113 共1976兲. 38 K. Pak, M. F. Cai, T. P. Dzugan, and V. E. Bondybey, Faraday Discuss. Chem. Soc., 86, 153 共1988兲. 39 M. C. Heaven, T. A. Miller, and V. E. Bondybey, J. Phys. Chem. 87, 2072 共1983兲. 40 See EPAPS Document No. E-JCPSA6-116-023205 for tables of the measured frequencies, obs.–calc. residuals and assignments for the rotationally resolved 0–0, 1–0, 2–0, and 3–0 bands of 74Ge2 . This document may be retrieved via the EPAPS homepage 共http://www.aip.org/pubservs/ epaps.html兲 or from ftp.aip.org in the directory /epaps/. See the EPAPS homepage for more information. 41 I. Kovacs, Rotational Structure in the Spectra of Diatomic Molecules 共Elsevier, New York, 1969兲, p. 122. 42 C. B. Winstead, S. J. Paukstis, and J. L. Gole, J. Mol. Spectrosc. 173, 311 共1995兲. 43 R. D. Verma and P. A. Warsop, Can. J. Phys. 41, 152 共1963兲. 44 A. E. Douglas, Can. J. Phys. 33, 801 共1955兲. 45 H. Sontag and R. Weber, J. Mol. Spectrosc. 100, 75 共1983兲. 46 K. K. Das, H.-P. Liebermann, R. J. Buenker, and G. Hirsch, J. Chem. Phys. 104, 6631 共1996兲. 2 3
Downloaded 15 Oct 2007 to 128.135.12.127. Redistribution subject to AIP license or copyright, see http://jcp.aip.org/jcp/copyright.jsp