discusses the server-side speech reconstruction whereas a companion paper ..... The harmonic phases of a voiced frame are computed in the VPS block.
➠
➡ THE ETSI EXTENDED DISTRIBUTED SPEECH RECOGNITION (DSR) STANDARDS: SERVER-SIDE SPEECH RECONSTRUCTION Tenkasi Ramabadran1, Alexander Sorin2, Michael McLaughlin1, Dan Chazan2, David Pearce3, and Ron Hoory2 1
Motorola Labs, Schaumburg, USA
2
3
IBM Research Labs, Haifa, Israel Basingstoke, UK
ABSTRACT In this paper we present work that has been carried out in developing the ETSI Extended DSR standards ES 202 211 and ES 202 212 [1][2]. These standards extend the previous ETSI DSR standards: basic front-end ES 201 108 and advanced (noise robust) front-end ES 202 050 respectively. The extensions enable enhanced tonal language recognition as well as server-side speech reconstruction capability. This paper discusses the server-side speech reconstruction whereas a companion paper discusses the front-end extension and tonal language recognition. Experimental results show that the reconstructed speech produced by the standards is highly intelligible under clean and noisy background conditions with the DRT (Diagnostic Rhyme Test) and TT (Transcription Test) scores meeting or exceeding the objective values corresponding to the US DoD (Department of Defence) Federal standard MELP (Mixed-Excitation Linear Predictive) coder operating at 2400 bps.
Motorola Labs,
of tonal information at the front-end and speech reconstruction at the back-end [4]. The development of the extended standards was carried out jointly by IBM and Motorola. This paper deals with server-side speech reconstruction using the parameters of the extended front-ends and evaluation of the intelligibility of the reconstructed speech. A companion paper deals with client-side front-end processing and tonal language recognition with the new standards.
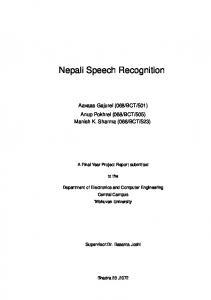
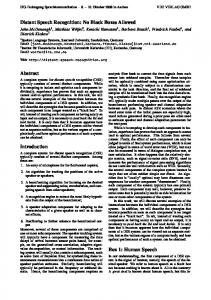
2. SERVER-SIDE SPEECH RECONSTRUCTION A simplified block diagram of speech reconstruction at the server side is shown in Figure 1. From the received channel bit stream, the DSR parameters are decoded, processed to mitigate the effect of channel errors, and used as input to the speech reconstruction algorithm. These parameters are: Mel-Frequency Cepstral Coefficients (MFCC) C0 – C12, logarithm of frame energy (log-E), pitch period P, and voicing class VC updated every 10 ms. PITCH VPS
PTS
LSTD
1. INTRODUCTION
VOICING CLASS UPS
The European Telecommunication Standards Institute (ETSI) STQ Aurora group has published two DSR front-end standards in the years 2000-2002 [3]. The basic front-end, as well as the noise robust advanced front-end define feature extraction and compression on a mobile terminal. The compressed features are transmitted to a server for recognition back-end processing. The front-end standardization process included recognition tests performed in several European languages, as well as American English. It is well known, however, that for some Asian languages such as Mandarin, Cantonese and Thai, recognition accuracy can be enhanced by introducing tonal information in addition to the spectral information. Moreover, the ability to reconstruct speech from the DSR parameters is useful in certain applications: i) DSR of “sensitive” information (e.g., banking or brokerage transactions) where the DSR parameters are stored for future human verification or to satisfy legal requirements, ii) human verification of utterances in a speech database collected through a deployed DSR system for tuning or retraining models, and iii) applications where machine and human recognition are mixed. In order to address these requirements, the ETSI Aurora group decided to extend the existing DSR standards to include extraction and compression
0-7803-8484-9/04/$20.00 ©2004 IEEE
APM
OLA CTM
PF
MFCC, log-E RECONSTRUCTED SPEECH
Figure 1: Simplified block diagram of speech reconstruction The pitch period and voicing class parameters are first fed into the pitch tracking and smoothing block PTS. Details of the inner working of this block are provided in the companion paper and will not be discussed here. The reconstruction of speech at the server side is based on the well-known sinusoidal speech model [5] whereby each frame (segment) of speech is regarded as the sum of a set of sinusoidal components; or equivalently, each frame of speech is represented by a line spectrum in the frequency domain. The reconstruction algorithm then essentially transforms the input parameters for each frame into a line spectrum, viz., the number of components, their frequencies, magnitudes, and phases. The nature of the line spectrum depends on the voicing class parameter VC that can
I - 53
ICASSP 2004
➡
➡ take one of four values: non-speech, unvoiced, mixed-voiced, and fully voiced. For a fully voiced frame, the line spectrum is a harmonic spectrum with the number of components given by ¬P/2¼ and the kth harmonic frequency given by k⋅(8000/P), where the sampling frequency is assumed to be 8000 Hz. As will be described later, the phases of the harmonics are computed in the Voiced Phase Synthesis block VPS. For non-speech and unvoiced frames, the number of components is given by (FFTL/2)-1 and the kth frequency is given by k⋅(8000/FFTL), where FFTL is the length of the FFT used in the transformation of the line spectrum to time-domain (e.g., FFTL is 256 for 8 kHz sampling). The phases in this case are computed in the Unvoiced Phase Synthesis block UPS using a pseudo-random generator of uniformly distributed numbers in the range from 0 to 2π. For mixed-voiced frames, the line spectrum resembles that of a voiced frame from 0 to 1200 Hz and that of an unvoiced frame from 1200 – 4000 Hz. In all cases, the magnitudes of the components are computed in the Cepstra-to-Magnitude transformation block CTM.
2.1. Cepstra-to-Magnitude Transformation The inputs to the CTM block are the MFCC (C0 – C12) and log-E parameters. In the case of the extended front-end (XFE), these parameters are directly used for transformation into magnitudes. In the case of the extended advanced front-end (XAFE), the MFCC parameters are first de-equalized to undo the equalization step performed at the front-end. The de-equalization filter is simply the inverse of the equalization filter except that it includes an exponential forgetting factor of 0.999 to minimize the propagation effect of quantization and / or channel errors. Moreover, for 16 kHz input sampling rate in XAFE, the MFCC and log-E parameters are converted to those representing the 0 – 4 kHz range corresponding to an input sampling rate of 8 kHz so that the reconstructed speech output is also at 8 kHz. The computation of the spectral magnitudes from MFCC and log-E parameters is performed using the following steps:
through an FFT. The FFT magnitudes (or squared magnitudes) are then filtered by a bank of 23 Mel-filters. The filter bank outputs next go through a natural logarithm operation followed by a 23-point discrete cosine transform (DCT) operation. The first 13 values of the resulting cepstrum are compressed and transmitted as MFCC values. Starting from the MFCC values, one can easily obtain the filter bank outputs by applying inverse operations, viz., IDCT (Inverse DCT), and exponentiation. However, there is no unique solution to obtain the spectral magnitudes from the filter bank outputs even under the assumption of a sinusoidal model for speech since the number of harmonics generally exceeds 23. A unique solution is possible if the speech spectrum is constrained to be a linear combination of 23 frequency-domain basis functions and the spectral magnitudes are regarded as samples of the speech spectrum at appropriate frequencies. Further details of this method can be found in [6]. A further refinement of this approach involves the use of higher order cepstra. Starting from the higher order cepstra provided by the lookup table (Sec. 2.1.1), one can compute the spectral magnitudes as above. From the spectral magnitudes, a second estimate of the higher order cepstra can be obtained, which, in turn, can be used to refine the magnitude estimates. Two such iterations are used in estimating the magnitudes.
2.1.3. Mel-Frequency Domain Interpolation A second method for transforming cepstra into magnitudes involves the interpolation of the logarithm of the filter bank outputs in mel-frequency domain. The center frequencies of the filter banks uniformly divide the signal bandwidth in melfrequency domain and the logarithm of the filter bank outputs represent the average spectral magnitudes at these frequencies. An estimate of the spectral magnitude at any other frequency is then obtained through simple interpolation using the DCT basis functions themselves as the interpolating functions. Further details of this method can be found in [7]. For voiced frames, the recovery of higher order cepstra (Sec. 2.1.1) is helpful in improving the magnitude estimates obtained from this method.
2.1.1. Recovery of Higher Order Cepstra
2.1.4. Combined Magnitude Estimate Calculation
At the front-end, only 13 of the 23 MFCC values are computed, compressed, and transmitted. The remaining values (C13 – C22) referred to here as higher order cepstra are simply discarded. If these values can be recovered even partially, that would help in more accurate estimation of the spectral magnitudes. Therefore, for mixed-voiced and fully voiced frames, the higher order cepstra are recovered using a lookup table with the pitch period P serving as an indexing parameter. The overall pitch period range, viz., 19 – 140 samples at 8 kHz, is divided into a number of consecutive, non-overlapping sub-ranges (53 sub-ranges for XFE and 29 sub-ranges for XAFE) and the higher order cepstra for each sub-range is stored in the table. The table was generated by analyzing a large speech database and computing the average value of the higher order cepstra over all frames with pitch period values falling within the appropriate sub-range.
The magnitude estimates ME from Section 2.1.2 and MI from Section 2.1.3 are combined to form the final magnitude estimate M. For unvoiced frames, the ME vector is first scaled so that it has the same squared norm as the MI vector and then M is computed as M = 0.9ME + 0.1MI. For voiced frames, the scaling depends on the pitch period. For P < 55, all components of ME are scaled uniformly so that it has the same squared norm as MI. For P ≥ 55, two scaling factors one each for low and high frequency bands are computed and each component of ME is scaled by a linear combination of these two scale factors. After scaling, M is computed as M = χ ME + (1-χ) MI where the mixing parameter χ is obtained from a lookup table using the pitch period P as an indexing parameter. In general, MI is given more weight for lower pitch periods and ME for higher pitch periods.
2.1.2. Solution of Front-End Equation 2.2. All-Pole Modeling
This is the first method for transforming cepstra into magnitudes by using a constrained solution of the front-end equation. At the front-end, each frame of speech is filtered by a high-frequency pre-emphasis filter and transformed into the frequency domain
Given the harmonic magnitude estimate of a voiced frame, an all-pole model is derived in the APM block that is used in the
I - 54
➡
➡ Voiced Phase Synthesis (VPS) and Post Filtering (PF) blocks. The magnitude vector M is first normalized so that the largest component value is 1. The normalized vector is then linearly interpolated using an interpolation factor of 1, 2, 3, or 4 depending on the size of the vector. An inverse DFT is next applied to the interpolated vector to derive a pseudoautocorrelation sequence. From this sequence, an all-pole model is obtained using the well-known Levinson-Durbin recursion. The model order is 10, 14, and 18 respectively for 8, 11, and 16 kHz input sampling rates. If the interpolation factor used is 1, then this model is final. In other cases, an improved model is obtained through an iterative process. The spectral envelope of the current all-pole model is used in the interpolation of the normalized vector to obtain a better-interpolated vector. Inverse DFT and Levinson-Durbin recursion are then applied to this new interpolated vector to obtain an improved all-pole model. Further details of this modeling technique can be found in [8].
as above, it is transformed to a time-domain speech signal in the Line Spectrum to Time Domain (LSTD) block. First, the harmonics close to the fold-over frequency (> 0.93π ) are filtered out. Then the line spectrum is scaled so that the energy of the reconstructed speech will correspond to the value contained in the log-E parameter. Then the line spectrum is converted to a synthetic complex FFT spectrum by convolving it with the FFT of a Hann window 2L samples long, where L is the frame shift in samples, e.g., L = 80 for 8 kHz input sampling rate. An inverse FFT is applied to the synthetic spectrum to generate a windowed speech signal 2L samples long. The windowed speech signals from successive frames are then overlap-added in the OLA block to produce output speech. In XFE, the sampling rate of the reconstructed speech matches the input sampling rate, viz., 8, 11, or 16 kHz. In XAFE, the sampling rate of the reconstructed speech is 8 kHz irrespective of the input sampling rate, viz., 8 or 16 kHz.
2.3. Post Filtering Post filtering is applied to the harmonic magnitudes of a voiced frame to emphasize the formants in the speech signal thereby improving speech quality. Let A(z) = 1 + a1z-1 + a2z-2 + … + aNz-N where ai, i = 1, 2, …, N are the all-pole model parameters, N is the model order, and z is the Z-transform variable. Then, the weighting filter W(z) is defined as W(z) = [A(0.75z) / A(0.95z)] ⋅ (1-0.5z-1). The weights Wk = ⏐W(z=exp(jωk))⏐ where ωk are the harmonic frequencies (in radians) are computed and normalized so that the L4 norm is unity. The weights are then limited to a range of [0.5,1.5] and applied to the corresponding harmonic magnitudes with normalized frequencies above 0.05π. The weighted magnitude vector is then scaled so that it has the same energy as the unweighted vector.
2.4. Voiced Phase Synthesis The harmonic phases of a voiced frame are computed in the VPS block. Each harmonic phase ϕk is made up of three components: linear phase component ϕk,lin= τ ⋅ k, excitation phase component ϕk,exc, and envelope phase component ϕk,env. The linear component accounts for the phase evolution due to the harmonic frequency. The linear phase tangent τ is taken to be zero if the previous frame is unvoiced; otherwise, it is taken to be the sum of the corresponding value at the previous frame and the product of the frame shift in samples and the average of the fundamental frequency ω1 values corresponding to the current and the previous frames. The excitation phase component is obtained from a lookup table using the harmonic frequency as an indexing parameter. This table was generated using a typical excitation pulse obtained from inverse-filtered speech. The envelope phase component is obtained from the all-pole model parameters as ϕk,env = −arg(A(z=exp(jωk))). For each harmonic frequency ωk, the three components are computed and added together to provide the final harmonic phase.
2.4. Conversion to Time-domain Once the line spectrum of a frame, viz., number of components, their frequencies, magnitudes, and phases, has been determined
3. INTELLIGIBILITY EVALUATION For many of the intended applications of the extended DSR standards, speech intelligibility is considered crucial. The minimum requirement and desired objective for the intelligibility of the reconstructed speech were set by the intelligibility of the reference US DoD Federal standard LPC10e and MELP coders respectively both operating at 2400 bps. The intelligibility was evaluated using two different tests: Diagnostic Rhyme Test (DRT) and Transcription Test (TT). The results of the DRT are shown in Table 1. The reconstructed speech signals from the extended DSR standards are identified by XFE and XAFE. For informational purposes, the original speech was also included in the test. It can be seen that the DRT scores of the XFE and XAFE reconstructions exceed the minimum required values corresponding to the LPC10e coder. In fact, the scores meet or exceed the objective values corresponding to the MELP coder under clean as well as noisy (car noise – 10 dB, street noise – 15 dB, babble noise – 15 dB) background conditions. DRT scores were also obtained for different input sampling rates (8, 11, & 16 kHz for XFE and 8 & 16 kHz for XAFE), input signal levels (± 10 dB), and channel error conditions (C/I 10, 7, & 4 dB). The DRT scores for different sampling rates and signal levels were found to be quite close to the scores at nominal sampling rate (8 kHz) and nominal signal level (-26 dBov) shown in Table 1 under the column corresponding to clean background. Under channel error conditions, the DRT scores were barely affected for 10 and 7 dB C/I and dropped by about 10% for 4 dB C/I.
Table 1. DRT scores for reference coders and reconstructions Noise Type: Coder: Original speech XFE Reconstruction XAFE Reconstruction LPC10e MELP
I - 55
Clean 95.7 93.0 92.8 86.9 91.6
Car 10dB 95.5 88.8 88.9 81.3 86.8
Street 15dB 92.4 85.0 87.5 81.2 85.0
Babble 15dB 93.8 87.1 87.9 81.2 85.3
➡
➠ In the speech community, the use of DRT for intelligibility evaluation is well established. The DRT is a context-free test that uses isolated words from a small vocabulary. The listener listens to a word only once before choosing from a pair of rhyming words that differ only in the initial consonant. However, in a real-life situation, one would expect the speech material to consist of connected words with context, a larger vocabulary, and the listener to have a chance to listen to a word more than once. To address this concern, the Transcription Test was devised in which longer passages of commonly encountered speech material (from Wall Street Journal) were processed by different coders and transcribed by professional transcribers. The results of the TT test are shown in Table 2. Table 2. TT scores for ref. coders and reconstructions Noise: Clean Car Str. Bab. Clean Coder: Original 1,1,2 1,0,1 0,2,4 3,9,3 0,4,1 XFE 1,6,1 0,3,6 2,9,4 5,9,2 1,4,5 XAFE 0,6,2 0,5,4 0,4,3 3,5,2 1,6,5 LPC10e 8,18, 62,26, 67,22, 47,12, 18,10, 6 7 7 3 9 MELP 0,3,1 1,6,3 4,6,2 16,10, 1,9,5 3 Words in msg. 1166 1153 1155 1149 1204
Ave. Error (%) 0.549 0.995 0.789 5.526 1.201 Total: 5827
For the TT, five passages were chosen corresponding to the five middle columns of the table with total numbers of words shown in the last row. Each passage was made up of utterances from 16 different (8 male, 8 female) speakers. Two of the passages had clean background while to the other three, appropriate background noise (car, street, and babble) was added at SNR values ranging from 10 – 20 dB. Five professional transcribers were selected to transcribe 5 passages each, with each of the 5 passages from a distinct row and column. Thus each transcriber listens to a passage only once but listens to all the passages and all coded conditions. The transcribed material was compared with the original text and numbers of missed, wrongly transcribed, and partially transcribed words were counted. These numbers are shown in the table. The average error rate is shown in the last column. It is seen that the error rates of the two reconstructions (XFE and XAFE) are smaller than that of LPC10e as well as MELP.
4. CONCLUSIONS With a minimal increase in bit rate (800 bps) over the previous standards, the two new extended ETSI DSR standards provide the capability to reconstruct highly intelligible speech at the back-end thereby extending the usefulness of the standards to applications where human verification of speech utterances is crucial. Speech is reconstructed from the standard mel-cepstral features and additional tonal features extracted by the extended standards at the front-end, viz., pitch period and voicing class, by using a sinusoidal speech model. The tonal features are also useful in enhancing the recognition accuracy of tonal languages, e.g., Mandarin, Cantonese, and Thai.
I - 56
Intelligibility of reconstructed speech was evaluated using the well-known Diagnostic Rhyme Test (DRT) as well as a complementary Transcription Test. Test results show that the intelligibility of speech reconstructed by the extended standards is at least as good as that of the US DoD Federal Standard MELP coder operating at 2400 bps.
5. REFERENCES [1] ETSI ES 202 211, “Speech Processing, Transmission and Quality aspects (STQ); Distributed speech recognition; Extended front-end feature extraction algorithm; Compression algorithms; Back-end speech reconstruction algorithm,” 2003. [2] ETSI ES 202 212, “Speech Processing, Transmission and Quality aspects (STQ); Distributed speech recognition; Extended advanced front-end feature extraction algorithm; Compression algorithms; Back-end speech reconstruction algorithm,” 2003. [3] Pearce D., "Enabling new speech driven services for mobile devices: An overview of the ETSI standards activities for distributed speech recognition front-ends,” in Proc. American Voice I/O Society (AVIOS), San Jose, 2000. [4] ETSI AU/335/01, “New Aurora Activity for Standardization of a Front-End Extension for Tonal Language Recognition and Speech Reconstruction”, June 2001. [5] McAulay R.J., and Quatieri, T.F., “Speech Analysis / Synthesis Based on a Sinusoidal Representation,” IEEE Trans. Acoust., Speech, Signal Processing, Vol. 34, pp. 744-754, 1986. [6] Chazan D., Hoory R., Cohen G., and Zibulski M., “Speech Reconstruction from Mel Frequency Cepstral Coefficients and Pitch Frequency,” Proc. Int. Conf. on Acoust., Speech, and Signal Processing (ICASSP), pp. 1299-1302, 2000. [7] Ramabadran T., Meunier J., Jasiuk M., and Kushner B., “Enhancing Distributed Speech Recognition with Back-End Speech Reconstruction,” Eurospeech, pp. 1859-1862, 2001. [8] Ramabadran T., Smith A., and Jasiuk M., “An Iterative, Interpolative Transform Method for Modeling Harmonic Magnitudes,” Proc. 2002 IEEE Speech Coding Workshop, pp. 38-40, 2002.