Solar Energy, Vol. 13, pp. 21-34. Pergamon Press, 1970. Printed in Great Britain ..... JUL 2g. AUG Z~. SEP 13. OF. THE. SUN. )CT 3. OCT 24. NOV 20. JAN 23.
Solar Energy, Vol. 13, pp. 21-34.
Pergamon Press, 1970.
Printed in Great Britain
T H E E V A L U A T I O N OF S U R F A C E V A R I A T I O N S SOLAR R A D I A T I O N INCOME*
1N
B. J. G A R N I E R and A T S U M U O H M U R A t
(Received 12 August 1969) A b s t r a c t - F o r m u l a e have been developed, using fundamental Earth/Sun relationships and the radiation observations normally made on well-exposed horizontal surfaces, whereby to evaluate the flux of global radiation on surfaces of any gradient or azimuth. Integration permits the calculation of totals over I-hr periods or longer. Experiments in southern Quebec show the formulae to be accurate to within the instrumental error of normally used radiation measuring devices. The technique can be used to make maps of surface variations in radiation income from the observations of a single, representative site, to evaluate the optimum installation arrangements for devices using solar energy as a power source, or to help solve problems where the radiation balance is important, such as in ecological or in water resource investigations. En employant les relations fondamentales entre le soleil et la terre et les observations des radiations normalement faites sur des surfaces horizontales bien exposres, on a 6tabli des formules qui permettent d'rvaluer le flux des radiations globales sur des surfaces de n'importe quel gradient ou azimut. La mrthode d'intrgration permet de calculer les totaux sur des prriodes d'une heure ou plus. Des exprriences dans la rrgion sud du Qurbec ont confirm6 la prrcision de ces formules, avec la marge d'erreur normale des appareils de mesure des radiations. Cette technique pent servir b. 6tablir des cartes de la variation des radiations regues sur la surface h partir d'observations d'un seul point reprrsentatif, afin d'rvaluer la disposition la plus favorable d'installations d'appareils utilisant l'rnergie solaire comme source d'rnergie, ou pour aider h rrsoudre des probl~mes dans lesquels l'rquilibre des radiations est important, tels que dans le domaine des recherches 6cologiques ou des ressources de l'eau. Rrsum~-
- Se han desarrollado f6rmulas, usando relaciones Tierra/Sol fundamentales y las observaciones de radiaci6n normalmente efectuadas en superficies horizontales bien expuestas, para permitir la evaluacirn del fl ujo de radiaci6n global en superficies de cualquier gradiente o azimut. La integracirn permite calcular totales durante pefiodos horarios o m~is largos. Experimentos realizados en el sur de Quebec indican que la precisi6n de las frrmulas qneda dentro del margen de error instrumental de los dispositivos normalmente utilizados para medir la radiaci6n. La trcnica puede ser empleada para cartografiar las variaciones superficiales del ingreso de radiaci6n a partir de observaciones realizadas en un solo emplazamiento representativo; para evaluar las modalidades de instalaci6n 6ptimas de los dispositivos que utilizan energia solar como fuente de potencia; o para ayudar a resolver problemas en los que el balance de radiaci6n representa un factor importante, como en las investigaciones ecolrgicas o en las de recursos hidrfi.ulicos.
Resmnen
INTRODUCTION T H E TOTAL r a d i a t i o n sources such that
income
( R s ) o f a n y s u r f a c e is t h e s u m o f r a d i a t i o n f r o m f i v e
Rs = Q+q+qr+
L + Lr
(i)
w h e r e Q is d i r e c t s h o r t - w a v e r a d i a t i o n f r o m t h e S u n , q is d i f f u s e s h o r t - w a v e r a d i a t i o n f r o m t h e s k y , qr is s h o r t - w a v e radiation reflected from neighboring suFfaces, L is l o n g - w a v e r a d i a t i o n r e c e i v e d b y e m i s s i o n f r o m t h e a t m o s p h e r e , a n d Lr is l o n g - w a v e r a d i a t i o n r e c e i v e d f r o m n e i g h b o r i n g s u r f a c e s . R s is r e l a t e d q u a n t i t a t i v e l y t o (i) E a r t h / * 1968 Solar Energy Society Conference paper. t Department of Geography, McGill University. Montreal, Quebec. Canada. 21
22
B.J. G A R N I E R and A T S U M U O H M U R A
Sun relationships, (ii) the weather as expressing the physical state of the atmosphere, and (iii) the exposure of the surface to the various radiation sources. T h e first two of these variables provide the broad quantitative framework for the total radiation income, but it is the third v a r i a b l e - the exposure of the site i t s e l f - which exercises final control over the actual values of the radiation received at the surface. Since the radiation observations normally made are in respect of the quantity falling on well-exposed horizontal surfaces, it follows that although such observations provide a good indication of the energy derived from variables (i) and (ii) above, their utility so far as surface values are concerned is limited to the horizontal. F o r any other surface, the value of the radiation income must be evaluated by reference to the geometry of the surface, as expressed in its angle of slope and its orientation in relation to the Sun. F o r natural surfaces over most of the world, it is global solar radiation (Q + q) which provides the greater part of the radiation income. It is, moreover, this same solar radiation (particularly its direct short-wave component) which varies most in intensity because of surface geometry. Thus, an evaluation of this variation becomes important in many aspects of pure and applied science. For this purpose, it is necessary to evaluate direct short-wave radiation and diffuse sky short-wave radiation, separately, and to sum the results to obtain the surface variations of solar radiation income. FUNDAMENTAL
FORMULAE RADIATION
FOR DIRECT SHORT-WAVE
EVALUATION
T h e integration over all wavelengths of the fundamental formula for the monochromatic intensity of the solar beam yields a general law of transmission (Haltiner and Martin[l]) for the flux of direct solar radiation such that
1,,,-~ lrp"
(2)
where 1,, is the energy (in ly min -~) delivered by the Sun on a surface normal to the r a y s ; / r is the intensity of extraterrestrial r a d i a t i o n - e q u a l to the solar constant divided by the square of the radius vector of the Earth (List [2]); p is the mean zenith path transmissivity of the atmosphere, and m is the optical air mass. T h e flux of direct solar energy falling on a surface, however, is only equal to I,, under the particular situation that the surface is, in fact, nermal to the Sun's rays. For all other cases, the intensity of direct radiation falling on the surface is the value of I,, modified by the relation between the angle and azimuth of the surface, on the one hand, and the height and azimuth of the Sun on the other. If unit co-ordinate vectors are used to express these respective characteristics of the surface and the Sun ( G a m i e r and Ohmura[3]), an equation expressing the flux of direct radiation can be written in the form:
1~ = Irp" cos (X A S)
(3)
where Is is the intensity of direct short-wave radiation falling on the surface, X is a unit co-ordinate vector normal to the surface and pointing away from the ground, S is a unit co-ordinate vector expressing the position of the Sun, and A is a symbol denoting the angle between X and S. O f several possible ways to operate this equation, perhaps the simplest is to think
Evaluation of surface variations
23
of the Sun as moving north and south with the seasons along the meridian of solar noon for the given surface, and to regard the surface as rotating once in 24 hr around the Earth's polar axis. This concept enables S to be expressed solely in terms of the cosine and sine of the angle of the Sun's declination (8), and X to be expressed in terms of the latitude of the surface (~b), its angle of slope given by the zenith angle (Zx) of X, and the azimuth (.4) of the surface. It can then be shown[3] that, for a given moment of time, cos (X A S) = [(sin ~b cos H)(--cos A sin Zx)-- sin H (sinA cos Zx) + (cos ~b cos H) cos Z~] cos 8 + [cos ~b (cos.4 sin Z~)
(4)
+ (sin~b cos Z~)] sin8
where H is the hour angle measured from solar noon positively towards west and.4 is measured from north through east. It is apparent from Eq. (4) that the value of cos (X A S) can be derived from surface geometry and other readily available data. The value of the optical air mass in Eq. (3) can also be expressed in terms of the components used to express X and S, provided that the secant approximation for m can be validly used. Under these conditions m = l/cos Zs = 1/(cos 8 cos ~b cos H + sin 8 sin ~b)
(5)
where Zs is the zenith angle of the Sun [3]. When Zs is greater than 70 °, however, the secant approximation for rn is invalid and the true value of the optical air mass as given, for example, in the Smithsonian Meteorological Tables [2] must be used. The preceding argument indicates that the only element of Eq. (3) which cannot be obtained from tables, Earth/Sun relationships or terrain analysis, is atmospheric transmissivity (p). This varies considerably from place to place being, in general, a function of the weather and air mass characteristics. Standard methods can yield good approximations for the value of p for cloudless conditions, and in the absence of measured radiation data such methods must be used (de Brichambaut[4]). However, the present formula is intended for use in conjunction with standard radiation observations at a site representative of the area over which a knowledge of surface variations in solar radiation income is required. Under these circumstances, p may be evaluated either by rearranging Eq. (2) in a suitable form or by obtaining an "'equivalent atmospheric transmissivity" term, by using the value of daily total direct radiation as an indicator of the mean atmospheric transmissivity for the day[3]. Both of these methods depend on being able to distinguish between direct and diffuse short-wave radiation in the data being used. I N T E G R A T E D V A L U E S OF D I R E C T S H O R T - W A V E R A D I A T I O N I N C O M E
For practical purposes, it is necessary to integrate Eq. (3) over time periods longer than the min to which the formula refers. It is not mathematically possible to perform this integration in the form pt2
1st = l r J t p
#~
z~r
cos ~,~ A S) dt
(6)
where/st is the integrated total over a given time period such as a day or an hr, and tl and tz are the first and last times, expressed in hour angles, when the Sun shines on the surface during the period in question. Integration can, however, be achieved by means
24
B.J. G A R N I E R and A T S U M U O H M U R A
of a summation approximation using sufficiently small time intervals (t) in the expression t2 1st = l r ~ , p m
cos (X A S)At.
(7)
t=tl
Summation at l-rain intervals is practicable with the use of high-speed computers. But such a refinement is not necessary for most purposes. A comparison of the results obtained from using longer time intervals and those obtained from using one-min intervals for calculating daily radiation totals (Ohmura[5]), indicates that to use t = 20 rain will give an accuracy to within 5 per cent of that using t = 1 min. This calculation is for slopes up to 90 °. Since an accuracy of 5 per cent is within the observational error of normallyused instruments for observing radiation, a time interval of 20 min in Eq. (7) has been adopted for all calculations, to provide a universally applicable programing system, even though a longer interval for daily totals on slopes less than 90 ° is permissible within the limits of accuracy chosen. EVALUATING
DIFFUSE
SKY RADIATION
INCOME
Equation (7), using t = 20 min, is the operative equation for calculating the flux of direct solar radiation on surfaces of any slope. T o calculate global radiation it is necessary to add the contribution from radiation diffused from the sky and short-wave radiation reflected from the surrounding area. In the present study, the last-mentioned is neglected as contributing too small a percentage to affect materially the results for practical applications. T h e contribution of diffuse sky radiation, however, is frequently substantial and must be considered. F o r this purpose, Kondratyev's [6] equation D,. --- Dh cos" (0/2)
(8)
has been used. In this equation D~ is the diffuse radiation received on a surface of elevation angle 0 and Dh is the same but recorded on a horizontal surface. T h e expression assumes the existence of a homogeneous celestial hemisphere radiating isotropically. This is, in fact, true only when the sky is completely and densely overcast and the intensity of sky radiation is thus independent of the location of the Sun. U n d e r other conditions, especially when the sky is completely clear and the Sun is high in the sky, Ds calculated from Eq. (8) gives rather inaccurate results [5]. Measurements over a period of three days at Mont St. Hilaire, Quebec, were made in the autumn of 1968 to evaluate the validity of the equation. An Eppley pyranometer, tilted at an angle of 20 °, from horizontal, on a tripod and suitably shielded, was rotated successively e v e r y 20 min to face north, east and south, throughout the daylight hours of each of the three days. At the same time, a Kipp (Moll) shielded pyranometer measured continuously the diffuse radiation received on a horizontal surface. The resulting relationships between the computed and measured values are shown in Fig. 1. T h e results indicate that measurements and computations closely coincided when the sky was completely overcast. Under other conditions, the correlations between computed and measured values varied considerably between overestimates of up to 56 per cent and underestimates of 26 per cent, by computation in comparison with measurement. While these results suggest that Eq. (8) must be used cautiously to evaluate the sky radiation received on surfaces at different times, the inaccuracies of the method are mini-
Evaluation of surface variations
25 Measured
Measured
0 25
ly.mia.-I o.s
0,5 O
I
/
./..,o J
North
20°~
.;/.
./.~
o.5 ly.min7~ mqi~O i l i . ~I
IB
". Z
0 0.5
I
J
Q. 0.25 --
o.z~
O,S
.,
'•
-0.25
Fast 200 i~.
o Clear
"
Overcast
x
E
Cloudy
g,
o
in~'~ denotes from
South
0
o
!
0.25
observations
1200hrs. to sunset
20 ° 0.5 ly. mi n7-!
Measured
Fig. 1. C o m p a r i s o n between c o m p u t e d and m e a s u r e d diffuse sky radiation.
mized in the present context in two senses: firstly, the formula's use for daily totals means that integration over the entire hemisphere above the plane of the surface will thereby be achieved and the influence of the inaccuracies of individual moments thus reduced (Robinson[7]); and, secondly, the contribution of sky to global radiation is minimal under clear-sky conditions, when the assumption of isotropic conditions is least valid, and is maximal under overcast or very cloudy conditions when calculation by the formula contributes its most accurate results. ACCURACY OF RESULTS Theoretical considerations suggest that the procedures described for evaluating the topographical variations of global radiation income by the use of Eqs. (7) and trY) will yield results which, at least for daily totals, do not exceed the 5 per cent error suggested as permissible in view of instrumental limitations. T o test this claim, a series of measurements was made at Mont St. Hilaire, Quebec, from 29 August to 2 S e p t e m b e r , 1968. T h r e e Kipp (Moll) p y r a n o m e t e r s were installed each at an angle of 20 ° to the horiz-
26
B.J. G A R N I E R and A T S U M U O H M U R A
ontal, facing north, east and south. T h e s e pyranometers recorded global radiation (as modified by instrument tilt) continuously over the period. At the same time, an Eppley pyranometer was used to sample sky radiation, at similar inclinations, as described in the preceding section. T w o other Kipp pyranometers recorded total global and total sky radiation continuously (on a horizontal surface). T h e value of the vertical c o m p o n e n t of the direct short-wave radiation was obtained by subtracting measured sky from measured global radiation. The direct radiation thus elevated for a horizontal surface was used to obtain the transmission coefficient of the atmosphere, which was then employed in the calculation of global radiation on the sloping surfaces. F o r this purpose, the following equation was used: Comp. Global = lrp m COS (XAS) + Dp, cos 2 (0/2) +AI(Q +Dh) sin 2 (0/2)
(9)
where Q is direct short-wave radiation on a horizontal surface and Al is albedo (i.e. reflectance). In this equation, the first and second terms on the right-hand side are from Eqs. (7) and (8). T h e third term is reflection from the surrounding area. Calculation shows that this third term is generally less than 3 per cent of the short-wave reflected radiation and, therefore, contributed less than 1 per cent of the global radiation since the experiment was conducted in grassy surroundings where the albedo was less than 0.30. Thus, although the term was considered during the experiment, its small contribution can normally be safely neglected in evaluating surface variations in short-wave radiation. T h e results of the study are shown in the scatter diagrams of Fig. 2. T h e dots are plotted in respect of the 20-rain totals computed and measured during the 4 days of the experiment. T h e high correlation between computation and measurements for each surface, can be observed from the scatter of dots in relation to the 1 : 1 relationship lines included on each diagram, and may be noted statistically from the following calculated correlation coefficients: North 20 ° East 20 ° South 20 °
r = 0-995 r = 0-996 r = 0.996
This suggests that use of the procedure proposed here, for calculating surface variations of short-wave radiation income, is accurate to at least within 5 per cent. It is interesting to note from Fig. 2, however, that the error in calculated results is greatest on both north- and south-facing slopes when measured radiation is high, but that the sign of the error on the north slope is opposite to that on the south slope. This can be explained mainly by the formula used to evaluate the sky radiation component. It will underestimate for a south slope in the N o r t h e r n Hemisphere, when the sky is clear and the Sun is of high elevation, owing to the large proportion of radiation diffused downwards coming from the vicinity of the Sun. For the same reason, the sky radiation will be overestimated on the north slope. On the other hand. the more nearly homogeneous conditions of low Sun, or of overcast conditions, are expressed in the greater accuracy of computed values when global radiation values are low. APPLICATION
OF THE SYSTEM OF EVALUATION
C o m p u t e r programing of the formulae discussed enables the values of global radiation, or direct solar and diffuse sky radiation, separately, to be rapidly calculated for
Evaluation of surface variations l y . / 2 0 min.
Meosured
0 30
J
I0 |
20
i
I
27
3O 0
i,
I0 I
t
0
ZO I
I ~
30
20 •
e I
;
I0
4¢:/"
E o c~
0 30
/ •/e
/ 0
, 0
IlO Measured
ZlO
A
: North
20 °
B
: South
20 °
C
: East
20 °
30
l y . / 2 0 rain.
Fig. 2. Comparison between computed and measured global radiation,
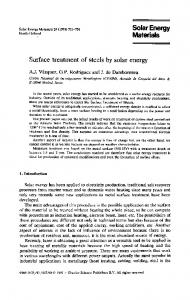
surfaces of any slope and azimuth a n y w h e r e on Earth, from the observational data recorded in respect of horizontal surfaces. Such programing must take into account changes in the Sun's declination and variations in the value of the solar extraterrestrial radiation (It). T o do this for each day or week of the year is time-consuming and unnecessary, in practice, since the influence of the day-to-day changes in the Sun's position in Eq. (7) is insignificant as c o m p a r e d with the other terms. Thus, it is convenient to divide the year into periods for which a suitable declination and value of extraterrestrial flux can be used. Since the relationship of declination with time is a sine curve, the procedure followed has been to divide the year into periods (of unequal length) for which, in each instance, a given declination and a corresponding value of Ir can be regarded as true mid-points. Such a division is given in Fig. 3. T h e lengths of the periods have been chosen bearing in mind the limits of a c c u r a c y already stipulated. T h e result
L
DE C LI N AT I ON
OF
THE
SUN
,_
J
1
h
i
_ _
.
)CT 3
OCT 24
NOV 2 0
I @
JAN 23
t
, ;
-....
FEB 18
i
i
C~
, J ,
1
_
[ I
m:
d
i
r .
i
~.
A P R 21
L
p,
f
MAYi8
E
L
.=
/
JUL 2g
i
AUG Z~ J
S E P 13
V H f l I ~ H O f-l~ f i S Z V pue ~I~IIN~V~) "f 'l]
8~
Evaluation of surface variations
29
is a division of the year into 12 periods centred upon the representative figures given in Table 1. Table 1. Solar declinations selected for computer programing Period Nov 20-Jan 23 Jan 24-Feb 18; Oct 24-Nov 19 Feb 19-Mar 10; Oct 3-Oct 23 MarlI-Mar 31; Sep 13-Oct 2 Apt I-Apr 21; Aug23-Sep 12 Apr22-May 18; Jul 26-Aug 22 May 19-Ju125
Declination
lr
-23°27 ' --15 38 --07 49 0000 0749 15 38 23 27
2.07 (ly min-~) 2-06 2-04 2-02 1.99 1-97 1-94
F o r mapping purposes, the area being studied is covered by a grid system and, at each intersection of the grid, the gradient and azimuth for the point is inserted. T h e s e intersect values can generally be obtained from a contour map, provided the scale of the map is large enough for the purposes of the study in question. The closeness of the grid network must necessarily be decided in terms of the detail of the study and the intensity of the local relief (Basnayake[8]). In mountainous parts or other regions of intense local relief, it may also be necessary to make allowance for obstruction from the local skyline. A technique for making this correction has been developed[5] but its explanation is too lengthy to be included here. In general, the obstruction from the local skyline does not appreciably alter the calculated values of daily totals, except in particularly rugged areas in middle and high latitudes. H o w e v e r , if early morning or late afternoon values alone are being investigated, when the Sun is less than 30 ° above the horizon, the local skyline for each grid point must be carefully examined for possible obstruction. In the course of the research on which this article is based, maps of the surface variations in both direct and global short-wave radiation have been prepared for Mont St. Hilaire, Quebec (latitude 45 ° N), and Barbados (latitude 13 ° N). A full discussion of the results obtained would require separate treatment; the examples given in Figs. 4, 5 and 6 are presented only as illustrations. Figure 4 is a selection from maps which have been made of the pattern of direct radiation at Mont St. Hilaire, Quebec. The mountain is one of a group of hills which rise steeply from the flat St. L a w r e n c e lowlands east of Montreal, The part shown (in Fig. 4) is towards the south of the mountain where considerable relief diversity is found in the vicinity of Lac Hertel. Radiation was measured by Kipp pyranometers at the climatological station, situated about 200 yd off the western edge of the area depicted on the map. T h e maps indicate a greater topographic variation under the equinoctial condition in September 1967, than at either of the solstices. The considerable contrast between different slopes in September reflects the combined influence of longer potential sunshine duration and the continuously longer instantaneous values on the south slopes as compared with the north-facing slopes. In the D e c e m b e r example, the difference in instantaneous values between north and south slopes is large. H o w e v e r , the small daily total due to the short days and low sun-angle yields little topographical distinction on the maps. Small differences are also characteristic of the example for June. In this case, they can be explained in two ways: firstly, the high altitude of the Sun makes the cosmic
30
B.J. G A R N I E R and A T S U M U O H M U R A
LAC HERTEL
LAC HERTEL
. . . . St reol~'~ Contour M o ;
Sept. 19,
p = 0.75 0
~Ao
HERTEL
~ -
..,,-.
I, - S "~
~'°
HERTEL
N
June 2 0 , 1967
p= 0.60
2 7 ~ ' ~ 0 .
112 Fig. 4. The surface variation in direct short-wave radiation at Mont St. Hilaire, Quebec,
Evaluation ot surface variations
31
North Point
N
Over 450 ly.per doy 425- 450 I¥.perdoy Undm'425 ly.per doy
I I
I
0
I I
I
2
I
3
I.,,..
4
Fig. 5. The mean daily surface radiation distribution in Barbados. July 1964 (data from Tout [9]).
32
B.J. GARNIER
and A T S U M U O H M U R A
North Point Over 475 lypor doy 450- 47~ ly. per doy 425- 450 ly per doy 400- 425 ly.per doy 3?5 - 400 ly.per doy Under 375 ly.per doy
I
I
I
I
I
[m,,o,
I
o
I
2
3
4
Ragged
lk Point
Fig. 6. T h e m e a n daily surface radiation distribution in Barbados, D e c e m b e r 1964 (data from T o u t [9]).
Evaluation of surface variations
33
value in Eq. (7) differ little from slope to slope; secondly, the relatively low solar intensity on the north-facing slopes is compensated for by a large potential sunshine duration. The latter factor makes the difference in azimuth less important than the difference in gradient, the range of which is generally small in nature. The two maps of Barbados, in Figs. 5 and 6, show the surface variations in global radiation under tropical conditions, The island is situated in 13° N and has considerable relief diversity in the Scotland District (inland from Beileplane) where severe soil erosion has produced a maze of steep slopes and gullies on land sloping eastwards to sea level from a height of approximately 1000 ft. Elsewhere, the relief is on the whole gentle and few slopes exceed 10°. These relief contrasts are reflected in the pattern of global radiation shown on both the maps. The most interesting feature of the maps, however, is the contrast between the range of mean daily solar radiation, in the tropics, the global radiation recorded on horizontal surfaces changes little with the seasons, except in response to the weather. Thus, in Barbados. the mean daily solar radiation recorded for July 1964 was 451 ly and for December 1964,432 ly, When the influence of the surface is introduced into the picture, however, considerably more contrast than the figures suggest between the two months is seen to exist. With the relatively lower solar altitudes of December, some places received less than 375 ly and others over 475 ly, whereas in July the extreme range was from only 420 to 460 ly, and the radiation income responded much less to surface variations than in December. CONCLUSION
Although this paper has concentrated on a method of evaluating surface variations in solar radiation income, the fundamental formulae discussed have many other uses. They provide a useful tool for estimating the variations of global radiation, in time and space in different latitudes, from which tables and diagrams can be prepared to show, for example, accumulated values of direct solar radiation, under different transmissivities, for surfaces of any given inclination and azimuth. Such accumulations have obvious implications for solar-energy applications in many forms. They can be used in relation to building design, or for evaluating the optimum installation arrangement of devices using solar energy as a power source. The system may also be applied to problems of ecology, agriculture and water-use evaluation. In short, it is suggested that the methods so examined provide a flexible way of using, in a fruitful and practical manner, the radiation data being recorded, on a meteorologically standardized horizontal surface, at an increasing number of sites. Acknowledgements-The research reported in this paper is supported by funds from the National Research Council. Ottawa. the Department of Transport (Meteorological Branch), Toronto, and the Office of Naval Research (Geography Branch), Washington, D.C.
REFERENCES [l] G..I. Haltiner and R. F. L, Martin, Dynamical and Physical Meteorology. p. 92. McGraw Hill. New York and London (1957). [2] R.J. List (Ed.), Smithsonian Meteorological Tables, Smithsonian Misc. Coll., Vol. 114, 6th Edn, pp. 417 and 422 (1966). [3] B. J. Garnier and Atsumu Ohmura, A method of calculating the shortwave radiation income of slopes. J. AppL Meteor. 7, 796 (1968).
SE Vo[°13No. I.-C
34
B . J . G A R N I E R and A T S U M U O H M U R A
[4] P. de Brichambault, Rayonnement Solaire et Echanges Radiatifs Naturels, pp. 113-128. GauthierVillars, Paris (I 963). [5] Atsumu Ohmura, Computation and Mapping the Shortwave Radiation on a Slope, MSc. Thesis, McGill University (1969). [61 K. Ya. Kondratyev, Radiative Heat Exchange in the Atmosphere (Translated from the Russian by O. Tedder), p. 332. Pergamon Press, Oxford and New York (1965). [7] N. Robinson (Ed.), Solar Radiation, p. 122. Elsevier, Amsterdam (1966). [8] B. K. Basnayake, Two maps of direct shortwave radiation in barbados. Climat. Bull. (McGill Univ.) No. 4,21 (1968). [9] D. G. Tout, Tables of Radiation in Barbados. 1964, Climat. Observations (N.S.) No. 2, McGill University (1968).