Training & Testing 1
IJSM/4024/15.5.2014/MPS IJSM/4024/15.5.2014/MPS
The Evolution of Physical and Technical Performance Parameters in the English Premier League
Authors Affiliations
Key words ▶ longitudinal ● ▶ high-intensity ● ▶ sprinting ● ▶ passing ● ▶ football ●
C. Barnes1, D. T. Archer2, B. Hogg2, M. Bush2, P. S. Bradley2 1 2
Sports Science, CB Sports Performance Ltd, Rugeley, United Kingdom Department of Sport and Exercise Sciences, University of Sunderland, Sunderland, United Kingdom
Abstract
▼
This study examined the evolution of physical and technical soccer performance across a 7-season period in the English Premier League. Match performance observations (n = 14 700) were analysed for emergent trends. Total distance covered during a match was ~2 % lower in 2006–07 compared to 2012–13. Across 7 seasons, highintensity running distance and actions increased by ~30 % (890 ± 299 vs. 1 151 ± 337 m, p < 0.001; ES: 0.82) and ~50 % (118 ± 36 vs. 176 ± 46, p < 0.001; ES: 1.41), respectively. Sprint distance and number of sprints increased by ~35 % (232 ± 114 vs. 350 ± 139 m, p < 0.001; ES: 0.93) and ~85 % (31 ± 14 vs. 57 ± 20, p < 0.001; ES: 1.46),
Introduction
▼
accepted after revision April 13, 2014 Bibliography DOI http://dx.doi.org/ 10.1055/s-0034-1375695 Int J Sports Med 2014; 35: 1–6 © Georg Thieme Verlag KG Stuttgart · New York ISSN 0172-4622 Correspondence Chris Barnes Sports Science CB Sports Performance Ltd St Helens Rugeley United Kingdom WS15 3EG Tel.: + 44/780/1232 094 Fax: + 44/128/3841 670
[email protected]
Soccer match play is characterized by brief bouts of high-intensity linear and multidirectional activity interspersed with longer, variable recovery periods [17]. There is a commonly held belief amongst coaches and players that there has been an increase in both the physical and technical demands of the game. However, this position currently lacks evidence. Technical rather than physical factors have been shown to better differentiate between competitive standards in elite soccer [3]. There is, however, a lack of research to map the development of the game and to quantify whether this perception of physical and technical evolution is indeed a reality. Other team sports such as handball and Australian rules football have been shown to have evolved over time, possibly due to a combination of rule changes and improvements in physical, technical and tactical preparation [2, 15]. A comparison of the intensity of English League soccer matches played in the 1991–92 and 1997–98 seasons found increased incidence of dribbling, passing, crossing and running with the ball [20].
respectively. Mean sprint distance was shorter in 2012–13 compared to 2006–07 (5.9 ± 0.8 vs. 6.9 ± 1.3 m, p < 0.001; ES: 0.91), with the proportion of explosive sprints increasing (34 ± 11 vs. 47 ± 9 %, p < 0.001; ES: 1.31). Players performed more passes (35 ± 17 vs. 25 ± 13, p < 0.001; ES: 0.66) and successful passes (83 ± 10 % vs. 76 ± 13 %, p < 0.001; ES: 0.60) in 2012–13 compared to 2006–07. Whereas the number of short and medium passes increased across time (p < 0.001; ES > 0.6), the number of long passes varied little (p < 0.001; ES: 0.11). This data demonstrates evolution of physical and technical parameters in the English Premier League, and could be used to aid talent identification, training and conditioning preparation.
Similarly, increased passing rates and ball speeds have been observed in World Cup final matches across a 44-year period (1966–2010) [18]. Although this research provides insight into the technical development of soccer match play, no consideration was given to the physical performance of players. To gain a more comprehensive understanding of the evolving patterns of soccer, large scale studies to evaluate both physical and technical development are needed which include recent observations across multiple seasons and control for contextual factors such as playing position and phase of season [9]. The aim of this study was thus to examine the evolution of the physical and technical performances parameters in the English Premier League (EPL) using the largest controlled sample published to date.
Materials and Methods
▼
Match performance data were collected from 7 consecutive EPL seasons (2006–07 to 2012–13) using a multiple-camera computerized tracking
■ Proof copy for correction only. All forms of publication, duplication or distribution prohibited under copyright law. ■ Barnes C et al. Evolution and Match Performance… Int J Sports Med 2014; 35: 1–6
2 Training & Testing
IJSM/4024/15.5.2014/MPS
system (Prozone Sports Ltd®, Leeds, UK). The validity and reliability of this tracking system has been previously quantified [8, 9]. The investigation was conducted in accordance with the Declaration of Helsinki and meets the ethical standards of the International Journal of Sports Medicine [12]. Data were derived from Prozone’s Trend Software and consisted of 1 036 individual players across 22 846 player observations. Original data files were de-sensitized. Individual match data were included only if players had completed the entire 90 min, and matches were excluded if a player dismissal occurred. The total number of observations were substantially different across season (2006–07 to 2012–13), phase of season (Aug–Nov, Dec– Feb, Mar–May), position (attackers, centre backs, central midfielders, full-backs, wide midfielders), location (home and away) and team standard based on final league ranking (A: 1st–4th, B: 5th–8th, C: 9th–14th, D: 15th–20th). The original data were re-sampled using a stratification algorithm in order to balance the number of samples for each factor, thus minimising errors when applying statistical tests. The re-sampling was achieved using the stratified function in the R package “devtools” (R Development Core Team) using the procedures of Wickham & Chang [19] with 14 700 player observations included for further analyses ▶ Table 1). (● Activities were coded into the following: standing (0–0.6 km · h − 1), walking (0.7–7.1 km · h − 1), jogging (7.2–14.3 km · h − 1), running (14.4–19.7 km · h − 1), high-speed running (19.8–25.1 km · h − 1) and sprinting ( > 25.1 km · h − 1). Total distance represented the summation of distances in all categories. High-intensity running consisted of the combined distance in high-speed running and sprinting ( ≥ 19.8 km · h − 1) and was separated into 3 subsets based on the teams’ possession status: with (WP) or without ball possession (WOP) and when the ball was out of play (BOOP). Sprinting was differentiated into explosive actions (entry into the sprint zone with no excursion into the high-speed zone in the previous 0.5 s period) or leading (entry into the sprint zone via an excursion of 0.5 s or more into the high-speed zone) [9]. Matches were concomitantly coded for technical events such as the number of passes, successful passes, received passes, touches
IJSM/4024/15.5.2014/MPS
per possession, dribbles, shots, events of tackles/tackled, crosses, final third entries, possession won and lost. One-way independent-measures analysis of variance (ANOVA) tests were used to compare each season with Dunnet’s post hoc tests being used to verify localised differences. Statistical significance was set at p < 0.05. The effect size (ES) was calculated to determine the meaningfulness of the difference [1], and magnitudes were classified as trivial ( < 0.2), small ( > 0.2–0.6), moderate ( > 0.6–1.2) and large ( > 1.2–2.0). All analyses were conducted using statistical software (R Development Core Team), and data visualisation was carried out using the Deducer Interface for the R statistical programming language.
Results
▼
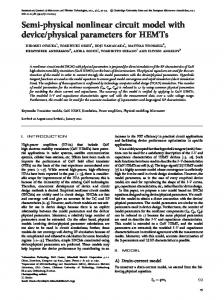
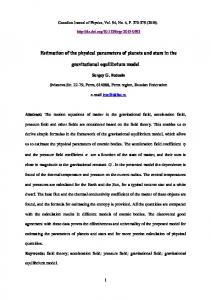
Total distance covered during a match was lower in 2006–07 compared to 2012–13 (10 679 ± 956 vs. 10 881 ± 885 m) but var▶ Fig. 1a, ied by a trivial magnitude across the 7 seasons (● p < 0.001; ES: 0.01–0.22). High-intensity running distance increased from 890 ± 299 m in 2006–07 to 1 151 ± 337 m in ▶ Fig. 1b, p < 0.001; ES: 0.82), with an associated 2012–13 (● increase in the number of high-intensity running actions (118 ± 36 vs. 176 ± 46, p < 0.001; ES: 1.41). High-intensity running WP was lower in 2006–07 (373 ± 238 m) compared with other seasons, apart from 2008–09 (389 ± 242 m), peaking at 478 ± 260 m in 2012/13 (p < 0.001; ES: 0.42). High-intensity running WOP was lower in 2006–07 (451 ± 162 m) compared to other seasons, peaking in 2012–13 (589 ± 198 m, p < 0.001; ES: 0.76). Trivial-small differences in the proportion of high-intensity running WP, WOP and BOOP were observed between seasons (p = 0.16, 0.34 and 0.001, respectively; ES: 0.04–0.22). Total sprint distance increased from 232 ± 114 to 350 ± 139 m between ▶ Fig. 1c; p < 0.001; ES: 0.93). ● ▶ Fig. 2a 2006–07 and 2012–13 (● shows a 2D kernel (Gaussian) density estimation of the number of sprints against the percentage of explosive spring over the 7 Premiership seasons. The plot shows the distribution of data is moving positively both along the x and y axis, indicating both an
Table 1 Re-sampled data from stratified random analysis. Data in parentheses indicate the relative proportion of the total sample as a percentage. Season Month Aug–Nov Dec–Feb Mar–May Location home away Position AT CB CM FB WM Standard A (1st–4th) B (5th–8th) C (9th–14th) D (15th–20th) Overall
2006–07
2007–08
2008–09
2009–10
2010–2011
2011–12
2012–13
Total
700 (33) 700 (33) 700 (33)
700 (33) 700 (33) 700 (33)
700 (33) 700 (33) 700 (33)
700 (33) 700 (33) 700 (33)
700 (33) 700 (33) 700 (33)
700 (33) 700 (33) 700 (33)
700 (33) 700 (33) 700 (33)
4 900 (33) 4 900 (33) 4 900 (33)
1 083 (52) 1 017 (48)
1 078 (51) 1 022 (49)
1 050 (50) 1 050 (50)
1 069 (51) 1 031 (49)
1 051 (50) 1 049 (50)
1 049 (50) 1 051 (50)
1 019 (49) 1 081 (51)
7 399 (50) 7 301 (50)
315 (15) 534 (25) 459 (22) 475 (23) 317 (15)
310 (15) 527 (25) 463 (22) 489 (23) 311 (15)
309 (15) 523 (25) 465 (22) 493 (23) 310 (15)
308 (15) 539 (26) 464 (22) 487 (23) 302 (14)
306 (15) 554 (26) 454 (22) 491 (23) 295 (14)
306 (15) 546 (26) 452 (22) 487 (23) 309 (15)
298 (14) 569 (27) 443 (21) 498 (24) 292 (14)
2 152 (15) 3 792 (26) 3 200 (22) 3 420 (23) 2 136 (15)
319 (15) 509 (24) 486 (23) 786 (37) 2 100
245 (12) 436 (21) 719 (34) 700 (33) 2 100
339 (16) 407 (19) 656 (31) 698 (33) 2 100
360 (17) 385 (18) 713 (34) 642 (31) 2 100
424 (20) 459 (22) 587 (28) 630 (30) 2 100
446 (21) 347 (17) 636 (30) 671 (32) 2 100
386 (18) 422 (20) 651 (31) 641 (31) 2 100
2 519 (17) 2 965 (20) 4 448 (30) 4 768 (32) 14 700
Month: Start of season (Aug–Nov), Middle of season (Dec–Feb) and End of season (Mar–May). Positions: AT = Attackers, CB = Centre backs, CM = Central midfielders, FB = Full– backs and WM = Wide midfielders
■ Proof copy for correction only. All forms of publication, duplication or distribution prohibited under copyright law. ■ Barnes C et al. The Evolution and Match Performance … Int J Sports Med 2014; 35: 1–6
Training & Testing 3
IJSM/4024/15.5.2014/MPS IJSM/4024/15.5.2014/MPS
Total Distance Covered (m)
a
14 000
12 000
10 000
8 000
6 000
High Intensity Run Distance (m)
b
2006–07
2007–08
2008–09
2009–10 Season
2010–11
2011–12
2012–13
2006–07
2007–08
2008–09
2009–10 Season
2010–11
2011–12
2012–13
2006–07
2007–08
2008–09
2009–10 Season
2010–11
2011–12
2012–13
3 000
2 000
1 000
Fig. 1 a Box and whisker plots with median values interquartile ranges and outliers for the total distance covered in matches across 7 seasons of the English Premier League. Each player’s observation is jittered and included as a small dot around box and whisker plots (diamond within box is the mean value for each season). The larger dots at the top and bottom of boxes are outliers. Line represents the regression line and 95 % confidence interval. b Box and whisker plots with median values interquartile ranges and outliers for the high-intensity running distance covered in matches across 7 seasons of the English Premier League. Each player’s observation is jittered and is included as a small dot around box and whisker plots (diamond within box is the mean value for each season). The larger dots at the top and bottom of boxes are outliers. Line represents the regression line and 95 % confidence interval. c Box and whisker plots with median values interquartile ranges and outliers for the sprinting distance covered in matches across 7 seasons of the English Premier League. Each player’s observation is jittered and is included as a small dot around box and whisker plots (diamond within box is the mean value for each season). The larger dots at the top and bottom of boxes are outliers. Line represents the regression line and 95 % confidence interval.
0
c
1 000
Sprint Distance (m)
750
500
250
0
increasing number of sprints (31 ± 14 vs. 57 ± 20, p < 0.001; ES: 1.46) and an increasing proportion of these sprints being explosive in nature (34 ± 11 vs. 47 ± 9 %, p < 0.001; ES: 1.31). Across the same period the average distance covered per sprint decreased (6.9 ± 1.3 vs. 5.9 ± 0.8 m, p < 0.001; ES: 0.91). Maximal running speed attained increased from 9.12 ± 0.43 to 9.55 ± 0.40 m.s − 1 between 2006–07 and 2012–13, respectively (p < 0.001; ES: 1.02). ▶ Table 2 summarises technical performance across the sea● sons. Players performed ~40 % more passes (p < 0.001, ES: 0.64, 0.66) and received ~17 % more passes (p < 0.001, ES: 0.76, 0.78), with a greater percentage of successful passes in 2011–12 and 2012–13 (p < 0.001; ES: 0.68 and 0.60, respectively) compared to
2006–07. Whilst the number of short and medium passes followed a similar pattern to total passes (p < 0.001; ES > 0.6), the number of long passes varied little over the seasons (p < 0.001; ES: 0.11). The number of shots taken varied little between seasons (p = 0.20; ES: 0.01–0.06), as did the number of tackles made, tackled events and final third entries (p < 0.001; ES: 0.06– ▶ Fig. 2b displays the interaction between the number of 0.27). ● passes made and the percentage of successful passes with increases in the mean values of both indicators occurring across seasons. The percentage of occurrences of players with a passing success rate of < 70 % decreased from 26 % in 2006–07 to 9 % in 2012–13.
■ Proof copy for correction only. All forms of publication, duplication or distribution prohibited under copyright law. ■ Barnes C et al. Evolution and Match Performance… Int J Sports Med 2014; 35: 1–6
4 Training & Testing
a
IJSM/4024/15.5.2014/MPS
2007–08
2006–07
2008–09
2009–10
2010–11
IJSM/4024/15.5.2014/MPS
2011–12
2012–13
Percentage of Explosive Sprints (%)
80
60
40
20
0 0 25 50 75 100 125
0 25 50 75 100 125
0 25 50 75 100 125
0 25 50 75 100 125
0 25 50 75 100 125
0 25 50 75 100 125
0 25 50 75 100 125
Total Number of Sprints
b
2006–07
2007–08
2008–09
2009–10
2010–11
2011–12
2012–13
100
Pass Success Rate (%)
80
60
40 0
25 50 75
0
25 50 75
0
25 50 75
0
25 50 75
0
25 50 75
0
25 50 75
0
25 50 75
Number of Passes
Fig. 2 a Visualization of data trends using two-dimensional kernel density plots of number of sprints and the relative proportion of those sprints that were explosive in nature (darker shades denote higher density within distribution). b Visualization of data trends using two-dimensional kernel density plots of number of passes and pass success rate in the English Premier League. Rug plots are also superimposed onto the x and y axis to provide insight into the distribution within each variable (darker shades denote higher density within distribution).
Discussion
▼
The present study analysed the largest sample of player observations in EPL soccer published to date and builds on previous research [11] by using a randomized stratification algorithm to allow seasonal, tactical and contextual factors to be accounted for. Our data demonstrate that whilst total distance covered during a match remained relatively constant, high-intensity run-
ning distance and sprinting distance increased by ~30–35 % between 2006–07 and 2012–13. Both total and high-intensity running distances have previously been used to represent the physical demands of soccer match play [5, 9], though high-intensity running would seem to be a better measure as it correlates well with physical capacity [4] and discriminates between competitive standard and gender [3, 14]. The findings of the present study would support this view [6, 20] and highlight the increasing
■ Proof copy for correction only. All forms of publication, duplication or distribution prohibited under copyright law. ■ Barnes C et al. The Evolution and Match Performance … Int J Sports Med 2014; 35: 1–6
Training & Testing 5
IJSM/4024/15.5.2014/MPS IJSM/4024/15.5.2014/MPS
Table 2 Technical indicators across the 2006–07 to 2012–13 seasons. Data are displayed as means and standard deviations. Variables passes successful passes ( %) short passes medium passes long passes passes received touches shots clearances dribbles tackles tackled final third entries possessions won possessions lost
2006–07
2007–08
2008–09
2009–10
2010–11
2011–12
2012–13
25.3 ± 13.4 76.3 ± 12.7 6.1 ± 4.3 13.4 ± 8.7 5.7 ± 4.0 18.8 ± 11.7 1.9 ± 0.6 1.2 ± 1.4 3.0 ± 2.9 0.1 ± 0.4 3.2 ± 2.2 2.8 ± 2.7 5.9 ± 4.0 19.6 ± 9.4 22.8 ± 6.9
27.0 ± 13.7† 78.0 ± 12.1† 7.0 ± 4.7† 14.3 ± 8.8* 5.7 ± 4.0 20.6 ± 11.7† 2.0 ± 0.5* 1.2 ± 1.4 3.4 ± 3.2† 0.2 ± 0.5 2.6 ± 2.0† 2.3 ± 2.3† 5.9 ± 3.8 19.7 ± 9.4 22.7 ± 7.0
30.8 ± 16.0† 80.7 ± 10.9† 7.9 ± 5.3† 16.7 ± 10.3† 6.2 ± 4.5# 24.3 ± 14.0† 2.0 ± 0.5† 1.2 ± 1.5 2.6 ± 2.5† 0.3 ± 0.7† 3.3 ± 2.3 2.9 ± 2.7 5.8 ± 3.9† 18.1 ± 8.9† 21.0 ± 6.6†
29.0 ± 14.6† 78.2 ± 11.8† 7.5 ± 5.2† 15.5 ± 9.4† 5.9 ± 4.3 22.3 ± 12.5† 1.9 ± 0.5 1.2 ± 1.5 2.8 ± 2.6# 0.5 ± 1.0† 3.2 ± 2.3 2.8 ± 2.8 5.9 ± 3.8 19.0 ± 9.1 22.1 ± 6.9#
32.1 ± 15.1† 81.1 ± 10.4† 8.3 ± 5.2† 17.7 ± 10.0† 6.2 ± 4.3# 25.5 ± 13.2† 2.0 ± 0.5* 1.2 ± 1.5 2.4 ± 2.3† 0.8 ± 1.4† 3.1 ± 2.1 2.6 ± 2.6 5.7 ± 3.7† 17.8 ± 8.6† 20.5 ± 6.7†
35.5 ± 18.2† 84.0 ± 9.6† 9.6 ± 6.4† 19.7 ± 11.9† 6.2 ± 4.6† 29.5 ± 16.1† 2.0 ± 0.5† 1.3 ± 1.6 2.1 ± 2.2† 1.2 ± 1.7† 2.9 ± 2.1# 2.6 ± 2.6 5.4 ± 3.6† 16.4 ± 8.0† 19.3 ± 6.3†
35.4 ± 17.1† 83.3 ± 10.1† 9.4 ± 6.0† 19.8 ± 11.3† 6.2 ± 4.5† 29.2 ± 14.9† 2.1 ± 0.5† 1.2 ± 1.5 2.3 ± 2.3† 0.6 ± 1.1† 3.0 ± 2.2 2.6 ± 2.5* 5.2 ± 3.6† 16.4 ± 7.7† 19.3 ± 6.3†
*p < 0.05, #p < 0.01 and †p < 0.001 denote difference from 2006–07
demands of the EPL. Williams et al. reported increases in the number of technical events (passes, dribbles and crosses) in the top tier of English soccer between the 1991–92 and 1997–98 seasons [20]. Increasing passing rates and ball speeds were observed in World Cup finals across a 44-year period [18]. The authors speculated that these trends could be related to longer stoppages for set-pieces with greater recovery periods allowing more intense activity when play is resumed, whereas in the present study increased high-intensity work was performed despite reduced recovery periods. The trend for increased physical and technical performance in the present study is reflective of an evolution within the game which may be a consequence of developing physical, technical and tactical preparation of players. Sprinting comprises of only 1–4 % of the total distance covered in a soccer match, but despite its infrequent nature it typically occurs during significant moments [9]. Across the timeframe of the present study, distance covered sprinting increased by ~35 % and can be attributed to shorter but more frequent sprinting bouts during matches. The growing physicality of the English Premier League is further supported by the fact that between 2006–07 and 2012–13, the absolute number of both explosive and leading sprints increased and that latterly a much higher proportion of sprints was performed explosively. Whilst previous research on EPL players found that the proportion of explosive and leading sprints was related to playing position [9], ours is the first to report longitudinal changes. Maximal running speed was also found to increase substantially from 2006–07 to 2012–13. Therefore, if players are producing shorter more explosive sprints but attaining higher maximal running speeds, then the acceleration capability of players has developed, which may increase injury propensity, and practitioners may need to develop appropriate pre-conditioning exercises [13]. Interestingly, patterns of injury incidence reported in UEFA audits have remained unchanged across a comparable 7-year period [10], although the data in that study were collected from 23 elite European clubs and not exclusively from the EPL, which is renowned for its physicality. Match analysis research typically quantifies the distance players cover in various movement categories without factoring in technical parameters [9, 16]. Over the period of this study we found that players performed ~40 % more passes, with a greater percentage of successful passes occurring in 2012–13 (84 %) compared to 2006–07 (76 %). This information, combined with
increased numbers of short and medium passes (with little change in the number of long passes), suggests that there has been an increase in passing tempo over recent seasons, resulting in greater involvement with the ball. The increased pass success rate may be explained partly by the increased proportion of short to medium passes, which are likely to be more successful than long passes. Fast transition of the ball to offensive areas of the pitch through a combination of high pass rates and ball speed is advantageous in elite soccer [18], and has been reported to have a strong association with success [6]. This increase in technical performance is further supported by the percentage of player occurrences with a passing success rate of < 70 %, identified as a minimum requirement in elite soccer [7], decreasing from 26 % in 2006–07 to 9 % in 2012–13. These data reflect the fact that over the 7-season period in question, the physical and technical demands of EPL soccer have increased substantially. Coaches and sports scientists should be mindful of this when developing training and conditioning practices.
Acknowledgements
▼
The authors would like to thank Paul Neilson and Will Jones from Prozone Sports for providing access to the data which underpins this study.
References 1 Batterham AM, Hopkins WG. Making meaningful inferences about magnitudes. Int J Sports Physiol Perform 2006; 1: 50–57 2 Bilge M. Game analysis of Olympic, World and European Championships in Men’s Handball. J Hum Kinet 2012; 35: 109–118 3 Bradley PS, Carling C, Gomez Diaz A, Hood P, Barnes C, Ade J, Boddy M, Krustrup P, Mohr M. Match performance and physical capacity of players in the top three competitive standards of English professional soccer. Hum Mov Sci 2013; 32: 808–821 4 Bradley PS, Mohr M, Bendiksen M, Randers MB, Flindt M, Barnes C, Hood P, Gomez A, Andersen JL, Di Mascio M, Bangsbo J, Krustrup P. Sub-maximal and maximal Yo-Yo intermittent endurance test level 2: heart rate response, reproducibility and application to elite soccer. Eur J Appl Physiol 2011; 111: 969–978 5 Bradley PS, Sheldon W, Wooster B, Olsen P, Boanas P, Krustrup P. High-intensity running in English FA Premier League soccer matches. J Sports Sci 2009; 27: 159–168 6 Carmichael F, Thomas D, Ward R. Production and efficiency in association football. J Sport Econ 2001; 2: 228–243
■ Proof copy for correction only. All forms of publication, duplication or distribution prohibited under copyright law. ■ Barnes C et al. Evolution and Match Performance… Int J Sports Med 2014; 35: 1–6
6 Training & Testing 7 Dellal A, Chamari K, Wong DP, Ahmaidi S, Keller D, Barros R, Bisciotti GN, Carling C. Comparison of physical and technical performance in European soccer match-play: FA Premier League and La Liga. Eur J Sport Sci 2011; 11: 51–59 8 Di Salvo V, Collins A, McNeill B, Cardinale M. Validation of Prozone: A new video-based performance analysis system. Int J Perf Anal Sport 2006; 6: 108–119 9 Di Salvo V, Gregson W, Atkinson G, Tordoff P, Drust B. Analysis of high intensity activity in Premier League soccer. Int J Sports Med 2009; 30: 205–212 10 Ekstrand J, Hägglund M, Waldén M. Injury incidence and injury patterns in professional football: the UEFA injury study. Brit J Sport Med 2011; 45: 553–558 11 Gregson W, Drust B, Atkinson G, Di Salvo V. Match-to-match variability of high-speed activities in premier league soccer. Int J Sports Med 2010; 31: 237–242 12 Harriss DJ, Atkinson G. Ethical standards in sport and exercise science research: 2014 update. Int J Sports Med 2013; 34: 1025–1028 13 Junge A, Dvorak J. Injury surveillance in the World Football Tournaments 1998–2012. Br J Sports Med 2013; 47: 782–788
IJSM/4024/15.5.2014/MPS
IJSM/4024/15.5.2014/MPS
14 Mohr M, Krustrup P, Andersson H, Kerkendal D, Bangsbo J. Match activities of elite women soccer players at different performance levels. J Strength Cond Res 2008; 22: 341–349 15 Norton KI, Craig NP, Olds TS. The Evolution of Australian Football. J Sci Med Sport 1999; 2: 389–404 16 Rampinini E, Coutts AJ, Castagna C, Sassi R, Impellizzeri FM. Variation in Top Level Soccer Match Performance. Int J Sports Med 2007; 28: 1018–1024 17 Varley MC, Aughey RJ. Acceleration Profiles in Elite Australian Soccer. Int J Sports Med 2013; 34: 34–39 18 Wallace JL, Norton KI. Evolution of World Cup soccer final games 1966– 2010: Game structure, speed and play patterns. J Sci Med Sport 2013, Epub ahead of print doi:10.1016/j.jsams.2013.03.016 19 Wickham H, Chang W. Devtools: Tools to make developing R code easier. R package, version 1.3 (2013). In Internet http://CRAN.R-project. org/package = devtools Accessed October 2013 20 Williams AM, Lee D, Reilly T. A quantitative analysis of matches played in the 1991–92 and 1997–98 Seasons. London: The Football Association, 1999
■ Proof copy for correction only. All forms of publication, duplication or distribution prohibited under copyright law. ■ Barnes C et al. The Evolution and Match Performance … Int J Sports Med 2014; 35: 1–6