Image Geo–Mashups: The Example of an Augmented Reality Weather Camera Jana Gliet
Antonio Krüger
Institute for Geoinformatics University of Münster Robert-Koch-Str. 26-28 48149 Münster, Germany
Institute for Geoinformatics University of Münster Robert-Koch-Str. 26-28 48149 Münster, Germany
[email protected]
[email protected]
Otto Klemm
Johannes Schöning
Institute for Landscape Ecology University of Münster Robert-Koch-Str. 26-28 48149 Münster, Germany
Institute for Geoinformatics University of Münster Robert-Koch-Str. 26-28 48149 Münster, Germany
[email protected]
[email protected]
ABSTRACT This paper presents the general idea of image geo-mashups, which combines concepts from web mashups and augmented reality by adding geo–referenced data to a perspective image. The paper shows how to design and implement an augmented reality weather cam, that combines data from a steerable weather cam with additional sensor information retrieved from the web.
Categories and Subject Descriptors H.1.2 [User Machine Systems]: Miscellaneous
Keywords Augmented Reality, Geo–Mashups, Image Composition Processes
1.
INTRODUCTION
Until recently the world wide web was made up of pieces of information without explicit reference to locations or the spatial context. Implicit information, e.g. indicated by the language, the IP-address of the server hosting that information and coordinates on the web page, has been present since the beginnings of the web. This information was intended to be used by humans and therefore rather difficult to parse. In the last years, the potential of the geo–referenced web has become apparent. Services such as yellow pages (http:// www.yellowpages.com/) use geo–referenced content to provide users with information on shop locations. Directions on the web are more and more given in standardized ways, usually by providing a link to one of the numerous web mapping
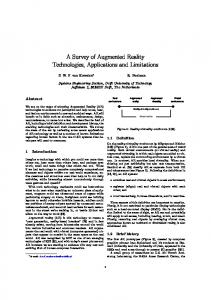
Figure 1: Differences of mapping geo-mashups and image geo-mashups. While mapping mashups just require a weak reference to location (i.e. 2-3 degrees of freedom), image mashups require a strong reference to location and position (i.e. 6 degrees of freedom and more).
services, e.g. with Google Earth (http://earth.google. com), Google Maps (http://maps.google.com), Microsoft’s Live Search Maps (http://maps.live.com) or Yahoo Maps (http://maps.yahoo.com) the potential of connecting content on the web through locations has become obvious [4]. Through simple API, mapping mashups can easily be created by integrating individual features, routes and other content (such as images) into an existing digital map. Such 2D Mapping mashups can be considered the first step of geomashups, i.e. mashups that use geo–referenced information that is available on the web. Google Earth already provides a sophisticated platform for 2.5-3D mapping geo-mashup, This is exemplified on the right hand side of figure 1. It is notable that mapping geo-mashups just require a weak reference to location of the involved media. By weak reference we mean 2 or 3 degrees of freedom (Dof), i.e. latitude, longitude and height. This paper will explore the next level
of geo-mashups: image geo-mashups. These geo-mashups do not use maps as underlying reference graphics, but arbitrary images of locations and places. In order to integrate georeferenced material from the web it is necessary to georeference each pixel in the image. This requires obtaining information on at least 6 degrees of freedom of the camera while taking the picture, i.e. longitude, latitude, height, pitch, roll and yaw. Furthermore information on the optical camera parameters is needed to account for the lens distortion. With such information web content can be integrated directly into the image, and the result is very similar to an Augmented Reality (AR) [1] application, where virtual content is combined with an image of the real world. The middle column of figure 1 shows an example of an augmented reality weather cam that we will use throughout the paper to illustrate our ideas. Here an image of a location is overlaid with additional geo–referenced information on the weather conditions, such as rain radar data and temperature distributions. In this example rain radar data is integrated into the sky directly, providing users a good overview on the actual rain probability. Additional information on the actual weather at the location and the direction of the camera are integrated in an iconic style as well. Geo-mashups rely on static and on dynamic web content. Most of the mapping geo-mashups for example combine static content, such as background cartographic material, a street network layer, and selected locations. A few start to integrate dynamic content as well, such as online traffic data or weather information. The Image geo-mashups we would like to address in this paper mostly use dynamic content, i.e. video live streams and online weather data. Of particular interest to us are image geo- mashups that are able to compose aspects of the mashup automatically. Our web cam geo-mashup example relies on an image that is retrieved from a steerable camera. The mashup service itself decides automatically on the heading of the camera dependent on weather data to ensure that the camera is always pointing into the weather direction. Dynamic time and space scales which are integrated into the image, allow users to estimate how far away a rain front is located. From a practical perspective image geo-mashups will develop their full potential, when based on standardized web services. As demonstrated in this paper this allows the implementation of a complex web service that augments an arbitrary web cam image with geo- (and image-) referenced weather data, if the optical and positional parameters of the camera are provided. We will explain in this paper the main concepts of image geomashups and then show in detail how to design and fully implemented a weather cam geo-mashup. In the next section we will discuss relevant pieces of literature and explain how our work differs from related areas such as AR. Section three is dedicated to the general concept of image geo-mashups. In section four and five we will introduce an example of an image geo-mashup service: the augmented reality weather cam. We will conclude in section six and discuss open issues and future work.
2.
RELATED WORK
Our work is clearly related to the field of Mixed Reality [14] and since a real environment is augmented more specifically to Augmented Reality (AR). In this context the subfield
of mobile AR is of particular importance. One of the most prominent and earliest projects of this research field has been the Touring Machine from Feiner [7]. This system delivered mobile augmented reality information related to landmarks on Columbia University Campus. For this purpose digital information was overlaid in real time by see-trough glasses worn by the user. A couple of further mobile AR systems have emerged since then, providing indoor guidances [8], xray vision [2, 22] or tourist information [13]. Also related to our work is the concept of see-trough tools, introduced by Bier et al [3]. A special case of see-trough tools are magic-lenses that provide a convenient way to superimpose and interact with dynamic digital information on an underlying static information layer. Several research groups have looked at magic-lenses in the context of cartography as well. Our own work Wikeye [9, 21], follows a similar principle, but is a true see-trough magic lens approach since it uses a typical mobile phone, a Nokia N95, to be operated above a physical map. The system tracks the 3D position [17] of the camera-display unit over the map and therefore allows to augment the video stream with additional information. This enables users to personalize the content of the static map through their camera display unit, for example, by adding personalized route instructions to the map. With our work on a Virtual Globe 2.0 in [20] we focus how content for such AR applications can be automatically derived from the web. The most related approach to our work, at least from the technical setup, is Mower’s work on Augmented Scene Delivery Systems [15]. He describes a system that augments the image from a steerable camera with labels describing the features in sight. To be able to position the labels correctly in the image a digital elevation model of the environment is used, together with a database of interesting landmarks that should be labeled. Mower worked on a couple of relevant problems related to the visibility of far away objects and their appropriate labeling. However, in this work he focuses on discrete data (e.g. symbols and labels) and not on continuous data (e.g. rain or temperature data). This makes the task of superimposing data over an image much easier, i.e. since occlusion of real world objects is playing a subdominant role. A number of researchers have investigated the use of virtual environments with GIS data like with the ARVino [11] system or the Augurscope [19]. A good overview of the usage of AR for geographic visualization is provide by [10]. Schall et al. [18] have developed a handheld AR setup combining multiple sensors built around an Ultra-Mobile PC to visualise subsurface infrastructure in 3D extracted from geodata sources. Another example of related work is the work of Brenner et al, who present a see-through device for geographic information [5]. Their focus lies on achieving sub-centimeter accuracy and is not inspired by the idea of geo-mashups. The Timescope (http://www.timescope.de) is a commercial application that combine binocular optics and a live webcam. The viewer can enjoy a 120◦ panorama view of the city. By hitting a special button she can experience a journey
through different historic photos of that area. In this application the focus lies on the content which is presented to the user with 2 degrees of freedom. Related in a broader scope is the work from Naaman et al. [16], who retrieve additional context information from web sources related to digital photos based on a location and time stamp. The concept of image geo-mashups that we present in this paper relies on the principle of normal web mashups, geo– referenced data and concepts from AR. The main idea of web mashups is to combine the result of existing web services based on standard web protocols, such as HTTP. The result is a new web page that takes advantage of the synergy of the different data sources [12]. It is important to note that mashups rely on standards. Only standards allow easy reconfiguration of content and the adaptation into a new context. Therefore with the raise of the Web 2.0 framework mashups have recently become very popular. In the next section we will explain how to extend the notion of web mashups to image geo-mashups.
3.
CREATING IMAGE GEO–MASHUPS
In this section we will discuss our understanding of the image geo-mashup process as briefly introduced in section 1. Figure 2 gives an overview on the main components of an image geo-mashup process. We distinguish three different layers involved to obtain an image geo-mashup. The first level is responsible for the acquisition of the various pieces of data and is therefore referred to as the Sensor Level. Sensors can be of various kinds. For a weather meshup for example this could include physical sensors, e.g. temperature, air pressure and humidity sensors as well as virtual sensors that provide information about a state in the future, e.g. a weather forecast. Sensors can be more ore less complex. A temperature sensor for example can be considered rather simple, while a weather forecast sensor could be very sophisticated if it makes use of a complex weather model. For our approach it is just important that the sensor level provides the data within a reference-frame which allows to geo-reference every data item and therefore to combine various data sources. Although an image geo-mashup always relies on an underlying image, it is not necessary that one of the sensors is a camera providing a stream of real-time data. It is also possible to construct image geo-mashups with historic data or a canonical background image or even with a non photo-realistic representation of a landscape, provided that some sort of geo-referencing is possible. The second level contains the Web Services that encapsulate the sensor data in a standardized way. These web services are both responsible to retrieve data from the sensors as well as to configure the sensors in the most appropriate way. This could include for example services that poll temperature sensors in constant times periods or a service that directs a steerable camera into a desired direction to obtain an image of a specific scene. It is important to highlight the importance of standards at this intermediate level. As pointed out in the introduction general mashups require standards and this is of course also true for geo-mashups. In the next section we will discuss in more detail which standards are suitable for geo-mashups. As with the sensor level also the web service level can consist of services with varying com-
Figure 2: A schematic view on the image geomashup process. Three levels can be identified: the sensor level, the web service level and the application level.
plexity. A service could be a simple wrapper, which ensures that the syntax of a particular standard is met or a complex service that integrates different types of sensor data in a georeferenced manner. If web services provide geo–referenced data we refer to them as geo-services. The third level is the Application level, where the final image composition takes place. Depending on the application in mind different web services are parameterized and triggered. The background image, which itself can be obtained by a web service or retrieved from a database, is blended with the results from the involved geo-services. We suggest that on the application level each result of a geo-service is transformed into image coordinates and stored in respective geo-layers. This makes it easier to combine thematic data, as provided for example by a weather radar, with the underlying image. On the application level the designer of an image-geo-mashup is confronted with the following problems: (a) the service selection problem, (b) the layout problem, (c) the registration problem. Problem (a) is highly task dependent, but still complex, i.e. if the mashup application needs to decide on the fly how to compose appropriate geoservices. Problem (b) is related to the challenge to decide where to place data from the geo-layers on the background image and, maybe even more important, where to keep the parts of the background image unaltered. As we will discuss in the next section, our example of an augmented reality weather camera places most information in the sky region of the image, i.e. to keep most of the landmarks as visible as possible. However, to find (semi-automated) ways to solve problem (b) is far from being trivial. The registration Problem (c) is the classical problem of AR, i.e. how to register the virtual information with the data of an image of the real
Figure 3: Communication structure generating an augmented weather image geo-mashup.
Figure 4: Determination of the theoretic horizon line.
world. The registration problem is often not as forward as it might appear. Even if the camera parameters (such as position and focal length) are known, additional information on the camera environment needs to be modelled with enough accuracy. If certain information cannot be extracted from the environment it is often necessary to work with simplified assumptions, for example values for the maximum visibility or the height of the clouds in an image. In the following section we will describe a particular weather image geo-mashup that we have designed and implemented to test the concepts related to image geo-mashups.
and allow an easy reconfiguration, we have decided to use standardized web services. As the data to be collected is geographical data, the web services used are based on standards defined by the Open Geospatial Consortium (OGC). The OGC is an international consortium of industry, academic and government organizations developing specification and standards to support the electronic interchange of geospatial data. A more detailed description of the web services used by our framework is given in section 4.4.
4.
THE AUGMENTED REALITY WEATHER CAMERA
The Augmented Reality Weather Cam (AR weather cam) is a software framework to create a mashup of a webcam image and additional spatial and textual data such as geo-data (e.g. data retrieved from a rain radar). The main idea of the AR weather cam is to combine a real-world image with sensor data which is visualized in the sky part of the camera image. Depending on the actual weather condition, this sensor data could stem from a weather radar, indicating areas of high rain probability or areas of temperature change. By geomashing this information into the sky of the weather camera, users can easily make a straight forward spatial reference between the geo-data and the environment. Since the AR weather cam can be automatically steered into the weather direction, (i.e. the direction where the weather comes from), users can be helped to judge how far away certain weather events from the actual stand point of the camera are. This image geo-mashup can be interpreted as a local short term weather forecast, which can help users for example to make a decision when to leave their offices without getting caught in a rain shower.
4.1
System Component and Architecture
The system consists of three major parts forming a framework to mash up a camera image as a geo- mashup (see figure 3). One part of the framework deals with the communication and data retrieval from external web services. In order to support the exchangeability of the used web services
Another part of the framework deals with the connection between real and virtual camera which is essential to generate correct overlays. In order to combine real and virtual images, the virtual camera has to adopt the intrinsic and extrinsic parameters of the real camera. To calculate these camera parameters there are several approaches, one of them is described by Tsai [24]. One essential parameter (tilt of the camera or the pitch angle) may be difficult to specify. Our idea is to calculate the pitch angle with the knowledge of the theoretic position of the horizon line in the camera image. However, in some situations it may be difficult to calibrate a webcam (as described in [24]) to get the extrinsic orientation parameters roll, pitch and, jaw when the camera is difficult to reach due to the fact that it has been mounted on a pole or a roof. In this case an approximate calculation of the pitch angle (tilt of the camera) is possible when the intrinsic parameters and the y-coordinate of the theoretic horizon line in the camera image are known. The y-coordinate of the theoretic horizon’s line is received from the camera image by taking the y-coordinate of the intersection point from the horizon line and the vertical center line as shown in figure 4. If the tilt of the camera is 0, the value of the y-coordinate is exactly half of the image height. Then, to adapt the geo-data to the perspective image a 3D model of the environment is necessary. The construction of this 3D-model forms another part of the framework. The coordinate system in 3D space relies on the spatial reference system of the spatial data. If several spatial reference systems are used, the coordinates have to be transformed into one main reference system.
4.2
Geo-referenced AR Image Composing
According to the proposed general model for image geomashups presented in figure 2, the visualization process is based on a layered structure where each layer represents certain sensor data retrieved from external web services. The camera image forms the basis of the resulting overly image and is therefore placed at the bottom of the layer stack. The other layers contain edited sensor data (e.g. weather radar data, temperature) or additional information (e.g. direction of view). Sensor data consisting of 2D geo–referenced data is visualized by the means of a 3D sky model. We have experimented with three different types of sky model that differ mainly by their degree of realism. For all models we have used a simple plane in the form of a rectangle specific at a certain height above the scene. In the first approach the sky plane and the data to be displayed have the same spatial extension so that no additional distortions occur. The extent of the sky plane corresponds to the theoretic visibility (range of sight) which depends on the supposed height (static) of the sky and the height over ground of the real camera. Since the data is geo–referenced it can be easily added to the camera image. If the real value for the height of the clouds and the visibility are known, this approach can be extended by dynamically adapting the sky model to these real values at runtime. This leads to a virtual model which corresponds to the real (world) conditions represented by the camera image. However the required values for height of clouds and visibility are often difficult to obtain directly in real time and thus require a quite complex weather model, in order to provide a correct estimation. As in the first approach, the spatial extent of the 3D sky model matches the extent of the displayed data. In the third approach - as described in the first approach - the sky plane is modeled with a fixed extent and at a fixed height, but the spatial extent of the displayed data is larger than the extent of the 3D sky plane. This leads to an extended view, where more data is displayed on a fixed area, but the real camera image and visualization do not (longer) correspond, because of additional distortions of the areal data. In order to be able to interpret the displayed 3D data correctly it is necessary to have a scale showing spatial and / or temporal distances. If the scale is modeled as a 3D element, it has to rely on the same 3D model as the displayed data to obtain the same perspective distortions. Besides the camera image layer, the data layer containing the 3D view of the 2D geo-data and the scale layer, other layers could be created containing elements to augment the underlying image. These elements can consist of textual data containing additional information to the used sensor data (e.g. date / time of retrieval, direction of view) or graphical elements such as compass rose for better spatial orientation. To generate the resulting overlay image, the layer stack is evaluated in a bottom up order by combining just two layers at one time. This implies that the combination process starts with layer 1 and 2 and goes on combining the result of this combination with the following layer 3. This combination process is continued until the layer on top of the layer stack has been reached. The combination of two layers is based on a composite operation taking into account both source and alpha values of the images and combining them
with the following function: a · A + (1 − a) · (b · B)
(1)
where A, B refer to the source colors and a, b to the alpha values of the images to be combined. Calculating alpha values for each layer is one of the essential parts during the visualization task. This concept makes use of a transparency mask and has the advantage of being very flexible, because every transparency mask is individually created for each layer. With a transparency mask, particular regions could be defined where geo-data should be displayed with a particular alpha value or where no data should overlay the underlying image. For the AR weather cam geo-data should mainly be displayed in the sky part of the camera image and the corresponding transparency mask has therefore to differ between sky and no-sky regions. Ideally, this mask should be created dynamically by analyzing the current camera image, especially if there are a lot of possible camera positions. If there are only a limited number of camera positions, static transparency masks should be preferred which can be created during a pre-processing step. The advantage of using static masks instead of dynamically generated ones is the independency from weather and light conditions, which can easily complicate the process of automatic sky detection.
4.3
Implementation
The camera we use is a webcam combined with a user controllable pan-tilt device purchased by Mobotix AG (http: //www.mobotix.com). The camera is currently mounted on the roof of an 8-story building at the University of M¨ unster. Communication between the camera, external web services and the framework are based on the HTTP protocol. The framework was developed as an application and written in Java. To generate and handle the 3D scene models of the cameras environment, the Java3D library was used. As pointed out in the previous section, in order to visualize 2D data in a 3D environment, it is necessary to construct a 3D model based on the given data and some additional assumptions. Our approach to visualize geo–referenced 2D data (here mainly weather radar data, see next section for a detailed description) is based on the construction of a 3D sky model, where the weather radar data is mapped on. For this purpose a sky plane is constructed according to the spatial extent of the areal data and with the height of 3000 m as an average height of clouds. The dimension of the requested data is chosen according to the theoretic visibility of approximately 50 km.
4.4
Sensors and Actuators
As the framework should be able to integrate different sensor data from the internet, it is reasonable to use standardized interfaces to support the exchangeability of sensor data. This implies, that the collection of sensor data e.g. weather data such as wind direction or temperature is separated from the offering of sensor data over the internet. Therefore web services specified by the Open Geospatial Consortium (OGC) are used to support interoperability between the framework and external web services. Furthermore using web services relying on standardized interfaces facilitates the exchangeability of the services and which leads to a smoother integration of additional data into the framework. The communication structure between the sensors and actuators, the web services and the framework are shown in
Figure 5: Creation of the transparency masks for geo-data representing precipitation around the area of the camera position.
figure 3. As a Web Coverage Service (WCS) provides access to geospatial data as coverage (raster) data with its original semantics [6], in our case it is used to fetch weather radar data offered in an ASCII grid format. The radar data is divided into 6 classes showing the quantity of precipitation per hour. The spatial resolution of the data is 2 x 2 km and the data is actualized every 15 minutes. In order to get access to observation-respectively measurement outcomes like weather phenomenon data (e.g. temperature, wind direction, wind speed) the Sensor Observation Service (SOS) is used which acts like a wrapper hiding different communication protocols and data formats behind its standardized interface [23]. Sensor data is encoded on request as XML according to the Observation & Measurements specification being a part of the Geography Markup Language (GML). The sensor data we are using is updated every 10 minutes. The pan-tilt device of the camera as actuator is steered by the Sensor Planning Service (SPS) which provides a standardized interface to manage different stages of observation procedures, i.e. planning, scheduling, tasking, collection, archiving and distribution [23]. Although the pan device provides continuous access to camera positions between the 0◦ and 355◦ , we have decided to limit the AR weather cam to 16 pre-calibrated positions. The spacing between these positions is 22.5◦ and every position could be accessed exactly as they are stored in the pan-tilt device.
4.5
Example
The first step of the image geo-mashup process consists of retrieving a value for the wind direction from a SOS which is used to pan the real camera with a SPS. In order to make a contemporary weather forecast, the camera image should show the (short term) future weather by pointing to the wind direction. After the real camera has been rotated successfully, the new orientation parameter (roll, pitch and yaw angle) are stored in the virtual camera object.
Figure 6: The composition of different image layers into the resulting image geo-mashup.
In the next step, image layers with their corresponding transparency masks are created and combined with each other in a bottom up order. The bottom layer 1 consists of the current camera image and an opaque transparency mask. Creating layer 2 starts with retrieving weather radar data as raster data from a WCS. This geo-data has a weak georeference, since it provides for each data item the position in longitude and latitude. This weak referenced data is integrated under the assumption of an average height (as explained in section 4.2) in the strong referenced (6 degrees of freedom) image data. At this point a 2D image is created which is used as a texture and mapped onto the sky plane in the 3D sky model. The sky model is created according to the first approach mentioned in section 4.2 and a snap shot is taken from the 3D scene in consideration of the real world camera parameter (position and orientation). The corresponding transparency mask of this layer is generated by three separate masks containing a static mask for the given camera orientation defining the alpha values for sky and no-sky regions, a smooth-mask with graded alpha values to account for the reduced visibility in the distance (i.e. close to the line of horizon) and a dynamically generated mask from the scene snap-shot separating background
and data regions in the image. The separate transparency masks which are combined and the resulting mask are shown in figure 5. The third layer contains a spatial and temporal scale constructed as a 3D model corresponding to the sky model. The spatial scale shows distances of the rain clouds to the camera position being measured as distances on the sky plane. The temporal scale calculated from the distances and the wind direction provides an approximately forecast when the rain may reach the camera position. Before calculating the values of the temporal scale a value for the wind speed has to be retrieved from a Sensor Observation Service. Making a scene snap shot and creating the corresponding transparency masks is done as described above The fourth layer displays discrete data with weak geo-reference (longitude/latitude or orientation) e.g. current temperature or wind speed data associated with the geographic position of the camera to help users to make an easy interpretation of the image geo-mashup. For this purpose the discrete data values are not only presented as textual data but are enhanced by dynamic graphical representations in order to provide more efficient analyses. These symbolic representations should be placed on the underlying image where they do not mask other important information or overlap with other graphical representations. Therefore regions have to be defined either statically or dynamically according to the underlying image where to place these additional elements. Possible positions could be at the image’s border area, e.g. the left or right hand side. For our purpose of displaying temperature data as a (dynamic) thermometer we have chosen a static position on the right hand side in the sky part of image. For the element that indicates the heading of the camera we have decided to place it the lower center part of the image. This position for headings can often be founding in advanced binoculars with an integrated compass. Figure 6 shows all different image layers and their combination according to the corresponding transparency masks in the final image geo-mashup result.
5.
DISCUSSION AND FUTURE WORK
It is obvious that the interpretation of the resulting image depends on the additional data overlaying the camera image. In our case the resulting image provides a local rain probability forecast (for the camera’s position) based on the weather radar data displayed in the sky part of the image and the camera’s orientation pointing to the weather direction (where the rain is coming from). To be able to assess the weather situation (and to answer the question: “Will it rain in 30 minutes?”) spatial and temporal hints displayed as a scale bars are given to the user. The quality of this local and short term weather forecast depends of course on the geospatial and temporal resolution (refresh period) of used sensor data. The quality and update rates we are currently using for the AR weather cam provide satisfying results. A video of our prototypical service can be accessed at: http://ifgi.uni-muenster.de/~j_scho09/ARCam.mov. So far, we have received very encouraging feedback, but of course we have not made any formal evaluation and it is well known that information on the weather is always very popular. While designing the image geo-mashup service, simplified assumptions have been made. One assumption concerns the
estimated height of the rain clouds and another the estimated distance to the theoretic horizon which are both used to construct a 3D sky model to display the radar data. Besides these assumptions we have assumed that the wind direction and wind speed at the ground correspond to the direction and speed of the rain clouds in order to simplify the calculations. We know that this can lead to wrong camera headings, if lower winds differ from winds in higher regions. A possibility that we are currently exploring is to analyze the optical flow over a longer temporal sequences of weather radar data, which should highly correlate with the direction and speed of clouds. Another interesting question regards the evaluation of the spatial properties of the image geo-mashup, i.e. to control how precise (in terms of spatial resolution) the weather data has been integrated into the image. The correctness of the overlay image can be determined by visually identifying corresponding points in the 3D and 2D view and comparing the displayed distances (3D scale view) to the measured distance (2D view). Under assumption that the reference of the geo-data is correct, we could confirm in such a way that the visualisation of the radar data in 3D space is correct. We are currently working on several additional details that we plan to integrate into the AR weather cam framework. Instead of using a plane for the sky model, we will test a dome-based (i.e. a half sphere) sky model, which might produce visually more pleasant results. We are also looking for more accurate geo- services (i.e. with higher geospatial and temporal resolution) that help us to improve the quality of the visualisation. It would also possible to integrate data from additional geo-services (e.g. wind speed, humidity and barometric pressure), which could be helpful in other usage scenarios of the AR weather cam. Another line of research regards the automatic detection of the horizon line. This could be achieved by analyzing longer temporal sequences of camera images and looking for the border between the rapidly changing sky and the rather stable ground. Additional geographic information, such as 3D representation of prominent landmarks and corresponding labels would further enhance the user’s spatial orientation. Until now the camera is completely under control of the system. A straight forward extension would be to allow users to control the movement of the camera and to decide freely on the perspective of the weather cam. The handling would then be close to [15] and [5] combined with the advantage of our proposed short term weather forecast. An important aspect that we have not covered in our work is that of interoperability of geo-services. Currently we assume that the designer of the application decides which services to combine and how to do this. Depending on the degree standardization this can still be a very tedious task. It would be interesting to explore different ways to achieve an automatic goal-driven service composition. To further underline the mashup character of our approach we are currently implementing a web service that will allow owners of arbitrary web cams, to have their images augmented with weather data around the sites of their cameras. By just indicating the position an orientation of the cam, plus providing an image mask with information on sky and no-sky regions, web cam owners will be able to easily create their own image geo-mashup. In addition to that we think of augmenting Google’s street view images with this real time weather data to adapt the im-
age to the current weather situation. We are also exploring the possibilities to use the sky-part of an image to visualize other data than weather data. For example, one could think of visualizing geo–referenced traffic information, smog concentration or network coverage by using the low information areas of outdoor images: the sky.
6.
CONCLUSIONS
In this paper we have presented the general concept of geoimage meshups, which combine geo- referenced data obtained through standardized web service with concepts from Augmented Reality to enhance a perspective image with additional geo information. By explaining in detail our AR weather cam system we have underlined our idea to use multiple layers for each type of geo-information. We have proposed to divide the process of image geo-mashups into three sub-steps; service selection, layouting and registration and have given instances of solutions to these sub-steps in the context of the AR weather cam system. As the standardization of geo-services continues, we believe that producing complex and intelligent image geo-mashups will be much easier than today. Given the falling prices of camera equipment and the expected distribution of camera hardware in the near future, we are convinced that image geo- mashups will be a powerful means to integrate various spatial and temporal data sources into one single image.
7.
ACKNOWLEDGMENTS
This work has been partially supported by a grant of the Department of Geosciences at the University of M¨ unster.
8.
REFERENCES
[1] R. Azuma. A Survey of Augmented Reality. Presence: Teleoperators and Virtual Environments(1054-7460), 6(4):355–385, 1997. [2] R. Bane and T. H¨ ollerer. Interactive Tools for Virtual X-Ray Vision in Mobile Augmented Reality. In Proc. of ISMAR ’04, pages 231–239, 2004. [3] E. Bier, M. Stone, K. Pier, W. Buxton, and T. DeRose. Toolglass and Magic Lenses: The See-through Interface. In Proc. of GRAPHITE ’93, pages 73–80, 1993. [4] D. Butler. The Web-Wide World. Nature, 439(16):776–778, 2006. [5] V. P. C. Brenner and N. Ripperda. The Geoscope – A Mixed – Reality System for Planning and Public Participation. In Proc. of UDMS ’06, 2006. [6] J. Evans. Web Coverage Service (WCS), Version 1.0. 0. Open Geospatial Consortium, Wayland, MA, USA, 2003. [7] S. Feiner, B. MacIntyre, T. H¨ ollerer, and A. Webster. A Touring Machine: Prototyping 3D mobile Augmented Reality Systems for Exploring the Urban Environment. Personal Technologies, 1(4):208–217, 1997. [8] S. Goose, H. Wanning, and G. Schneider. Mobile Reality: A PDA-Based Multimodal Framework Synchronizing a Hybrid Tracking Solution with 3D Graphics and Location-Sensitive Speech Interaction. In Proc. of Ubicomp ’02, 2002. [9] B. Hecht, M. Rohs, J. Sch¨ oning, and A. Kr¨ uger. WikEye–Using Magic Lenses to Explore Georeferenced
Wikipedia Content. In Proc. of PERMID ’07, 2007. [10] N. R. Hedley, M. Billinghurst, L. Postner, R. May, and H. Kato. Explorations in the Use of Augmented Reality for Geographic Visualization. Presence: Teleoper. Virtual Environ., 11(2):119–133, 2002. [11] G. King, W. Piekarski, and B. Thomas. ARVino – Outdoor Augmented Reality Visualisation of Viticulture GIS Data. In Proc. of ISMAR ’05, pages 52–55, 2005. [12] R. Lerner. At the Forge: Creating Mashups. Linux Journal, 2006(147), 2006. [13] R. Malaka and A. Zipf. DEEP MAP-Challenging IT research in the Framework of a Tourist Information System. Information and Communication Technologies in Tourism, 7:15–27, 2000. [14] P. Milgram and F. Kishino. A Taxonomy of Mixed Reality Visual Displays. IEICE Transactions on Information Systems, 77(12):1321–1329, 1994. [15] J. Mower. Implementing an Augmented Scene Delivery System. In Proc. of ICCS Part III, pages 174–183, 2002. [16] M. Naaman, S. Harada, Q. Wang, H. Garcia-Molina, and A. Paepcke. Context data in geo-referenced digital photo collections. In Proc. of Multimedia ’04, pages 196–203, 2004. [17] M. Rohs, J. Sch¨ oning, A. Kr¨ uger, and B. Hecht. Towards Real-Time Markerless Tracking of Magic Lenses on Paper Maps. In Adjunct Proc. of PERVASIVE ’07, 2007. [18] G. Schall, E. Mendez, S. Junghanns, and D. Schmalstieg. Urban 3D Models: What’s underneath? Handheld Augmented Reality for Subsurface Infrastructure Visualization. In Proc. of Ubicomp ’07, 2007. [19] H. Schn¨ adelbach, B. Koleva, M. Flintham, M. Fraser, S. Izadi, P. Chandler, M. Foster, S. Benford, C. Greenhalgh, and T. Rodden. The Augurscope: A Mixed Reality Interface for Outdoors. CHI ’02, pages 9–16, 2002. [20] J. Sch¨ oning, B. Hecht, M. Raubal, A. Kr¨ uger, M. Marsh, and M. Rohs. Improving Interaction with Virtual Globes through Spatial Thinking: Helping users Ask “Why?”. In IUI ’08: In Proc. of the 13th annual ACM conference on Intelligent User Interfaces. ACM, 2008. [21] J. Sch¨ oning, A. Kr¨ uger, and H. M¨ uller. Interaction of Mobile Camera Devices with Physical Maps. In Adjunct Proc. of Pervasive ’06, 2006. [22] I. Siio, T. Masui, and K. Fukuchi. Real-world Interaction using the FieldMouse. In Proc. of UIST ’99, pages 113–119, 1999. [23] I. Simonis. Sensor Webs: A Roadmap. In Proc. of the 1st Goettinger GI and Remote Sensing Days, Goettingen, Germany, 2004. [24] R. Tsai. A Versatile Camera Calibration Technique for High-Accuracy 3D Machine Vision Metrology Using Off-the-Shelf TV Cameras and Lenses. Radiometry, 1992.