Telephone Laboratories under an Air Force study contract for the Minuteman ...... Architecture (IAPSA 11) project to analyze surface control failures. (See ref. 1.).
-
L
NASA Technical Memorandum 89098
The Fault-Tree Compiler B87-20765
G3/61
Anna L. Martensen Ricky W. Butler
JANUARY 1901
r' c
National Aeronautics and Space Administration Langley ResearchCenter
Hampton,Virginia 23665-5225
Unclas US405
........................................................ ........................................... THE FTC USER INTERFACE .............................................. Basic Program Concept ............................................. Fault Tree Eefinition Syntax ...................................... Hierarchical Fault Trees .......................................... F'"C Cormrands ...................................................... FTC Graphics ...................................................... E " L E Fn: SESSIONS ................................................ Outline of a Typical Session ...................................... Examples .......................................................... INTROWCTION Fault Tree Construction
.................................................. ..........................................................
1
2 6 6 6 12 15 18 19 19 19
CONCLUDING REMNtKS
27
REFERENCES
28
.......................................................... ............................................................ ................................................
APPENDIXA Theory Solution Technique
APPENDIX B .ERROR MESSAGES
.........................................
i
A-1 A-1 A-4
B-1
h
Fault tree analysis was first developed in 1961-62 by H.A. Watson of Bell Telephone Laboratories under an A i r Force study contract for the Minuteman Launch Control System. The use of fault trees has since gained wide-spread support and is often used as a failure analysis tool by reliability experts. Though conceptually simple, especially for those with a knowledge of basic circuit logic, the fault tree can be a powerful tool. In its basic form, the fault tree has limitations; however, recent advances in the tree notation have often overcome these shortcomings. Even the basic fault tree, though, can be useful in preliminary design analysis. The goal of the Fault Tree Compiler (m)program is to provide the user with a tool which can readily describe even the largest fault tree and, once given the tree description and event probabilities, can precisely calculate the probability of the top event in the tree. Automatic sensitivity analysis can also be performed, providing the user with a powerful design analysis capability. The motivation for the development of the Fault Tree Compiler began with the observation that the Computer Aided Reliability Estimation (CARE 111) program (ref. 3) was often being used for the analysis of fault trees. Although CARE I11 can be used to solve fault trees, it was designed primarily to analyze complex reconfigurable systems where the fault-handling capabilities must be included in the reliability analysis. Therefore, it was not optimized for systems that can be described by a simple fault tree alone. The CARE I11 fault tree code provided a minimal framework for the FTC mathematical solution technique. A newer, faster solution was developed and implemented in FTC. To that was added a new front-end with a high-level language description of the fault tree. The improved solver and the Fault Tree Compiler's input language and sensitivity analysis capabilities provide a powerful fault tree solver. In short :
.
1) The Fn: program has a simple yet powerful input language, which is easily mastered. 2) Automatic sensitivity analysis is provided. 3)
The mathematical solution technique is exact to the five digits in the solution(s).
hierarchical capability is provided which can reduce effort and run time.
4)
A
5)
FTC is capable of handling common mode events, where the same event may appear m r e than once in the fault tree.
The FTC solution technique has been implemented in FORTRAN, and the remaining code is Pascal. The program is designed to run on the Digital Corporation VAX computer operating under the VMS operating system. short tutorial on the construction of fault trees is provided. The tutorial will outline the basic gate types allowed by the FTC program and their use in describing an example system of interest. A
Fault Tree Construction example fault tree structure is shown in Figure 1. The event of interest, referred to as the top event, appears as the top level in the tree. Only one top event is allowed. Basic events are the lowest level of the fault tree, and different combinations of basic events will result in the top event. In Figure 1, the basic events are indicated by small circles. The user associates a probability of occurrence with each basic event in the tree. Note that a basic event may appear more than once in the Fn= fault tree and is referred to as a connnon mode event. A useful feature of the FTC program is its ability to handle these common mode events. An
Events are combinations of basic events or other (lower) events. In Figure 1 the output of the OR gate is an event. Typical fault tree notation allows "conunentflboxes to appear in the tree to describe an event. Though only two comment boxes appears in the example (to describe the hydraulic failure and the top event), boxes could have appeared above any event, basic or non-basic. Logic gates delineate the causal relations which ultimately result in the top event. In the FTC program the following gates are allowed:
2
4
+
GUNS INOP
FA1LUR E
Figure 1
3
Gate Symbol
a n
Q n A
Gate Name
AND
Result of Gate The output occurs when all input events occur simultaneously. An arbitrary number of input events are allowed.
gate
The output occurs when one or more of the input events occur. An arbitrary number of input events are allowed..
OR gate
MCLUSIVEOR gate
M of N gate
INVERT gate
The output occurs when one but not both of the input events occur. Only two input events are allowed. The output occurs when m of the n inputs occur. The number of inputs must be greater than or equal to m. This gate performs a complement (applying DeMorgan's Law) on the input. The number of inputs must equal one.
Fault trees are typically constructed by starting with the top event (usually an undesirable situation) and determining all possible ways to reach that event. This approach is often referred to as the "top down" or "backward" approach. An example of a "bottom up" or "forward" approach is the failure modes and effect analysis (FEIEA), where the analyst starts with the different failure modes of the system components and traces the effects of the failures. The following short example illustrates the top down process by which a fault tree is constructed: The McDonnell Douglas F-15C fighter has three primary weapons systems: heat-seeking missiles, radar missiles, and the gun. Occasionally the guns will be inoperable, due possibly to one or more separate events. The fault tree shown in Figure 1 delineates the possible causes of in-flight gun no-fire. The pre-flight ground check includes the removal of several safety pins, including three pins which, once removed, will allow the gun to fire. A "rounds counter" on the plane determines the total number of rounds (bullets) to be fired. It is possible to completely restrict the firing of the gun with the proper rounds counter setting. The landing gear locked in 4
*
the d m position will also prevent the gun from firing. Additionally, loss of electric power to ignite the bullets, or hydraulic power to rotate the barrels will completely inhibit the gun. Loss of hydraulic power may occur if the hydraulic lines are severed, or the hydraulic fluid levels are low. It is not the goal of this paper to teach the construction of fault trees, however this simple example illustrates several important elements of fault tree mode1 ing: All basic events must be independent. and B are independent if
In probability theory, two events
A
P(AB) = P ( A ) P ( B ) .
It is important to note that it is often very difficult to establish independence of events. In this example, it is assumed that the safety pin removal and setting of the rounds counter are independent events, even though both are performed during the pre-flight ground check. Sequences of events cannot be modeled with the gates allowed by the FTC program. For many systems of interest, an event'Z occurs if and only if event A occurs before event B. If event B occurs before A, a different result is seen. At best, the analyst must define a basic event which is the result of some sequence of events and assign a probability to the basic event. Mutually exclusive events must be handled with care. Basic events can not be mutually exclusive. For example, basic event A cannot be def ined as "Power onw and basic event B defined as "Power off However, basic event A may be defined as "Power on", and an INVERT gate (which performs the probabilistic complement of the input) with basic event A as input may define the event "Power not on." .I1
Typically, fault trees are developed to demonstrate the probability of some undesirable top event. A typical top event might be "Catastrophic System Failure." Generally, it is much faster to enumerate the ways that a system will fail than it is to enumerate the ways a system will succeed. Occasionally, however, it is more advantageous to create a %uccess" tree. The Fn: program makes no distinction between the trees; it simply solves for the probability of the top event in a tree.
5) Basic events must be assigned a probability of occurrence. The FTC program also allows for failure rates to be assigned to basic events. The user must then supply a value for the mission time at which the probability of system failure will be evaluated. Parametric analysis is facilitated by allowing one basic event probability or rate to vary over a range of values. The syntax is described in the "EVZ Fault Tree Definition Syntax" section of this paper.
5
For m r e information on fault trees, Reference [2] is recomended. The next section discusses the user interface for the FTC program and example FTC sessions follow. Concluding remarks, Appendix A-The Solution Technique, and Appendix &Error Messages complete the paper.
THE FTC USER INTERFACE
Basic Program Concept The user of the FTC program must define his fault tree using a simple language. This language will be discussed in detail in this section. There are two basic statements in the language - the basic event definition statement and the gate definition statement. The basic event definition statement defines a fundamental event and associates a probability with this event. For example, the statement
x:
0.002;
defines a fundamntal event which occurs with probability 0.002. The gate definition statement defines a gate of the fault tree by specifying the gate type and all inputs. For example, the statement: G1: AND( Q12, Vl23, L12, E5);
defines an and-gate with output G1 and inputs Q12, V123, L12 and E5.
FTC Fault Tree Definition Syntax
The basic event definition statement and the gate definition statement are the only essential ingredients of the FTC input language. However, the flexibility of the FTC program has been increased by adding several features coIllmonly seen in programing languages such as FORTRAN.or Pascal. The details of the FTC language are described in the following subsections.
6
-
Lexical details The probabilities assigned to events are floating point numbers. The Pascal RERL syntax is used for these numbers. Thus, all the following would be accepted by the Fn: program: 0.001 12.34 1.2E-4 131-5
The semicolon is used for statement termination. Therefore, more statement may be entered on a line. Comments may be included any blanks are allowed. The notation "(*" indicates the beginning of " * ) " indicates the termination of a coment. The following is an the use of a conrment: GYRO-F:
0.025;
(*
PROBABILITY OF
A GYRO
than one place that a comnent and example of
FAILURE
*)
If statements are entered from a terminal (as opposed to by the READ conunand described below), then the carriage return is interpreted as a semicolon. Thus, interactive statements do not have to be terminated by an explicit semicolon unless more than one statement is entered on the line. In interactive d e , the fic system will prompt the user for input by a line number followed by a question mark. For example, 13
The number is a count of the current line plus the number of syntactically correct lines entered into the system thus far.
-
Constant definitions The user may equate numbers to identifiers. Thereafter, these constant identifiers may be used instead of the numbers. example, LAMBWi = 0.0052;
RECOVER = 0.005; 7
For
Constants may also be defined in terms of previously defined constants: GAMMA = lO*LAMBDA;
In general, the syntax is "name" = "expression"; where "name" is a string of up to eight letters, digits, and underscores ( -) beginning with a letter, and "expression" is an arbitrary mathematical expression as described in a subsequent section entitled "Expressions". Variable definition - In order to facilitate parametric analyses, a single variable may be defined. A range is given for this variable. The FTC system will compute the system reliability as a function of this variable. If the system is run in graphics mode (to be described later), then a plot of this function will be made. The following statement defines LAMBDA as a variable with range 0.001 to 0.009: LAMBDA
-
0.001 To 0.009;
Only one such variable may be defined. A special constant, POINTS, defines the number of points over this range to be computed. This constant can be defined any time before the RUN command. For example, POINTS * 25 specifies that 25 values over the range of the variable should be computed. The method used to vary the variable over this range can be either geometric or arithmetic and is best explained by example. Thus, suppose POINTS = 4, then Geometric :
xv
=
1 To* 1000;
where the values of XV used would be 1, 10, 100, and 1000.
a
Arithmetic:
xv
= 1 To+ 1000;
where the values of XV used would be 1, 333, 667, and 1000. The * following the TO implies a geometric range. A an arithmetic range.
or simply TO implies
One additional option is available - the BY option. By following the above syntax with BY "i'nc", the value of POINTS is automatically set such that the value is varied by adding or multiplying the specified amount. For example, V
131-6 TO* 1E-2 BY 10;
sets POINTS equal to 5 and the values of V used would be 131-6, 1E-5, 131-4, 1E-3, and 131-2. The statement
sets POINTS equal to 3, and the values of Q used would be 3, 4, and 5. In general, the syntax is "var" = "expression" TO ( " c " ] "expression" ( BY "inc" } where "var" is a string of up to eight letters and digits beginning with a letter, "expression" is an arbitrary mathematical expression as described in the next section and the optional "c" is a + or *. The BY clause is optional; if it is used, then "inc" is any arbitrary expression.
9
Expressions - When defining constants or an event probability, arbitrary functions of the constants and the variable may be used. The following operators may be used:
+ * /
**
addition subtraction multiplication division exponentiation
The following standard functions may be used: exponential function LN(X) natural logarithm SIN(X) sine function COS(X) cosine function ARCSIN(X) arc sine function ARCCOS(X) arc cosine function ARC"(X) arc tangent function SQRT(X) square root W ( X )
Both ( ) and [ ] may be used for grouping in the expressions. are permissible expressions:
The following
2E-4 1 - [ M p (-LAMBRA*TIME) J
Basic Event Definition - The fundamental events of the fault tree (i.e. events which are not the outputs of a gate in the tree) must be assigned probabilities. This is accomplished using the basic-event definition statement. This statement has the following syntax: : ; where is the name of the event and is an expression defining the probability of the event which evaluates to a number between 0 and 1. 10
This can be
Alternately, the user can specify the rate of an event. accomplished using the following syntax:
-> ;
where is the name of the event and is an expression defining the rate of the event. The probability of the event is calculated by the program using the following formula: Prob[ event ]
-
1.0
- EXP( -
*TIME
)
where TIME is the value of the special constant TIME which defines the mission time. If TIME is not defined by the user, then the program uses 10 for the mission time. Note that this formula represents the standard exponential distribution function, -At F(t) = 1 - e
.
-
Gate Definition Once all of the fundamental events are defined, the gate definition statement may be used to define the structure of the fault tree. The syntax of this statement is
:
{f}
(
, ,
... ) ;
(
, ,
... );
AND
or : OF
The is the name of the (non-basic) event which is the output of the gate. The type of gate is indicated by the reserved words OR, AND, INV, XOR or OF as follows
11
OR XOR
- output probability - output probability - output probability
IW
-
m OF
-
AND
is is is both, occurring (i.e. output probability is INVERT gate). output probability is (i.e. M of N gate)
the probability of all events occurring the probability of one or more events occurring the probability of one of the events, but not EXCLUSIVE OR gate) the probabilistic complement of the input (i.e. the probability of m or more events occurring
Any number of input events may be included within the parentheses. following gate definition statements are valid:
The
GI: AND(X, Y, Z); G2: OR(AI., A2, A3); PLANE-CRASH: 2 OF (ENGINE1-FAILS, ENGINE2-FAILS, HYDRAULIC-FAILURE); DESPAIR: OR(GET-THE-FLU, MOTHER-IN-LAW-STAYS-2-WEEKS, MEET-wmGH!ms -NEW-BOYFRIEND);
Hierarchical Fault Trees Often a system consists of several identical independent subsystems. In order to preserve the independence, it is necessary to replicate the subsystem fault tree in the system model. For example, suppose we have a system which contains four identical independent subsystems. The system fails when three of the subsystems fail. Each subsystem consists of four components. If any component fails, the subsystem fails. The following fault tree describes the subsystem: COMP 1: .01;
m - 2 : OMP-3:
W - 4-:
.02;
.03; .05;
SUBSYSTEM-FAILS: OR(COMP-1, COMP-2, COMP-3 , OMP-4); The system fault tree is as follows: SYSTEM-FAILS: 3 OF (SUBSYS 1 FAILS, SUBSYS-2-FAILS, SUBSYS-3-FAILS, SUBSYS-4-FAILS -); 12
Unfortunately, in order to integrate these sections into one fault tree, the subsystem has to be replicated four times (each replicate with different names) : SUBSYS 1 COMP 1: .01; sUBsYs-l-COMP-2 : .02; SUBSYS-1-m-3 : .03 ; SUBSYS-l-~~-4: 05 ; SUBSYS-l-FAIa: OR( SUBSYS 1 COMP 1, SUBSYS 1 COMP 2, -SUBsys-1-m-3 - - - ) ;, - - - , suBsYs-l-~-4
.
SUBSYS 2 COMP 1: .01; sUBsYs-2-cc)MP-2 : .02; SUBSYS-2-COt4P-3 : .03; SUBSYS-2-COM-4 : .05 ; SUBSYS-2-FAILs: OR( SUBSYS 2 COMP 1, SUBSYS 2 COMP 2, -sUBsYs-2-coMP-3 - - - 1 ;1 - - - , sUBsys-2-coMP-4 SUBSYS 3 COMP 1: .01; sUBsys-3-coMl?-2 : .02; SUBSYS-3-COMP-3 : 03 ; SUBSYS-3-CW-4 : .05; SUBSYS-3-FAILs: -OR( SUBSYS 3 COMP 1, SUBSYS 3 COMP 2, - - - ;, - - - , sUBsYs-3-coMP-4 suI3sYs-3-coMP-3
.
C m P 1: .01; SUBSYS-4-am-2 : .02; su~Sys-4-COMP-3 : .03 ; SUBSYS-4-COMP-4 : .05; SUBSYS-4-FAIs: OR( SUBSYS 4 CaMP 1, SUBSYS 4 COMP 2, -- - - ) ;, suBsYs-4-CaMP-3 - - - , SUBsys-4-COMP-4 SUBSYS 4
SYSTEM-FAILS: 3 OF (SUBSYS 1 FAILS, SUBSYS-2-FAILS, SUBSYS-3-FMLS, ; SUBSYS-4-FAILS) --
Obviously, this is a tedious process. Therefore, the FIY: program provides the user with a hierarchical fault-tree capability. The following model is semantically equivalent to the previous fault tree:
SUBTREE SUBSYSTEM-FAILS; c(mp 1: m-2: OMP-3: CDMP-4: -
.01; .02; .03; .05;
TREE SYSTEM-FAILS;
SUBSYS 1 FAILS: SUBSYSTEM FAILS; SUBSYS-2-FAILS : SUBSYSTEM-FAILS ; SUBSYS-3-FAILS : SUBSYSTE3i-FAILS ; SUBSYS-4-FAILS -: SUBSYSTEM-FAILS ; TOP: 3 OF (SUBSYS 1 FAILS, .SUBSYS-2-FAILS, SUBSYS-3-FAILS, SUBSYS-4-FAILS ); --
The model is defined in two sections. The first section defines a subtree which is named SUBSYSTEM-FAILS. This subtree is solved by the program and the probability of its top event is saved in the identifier SUBSYSTEM-FAILS. In subsequent trees or subtrees this identifier can be used. In the above model, four events in the main tree are given the probability of the subsystem, i.e. SUBSYSTEM-FAILS. To simplify the analysis of the effect of a system parameter on the probability of the top event, global variables and constants may be used. These must be defined before any subtrees are defined. The effect of the change in the failure probability of a component in the previous model could be investigated using the following model:
FP
=
.01 'IO .05 BY .01;
SUBTREE SUBSYSTEM-FAILS;
1: FP; m - 2-: .02;
COMP
COMP-3:
.03; COMP-4: .OS;
TOP: OR(CDMP1-,COMP-2,COMP-3,COMP-4 ) ;
TREE SYSTEM-FAILS:
SUBSYS 1 FAILS: SUBSYSTEM FAILS; SUBSYS 2 FAILS: SUBSYSTEM FAILS; SUBSYS-3-FAILS -: SUBSYSTEM-FAILS ; SUBSYS-4-FAILS -: SUBSYSTEM-FAILS ; TOP: 3 OF (SUBSYS 1 FAILS, SUBSYS-2-FAILS, SUBSYS-3-FAILS, SUBSYS-4-FAILS) -;
14
m types of corrrmands have been included in the user interface. The first type of cammand is initiated by a reserved word: PLOT
INPUT
EXIT
RUN
READ
SHOW
The second type of comand is invoked by setting one of the special constants CARE3
ECHO
LIST
POINTS
TIME
equal to one of its predefined values. WIT
-
INpvT
.
-
The EXIT c m d causes termination of the FTC.program. This connnand increases the flexibility of the READ c o d . Within the mudel description file created with a text editor, INPUT c m d s can be inserted that will prompt for values of specified constants while the model file is being processed by the READ command. For example, the comnrand INPUT LVAL;
,
will prompt the user for a number as follows: LVAL?
and a new constant LVAL is created that is equal to the value input by the user. Several constants can be interactively defined using one statement, for example: INPUT pI#r
-
x,
Y,
z;
The PLOT comaand can be used to plot the output on a graphics display device. This c o m d is described in detail in the next section, "Fn:Graphics. "
15
RERD
-
sequence of FTC statements may be read from a disk file. The following interactive comaand reads FTC statements from a disk file named SIFT.MOD:
A
READ SIFT.HOD;
If no file name extent is given, the default extent .MOD is assumed. A user can build a model description file using a text editor and use this command to read it into the FTC program. IUR4
-
After a fault tree has been fully described to the Fn: program, the RUN command is used to initiate the computation: RUN; The output is displayed on the terminal according to the LIST option specified. If the user wants the output written to a disk file instead, the following syntax is used:
where the output file "outname" may be any permissible VAX VMS file name. W o positional parameters are available on the RUN comnand. These parameters enable the user to change the value of the special constants POINTS and LIST in the RUN comand. For example RUN (30,2) 0UTFILE.DAT
is equivalent to the following sequence of comnands: POINTS = 30; LIST = 2; RUN OUTFILE.DAT
16
Each parameter is optional so the following are acceptable: RUN( 10 ;
RUN( t o ) ; RUN( 20,1) ;
-
- change POINTS to 10 then run. - change LIST to 0 and run.
- change POINTS to 20 and LIST to 1 then run.
The value of an identifier may be displayed by the following comnand: SHOW ALPHA;
CARE3
-
Ecm-
LIST
-
If set equal to.1 the program will generate a file containing the fault tree in the CARE 111 syntax. The default value of 0 specifies than no CARE 111 file be written. The name of the generated file is CARE3.TRE. Note that the input range is completely specified, but that the upper value on the output range is specified by "X". The user must edit the file, supplying the appropriate upper value for the output range, and insert the tree into an otherwise complete CARE 111 input file. The ECHO constant can be used to turn off the echo when reading a disk file. The default value of ECHO is 1, which causes the model description to be listed as it is read. (See example 4 in the section entitled "Example Fn= Sessions. '0 The amount of information output by the program is controlled by this cormrand. 'ItJo list modes are available as follows: LIST
-
0; No output is sent to the terminal, but the results can
still be displayed using the PLOT comnand. SIST = 1; Output sent to terminal. This is the default. #II"S
- The POINTS constant specifies the n
h r of points to be calculated Over the range of the variable. The default value is 25. If no variable is defined, then this specification is ignored.
17
TI131p
-
The TIME constant specifies the mission time. The TIME constant has meaning only when the d e l includes failure rates, which depend upon time. For example, if the user sets TIME = 1.3, the program computes the probability of the top event at mission time equal to 1.3. The default value of TIME is 10.
FTC Graphics
Although the Fn: program is easily used without graphics output, many users desire the increased user-friendliness of the tool when assisted by graphics. The FTC program can plot the probability of system failure as a function of any model parameter. The output from several FTC runs can be displayed together in the form of contour plots. Thus, the effect on system reliability of two model parameters can be illustrated on one plot.
PLOT command - After a RUN c o m d , the PLOT command can be used to plot the output on the graphics display. The syntax is PLOT , ,
...
where are plot options. ~ n TEMPLATE y "USET" or llupSET" pararneter can be used, but the following are the most useful:
NOLO
plot x-axis using logarithmic scale plot y-axis using logarithmic scale plot both x- and y-axes using logarithmic scales plotx- and y-axes with normal scaling
XLEN=~.O &EN-8.0 Xm1b+2.0 ~ ~ 1 ~ 2
set x-axis length to 5.0 in. set y-axis length to 8.0 in. set x-origin 2 in. from left side of screen set . 0 y-origin 2 in. above bottom of screen
XLOG
yux; XYLOG
The PUYTINIT and PLOT+ comMnds are used to display multiple runs on one plot. A single run of FM3 generates unreliability as a function of a single variable. To see the effect of a second variable (i.e. display contours of a 18
34imensional surface) the PLOT+ cormand is used. The PUrrINIT commMd should be called before performing the first FTC run. This command defines the second variable (i.e. the contour variable): PUXINIT BETA; This defines BETA as the second independent variable. Next, the user must set BETA to its first value. After the run is complete, the output is plotted using the PLOT+ corrmand. The parameters of this comMnd are identical to the PLOT cormrand. The only difference is that the data is saved, so it can be displayed in conjunction with subsequent run data. Next, BETA must be set to a second value, another FTC run made, and PLOT+ must be called again. This time both outputs will be displayed together. up to ten such runs can be displayed together EXAMPLE FM: SESSIONS
Outline of a Typical Session The FM: program was designed for interactive use. method of use is recanmended:
The following
1.
Using a text editor, create a file of Fn: commands describing the fault tree to be analyzed.
2.
Start the Fn: program and use the READ camnand to retrieve the model information from this file.
3.
Then, various comaands may be used to chancre the values of the special constants, such as LIST, POINTS, etc., as aesired. Altering the-value of a constant identifier does not affect any transitions entered previously even though they were defined using a different value for the constant. The range of the variable may be changed after transitions are entered.
4.
Enter the RUN comaand to initiate the computation.
Examples The following examples illustrate interactive FTC sessions. all user inputs are given in lower-case letters. 19
For clarity,
-le 1 - This session illustrates direct interactive input and the type of error messages given by FTC:
Fn= Vl.0
NASA Langley Research Center
l? lambda = le-4; 21 X: 1.0 - exp( -lambda*time); 37 Y: 1.0 - exp( -lamda*time); IDENTIFIER NOT DEFINED 31 Y: 1.0 - exp( -lambda*time); 4? top: or(x,y); 51 run A
*** WARNING: SYNTAX ERRORS PRESENT BEFORE RUN 0.420 SECS. C W TIME UTILIZED 61 exit
The warning message is simply informative. If a user receives this message, he should check his input file to make sure that the model description is correct. In this example, since the syntax error was corrected in the next line, the model was correct. A complete list of program-generated error messages is given in APPENDIX B.
Exanple 2
- This example demonstrates the use of the hierarchical fault tree
capability to partially describe an aircraft pitch control architecture. The proposed architecture is composed of four independent actuator subsystems and the supporting hydraulic and electronic systems. Each of the actuator subsystems is comprised of a pitch rate sensor, a computer, and the actuator. 'Wo of the four actuator subsystems failing will result in loss of pitch control. Likewise, loss of either the hydraulic or electronic system will cause loss of pitch control.
20
$Fn:
Fn: v l . 0
NASA Langley Research Center
11 read e x 3 . d 2: SUBTREE ACT-SYS-FAIL; 3: 4: PITCH-RATE-SENSOR -> 1.831-05; -> 4.4E-04; 5: 6: ACTUATOR -> 3.73-05; 7: 8: XIP: OR(P1TCH RATE-SENSOR, COMPUTER, ACTUATOR); 9: 10: TREE LOSS-OF-PITCH-CONTROL; 11 : 12: HYDRAULIC FAILURE: 1.3E-06; ( * HYDRAULIC SYSTEY FAILURE RATE * I 13 : ELECTRONICS FAILURE: 5.OE-04; ( * AIRCRAPT ELECTRONICS FAILURE * ) 14: ACT SYSl F f l L S : ACT SYS FAILS: m-SYS2-FAILS: ACf-SYS-FAILS ; ( * THE ACTUATOR SYSTEM IS * ) 15: 16 : ACT'SYS3-FAILS: ACT-SYS-FAILS : ( * c0MPOSED OF WUR INDE- * ) 17 : ACT'SYS4-FAILS: ACT-SYS-FAILS; - ( * PENDENT SUBSYSTEMS. *) 18 : 19 : GRTEl: 2 OF (ACT SYSl FAILS,ACT SYS2 FAILS,ACT SYS3 FAILS,ACT SYS4-FAILS); 20 : OR TGATET,EIYDRMJLTC -F ~ ~ L U R EELEETRO~~TCS , -FAILURE-) ; TOP: 21 : '
~
221 run Pr[ACT-SYS-1 4.93777E-03 Pr[TOP EVENT] 6.46555E-04 1.260 SECS. CPU TIME UTILIZED 231 exit
-le 3 - This example illustrates the use of the F"C program to process the fault tree used in the Integrated Airframe Propulsion Control System Architecture (IAPSA 11) project to analyze surface control failures. (See ref. 1.)
21
The surface control system has three separate actuation channels each consisting of an actuation stage and a disengage device stage. The actuation channels are brickwalled with force voting at the control surface. Channel self-monitoring techniques are the primary method of fault detection and isolation. Each actuation channel contains two special devices for fault tolerance. The disengage device can deactivate a faulty channel. The surface can be controlled by one channel if the other two channels have been deactivated. Additionally, an override device in each channel allows two good channels to overpower a channel with a failed disengage device. Thus, surface failure (top event) can occur in two ways: ( 1 ) loss of all three actuation channels, (2) loss of two channels when one of the lost channels has a failed disengage device. The following tree describes these aspects of the system failure process: TREE SURFACE-FAILURE;
CH1: CH FAULT; C H ~ : CH-FAULT; C H ~ : CH-FAULT; -
(* (* (*
Channel 1 failure Channel 2 failure Channel 3 failure
-> 6.03-6; -> 6.03-6; -> 6.03-6;
(* (* (*
Channel 1 disengage device failure Channel 2 disengage device failure Channel 3 disengage device failure
DDI DD2 DD3
*) *) *) *) *) *)
LOSS-OF-ALL-CHANNELS: AND( CHI, CH2, CH3); SFlA: AND(CH1, 001); SFlB: OR(CH2, (333); CHANNEL1-UNISOLATED: AND( S F l A , S F l B ) ; SF2A: AND(CH2, 0 0 2 ) ; SF2B: OR(CH1, CH3); CHANNEL2-UNISOLATED: AND( S F a , SF2B) ; SF3A: AND(CH3, DD3); SF3B: OR(CH1, C H 2 ) ; CHANNEL3-UNISOLATED: AND( SF3A, SF3B) ; z
TOP: OR (LOSS OF ALL CHANNELS, CHANNEL1 UNISOLATED, L % i " c UNYSOLATED, CHANNEL3-UNISOLATED) ;
-
-
Next, the failures leading to an actuation channel breakdown must be enumerated in a subtree. An actuation channel failure can occur because of the loss of the I/S bus, lack of two surface commands, or a fault in the actuation channel elements - the I/S bus terminal, the elevator processor, and the electrical
22
and mechanical actuation hardware. Surface comaands can be lost due to ccnnmand generation faults or computer bus terminal faults. The following subtree describes actuation channel failure:
SUBTREE CH-FAULT;
Cl COMMAND: COMMAM) FAILURE; c 2 3 o ~ ~ ~COMMAND-FAILURE; m : c 3 - m : --FAILURE; c4 - m : COMMAND-FAILURE; C11 C21 C31 C41
-> -> -> ->
1E-6; 1E-6; 1E-6; 1E-6;
ACT1 -> 9031-6; B1 -> 2031-6; AC1: OR(C1 COMMAND, AC2 : OR( C2-COMMAND, AC3: OR( C3-COMMAND, AC4: OR(C4-COMMAND, -
of of of of
comnand command comd command
(* (* (* (*
Loss Loss Loss Loss
(* (* (* (*
computer computer computer computer
(*
fault in actuation channel elements failure in I/S bus * )
(*
1 bus 2 bus 3 bus 4 bus
1 *) 2 *) 3 *) 4 *)
terminal terminal terminal terminal
fault fault fault fault
*) *) *) *)
C11); C21); C31); C41);
LOSE TWD COMMANDS: 3 OF (AC1, AC2, AC3, AC4); TOP:-OR(&"l, B1, IXlSE-TWD-COmmANDS);
A comand generation fault can occur due to lack of PCS data, IRADC data, or computer failure. The loss of data can be due to data source failure or I/S bus failure or computer bus terminal failure: SUBTREE COMMAND-FAILURE;
PCSl -> 11.OE-6; B1 -> 2031-6; C11 -> 131-6; IRADCl -> 122.53-6;
(* (* (* (*
loss of channel 1 PCS data * ) failure in channel 1 I/S bus * ) bus terminal to channel 1 fault loss of channel 1 IRADC data * )
PCS2 -> 11.031-6; B2 -> 2OE-6; C12 -> 35-6; IRADC2 -> 122.531-6;
(* (* (* (*
loss of channel 2 PCS data * ) failure in channel 2 I/S bus * ) bus terminal to channel 2 fault loss of channel 2 IRADC data * )
pCS3 -> 11.OE-6; B3 -> 203-6; C13 -> 13-6; IRADC3 -> 122.5E-6;
(* (* (* (*
loss of channel 3 PCS data * ) failure in channel 3 I/S bus * ) bus terminal to channel 3 fault loss of channel 3 IRADC data *)
23
*)
*)
*)
CLCl -> 1OO.OE-6; LPD1: OR(PCS1, LPD2: OR(PCS2, LPD3: OR(PCS3, PCS-DATA-LOSS:
(*
computer failure rate
*)
B1, Cll); B2, C12); 83, C13); AND(LPD1, LPD2, LPD3);
LID1: OR(IRADC1, B1, C11); LIDZ: OR(IRADC2, 82, C12); LID3: OR(1-3, B3, C13); IRADC-DATA-LOSS: AND(LID1, LID2, LID3); TOP: OR(PCS-DATA-LOSS, IRADC-RAW4-LOSS, CLC1); The above model was available in file IAPSA.MOD prior to the following interactive session.
FTC V l . 0
-
NASA Langley Research Center
l? echo 0 27 read WSA 457 run
12.230 SECS. CPU TIME UTILIZED
24
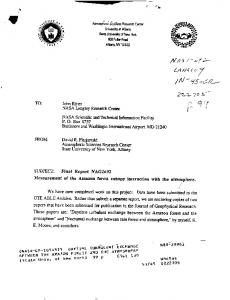
-le 4 - This example illustrates the use of the program to investigate the sensitivity of a fault tree to a parameter. $ E E vl.0
NASA Langley Research Center
17 READ Ex5; 2: V = 0 TO 1 BY .I; 3: G11: V; 4: G12: V/2; 5: G13: SQRT(V); 6: G14: 1 - V; 7: G15: 1 - V/2; 8: G16: 1 - SQRT(V); . 9: G17: V*(l-V); 10: G18: (l-V)*(l-V*V)*(l-V**3); 11 : 12: A21: AND(Gll,G12,G13); 13: A22: OR(G12,G13); 14: A23: XOR(G13,G14); 15: A24: 30F(G15,G16,G17,G18); 16: A25: AND(G16,G17); 17: 18: B31: OR(A21,A25); 19: B32: INV(A22); 20: B33: OR(A24,A22); 21: 22: C41: AND(B31,A23); 23: C42: AND(B33,B32,A22); 24 : 25: TOP: 20F(C41,C42,A25,A23); 263 run V O.OOOOOE+OO 1.OOOOOE-01 2.OOOOOE-01 3.OOOOOE-01 4.OOOOOE-01 5.OOOOOE-01 6.OOOOOE-01 7.OOOOOE-01 8.OOOOOE-01 9.OOOOOE-01 1.OOOOOE+OO
O.OOOOOE+OO 3.9965531-02 4.86548E-02 5.236803102 6.0221931-02 7.756983-02 1.0915OE-01 1.603353-01 2.375493-01 3.481653-01 5.OOOOOE-01
4.090 SECS. CPU TIME UTILIZED 273 PLOT 28? DISP COPY
(See Figure 2) 25
.6
-
.4
-.
0.
0.
.25
.5
-75
V
Figure 2
26
1.
The Fault-Tree Compiler is a new reliability analysis program based on combinatorial mathematics. The program has three major strengths: 1) the input language is easy to understand and learn, 2) automatic sensitivity analysis is allowed by varying a parameter over a range of values, and 3) the answer provided by the program is precise. Additionally, the use of the hierarchical fault tree capability can reduce model complexity. The program can be used for an exact analysis, or a simple analysis of any system of interest.
27
1. Cohen, G. C.; Lee, C. W.; Brock, L. D.; and Allen, J. G: Designflalidation Concept for an Integrated Airframe/Propulsion Control System Architecture (IAPSA 11), NASA Contractor Report 178084, June 1986. 2. Henley, E.J.; and Kumamoto, H.: Reliability Engineering and Risk Assessment, Prentice-Hall, Inc., 1981. 3. E3avus0, S.J.; and Petersen, P.L.: CARE I11 Model Overview and User's Guide, NASA Technical Memorandum 86404, April 1985.
L
28
APPENDIX A
. 'Iheory
The Fault Tree Compiler program solution technique relies upon three basic model assumptions: 1) System components, or basic events, fail independently, Components are either failed or operational; an "in-between" state does not exist. 3 ) The system is either failed or operational; no "in-between" state exists.
2)
Figure Al illustrates a representative fault tree. In the following discussion, the fault tree is generalized to have n basic events and a probability of occurrence associated with each. Basic events will be referred to as "components" and a probability of "failure" will be attributed to each of the components in the system.
Figure Al
A-1
Let A,, represent the event component A, has not failed A, represent the event component has failed. By defining the variable vi as
0 if system component i has not failed
1 S i S n 1 if system component i has failed, we have, by independence
of the n basic events,
-n
n P(qy 1 i
ill
It is possible to enumerate all combinations of components-failed and components-operational describing the different possible states of the system. Each system state can be represented by an n-dimensional "binary" vector composed of 1's and O's, where 1 indicates that the component has failed and 0 indicates that the component has not failed. The event that all n components fail, for example, would be represented by the vector (1 1 1
. - . 1).
system composed of four basic events would generate the following binary vectors :
A
1. 2. 3. 4.
(0 0 (1 0 (0 1 (0 0
0 0) 0 0) 0 0) 10)
5.
6. 7. 8.
(0 0 (1 1 (1 0 (1 0
0 1) 0 0) 10) 0 1)
'
9. 10. 11. 12.
(0 1 (0 1 (0 0 (1 1
1 0) 0 1) 11) 1 0)
13. 14. 15. 16.
(1 1 (1 0 (0 1 (1 1
0 1) 1 1) 11) 1 1)
Clearly, for an n-component system there are 2" possible binary vectors representing 2" distinct system states. The jth system state is denoted by sj, A-2
and its associated probability by P ( s j ) . Note that the jth binary vector can be written in terms of the variables vi , (v, v2 v,, ) , and that the probability of the jth system state is
...
The sample space S is the set of all possible system states denoted by the 2" binary vectors. By definition, P(S) = 1. Because the components are either failed or not-failed, the 2" binary vectors exhaustively describe all possible system states. Therefore,
... +s
P(s,+s2+
) =
P(S) = 1.
2n
Clearly, the system can be in one and only one state at any given time, indicating that the system states are mutually exclusive. By definition, P(sisj) = 0
for every i and j # i
and, for the 2" mutually exclusive system states, P(s,+s2+
... +s
2*
-
P(s, 1 + P ( s , 1 +
..e
+ P(S " 12
To calculate the probability of system failure, the sample space S camposed of 2" system states is divided into two subsets, where one subset contains all states representing system failure, and the other subset contains all states that represent system operational. Because the system must be either failed or operational these two subsets are clearly exhaustive and mutually exclusive. Fslrthermore the system states composing each of these two subsets are mutually exclusive, and the probability of either subset can be found by summing the appropriate individual system state probabilities. Therefore, calculating the total probability of system failure by simply s d n g the probabilities of the system configurations that represent system failure is exact. A-3
I
The Solution Technique The program solution technique generates binary vectors in an orderly fashion, starting with binary vector (0 0 0
. - . On).
Vectors are checked through the user-defined system tree; for each binary vector found to represent a system-fail configuration its probability is added to a running total of binary vector probabilities, where all vector probabilities in the sum represent system fail configurations. As shown above, the total number of binary vectors to be checked through the system tree is 2". For systems with many components, the number of fault vectors to check through the system tree can be very large. A simple and effective pruning technique has been developed to reduce the total number of fault vectors checked through the system tree. The pruning technique will not affect the FTC program answer; it will reduce run-time and improve efficiency. Consider a system composed of ten highly reliable components. The probability that any one component fails is low; the probability that all components fail is much, much lower. It is often true that the latter probability, when sumaned with the former probability, will not affect the answer within five or even ten or more significant digits. A threshold value can be established, and binary vectors with probabilities less than the threshold may be disregarded. The FTC program establishes a threshold by first calculating a "weight" function. A worst case scenario is solved, where it is assumed that 2"-1 vectors, all of value are to be pruned. The sum of all the values must be less than or equal to 0.5~10-~(d the number of significant digits in the FTC answer). The function
-
(2"-1) x lomk
< 0.5x1Wd
is solved for the smallest integer value of k that satisfies the equation. Once a binary vector representing a system-fail configuration is found, its A-4
probability is multiplied by the weight function value and the threshold is established. The threshold is used to reduce the total number of fault vectors checked through the system tree by eliminating those vectors that would not influence the FTC answer even if they do represent a system-fail configuration. For large systems With many basic events, the time savings can be substantial. The solution algorithm can be roughly sumMrized as follows: Calculate the weight function (shown above).
Rank the probabilities of failure. fault vectors are maintained, IVEC and JVEC. IVEC represents the basic events in the order in which they were entered in the model. JVEC, on the other hand, ranks the probabilities of failure and orders the basic events from highest P(f) to lowest. The need for two vector representations will become clear shortly. Select the (0 0 0
0,)
fault vector.
Using the IVEC representation, check to see if the fault vector represents a system fail state. If the fault vector represents a system fail state, then If this is the first system fail fault vector to be found, calculate the probability of the set of events represented by the fault vector. Then multiply this value by the weight function to obtain the threshold value, CUTOFF. Lastly, initialize the total probability of system failure to the fault vector probability.
If this is not the first system fail fault vector, simply add its probability of occurrence to the total probability of failure. Increment the JVEC fault vector, and generate the equivalent IVEC fault vector. By incrementing the JVEC fault vector and then converting to IVEC, the fault vectors are generated in patterns of decreasing probabilities. If at least one fault vector has been found representing a system fail state, calculate the new fault vector's probability of occurrence, PFVOCC
.
If a PFVOCC value is calculated, it is compared to the CUTOFF value. If PFVOCC < CUTOFF, then the next JVEC fault vector with a PFVOCC greater than CUTOFF is generated. If no such vector exists, or the vector (1 1 1 1,) has been reached, the program jumps to step 9. -
e
-
Loop to step 4. The total probability of failure is passed to the calling program.
A-5
Fault tree solvers exist; it is felt that the FTC program is superior in its tree input language and specification syntax. The use of subtrees to reduce run time and aid in the analysis of large trees is especially powerful. The probability of the top event in the system tree is exact to five significant digits. It is, however, the user's responsibility to assure that basic events in the tree are independent, and that the tree is semantically correct. The fau t tree is often satisfactory for design analysis and system failur2 studies. Though the fault tree methodology may have limitations for the detailed analysis of complex systems containing dependencies, it can be very useful in preliminary design reviews.
A-6
e
APPENDIX B
Error Messages c
Error and warning messages are listed in alphabetical order, with messages beginning with a symbol (i.e. =, I , ;) listed tt the end.
ALREADY DEFINED AS A GLOBAL CONSTANT previously as a global constant.
- The value
ALREADY DEFINED AS A GATE OUTPUT OR EVENT previously as a gate output or event. ALREADY DEFINED AS A LOCAL CONSTANT a local constant.
ALREADY DEFINED AS A RESERVED WORD ALREADY DEFINED AS A SUBTREE as a subtree title.
To EXP FUNCTION MUST BE function is too large.
has been defined previously defined as
- The value defined is an FTC reserved word. defined has previously been defined
< 8.80289E-tOl - The argument to the
OR SQRT E'UNCTION MUST BE positive arguments.
ARGUMENT TO LN
To STAMXW) F"CTI0N MISSING function.
ARGUMENT
- The value
- The value has been
- The value
ARGUMENT
defined has been defined
> 0 - The LN and
- No
Mp
SQRT functions require
argument was supplied for a standard
COMMA EXPECTED - Syntax error; a camma is needed. CONSTANT EXPECTED
- Syntax error; a constant is expected.
DIVISION BY ZERO NOT ALLOWED the expression.
- A division by
PROBABILITY GREATER THAN 1 value greater than 1.
EVENT
EXP FUNCTION ovERFL(Jw
- The
0 was encountered when evaluating
event probability was evaluated to a
-
The argument to the M p function is too large. value of the argument must be less than 8.80289E+Ol.
.
EXPRESSION CAMVOT CONTAIN THE VARIABLE terms of itself.
- The variable
FILE NAME
cannot be defined in
- The value of the expression caused arithmetic overflow. EXPECTED - Syntax error; the file name is missing. TOO LONG - File names must be 80 or less characters.
EXPRESSION OVERFLUi
FILE NAME
The
B-1
IDENTIFIER EXPECTED
-
Syntax error; the file name is missing.
IDENTIFIER NOT DEFINED - The identifier entered has not yet been defined. ILLEGAL cxmXTE3 - The character used is not recognized by the FTC program. ILLEGAL LN OR SQRT ARGUMENT arguments. ILLEGAL STAlEME"r
- The
- The LN and SQRT functions require positive
command word is unknown to the program.
ILLEGAL NUMBER OF INPUTS TO GATE - The AND and OR gates may have an arbitrary number of inputs; however, the INVERT gate must have only one input, the EXCLUSIVE OR gate must have two inputs, and the M OR N gate must have the number of inputs such that N - M 2 0. INPUT ALREADY DEFINED AS A VARIABLE - The gate or variable defined in the statement has already been defined globally as a variable. INPUT LINE TOO LONG
INTEGER EXPECTED
-
- The
command line exceeds the 100 character limit.
Syntax error; an integer is expected.
INV GATE MUST HAVE ONLY 1 INPUT
- Only
one input is allowed for the INVERT gate.
MUST BE IN "READ" MODE - The INPUT conunand can be used only in a file processed by a READ command. NOT A VALID EVENT - Events used as gate inputs must be previously defined as a basic event or the output from a previous gate.
NO GATES IN FAULT TREE NUMBER TOO LONG
- The
- Only 15 digits/characters allowed per number.
ONLY 1 VARIABLE ALLUiED
tree. REAL
fault tree contains no gates.
- Only one variable can be defined per
complete fault
EXPECTED - A floating point number is expected here.
SEMICOLON EXPECTED
-
Syntax error; a semicolon is needed.
SUB-EXPRESSION Too LARGE, i.e. > 1.7OOOOE+38 - An overflow condition was encountered when evaluating the expression. FOUND - The fault tree was unable to calculate subtree top event probabilities. Check for syntax errors in the subtrees.
SUBTREE RESULT NOT TOP NOT REACHABLE
tree.
- No
combination of events led to the top event in the system
- Verify that the gate type is AND, OR, INV, XOR, or OF < >. See the "Gate Definition" section of this paper for more information.
UNK" GATE TYPE M
B-2
VARIABLE MUST BE DEFINED AT GLOBAL LEVEL - Variables may " Ibe defined within subtrees; variables must be def ined giobally. FILE NOT FOUND - The file indicated on the READ command is not present on the disk. (Note: make sure your default directory is correct.)
VMS
.
VARIABLE CHANGED TO A CONSTANT! PREVIOUS EVENTS MAY BE WRONG If previous basic events have been defined using a variable and the variable n e is changed, inconsistencies may appear in &e results.
*** WARNING: ***
WARNING: SYNTAX ERRORS PRESENT BEFORE RUN - Syntax errors were present during the model description process. They may or may not have been corrected prior to the run.
***
WARNING: RUN-TIME PROCESSING ERRORS execution.
- Computation overflow
***
-
W"ING: REMAINDER ON I"I LINE IGNORED the input line is disregarded.
EXPECTED
- Syntax error;
information on the rest of
the = operator is needed.
- A right bracket is missing < EXPECTED - Syntax error; the < symbol ] EXPECTED
- The
in the expression. is needed.
)
EXPECTED
-A
right parenthesis is missing in the expression.
(
EXPECTED
-A
left parenthesis is missing in the expression.
B-3
occurred during
Standard Bibliographic Page
. Report No.
2. Government Accession No.
3. Recipient’s Catalog No.
NASA TM-89098 5 . Report Date
J a u n a r y 1987 ~~
6. Performing Organization Code
505-66-21-01
. Author(s)
~
8. Performing Organization Report No.
Anna L. Martensen and Ricky W. B u t l e r 1.
10. Work Unit No.
Performing Organization Name and Address
NASA Langley Research Center Hampton, VA 23665-5225
11. Contract or Grant No. 13. Type of Report and Period Covered
2. Sponsoring Agency Name and Address
N a t i o n a l Aeronautics and Space A d m i n i s t r a t i o n Washington, DC 20546-0001
T e c h n i c a l Memorandum 14. Sponsoring Agency Code
5 . Supplementary Notes
Anna L. Martensen, PRC Kentron, I n c . , Hampton, V i r g i n i a . Ricky W. B u t l e r , Langley Research Center, Hampton, V i r g i n i a .
16. Abstract
The Fault Tree Compiler Program is a new reliability tool used to predict the topevent probability for a fault tree. Five different gate types are allowed in the fault tree: AND, OR, EXCLUSIVE OR, IMIERT, and M OF N gates. The high-level input language is easy to understand and use when describing the system tree. In addition, the use of the hierarchical fault tree capability can simplify the tree description and decrease program execution time. The current solution technique provides an answer precise (within the limits of double precision floating point arithmetic) to the five digits in the answer. The user may vary one failure rate or failure probability over a range of values and plot the results for sensitivity analyses. The solution technique is implemented in FORTRAN; the remaining program code is implemented in Pascal. The program is written to run on a Digital Corporation VAX with the VMS operation system.
17. Key Words (Suggested by Authors(s))
F a u l t Tree R e l i a b i l i t y Analysis R e l i a b i l i t y Modeling Fault Tolerance
19. Security Classif.(of this report)
Unclassified
I 18. Distribution Statement Unclassified
- Unlimited
S t a r Category 61
20. Security Classif.(of this page)
Unclassified
21. No. of Pages 22. Price
39
For sale by the National Technical Information Service, Springfield, Virginia 22161 NASA Langley Form 83 (June 1985)
A0 3