The fuzzy clustering method: Applications in the air transport market in Taiwan Received (in revised form): 4th August, 2003
Ian Wen-Yu Chiang is a PhD student of shipping and transportation management at National Taiwan Ocean University. He is interested in air transportation marketing research. He worked in the airport information system area and his current focus is on internet marketing research.
Gin-Shuh Liang is a professor of shipping and transportation management at National Taiwan Ocean University. He holds a doctorate in industrial engineering and engineering management from National Tsing Hua University, Taiwan. His research interests are in fuzzy theory applications applied to business management. He is also engaged in research in the areas of statistics and operations research.
Shmuel Z. Yahalom is a professor of economics and transportation at State University of New York Maritime College. His PhD in economics is from the City University of New York. He is interested in applied research in the areas of transportation management, ports and terminals, economics, operations research and marketing.
Ian Wen-Yu Chiang Department of Shipping and Transportation Management, National Taiwan Ocean University, 2 Pei-Ning Road, Keelung, Taiwan, 20024. Tel: ⫹886 2 2462 2192; Fax: ⫹886 2 2462 0724; e-mail:
[email protected]
Abstract In the air transport market, passengers select different airlines based on service quality, travellers’ socioeconomic characteristics and the purpose of the trip. So how does one treat passengers’ shopping behaviours in the entire air transport market and, based on these findings, how does one design an optimally customised marketing strategy? The key issue for airlines and their agencies is to develop a niche of new customers and keep the old ones. What is the real market for an airline and how does an airline design an optimum customised marketing strategy? Passengers may belong to different market segments. This paper uses the fuzzy clustering method to analyse the air transport passenger market from Taipei to Vancouver and provide a systematised analytical method for marketing and other uses. The air transport market from Taipei to Vancouver can be divided into three definite clusters and two fuzzy clusters. The research also compares its results with the traditional Ward clustering method. Airlines and/or their agents dealing with marketing can aim at the three definite clusters and two fuzzy clusters when developing fuzzy packages. Using database marketing, airlines can provide the fuzzy packages via the internet to fuzzy travellers who belong to frequent flier programmes. Fuzzy travellers can get preferential treatment and discounts. For the fuzzy market, it is very effective and low-cost marketing. Follow-up research could be applied to other international routes, eg Taipei–Amsterdam.
INTRODUCTION The airlines’ key issue is to develop a niche for new customers and keep old ones by understanding passengers’
䉷 Henry Stewart Publications 1741-2447 (2003)
Vol. 11, 2, 149–158
shopping behaviours in the air transport market and its clusters, in order to achieve marketing differentation or concentration, and/or design a
Database Marketing & Customer Strategy Management
149
Chiang, Liang and Yahalom
customised one-to-one marketing strategy. In general, this type of research is based on airlines’ service qualities and passengers’ socioeconomic characteristics in order to process questionnaires for analysis and, finally, to categorise passengers in definite segments. The traditional survey method identifies a traveller as belonging to one market segment; a traveller cannot belong to two or more segments at the same time. Traditional market segmentation can identify the target markets, but it ignores two problems: — assignment of a passenger to only one segment cannot be expressed using the characteristics of the original data — when focusing on a traveller, the marketing strategy cannot identify the market segment the passenger belongs to or design an optimum and/or customised marketing strategy. Thus, this research applies fuzzy clustering to develop a systematised analytical method and to eliminate the shortcomings of the traditional clustering method. For decades, Taiwanese who wanted to emigrate, travel or study abroad have chosen the USA as their destination. This trend has been changing and more and more Taiwanese are choosing to go to Canada. Statistics show that travel from Taiwan to Canada during the years 1991 to 2002 has increased almost three-fold.1 Thus, the Taipei to Vancouver route is worth researching. The reasons for the increase in travel on this route are: — Canadian educational exhibitions are held annually in Taiwan — airlines promote travel packages — many immigrants travel back and forth — the Canadian government encourages foreign companies to invest in Canada.
150
Database Marketing & Customer Strategy Management
Travelling segmentation is a strategy to evaluate the importance of airline marketing. To study the market structures and segments, travellers’ spending in pursuing a benefit or utility is used as a segment variable.2 With respect to the air travel market, travellers pursue their interests and may select airlines that do not necessarily belong to the one segmented market to which they had previously been loyal. In the past, researchers of market segmentation used observations only in one particular market segment, ie the sample could not apply to two or more market segments simultaneously. Furthermore, the method could not completely demonstrate the original data characteristics; therefore, researchers used the fuzzy clustering method to solve the problem. For example, if 60 per cent of observations belong to a segment in market A, then another 40 per cent belong to a segment in market B. The fuzzy clustering method can be defined as the degree of membership to describe which market segments the observation belongs to; it can thus clearly display the nature of the market. Market segmentation is a way of dividing a market into smaller markets for marketers to target.3 LITERATURE REVIEW The conditions for market segmentation as an effective measure4 are: a. Buying power and magnitude of each market segment b. The contact and service of each market segment c. The magnitude of each market segment capacity and profitability d. The market segment validity as a marketing segment to attract customers.
Vol. 11, 2, 149–158
䉷 Henry Stewart Publications 1741–2447 (2003)
The fuzzy clustering method: Applications in the air transport market in Taiwan
The segmented variables can be divided into: geographical variables, vital statistic variables, mental state variables and behaviour variables. The market segment variables can be divided mostly into two kinds: (a) base variables, the standard of the classification; (b) descriptive variables, describing consumer behaviour.5 The stability of service quality factors is very high, better than other segmented variables described by marketing strategy.6 Proussaloglou and Koppelman7 mentioned that travellers always choose carriers on the basis of schedule, ticket price, seat level and ticket conditions. They found other factors: travellers’ preference for a carrier, carrier’s market presence, service quality, and frequent flyer programmes (FFP). Their research also found how much a traveller is willing to pay for delay, FFP and free ticket terms. In Taiwan, Duann and Lu,8 applying multiple nominal logit to their research, found that factors affecting travellers’ choice were equipment and safety, customer service, schedule, price, delay time, meal service and repeat travel. For research into direct and transit flying, Shyr and Wu9 used ticket price as the decision variable and concluded that travellers focus on safety, service quality, ease to arrange travel time, flight frequency and languages spoken by airline staff. RESEARCH METHOD Research framework From the above literature review, travellers select airlines on the basis of service quality, ticket price, transit waiting time, carrier preference, market presence, service quality, FFP and schedule convenience. The research method used in this paper is a fuzzy questionnaire based on a
䉷 Henry Stewart Publications 1741-2447 (2003)
Vol. 11, 2, 149–158
Likert five-point scale, from not very important to very important. In each point along the scale the traveller can, however, indicate the travel value. All data are converted into a value. The factors selected are effectiveness or traveller benefits. The service quality to travellers is not a precise expression for the five fixed choices. Thus, the fuzzy method questionnaire is used to understand travellers’ choices. The variables include: departure on time, aircraft model, schedule, transit waiting time, flying time, airport transportation system, airport transportation fee, air ticket price, air security record, on-board meal, seat comfort, entertainment on board, internet service, shopping for air ticket online, bonus feedback, FFP, activity contact, front-desk service quality, crew member service quality, baggage safety, on-time delivery, airport transportation system time and transit points. Questionnaire design The questionnaire was an in-depth interview with travellers who fly back and forth frequently between Taiwan and Vancouver, Canada. The airlines included were those that fly direct (China Airline, Eva Airline and Air Canada) and in-transit airlines that involve a waiting time of two to four hours (Cathay Airway and Japan Airlines). Not all travellers are experienced, or experienced in flying from Taipei to Vancouver, so they were divided into two types: ‘revealed preference’ travellers and leisure travellers, each with a corresponding part in the questionnaire. According to neoclassical economics, revealed preferences such as purpose and subjective benefit of absolutely rational people are revealed by the choices they make. The questionnaire for the revealed preference group was based on flying
Database Marketing & Customer Strategy Management
151
Chiang, Liang and Yahalom
Service quality factors
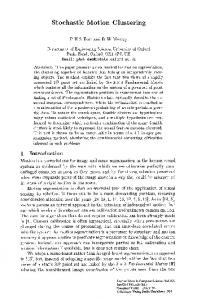
Fuzzy market analysis: Travellers' benefits and airline service quality
Based on the fuzzy market variables emphasising the travellers' fuzzy market
Airlines can provide fuzzy packages to fuzzy travellers (FFP members) via internet (email). Figure 1: Conceptual framework
experience and socioeconomic data. To obtain the leisure travellers’ data a scenario mechanism questionnaire was designed. For example, high ticket price variability in the general air transport market, is perceived as ideal. The leisure travellers’ data assumed substitutability and the ability to choose from announced airline ticket price and flying time at an average level. Spending per month for each traveller also includes revealed preference and descriptive data. Sampling The data were obtained by questionnaire and e-mail. The interviews were conducted between 16th and 22nd December, 2002, at Taiwan Chiang KaiShek International Airport. The questionnaire was distributed at the airport randomly to those travellers who were about to fly to Vancouver, Canada. Of the 200 questionnaires gathered, 185 were valid. On 11th July, 2003, 3,000
152
Database Marketing & Customer Strategy Management
e-mail questionnaires were sent to the FFP members who frequently fly back and forth between Taipei and Vancouver. The number of valid e-mail questionnaires returned was 2,375; so 2,560 valid questionnaires were received altogether. The questionnaire response rate was 83.2 per cent. Fuzzy clustering (Fuzzy K-means) Customer behaviour theories are based on economic or psychological behaviour principles. The measurement standard of the objective function is the square distance of the observation from the centre of the cluster. This is the minimum objective function number. Since each observation belongs to a cluster, the researcher should consider the distance of each observation from the centre of each cluster. The objective function is:
冘冘
Min J ⫽
Vol. 11, 2, 149–158
n
c
M ik d 2(xi, ck)
(1)
i=1 k=1
䉷 Henry Stewart Publications 1741–2447 (2003)
The fuzzy clustering method: Applications in the air transport market in Taiwan
where n: c: Ck : Xi : d2:
the number of the data the number of clusters the central point of the cluster k observation i the distance square of the Xi and Ck ⌽: fuzzy exponent decides the fuzzy degree which is between 1 and ⬁, the larger the more fuzzy, but less than or equal to 1 is not fuzzy.
(For a method to minimise J see Appendix 1.) Reliability and validity analysis In general, the statistics coefficient Cronbach ␣ measures the uniformity of variety within the same factor. In a base research case, validity that reaches at least 0.80 can be accepted. In an explorer research case, as long as validity reaches 0.70 it can be accepted. Some scholars accept validity as long as the Cronbach ␣ coefficient lies between 0.70 and 0.98, and it is regarded as a high validity. If, however, it is below 0.35, it must be rejected. RESULTS AND DISCUSSION Reliability analysis Before standardising the variables, the reliability test of Cronbach ␣ was 0.8119. After the standardisation, the Cronbach ␣ value increased to 0.8215, which indicates that these 20 benefit variables of air travel have very high uniformity. A value of 0.8215 ⬎ 0.80 (basic reliability), indicates the questionnaire’s high reliability. Validity analysis With respect to validity analysis, this
䉷 Henry Stewart Publications 1741-2447 (2003)
Vol. 11, 2, 149–158
research with two to five groups and fuzzy index Phi ⫽ 2 (optimal value10) determined the S value (close degree, see Appendix 2) of each group. As Table 1 shows, the S value was determined to be the least while divided into three groups. The best fuzzy clustering number was, therefore, three. Factor analysis and name assigning This research extracts the dimensions of the traveller and airline service quality from the 20 factor service quality variables (Table 2). The criteria are based on an ingredient analysis method for the least variability quantity within carriers and on the negative growth dimensions in the factor analysis adoption criteria. The selection criteria is based on the factor with the character larger than one for a standard. The results determined seven service quality dimensions that can explain general variability up to 73 per cent. A standard is assigning a name to a factor weight rates larger than 0.55 (Table 2). Ward’s clustering The analysis of clusters is used to determine the data focus and the number of variables that belong in the same cluster. It can be in layer and non-layer clusters, and it can only be used for the value variable. This research uses Ward’s clustering method because it is quite sensitive to deviating values. The best cluster number that splits is known as the highest increase of the multiple correlation coefficient square (RSQ). Its cluster number is a separated number, which can also be referred to as the tree form diagram, which can be divided into three major clusters. From Table 3, using Ward’s method, service quality is divided into three
Database Marketing & Customer Strategy Management
153
Chiang, Liang and Yahalom Table 1: The S value Number of clusters
Phi value
S value
2 3 4 5
2.0 2.0 2.0 2.0
1.31808 0.58732 0.81932 0.80135
Table 2: Factor analysis for carriers’ service qualities Dimensions
Factors
Eigenvalues
1 Active service
17 18 16 6 5 13 7 1 8 2 4 12 9 11 15 14 3 19 20 10
4.8702
2 Travel convenience
3 Travel time and price
4 Travel comfort 5 Discount 6 Flight time 7 Additional service
Contact the traveller On-board service quality FFP Cost of airport bus system Flying time On-board use of internet Timetable for airport bus service On-time departure Ticket price Aircraft model Transit flying waiting time On-board entertainment Airline security record On-board seat comfort Bonus for using credit card Online purchase Departure time not at midnight Service quality in check in counter Baggage handling safety and timeliness On-board meal quality
markets. The first includes the largest number of factors such as: time, expense, bonus (or extras) and conveniences that most people desire; the second emphasises on-board comfort; the third is the trip time. Result of applying the fuzzy clustering method As shown in Figure 2, the favourable variable (service qualities) preferred by travellers on this route can be classified into the following markets: — market A: value service. If the traveller thinks that ticket price is the most important factor then 36 per cent of travellers are also simultaneously available for market B; if the traveller prefers transit waiting time, then 41 per cent of travellers
154
Database Marketing & Customer Strategy Management
2.4855
2.0407
1.7618 1.2560 1.1141 1.0277
are also simultaneously available for market B — market B: trip comfort and bonus feedback. Travellers could also be in market C simultaneously — possibly 32 per cent of them if they prefer to use the internet on board; if they prefer baggage safety and on-time service then the simultaneous possibility of being in market C is also 32 per cent — market C: the time effect. The fuzzy characteristic of this as a market segment is small; therefore, it is not distinguished in the analysis. Next, using Figure 2, the fuzzy cluster divides this market into three major clusters, but some travellers belong to two markets. As Figure 2 shows, between market A and market B, there are four attributes that belong to fuzzy
Vol. 11, 2, 149–158
䉷 Henry Stewart Publications 1741–2447 (2003)
The fuzzy clustering method: Applications in the air transport market in Taiwan
Table 3: Ward clustering Market Segment 1
Factors 17 18 16 6 5 13 7 1 8 2 4 15 14 20
Contact traveller friendly On-board service quality FFP Cost of airport bus system Flying time On-board use of internet Timetable for airport bus service On-time departure Ticket price Aircraft model Transit flying waiting time Bonus for using credit card Online purchase Baggage handling safety and timeliness 10 On-board meal quality
Segment 2 12 On-board entertainment 9 Airline security record 11 On-board seat comfort Segment 3
3 Departure time not at midnight 19 Service quality in check in counter
market 1. In market A, with value ticket price and transit waiting time, travellers probably also belong to market segment B. In market B, with higher value for on-board attendant service quality and on-board moderate comfort, travellers simultaneously belong to market A. In market C and market B, there are two attributes in fuzzy market 2. When travellers belong to market C, and when internet use on board, baggage safety and on-time service are important, then they also belong to market B. Thus, the difference between fuzzy clustering and traditional clustering is the traditional rigidity of cluster categorisation into three market segments. The fuzzy cluster can seek, in addition to three markets, two fuzzy markets. CONCLUSION AND RECOMMENDATIONS This paper provides a new marketing tool for airlines or travel agencies. The attribute of each market can be used by each marketer to suit their circumstances. There
䉷 Henry Stewart Publications 1741-2447 (2003)
Vol. 11, 2, 149–158
are three marketing programmes which can be applied to both business and leisure travellers. Programme A emphasises ticket price and turning points to meet the airline schedule. A traveller belonging to programme A, however, may also belong to market B (comfort on the trip and bonus feedback) so marketing staff can introduce programme B while accommodating the traveller with his or her choices. Similarly, if a leisure traveller is in programme B, but prefers a particularly good on-board service and a comfortable seat, then that traveller may also belong to market A. There is one way to belong to C (B –> C). From Figure 2, the passenger belongs to market A, but also contains characteristics that belong to market B. The research found that the traveller on the Taipei–Vancouver route can belong to three kinds of markets: (1) prefers service quality, (2) pursues high pleasure and low price; and (3) is sensitive to expense, time, service and safety. The characteristics of each market segment demonstrate that: — the market A traveller prefers resort hotels and to book tickets, usually as part of a package group, via travel agents. And, if sensitive to ticket price and requires use of the internet while on board, also belongs to market B — the market B traveller who belongs to the resort hotel and personal tourism group is also the one who makes a point of choosing on-board quality of service and seat comfort, so this traveller also belongs to market A. If this traveller also wants to use the internet while on board and is concerned about baggage safety and punctual service, then the traveller also belongs to market C. — the market C traveller should be the business traveller because the
Database Marketing & Customer Strategy Management
155
Chiang, Liang and Yahalom
Table 4: Fuzzy clustering memberships Factors
Market
Degree of membership A B C
17 18 16 6 5 13 8 4 20 10 15 14 7 1 2 3 19 12 9 11
A B/A B B B B/C A/B A/B B/C A B C C C B B A A B B/A
0.50117 0.37775 0.20519 0.25779 0.30893 0.18127 0.49062 0.47470 0.20020 0.67256 0.19254 0.08065 0.09656 0.28238 0.19050 0.16406 0.60199 0.73764 0.12734 0.40392
Contact traveller friendly Good on-board attendant service FFP Expense for airport bus system Fly time On-board use of internet Ticket price Transit flying waiting time Baggage safety and on time On-board meal taste Bonus for using credit card Purchase online Timetable for airport bus system Department on time Aircraft model Departure time not at midnight Good service attitude in front desk On-board entertainment facilities Air security record On-board chair comfort extent
0.23370 0.44965 0.59375 0.52272 0.55794 0.49486 0.36421 0.41174 0.47782 0.24104 0.55051 0.11146 0.16176 0.24126 0.61635 0.78714 0.24684 0.16931 0.78934 0.50111
0.26513 0.17260 0.20106 0.21949 0.13313 0.32388 0.14517 0.11356 0.32198 0.08640 0.25695 0.80788 0.74168 0.47636 0.19315 0.04880 0.15117 0.09306 0.08332 0.09498
Second market contains the degree of memberships that were greater than 30 per cent.
Market B
Market A
Fuzzy
17. Activity contact
market 1
8. Ticket price
18. Crew service attitude
4. Transit waiting time 10. On-board meal
16. FFP
8. Ticket price
6. Airport transport system fee
19. Service attitude
4. Transit waiting time
12. Entertainment on board
18. Crew service attitude
5. Flight time
11. Seat comfort
13. On-board internet service 20. Baggage safety and on time 15. Bonus feedback 2. Aircraft model
Market C
3. Departure not during night 9. Air safety record
Fuzzy 14. Order online
11. Seat comfort
market 2
7. Time for going downtown 1. On time
13. On-board internet service 20. Baggage safety and on time
Figure 2: Fuzzy market segments for service qualities
156
Database Marketing & Customer Strategy Management
Vol. 11, 2, 149–158
䉷 Henry Stewart Publications 1741–2447 (2003)
The fuzzy clustering method: Applications in the air transport market in Taiwan
distinguishing feature of this market is the desire for fast, punctual flights. 8
A traveller might belong simultaneously to two or three markets. Markets A and C, however, do not converge — the market C traveller is typically a business passenger and the market A traveller a package tour passenger. Fuzzy clustering can also be used for direct marketing. Thanks to the FFP, airlines have access to information about millions of members, including personal data, shopping behaviour and transaction records. Using their customer databases, airlines can divide customers into some definite and fuzzy markets and offer several tailored packages, including discounts, by contacting customers directly by e-mail. In addition, most airlines require travellers to be members in order to make online reservations so analysis of customer behaviour can provide immediate suggestions for meeting their leisure or business travel requirements. This is an example of a CRM method for airlines. The fuzzy clustering method can be used for other international routes, to improve airline travel service quality and to attract new clients and retain old clients. The method can also be applied to other industries.
9
10
11
12 13 14
‘The choice of air carrier, flight, and fare class’, Journal of Air Transportation, Vol. 5, No. 4, pp. 193–201. Duann, L.-s. and Lu, J.-l. (1999) ‘Modelling the joint choice of airline and flight’, Journal of The Chinese Institute of Transportation, Vol. 11, No. 4. Shyr, F.-y. and Wu, Y.-l. (2000) ‘Modeling airline’s competition for non-stop and transfer flights by applying game theory’, Transportation Planning Journal Quarterly, Vol. 29, No. 4, pp. 739–760. De Gruijter, J. J. and McBratney, A. B. (1988) ‘A modified fuzzy k means for predictive classification’, in Bock, H. (ed.) ‘Classification and related methods of data analysis’, Elsevier Science, Amsterdam. Bezdek, J. C. (1981) ‘Pattern recognition with fuzzy objective function algorithms’, Plenum Press, New York. De Gruijter and McBratney (1988) op. cit. Bezdek (1981) op. cit. Xie, X. L. and Beni, G. (1991) ‘A validity measure for fuzzy clustering’, IEEE Transactions of Pattern Analysis and Machine Intelligence, Vol. 13.
APPENDIX 1 Minimising J Bezdek11 provided a minimising method of J: d 2(–1) (2) mik ⫽ c ik dij2(–1)
冘 j=1
i ⫽ 1, 2, . . ., n; k ⫽ 1, . . ., c
冘 冘 n
ck ⫽
i=1 n
mikxi (3) mik
i=1
References 1 Department of Statistics (2002) ‘Monthly statistics of transportation and communications’, Taipei, Taiwan, December. 2 Kotler, P. (1996) ‘Marketing management — analysis, planning, implementation, and control’, 9th edn, Prentice Hall International, NJ. 3 Smith, W. R. (1965) ‘Product differentation and market segmentation as alternative marketing strategies’, Journal of Marketing, Vol. 21, pp. 3–8. 4 Kotler (1996) op cit. 5 Wind, Y. (1978) ‘Issues and advances in segmentation research’, Journal of Marketing Research, Vol. 15, pp. 317–337. 6 Calnatone, R. J. and Sawyer, A. G. (1978) ‘The stability of benefit segments’, Journal of Marketing Research, Vol. 15, pp. 395–404. 7 Proussaloglou, K. and Koppelman, F. S. (1999)
䉷 Henry Stewart Publications 1741-2447 (2003)
Vol. 11, 2, 149–158
k ⫽ 1, 2, . . ., c Sum square errors The design of the model is also based on fuzzy k-means clustering by De Gruijter and McBratney,12 and the fuzzy c-means clustering that Bezdek13 developed. It is a more efficient way to minimise the sum square errors in the group:
冘 c
mij ⫽ 1
(4)
k=1
i ⫽ 1, 2, . . ., n
Database Marketing & Customer Strategy Management
157
Chiang, Liang and Yahalom
Start
Initialise the membership I=0 Loop begin
i=i+1 Distance of centres of clusters Distance of observations to centres U=U' New membership U'
no
|U – U'| < = 0.0001 or i = 10000 yes End
Figure 3: Fuzzy clustering algorithm
冘 n
mik > 0, k ⫽ 1, 2, . . ., c
(5)
i=1
mik⑀[0, 1], i ⫽ 1, 2, . . ., n; k ⫽ 1, . . ., c APPENDIX 2 Validity analysis The effectiveness measure analysis adopts the separate distance (S) test that Xie and Beni14 submitted in 1991. It is an after cluster analysis of the dispersion rate of each group. The closer each central point, the smaller its ( J2) value. The
158
Database Marketing & Customer Strategy Management
closer the observation of group distribution, the smaller is the d2min number. The approach of this analysis is based on geometry distance among observations. The rule adopted is: the smaller S is the closer each group is, and therefore, the better is the clustering analysis. J2 ⫽
冘冘 n
c
m 2ik d 2ik(xi, ck)
(6)
i=1 k=1
{d2(ci, ck)} d2min ⫽ Min i⫽k
(7)
J2 n ⫻ d2min
(8)
S⫽
Vol. 11, 2, 149–158
䉷 Henry Stewart Publications 1741–2447 (2003)