In the paper, the reader never really knows if the authors talk about ... Seawalls are not included in the type of topographical information they use, but they can ... would be useful to also run the model in the absence of coral reef. .... storms. Can they comment on the ability of the reefs to withstand these storms and recover in.
Reviewers' comments:
Reviewer #1 (Remarks to the Author):
Thanks for the opportunity to review “the global flood protection savings provided by coral reefs.”
The paper presents a very impressive study to assess coastal risks in all coastline segments with coral reefs, and measure the increase in risks if these coral reefs lost one meter, due to various environmental impacts. They find a significant increase in risks, with a cost larger than $100 billion for the 100-year event.
I find the paper really interesting, it covers a really important topic, and represents an impressive effort to bring together multiple disciplines, from wave energy modeling to economic losses modeling. I think these results really need to be published as they have a great research and operational interest.
I have a few comments that – I think – should be taken into account before the paper is published.
First, the paper is not rigorous on the language and how results are presented. It makes the text confusing, and reduces the potential impact of the paper. There are many examples where I think the authors use the wrong words:
Line 102 “reduced annual flooding for more than 200,000 people” – my understanding is that 200,000 fewer people are flooded on average, which is very different than what the paper says. Maybe the authors could replace by “reduced annual flooding by more than 200,000 people”
Line 103 and Table S1: there is confusion between exposure and losses (in many places in the paper). The caption of Table S1 says “protection benefits […] in terms of exposure of built capital to flooding” so it is the exposure, not the “protection benefits” as in line 103. Unless Table S1 shows the avoided losses (in which case the caption needs to be rewritten).
The wording “built capital that has been damaged” or “built capital damaged” (line 314, 348, Y-axis label of Figure 3) is really unclear. For me, the damaged capital is the exposure (if a $1m
building suffer losses for $50k, then the built capital that has been damaged is $1m and the build capital damages are $50k). In the paper, the reader never really knows if the authors talk about exposure or losses.
-
Figure 3 caption says that the figure shows benefits while it shows the losses due to floods.
The authors have results for all return periods (Figure 3) but they use mostly the 100-yr return period results, which is confusing. In the abstract, for instance, one would like to know the impact of the reefs on average losses (based on Table 1). Figure 3 suggests that most of the effect of reefs on annual average losses will come from the frequent events (return period less than 25 years), and this would be important to flag too…
I think the authors should go through their paper carefully to ensure they use a more precise language and avoid confusion.
Second, I’m curious about the impact that flood protection infrastructure would have on the estimates. Seawalls are not included in the type of topographical information they use, but they can avoid coastal floods and they play a key role in the assessment of flood risks. To assess the impact of annual average losses, line 319-322, the authors would need to have a catalogue of coastal protection for the coastal segments they consider… And in Figure 3, the losses probably go to zero for low return period thanks to protection (even non-reinforced coastline are often assumed to provide protection against the 2-yr return period event).
This limit should not affect their assessment for the 100-yr flood, since it seems realistic that the considered coastline does not benefit from a protection beyond the 100-yr event. In short, the paper could be clearer on the role of artificial protection and mention this limit upfront (including in the abstract and Table 1). Another way of evaluating the value of coral reefs through flood protection would be to assess the cost of building infrastructure to reduce the risk by the same amount (even though such infrastructure would deliver much less benefits in other dimensions such as food security, biodiversity, or recreation).
Third, the paper says that a storm can create 1-3m loss of reef (line 284). I guess it mean that the protection provided by the dead coral reef (the one with a 1m loss) would work only once. It seems to me that this is a critical point that is much more important than the difference between current reefs and reefs reduced by 1m – the main difference is that a reef reduced by 1m is dead and therefore will disappear after one or two or three storms, then providing absolutely no protection. If
I’m right, then the main economic cost of dead reefs is not included in the analysis. To get to that, it would be useful to also run the model in the absence of coral reef.
There are also a couple of details. There are a few issues with the equations: line 250, x is not defined (it is defined in the SI). Line 267, T_p does not appear in the equation (also in the SI). Also, the authors should refrain from using acronyms when possible. I think they do not need to replace “flood height” by “FH” – it makes the paper more difficult to read.
Finally, I have to say that I’m not a specialist in hydrological modeling, so I cannot assess the validity of the modeling assumptions on flood extension in the paper.
To conclude, I think the paper makes an important point and that a global analysis like this one has a great value – I hope this paper can be published, after the little issues that I flagged are corrected.
Reviewer #2 (Remarks to the Author):
This manuscript attempts to establish the savings in flood protection afforded by coral reefs. The study is another attempt to ascribe monetary value to one of the ecosystem services provided by coral reefs to highlight their importance. Similar attempts have been attempted for more than a decade including attempts by the World Bank in 2005. The study also attempts to provide a global overview of flood protection savings. While the aim is laudable I believe the results are not novel. I have serious reservations concerning the gross assumptions made in the study and flaws in logic of reef systems that these expose.
1. The assumption made is that globally all reefs will lose 1m of reef due to storms and other impacts. There are several concerns related to this assumption:
a.There is a paucity of literature to back up this assumption. Alvarez et al. (2009) is cited as the main reference to support such changes. This study was limited to the Caribbean only and examined different reef locations. Such conclusions cannot and should not be transferred to other reef systems globally, which has responded very differently to Caribbean reefs over the past century.
Indeed, there are many more studies that have shown that reefs have grown in the past century – why not use those scenarios?
b. The assumption above also assumes that all reefs have a 1m thick veneer of living coral. This assumption is badly flawed. The manuscript does indicate that removal of the reef framework is not considered in the model. This admission undermines the contention that 1m of reef can be removed from all reefs globally. For example, the majority of Pacific reef systems have only a very thin veneer of living coral (0.5 m due to the deposition of rubble as a blanket across the reef surface.
3. The authors claim the model is not of the ‘bathtub’ variety. However, I can find no element in the approach that allows for the landform feedbacks in the system that would potentially offset future flooding.
4. Hydrodynamic modelling. The authors appear to agree with my concerns related to hydrodynamic modelling. They state that the necessary level of analysis to fully understand wave reef interactions "...is only possible at local scales (e.g. bays) using phase resolving models that require high resolution bathymetry and large computational efforts."
The argument being put forward seems to rest on the global scale of the model, which the authors acknowledge is at too coarse a scale to represent wave-reef-coast interactions very well. Furthermore, the authors appear to argue that this model approach is an improvement on other approaches.
I disagree that the paper should be evaluated relative to other large scale flooding models, as asserted by the authors. The substance of the article will have significant international traction. The reef community deserves outcomes that can be relied upon at the reef scale. The admission that the model cannot yield this - would seem to be a fatal flaw.
I fully understand the attractiveness of attempting to value what coral reefs can afford, from multiple angles. However, I am unconvinced that a better, but wrong answer (which the authors acknowledge, due to the computational complexities), is something that should be released to the broader science community.
If this article is to be published I would hope that an honest appraisal is written into the text explaining the hydrodynamic analysis is not accurate due to the coarse scale of the model. On that basis I am unclear what value there is in undertaking the economic impacts assessment?
In summary, I do not believe the authors have addressed my initial concerns. Those elements they have addressed are flawed and in some cases inaccurate.
I maintain my initial recommendation - reject.
Reviewer #3 (Remarks to the Author):
Comments on Manuscript NCOMMS-15-22640B The Global Flood Protection Savings Provided by Coral Reefs
The revised version of the manuscript is improved compared to the original submission, and I commend the authors for this. However, I still have a few comments about the structure of the paper and its contents.
Comments on Introduction First, I still find the introduction unconvincing and scattered. The first paragraph in particular is not convincing. For example, the authors say that “Flooding impacts will worsen given population growth and changes in climate” (Lines 31-32). Is that the case in all locations? Aren’t many places in the world (e.g. Netherlands, U.S. East Coast) preparing for this already and putting in places measures to reduce risk? Also, the authors conclude this paragraph saying that “There is an urgent need to advance risk reduction and adaptation strategies to reduce flooding impacts” (Lines 33-34). But this fact has been recognized since the 70’s when the US Corps of Engineers published the first iteration of the Coastal Engineering Manual. And since then, countless publications have dealt with
this issue. So, it’s unclear why the need to advance risk reduction is urgent. What is so different now from the past? And more importantly, how can this argument be used to discuss coral reefs?
I also have difficulties following the authors in pars 3-5. They seem to be presenting multiple concepts at once, and it’s hard to understand the logic and order of importance of the different concepts presented. First, they say that reef cover and structure is declining (3rd par.). This leads to a claim about potential loss of benefit. But the 4th par. starts with a different claim: there’s a need to quantify the benefits of reefs. This is slightly confusing, because these points are not clearly linked in the text. But then, in the same paragraph, the authors move on to another point: there’s a need to do a global valuation. This last point is interesting, but it’s not justified by the previous paragraph or sentences. And, it’s really not clear why there’s a need to do a global analysis. But my main concern is that these 3 points do not build on each other. These are different concepts: 1- Reef structure declining, leading to a loss of services; 2- Need to value ecosystem services; 3Need to do global analysis (even if I’m not sure why). Following these two paragraphs, the 5th par. brings an entirely new concept, which is that there’s a need for better economic valuation to help better manage risk and ecosystems. Lost are the previous points, especially the one about reef decline. But more confusing is that in the same 5th paragraph, the authors say that the valuation method exists. So, at the end of the introduction, I’m left confused because I wonder why we need another analysis, and a global one. What is so new about the current approach, if methods already exist, and what is the value added by the current analysis?
Other comments: 2nd sentence (L29-30): Simplify and clarify “discounted in development choices”. Line 39: Refs. 18 and 19 do not mention coral reefs. Why do the authors mention them? Line 42: are storms really destructive and negative stressors to reefs? My understanding was that they can help corals reproduce because they fragment existing colonies and help them spread (see Highsmith (1982) “Reproduction by Fragmentation in Corals”). Also, if reefs protect against storms, as claimed in the ms, how can storms also be negative to their survival?
Comments on Results section The authors are trying to make two points: 1- Reefs protect differently in different places, and 2Reefs protect because of rugosity and height. However, I sometimes fail to understand the strength and uniqueness of the points that the authors are trying to make. Regarding point #1, I strongly suggest that the authors improve the description of the results at a global level. In particular, I have difficulties reconciling results on Line 109 with Lines 103-105: how
does finding that reefs provide the most relative benefits to Caribbean and South Pacific regions contrasts with the result that reefs avert the most damage in Indonesia, […] and Mexico (Line 103105). I’m afraid that the distinction between different metrics is too subtle to really understand after a few reads. I think that’s because the different points on lines 105-107; 109-111 and 113-117 all start by stating that reefs provide “flood protection benefits”, but use different units. So it’s hard to understand how “flood protection benefits” are measured, and it’s hard to understand the point the authors are trying to make. Regarding point #2, made in Line 105-107: Isn’t this finding intuitive and obvious, given the extensive literature showing that reef rugosity and depth matters, and that reef protect against storms where there are storms in the first place? What is new about this result?
Other comments: Line 91: Authors can improve the strength of their argument by saying more clearly that keeping corals and reefs yields to smaller losses than if all lost. The current structure of the sentence downplays the importance of reefs. Line 96: Maybe say “At a national scale” instead of nationally? Line 97: It is difficult understand the distinction between “for some countries” versus “for many countries”. Maybe give number or percentage? Line 98: Maybe say “for more than 200,000 people”, instead of “by more …”? Lines 98-99: What is the approximate avoided loss value for the other countries? And the number of people protected? Line 103: “because of reef loss” instead of “with reef loss”?
Comments on Discussion Section Overall, I strongly suggest that the authors re-organize this section to focus on the main points. In particular, I find the discussion on uncertainty (starts at Line 142) too long and distracting. Maybe move some of it to the Methods section? More importantly, apart from the amount of effort that went into this paper (Line 152), I find the significance of the results lacking. As mentioned before, the fact that rugosity and height are important is not new (Line 121). I suggest the authors provide references where similar results have been found (see Ferrario 2014; Sheppard 2005, … ), but also explain more why the results in the present paper are so different from existing work. I also suggest that some of the content in the paragraph starting Line 152 be moved to the Methods section.
Comment on Method Section
Wave Climate (Paragraph starting line 237): It’s unclear if storms are included. The datasets provided were created at such a scale that it is doubtful that they contain any hurricane information Are they included in the tide data, if so, please clarify. Line 271: m is the foreshore slope, not the slope from the shore to the foreshore Line 273-274: Stockdon et al. didn’t use reef profiles in their paper. So I’m confused by the distinction between setup and swash processes in this paragraph. And it’s doubtful that the setup predicted by this formula compares well in reef environment, given the work that Lowe et al. did to show the importance of reef structure on setup. I strongly suggest revisiting this paragraph. Line 275: Do waves always break offshore of the reef? What about barrier reefs, where waves break on the reef face? How does the runup compares to, say, estimates by Gourlay (1996, Coastal Engineering)?
Reviewers' comments: Reviewer #1 (Remarks to the Author): Thanks to the authors for this improved version. It mostly answers my concerns and I think the paper could be published as it is. I have a couple of small suggestions: Page 5, line 83 “reefs provide more benefits for lower intensity frequent storms”: I would add “in relative terms” since the absolute value increases in Figure 3. Also, it may be useful to add a panel to Figure 3 with the effect in percentage point, to show the decrease mentioned in the text. We have amended as follows (note we did not use “relative” as this term was found to be confusing in review 2). Given constraints on figure space, we have put these percent changes in text. Line 85- “For 25-year events, reefs reduce flooding for more than 8,700 km2 of land and 1.7 million people, and provide $36 billion in avoided damages to built capital (Figure 3, See SI Figure S2). For 100-year events, the topmost 1m of reefs provide flood reduction benefits that result in $130 billion in avoided damages (Figure 3). Without reefs, damages would increase by 90% for 100-year events and a 141% for 25-year events.” At the end of the introduction, the authors may want to add a couple of sentence recognizing that a global assessment cannot get to the level of detail that a local analysis can afford. This may help answer the concerns of the second referee. We have added some discussion as follows. Line 155- “Our coastal flooding analyses have several significant, combined improvements over other recent global flooding analyses2,5,6 including the downscaling to a 90m resolution; consideration of hydraulic connectivity in the flooding of land; the use of 30 years of wave, surge, tide and sea level data; reconstruction of the flooding height time series and associated flood return periods49; inclusion of nearshore bathymetry and reef profiles; and the use of country-specific adjustments to allocate GDP per person. Major remaining constraints for global coastal flooding models include the consideration of flooding as a one-dimensional process and the difficulty in representing flooding well in smaller islands. The application of a one-dimensional model neglects some of the hydrodynamics that occur on natural reefs, such as longshore flow and lagoon circulation. However, this 1-D approach is common in reef studies, either with the same wave action balance equation use here or in more complex numerical hydrodynamic studies15,41,45,50-53. Flood models based on the wave action balance equation are widely employed for coastal modeling54. The consideration of non-linear effects is only possible using phase resolving models (e.g., XBeach) at local scales (e.g., bays)12,15,55,56. This modeling approach is not feasible at the global scale because of computational capacity and the lack of high resolution bathymetric data and especially if risk is to be evaluated in terms of annual expected damages. We have shown that the wave propagation approach in our global reef flooding model performs very well when considered against the results of one of these phase resolving models (see SI and Figure S7). Further the changes in flooding in our global model are consistent with changes observed in a site-validated, XBeach model that also considers flooding with changes in reef friction and sea level15.”
As a side note, I’ve been in the authors’ shoes a few times, with reviewers doing local and highresolution analysis expressing concerns about a global analysis that by construction cannot get to the same level of details. While I am not a specialist of the issues at stake in the comments of the second reviewer, I would like to support the authors. While local high-resolution studies are critical, they do not replace global assessments based on simpler methodologies. We do need a hierarchy of studies, from global to local scales, and from simple to complicated models. While the global studies will have to make simplifications (for reasons related to data availability to computation requirements), they can add a lot of value in terms of research, and in practical terms they are very valuable to identify hop spots and quantify the issues. And research is iterative: the authors or other scholars (maybe the second reviewer?) may be able to start from the proposed study and improve it by adding more mechanisms and better data. While reviewers cannot ask global studies to be as detailed as local one, they must ask authors to be very clear on the assumptions and simplifications. On this, I feel that the authors are doing a great job, and their study is very transparent. I think the results of the sensitivity analysis should be better communicated. In particular, I could not find the impact of various assumptions on the economic assessments. It would bring a lot of confidence in the results if the authors could show that different assumptions do not completely change their results. I’m not sure how the changes in run-up would translate into changes in economic losses due to coastal floods. We have provided extensive sensitivity analyses and have added new validation of the flooding models. We mainly report the sensitivity analysis results in terms of % change in flood height or run-up because these are the key outputs from the models. The other results for example for people and built capital are generated from GIS overlays of the flooded area. And it would be useful to include other uncertainties – for instance the assumption that 50% of the value of a building is lost when flooded by a 1-meter flood is probably acceptable for many buildings in developing countries, it may not be the case for modern buildings (especially because many buildings in places that are regularly flooded have stilts or do not fully use the ground floor to minimize losses). The value of 50% may be even more overestimated since the “flood” is here defined by the wave height – not as the level of permanent flooding. So the authors’ assumptions is different from most flood vulnerability curves, which use the permanent water level as an input (not the wave height). I would suggest to the authors to stress test their results to this assumption. We already test sensitivity to this damage coefficient as follows. (line 370) “Assessing Damages and Estimating Annual Benefits. We followed existing approaches for assessing the damages to built capital as a function of the flooding level6. We calculated the percentage of built capital that has been damaged (D) for a given flooding level and a certain coefficient that must be calibrated as D(h) = h/(h +k). This curve indicates that as flooding level increases, the percent of damages to built capital also increases. While there is debate about the right k to choose, we have followed others in using k = 0.56, which means that the built capital flooded at 1m of depth loses 50% of its value.” (Line 407) “We also did sensitivity analyses on the damage function model with other parametrizations of k (k = 0.2, 0.3, 0.4). Lowering k lowers the total value of the built capital damaged, but has little effect on the relative effectiveness (% difference) of reefs for risk reduction. Lower k values slightly
increase the relative effectiveness of reefs making our use of k = 0.5 the most conservative for comparisons.” Reviewer #2 (Remarks to the Author): Thank you for forwarding the revised manuscript for my reconsideration. To answer your question directly I do not believe the amendments have adequately responded to my concerns in the revision. I highlight several specific elements in this regard. 1. Loss of reef elevation. The authors state that globally there is widespread consensus that reefs are degrading. It is true that the weight of published material does suggest that the proportion of living coral is decreasing. The authors further assert that coral degradation and structural reef loss are one in the same. This is not the case. The authors have increased the number of references to support this statement. However, they do not all measure reef loss. The Alvarez article certainly does. However, the Perry and Morgan article simply infers this might be an outcome but present no quantitative data to support this. Only include articles that actually measure structural loss. Many articles suggest this might be an outcome but fail to demonstrate this. We have provided the references as previously requested by the reviewers. The evidence is quite clear; reefs are dying globally and where measured the die-offs are shown to affect the height and complexity of reefs; this should not be that surprising given these die offs particularly affect shallow corals and often the large branching and boulder corals. We believe that Perry and Morgan is a valid reference as indicated by this excerpt from their abstract (we highlighted key text in bold). ”Resultant coral bleaching caused an average 75% reduction in coral cover (present mean 6.2%). Most critically we report major declines in shallow fore-reef carbonate budgets, these shifting from strongly net positive (mean 5.92 G, where G = kg CaCO3 m−2 yr−1) to strongly net negative (mean −2.96 G). These changes have driven major reductions in reef growth potential, which have declined from an average 4.2 to −0.4 mm yr−1. Thus these shallow fore-reef habitats are now in a phase of net erosion. Based on past bleaching recovery trajectories, and predicted increases in bleaching frequency, we predict a prolonged period of suppressed budget and reef growth states. This will limit reef capacity to track IPCC projections of sea-level rise, thus limiting the natural breakwater capacity of these reefs and threatening reef island stability. (Perry and Morgan 2017).
2. I raised a specific concern related to the nature of wave breaking with reefs and the fact that across much of the Indo-Pacific the zones of critical wave breaking is depauperate of coral (comment 1c). The authors respond with: “There is clear evidence that storms globally damage and remove massive corals including in the IndoPacific, which are cited in the paper). This indicates that reefs and reef height are regularly being impacted in areas critical for wave breaking and flood reduction (because wave energy is removing large corals).” This response represents a complete lack in understanding of the nuances between individual coral growth and reef platform development and change, which is at the heart of the scenarios developed. Simply because a storm may pluck corals from the forereef does not equate to structural loss of reef surfaces. Indeed in Cyclone Bebe, extreme waves removed more than 1 million cubic metres of coral and rubble from the forereef of Funafuti atoll. This material was spread across the reef platform surface. The net effect was to increase the reef surface by >0.5 m due to the deposition of rubble as a blanket across the reef surface.
We have addressed these concerns thoroughly. We have further clarified the ‘with’ and ‘without reefs’ scenarios and indicated that (i) these scenarios are needed for a valuation, (ii) a 1m loss is conservative relative to many other examples of services assessments which assume entire loss of habitats; (iii) identified that this scenario is not meant to be a prediction of site-specific reef trajectories, and (iv) provided a clear sensitivity analysis of how changes in bathymetry can affect the results. And we have included additional key citations on coral reef condition and reef height globally to show that there is significant loss of corals and reef substrates across reef habitats and regions. We do not dispute that it is possible at some specific sites that reef height can increase from rubble deposition, earthquakes and even coral growth. But the preponderance of the evidence is clear from every regional or global study; reefs are dying and being eroded. 3. The authors claim the model is not of the ‘bathtub’ variety. However, I can find no element in the approach that allows for the landform feedbacks in the system that would potentially offset future flooding. No global model of flooding, including those published recently in the Nature family, include landform feedbacks; it is not possible to do so globally. We do however make a major advance over most prior global flooding by advancing past bathtub models to one that uses hydraulic connectivity to flood land. Line 352 – “We extended the flood heights inland by ensuring hydraulic connectivity between points at a 90m resolution; a significant advance over more common bathtub approaches in earlier global flooding models. From the flooding levels and flooding extent, we calculated the total area of land affected and damages at each study unit. Flooding maps were also intersected with population data67 after resampling from the original 1 km resolution to the 90 m of the digital elevation model.”
4. Hydrodynamic modelling. The authors appear to agree with my concerns related to hydrodynamic modelling. They state that the necessary level of analysis to fully understand wave reef interactions "...is only possible at local scales (e.g. bays) using phase resolving models that require high resolution bathymetry and large computational efforts." The argument being put forward seems to rest on the global scale of the model, which the authors acknowledge is at too coarse a scale to represent wave-reef-coast interactions very well. Furthermore, the authors appear to argue that this model approach is an improvement on other approaches. I disagree that the paper should be evaluated relative to other large scale flooding models, as asserted by the authors. The substance of the article will have significant international traction. The reef community deserves outcomes that can be relied upon at the reef scale. The admission that the model cannot yield this - would seem to be a fatal flaw. I fully understand the attractiveness of attempting to value what coral reefs can afford, from multiple angles. However, I am unconvinced that a better, but wrong answer (which the authors acknowledge, due to the computational complexities), is something that should be released to the broader science community. If this article is to be published I would hope that an honest appraisal is written into the text explaining the hydrodynamic analysis is not accurate due to the coarse scale of the model. On that basis I am
unclear what value there is in undertaking the economic impacts assessment?
We appreciate that the reviewer now notes “The substance of the article will have significant international traction.” It has been our experience that many scientists and leaders are keenly interested in these results, because they have never seen anything like them before at the scale and rigor that we provide. We now show more clearly that the models that we use at the global scale follow the same or similar approaches that are commonly used for site-specific reef studies – i.e., at the “reef scale”. Further we provide a direct comparison between our model and a more complex, site-specific model of the type called for in review 2. We show that our model performs well and that the results are consistent with other published papers that also rely on similar cross-shore profile approaches (i.e., 1-D) to study the hydrodynamics of coral reefs at sites. We address these concerns as follows; Line 155 – “Our coastal flooding analyses have several significant, combined improvements over other
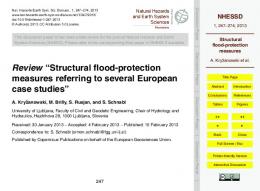
recent global flooding analyses2,5,6 including the downscaling to a 90m resolution; consideration of hydraulic connectivity in the flooding of land; the use of 30 years of wave, surge, tide and sea level data; reconstruction of the flooding height time series and associated flood return periods49; inclusion of nearshore bathymetry and reef profiles; and the use of country-specific adjustments to allocate GDP per person. Major remaining constraints for global coastal flooding models include the consideration of flooding as a one-dimensional process and the difficulty in representing flooding well in smaller islands. The application of a one-dimensional model neglects some of the hydrodynamics that occur on natural reefs, such as longshore flow and lagoon circulation. However, this 1-D approach is common in reef studies, either with the same wave action balance equation use here or in more complex numerical hydrodynamic studies15,41,45,50-53. Flood models based on the wave action balance equation are widely employed for coastal modeling54. The consideration of non-linear effects is only possible using phase resolving models (e.g., XBeach) at local scales (e.g., bays)12,15,55,56. This modeling approach is not feasible at the global scale because of computational capacity and the lack of high resolution bathymetric data and especially if risk is to be evaluated in terms of annual expected damages. We have shown that the wave propagation approach in our global reef flooding model performs very well when considered against the results of one of these phase resolving models (see SI and Figure S7). The changes in flooding in our global model also are consistent with changes observed in a site-validated, XBeach model that also considers flooding with changes in reef friction and sea level15.” Supplementary Information Line 308 – “Validation of the wave and flooding model. Our physical modeling approach relies on linear wave theory to calculate the effect of reefs on waves and wave setup. We use a modification of an empirical formula to estimate the swash component of run-up (see above) that was originally calculated for beach environments. Models based on the same equation (e.g., SWAN) have been used to study the effect of reefs on flooding at regional scales28,65,66. More complex but still 1D models have been used for the study of the hydrodynamics of coral reefs in more detail at specific sites and they also use transect-based approaches42. We compare and validate our modeling approach against a more complex model for reef environments, XBeach43,67 in a theoretical fringing reef profile. The comparison was performed in a frictionless setting to focus on comparisons of wave breaking and run-up. XBeach was originally derived from sandy beaches and has
hitherto been successfully applied to predict erosion and overwash under hurricane forcing68 and more recently, successfully applied in reef environments42,43. We considered three different reef depths or sea levels (0, 1.5 and 3m) and three different offshore significant wave heights (1, 3 and 6m) and estimated flood height at the shore with each model. The comparison shows that the flood height values of our approach are comparable to those from a higher resolution model (Figure S7, r2=0.978) given the simple geometries that are characteristic of the global bathymetric data.“
Flood Height at Shore (m) 5
X‐BEACH
4
3
2
1
0 0
1
2
3
4
5
Global MODEL
Supplementary Figure S7: Comparison of flood height at the shore predicted by XBeach and the global model in this paper. We examined results for a fringing reef profile under 3 different reef depths (0, -1.5m, - 3m) represented by the different colors and three different significant wave heights (Hs= 1, 3 and 6m).
In summary, I do not believe the authors have addressed my initial concerns. Those elements they have addressed are flawed and in some cases inaccurate. I maintain my initial recommendation - reject.
Reviewer #3 (Remarks to the Author): Comments on Manuscript NCOMMS-15-22640B The Global Flood Protection Savings Provided by Coral Reefs The revised version of the manuscript is improved compared to the original submission, and I commend the authors for this. However, I still have a few comments about the structure of the paper and its contents. Comments on Introduction First, I still find the introduction unconvincing and scattered. The first paragraph in particular is not convincing. For example, the authors say that “Flooding impacts will worsen given population growth
and changes in climate” (Lines 31-32). Is that the case in all locations? Aren’t many places in the world (e.g. Netherlands, U.S. East Coast) preparing for this already and putting in places measures to reduce risk? Also, the authors conclude this paragraph saying that “There is an urgent need to advance risk reduction and adaptation strategies to reduce flooding impacts” (Lines 33-34). But this fact has been recognized since the 70’s when the US Corps of Engineers published the first iteration of the Coastal Engineering Manual. And since then, countless publications have dealt with this issue. So, it’s unclear why the need to advance risk reduction is urgent. What is so different now from the past? And more importantly, how can this argument be used to discuss coral reefs? The citations provided in this paragraph (including Nature Climate Change papers) provide very clear evidence for the statements we make; flood risks are rising and must be addressed. We agree that the problem of flooding is not new but there are widespread concerns globally about the problem (they are regularly discussed in popular media).
I also have difficulties following the authors in pars 3-5. They seem to be presenting multiple concepts at once, and it’s hard to understand the logic and order of importance of the different concepts presented. First, they say that reef cover and structure is declining (3rd par.). This leads to a claim about potential loss of benefit. But the 4th par. starts with a different claim: there’s a need to quantify the benefits of reefs. This is slightly confusing, because these points are not clearly linked in the text. But then, in the same paragraph, the authors move on to another point: there’s a need to do a global valuation. This last point is interesting, but it’s not justified by the previous paragraph or sentences. And, it’s really not clear why there’s a need to do a global analysis. But my main concern is that these 3 points do not build on each other. These are different concepts: 1Reef structure declining, leading to a loss of services; 2- Need to value ecosystem services; 3- Need to do global analysis (even if I’m not sure why). Following these two paragraphs, the 5th par. brings an entirely new concept, which is that there’s a need for better economic valuation to help better manage risk and ecosystems. Lost are the previous points, especially the one about reef decline. But more confusing is that in the same 5th paragraph, the authors say that the valuation method exists. So, at the end of the introduction, I’m left confused because I wonder why we need another analysis, and a global one. What is so new about the current approach, if methods already exist, and what is the value added by the current analysis? We have made some revisions to the introduction though we also believe that these points represent editorial differences. The topic sentences for every paragraph in the introduction are below; we believe that these present a clear and coherent argument and that the paragraphs back up these points. 1. “The economic impacts of coastal flooding are substantial1,2.” 2. “Coral reefs serve as natural, low-crested, submerged breakwaters, which provide flood reduction benefits through wave breaking and wave energy attenuation.” 3. “Reefs have experienced significant losses globally in living corals and reef structures from coastal development; sand and coral mining; overfishing and destructive (e.g., dynamite) fishing; storms; and climate-related bleaching events8,20-23.” 4. “Although reefs and other coastal habitats can provide flood protection benefits, they are rarely accounted for directly in coastal management, because these services are not quantified in terms familiar to decision-makers, such as (loss of) annual expected benefits12.”
5.”Better valuations of the protection services from coastal habitats could inform decisions to meet multiple objectives in risk reduction and environmental management35-38.” 6. “Natural flood protection benefits are amenable to spatially-explicit quantification, because of the broader work on assessments of flood risks and artificial coastal defenses.” 7. “Using process-based flooding models, we estimate the annual expected benefit of coral reefs for protecting people and property globally.”
Other comments: 2nd sentence (L29-30): Simplify and clarify “discounted in development choices”. Instead of “these risks are being excessively discounted in development choices” we now more simply say “these risks are often discounted in development choices”. We believe it was the term “excessively”, which was most confusing. Line 39: Refs. 18 and 19 do not mention coral reefs. Why do the authors mention them? We include these references because the sentence points to “reefs and other coastal habitats” “The flood reduction benefits of coral reefs and other coastal habitats are predicted to be high and even cost effective in comparison to traditional approaches13,17-19. “ Ref 18 only covers wetlands, but ref 19 does cover coral reefs. Line 42: are storms really destructive and negative stressors to reefs? My understanding was that they can help corals reproduce because they fragment existing colonies and help them spread (see Highsmith (1982) “Reproduction by Fragmentation in Corals”). Also, if reefs protect against storms, as claimed in the ms, how can storms also be negative to their survival? It is appropriate to include storms as a factor that impact reefs and we think it would be an oversight not to. We state “Reefs have experienced significant losses globally in living corals and reef structures from coastal development; sand and coral mining; overfishing and destructive (e.g., dynamite) fishing; storms; and climate-related bleaching events8,20-23. “ References such as De’ath at all (ref 22, PNAS ‘12) clearly show that it is critical to consider impacts from storms (excerpt from their abstract below- bold text ours)–
“Based on the world’s most extensive time series data on reef condition (2,258 surveys of 214 reefs over 1985–2012), we show a major decline in coral cover from 28.0% to 13.8%(0.53%y−1), a loss of 50.7% of initial coral cover. Tropical cyclones, coral predation by crown-of-thorns starfish (COTS), and coral bleaching accounted for 48%, 42%,and 10% of the respective estimated losses, amounting to 3.38% y−1 mortality rate.”
Comments on Results section The authors are trying to make two points: 1- Reefs protect differently in different places, and 2- Reefs protect because of rugosity and height. However, I sometimes fail to understand the strength and uniqueness of the points that the authors are trying to make. We focus on the most rigorous sub-national, national and global values of the annual expected social and economic benefits of reefs; these results are unique and there are not any other papers close to ours in the rigor and geographic scale of the estimation of a marine ecosystem service.
Regarding point #1, I strongly suggest that the authors improve the description of the results at a global level. In particular, I have difficulties reconciling results on Line 109 with Lines 103-105: how does finding that reefs provide the most relative benefits to Caribbean and South Pacific regions contrasts with the result that reefs avert the most damage in Indonesia, […] and Mexico (Line 103-105). I’m afraid that the distinction between different metrics is too subtle to really understand after a few reads. I think that’s because the different points on lines 105-107; 109-111 and 113-117 all start by stating that reefs provide “flood protection benefits”, but use different units. So it’s hard to understand how “flood protection benefits” are measured, and it’s hard to understand the point the authors are trying to make. We have clarified further that at a national level you can consider impacts in 1. Absolute terms – e.g., total dollar value of national avoided losses from reefs. 2. Relative terms – e.g., total dollar value of national avoided losses from reefs per GDP (i.e., relative to the size of the national economy). We have clarified as follows. Line 103 “The national benefits of reefs for flood protection can be considered not just in total built capital and people protected but also relative to the size of the national economy (Table 1) and population (Tables S1, S2). These results highlight the importance of reefs to many smaller island nations in the Caribbean and the South Pacific, which receive significant benefits relative to their Gross Domestic Product (GDP) (Table 1). The flood protection benefits of coral reefs are particularly critical in the Philippines, Malaysia, Cuba and the Dominican Republic (Table 1). In these countries, reefs are important for averting damages both to built capital overall (total dollar value of national avoided losses) and relative to the size of their economies (i.e., total dollar value of national avoided losses/GDP).”
We do not believe that this is a subtle difference and it fundamentally underlies for example why nations globally care about small, developing nations with regards to flooding and climate change. For example, the impacts of flooding on the Maldives are frequently discussed in popular media such as the NY Times (e.g., March 30, 2017) not because of the absolute number of people impacted (very small in total numbers) but because a huge amount of the country will be affected in relative terms (potentially 100% of the national population).
Regarding point #2, made in Line 105-107: Isn’t this finding intuitive and obvious, given the extensive literature showing that reef rugosity and depth matters, and that reef protect against storms where there are storms in the first place? What is new about this result? “Overall the hotspot areas where reefs provide the most flood protection benefits are in storm belts with extensive, shallow and rugose coral reefs; land at low elevation; and assets concentrated on the coast (Figure 5).” We agree that this point is clear and obvious. We are stating the main factors that underlie our findings; it is a relevant statement for the results. Further we do not think this point is actually made very often because there are very few analyses that quantitatively consider these factors together- and none anywhere close to the scale we consider.
Other comments:
Line 91: Authors can improve the strength of their argument by saying more clearly that keeping corals and reefs yields to smaller losses than if all lost. The current structure of the sentence downplays the importance of reefs. We have added to the point as suggested. “Future sea level rise will increase risks, and these risk will be even greater if reefs are lost too (Figure 4).” Line 96: Maybe say “At a national scale” instead of nationally? We made this change. Line 97: It is difficult understand the distinction between “for some countries” versus “for many countries”. Maybe give number or percentage? We have clarified as follows… Line 96- “At a national scale, reefs provide annual expected benefits of hundreds of millions of dollars in avoided flood damages for five countries and millions of dollars in annual benefits for more than 20 additional countries (Table 1).” Line 98: Maybe say “for more than 200,000 people”, instead of “by more …”? In the previous reviews, reviewer 1 explicitly asked that we do the opposite (say “by more” instead of “for more”). We feel that both actually mean the same thing. Lines 98-99: What is the approximate avoided loss value for the other countries? And the number of people protected? All of these values are expressed in the tables cited in this paragraph (i.e., Tables 1 & S1). Line 103: “because of reef loss” instead of “with reef loss”? We have revised this sentence to focus on current benefits. Line 113 “The places where reefs avert flood damages to people are more widespread geographically (See SI, Figure S1),” Comments on Discussion Section Overall, I strongly suggest that the authors re-organize this section to focus on the main points. In particular, I find the discussion on uncertainty (starts at Line 142) too long and distracting. Maybe move some of it to the Methods section? More importantly, apart from the amount of effort that went into this paper (Line 152), I find the significance of the results lacking. As mentioned before, the fact that rugosity and height are important is not new (Line 121). I suggest the authors provide references where similar results have been found (see Ferrario 2014; Sheppard 2005, … ), but also explain more why the results in the present paper are so different from existing work. I also suggest that some of the content in the paragraph starting Line 152 be moved to the Methods section. We appreciate these comments and we have done a better job of highlighting the key results up front. We agree with the review that some of these core points got buried behind the many other points we were asked in prior reviews to address in the discussion.
We agree that the discussion on uncertainty is still longer than that required for other global flooding analyses, but we have been asked to provide this level of detail in response to the other reviews. We are much clearer on the novel findings and the rigorous and direct valuation of social and economic benefits. We note that reef height and rugosity are important factors in estimating this benefit, but they are only one part of the extensive data gathering and modeling required to achieve the key results in this paper.
Comment on Method Section Wave Climate (Paragraph starting line 237): It’s unclear if storms are included. The datasets provided were created at such a scale that it is doubtful that they contain any hurricane information Are they included in the tide data, if so, please clarify. Storms are included in the wave climate data, but in some areas the effects of hurricanes are underestimated. This has been extensively analyzed by some of our co-authors (see Figure 5 in Reguero et al. 2015). In text we note that Line 245“Storms are generally captured well in these wave data though the wave heights in some of the hurricane events can be underrepresented61,72.”
Line 271: m is the foreshore slope, not the slope from the shore to the foreshore We have extensively revised these sections to clarify these models and the parameter estimation as indicated fully in our response in the next comment. Line 273-274: Stockdon et al. didn’t use reef profiles in their paper. So I’m confused by the distinction between setup and swash processes in this paragraph. And it’s doubtful that the setup predicted by this formula compares well in reef environment, given the work that Lowe et al. did to show the importance of reef structure on setup. I strongly suggest revisiting this paragraph. We agree that Stockdon does not use reef profiles. We identified an approximation for assessing run-up in reef environments using Stockdon (starts line 266). This approach was the best given the existing bathymetric data. We have now added a validation of this approach against a more complex non-linear wave model and showed that this approximation is reasonable (and added to methods and Supplementary Information- also noted above). We also make very clear in the Discussion that approaches like that proposed by Lowe are not feasible beyond a few locations because of the lack of high resolution bathymetric data (relevant for all flooding models) and computational capacity. Below we have provided the revised sections from the Methods in the mss. The methods in the Supplementary Information go in to even further detail. Line 258- “Nearshore hydrodynamics: (b) reef wave model. Wave propagation over the reef is calculated from linear wave theory. Wave propagation is modeled at shore-perpendicular one-dimensional transects therefore processes such as longshore currents, are neglected. The evolution of a wavefield of root-mean square (rms) wave height H with weak mean currents is computed by solving the wave energy balance equation:
(1)
where Ew is the wave energy density and Cg the group velocity. The dissipation of wave energy flux is caused by wave breaking (Db), bottom friction (Df ), and the presence of vegetation in the water column (Dv), which is not considered in this study. Equation (1) is widely applied in coastal studies to assess wave propagation (e.g. SWAN)77 and previously applied to reef environments50. Db and Df are expressed following Thornton and Guza78: √
∙
√
∙
∙
∙ ∙
∙
(2)
∙
(3)
where is water density, g the constant of gravity, k the wave number, the wave frequency and fp the peak frequency. The breaking coefficient B and breaker index have the default values of 1.0 and 0.78 and the bottom friction coefficient fw is taken as 0.01 for sand beds64,78. In our model, we implement recent studies on wave transformation by coral reefs16,79 and replace the breaker index (B) by an expression where h/H provides the relationship between water depth and wave height at breaking conditions: 0.23 ∙
2.3143 ∙ 1.4
3.6522 0
2.8 (4)
Nearshore hydrodynamics: (c) total water level model. The total water level (i.e., flood height) along shorelines is a function of mean sea level, astronomical tide, storm surge, and the run-up of waves80.The run-up represents the wave-induced motion of the water’s edge across the shoreline and is built of two contributions, namely the wave setup at the shoreline and the swash representing oscillations about the setup. The run-up calculation requires obtaining the local wave conditions at the shoreline using the reef wave model above. Nearshore hydrodynamics: (d) computation of wave setup. The wave-setup can be obtained from the conservation of mass and the momentum equations 81. In our one-dimensional setting, the computation of the wave-induce setup is based on the vertically integrated momentum balance equation82. Similar implementations have been used in previous work to evaluate the effect of vegetation on wave-induced setup 45 and in coral reef environments83. Nearshore hydrodynamics: (e) computation of wave runup. The 2% exceedance level of wave runup maxima generated by random wave fields on open coast sandy beaches was estimated in Stockdon et al84 as: _
1.1 ∙ 0.35
.
.
1.1 ∙
̅
(5)
where H is the offshore significant wave height, L represents the deep-water wave length, T the peak period, and m the bathymetry slope in the foreshore beach slope. This equation expresses runup as a function of empirical estimates of incident wave setup at the shoreline ̅ and the swash incident and infragravity band frequency band components (Sinc, Sif , respectively). For the swash component (i.e., the second term in the equation), there is no specific formulation for reef environments. Here, we apply a modification of this second term to find the contribution of the swash to the total water level. First we calculate the breaking point (hb) from the reef wave model and the dissipation of waves to define the surf zone from that point to the shore; (ii) then in the ‘surf zone’, we calculate the equivalent slope, m*, as if it were a beach profile; and (iii) using slope m*, we calculate the offshore wave height, Ho*, which will give this same wave breaking point (hb), and we use this Ho* in equation 5 (see SI). This modification assumes that the processes in the surf zone that control wave runup are similar in our reef profiles to a beach profile with similar surf zone slope. Modifications of the same formula have been applied previously to estimate the effect of vegetated ecosystems on runup45. Extreme water levels and flood height time series reconstruction
From the propagations of waves and the calculation of total water levels onshore (above), the reconstruction of the flood height time series at the most onshore points is based on multi-dimensional interpolation techniques66. We apply a Peak Over Threshold method to select extreme flood heights and fit a General Extreme Value Distribution85 to obtain the flood heights associated with the 10-, 25-, 50- and 100-year return periods. The methodology has been tested in case studies and validated with observations86,87.”
Line 275: Do waves always break offshore of the reef? What about barrier reefs, where waves break on the reef face? How does the runup compares to, say, estimates by Gourlay (1996, Coastal Engineering)? Waves do not always break offshore of the reef. We find the breaking point of waves from the propagation of each sea state and for each profile (see Methods in prior comment). The breaking points depend on wave height, periods, surge, mean sea level and geometry of the profile. Thus some breaking point occur offshore of the reef, others inshore, as determined by the site-specific geometry and sea states. From the wave propagation, we calculate the setup, consistent with Gourlay 1996a,b from the propagation of each sea state, and then apply the runup equation from each breaking point shorewards (after the breaking). The application of the runup formula, originally parameterized for dissipative beaches, is only applied in the surf zone (after the breaking point), assuming the reef runup zone resembles the runup in an equivalent beach with similar slope (see above). We have validated this approach with simulations in XBeach as noted in previous responses.
Reviewers' comments:
Reviewer #1 (Remarks to the Author):
Thanks for the revised version of the paper.
I like the paper, which is clear and well-written, and very open on the limits of the analysis.
I find the criticisms from reviewer #2 misguided. One cannot apply the same evaluation criteria to a global and a local study. And it is well documented how global and local studies build on each other and contribute to better knowledge. All global studies can be accused of not considering enough the local details (the same can be said of all local studies). But all local studies can be said to lack broader significance beyond the considered system. Only a combination of the two approaches can provide us with the information we need to better understand the issues at stake. So I would favor publication of the paper.
Maybe an addition that could satisfy the criticism of reviewer #2 is a more systematic comparison of the approach used at the global scale and the more sophisticated analyses possibly at the local level. One could imagine a table with a row per "module" of the model (the subsections of the Method section), and one column for the global model used here, and one column for the "best practice" in local analysis. (And possibly a column what what's not included or represented in local studies.) Such a table would clearly show the limitations of the paper, but would also be very useful for the community, flagging where progress is still needed.
Reviewer #2 (Remarks to the Author):
This is the third time I have reviewed this manuscript. I have raised a number of concerns with this paper in past responses. Some of these concerns have been addressed by the authors.
In response to the above questions I am not convinced it will influence thinking in the field. The global community is convinced of the value of reefs as coastal protection structures that mitigate impacts on coastal communities. This paper reinforces this widely held belief.
More specifically, I am pleased to see the manuscript contains a more nuanced discussion of the strengths and weaknesses of the modelling approach. This provides clarity for the reader in how realistic the results are. I accept they have now highlighted the weaknesses in the manuscript. It would be nice to see further discussion on what these weakness might imply for site specific analyses.
I believe there are two broader issues that need to be refined.
1. It is still asserted that there is a global reef flattening (line and repeated in line 181). This is simply not the case. There are a few studies that report this in isolated places. There are still many more locations where reef flattening has not been observed and indeed reefs are still accreting. The Perry paper used to support this statement does not even examine reef top accretion. It examined the health of the reef in isolated locations on the forereef slope. The ecological conditions of this zone are distinctly different to the coral-algal reef rim…which is still healthy and accreting. A close reading of the Sheppard et al paper also shows they did not measure structural loss, but rather inferred such changes.
I think the solution here is to note that reef response will be spatially variable. In some places there is, and may be, structural loss…...in others there is not. Consequently, the flood risk problem will scale dependent on the likely reef trajectory. I think this provides a more interesting discussion element than a blanket rule about future responses. It is grossly misleading to indicate reef flattening is a global phenomenon.
Line 179. A 1m change in reef profile is not modest.
2. Management implications I understand the rationale of the manuscript and consequently the call for improved management of reefs to offset damages to communities. However, surely the manuscript also needs to acknowledge that an equally sensible strategy to avoid flood impacts is to reconsider how communities have developed and settled the low-lying coastal fringe? How should they adapt??
Reviewer #4 (Remarks to the Author):
I have carefully read the revised paper, the reviewers' comments and the authors’ responses to the comments. I am finding myself agreeing with Reviewer 2 and see limited use of this global approach to quantifying the value of coral reef systems for coastal protection. I agree that the approach is too crude to deliver meaningful results and I am also somewhat puzzled by the methodology. For example, wave transformation is carried out, but Stockdon equation uses deep water wave conditions, and was developed for 'planar' beach profiles. Additionally, I do not see proper consideration of the water levels and how, say, the 1:100 year wave condition is associated with the water level. Wouldn’t this warrant some sort of joint probability approach? I think the problem here is that, due to this being a Nature group publication, the methodology is very much truncated, making it difficult for the reader to fully comprehend the approach followed and the assumptions underpinning this modelling exercise.
With respect to the comments of Reviewer 3, the authors appear to have responded to most comments, but, really, Reviewer 3 should be asked whether they are happy with the response. I fully agree with Reviewer 3 that the conclusion ‘Overall the hotspot areas where reefs provide the most flood protection benefits are in storm belts with extensive, shallow and rugose coral reefs; land at low elevation; and assets concentrated on the coast’ is profoundly unsurprising.
I see the point made by Reviewer 1 that one can always criticise the global approach as being too simplistic and that there is a place for such approaches. But, is the Nature Group the correct outlet for such publications? Based on past evidence it clear is, as there are a plethora of such global-reach papers. Generally, they are not particularly rigorous, nor very insightful in terms of providing novel insights; however, they do make for good media soundbites and that is what seems to drive these publications: citability rather than scientific rigour and/or novelty. I believe this is an editorial decision, but in my view the quality of this paper does not meet the high standards I would expect of a Nature group publication.
Reviewers' comments: Reviewer #1 (Remarks to the Author): Thanks for the revised version of the paper. I like the paper, which is clear and well-written, and very open on the limits of the analysis. I find the criticisms from reviewer #2 misguided. One cannot apply the same evaluation criteria to a global and a local study. And it is well documented how global and local studies build on each other and contribute to better knowledge. All global studies can be accused of not considering enough the local details (the same can be said of all local studies). But all local studies can be said to lack broader significance beyond the considered system. Only a combination of the two approaches can provide us with the information we need to better understand the issues at stake. So I would favor publication of the paper. Maybe an addition that could satisfy the criticism of reviewer #2 is a more systematic comparison of the approach used at the global scale and the more sophisticated analyses possibly at the local level. One could imagine a table with a row per "module" of the model (the subsections of the Method section), and one column for the global model used here, and one column for the "best practice" in local analysis. (And possibly a column what what's not included or represented in local studies.) Such a table would clearly show the limitations of the paper, but would also be very useful for the community, flagging where progress is still needed. We appreciate the suggestion from Review 1, and we have provided the Table S4 in the Supplementary Information (line 408) to compare these global and local approaches (this table is also provided further below). We agree that no global study would ever be published if it had to adhere to the type of analyses that could only be done at sites with high resolution data and models. Reviewer #2 (Remarks to the Author): This is the third time I have reviewed this manuscript. I have raised a number of concerns with this paper in past responses. Some of these concerns have been addressed by the authors. In response to the above questions I am not convinced it will influence thinking in the field. The global community is convinced of the value of reefs as coastal protection structures that mitigate impacts on coastal communities. This paper reinforces this widely held belief. We disagree that the global community is generally well aware of these services. We note that none of the reviews has ever pointed to any study like ours; a geographically broad set of ecological, engineering, and economic models, which provides annual expected benefits for habitats. There are only a handful of site-based studies of reef coastal protection (we cite them). None of these site-based papers provides a probabilistic assessment of economic risk. Our assessment of annual expected benefits represents a major advance at any scale. We also wholeheartedly disagree that this work will not influence thinking in the field. We have presented these results widely to leading scientific organizations (e.g., Pew Marine Fellows), development banks (World Bank, German Development Bank), management agencies (e.g., FEMA, USACE), and insurance companies (e.g., Lloyd’s, Munich re, Swiss re). In all cases, they have indicated that nothing like our study exists, and they are keen to use the results when they can be made available. More specifically, I am pleased to see the manuscript contains a more nuanced discussion of the strengths and weaknesses of the modelling approach. This provides clarity for the reader in how realistic the results are. I accept they have now highlighted the weaknesses in the manuscript. It would be nice to see further discussion on what these weakness might imply for site specific analyses. We appreciate the recognition that we have gone to extensive lengths to discuss the benefits and limitations of these global approaches in text and with sensitivity analyses. We have now gone further in addressing them in Table S4 and associated text. We also note that this review has highlighted a major strength in our analyses in the
probabilistic assessment of economic risk (e.g., annual expected benefits), which has not be done at any scale for reefs or mangroves. I believe there are two broader issues that need to be refined. 1. It is still asserted that there is a global reef flattening (line and repeated in line 181). This is simply not the case. There are a few studies that report this in isolated places. There are still many more locations where reef flattening has not been observed and indeed reefs are still accreting. The Perry paper used to support this statement does not even examine reef top accretion. It examined the health of the reef in isolated locations on the forereef slope. The ecological conditions of this zone are distinctly different to the coral-algal reef rim…which is still healthy and accreting. A close reading of the Sheppard et al paper also shows they did not measure structural loss, but rather inferred such changes. At this point, we have added significant references and defended all of our statements about reef degradation and loss. Our points are completely in line with the vast majority of the reef literature. It is true that there is variability in these patterns but the overwhelming signal is clear particularly in areas with significant human development. Review 2 is right that there could be more direct measures of reef height. But there are very many measures of degradation all pointing to a clear and widespread pattern of reef loss. We will also reiterate that our scientific analysis does not assume either what is happening or will happen to reefs. Our analysis only provides a ‘with’ and ‘without’ reefs scenario as required by any valuation of ecosystem services and benefits. We understand that even clear patterns do not mean loss is happening everywhere, and we have acknowledged this fact (see text in italics below). The considerations of reef loss are solely in the Introduction and Discussion; we believe that we have done our due diligence in defending these points and respectfully request that any further points must be considered as differences in opinion about the available literature. I think the solution here is to note that reef response will be spatially variable. In some places there is, and may be, structural loss…...in others there is not. Consequently, the flood risk problem will scale dependent on the likely reef trajectory. I think this provides a more interesting discussion element than a blanket rule about future responses. It is grossly misleading to indicate reef flattening is a global phenomenon. As requested we have provided even more indication that there is spatial variability in the reef response. Line 174 “This flattening of coral reefs has been observed globally14,25,26 and can be accelerated by coral bleaching, as witnessed during the 2015 El Niño. In the long term, these effects could be coupled with flooding impacts from a 1 m or more rise in sea levels5 and lead to compounding effects later in the century. However these effects are not foregone conclusions and in some areas reefs are still in good condition and even growing. The challenge will be to maintain, improve and restore healthy reefs, which will likely require more innovative effort in the areas where the protection benefits are greatest, i.e., directly adjacent to populated areas. Better decisions in coastal development and habitat restoration could reduce risks to both people and reefs.” Line 179. A 1m change in reef profile is not modest. Our study is a valuation of ecosystem services. Most of these prior studies assume the entire loss of habitats (i.e., a comparison scenario with absolutely no reefs), which means that most other studies assume meters to tens of meters of reef loss. Thus a change of only 1m in a “no reef’ scenario is actually quite conservative. We have clearly noted this in text. 2. Management implications I understand the rationale of the manuscript and consequently the call for improved management of reefs to offset damages to communities. However, surely the manuscript also needs to acknowledge that an equally sensible strategy to avoid flood impacts is to reconsider how communities have developed and settled the low-lying coastal fringe? How should they adapt??
Our first paragraph of the introduction already noted the cumulative risks of coastal development, and we have sharpened this text further (Line 29). We have also made a very clear point about risks and coastal development in the discussion (Line 177). We agree wholeheartedly with this point of view that the risks from poor development choices are clear. However we do not think that in this paper on reef benefits that it would be appropriate to dwell further on the hundreds of different choices in coastal development; we believe that in the very limited discussion space that we should focus on those most directly at the interface between reefs and people. Line 29 “The impacts of coastal flooding are substantial and growing as the exposure of assets increases 1,2 Unfortunately, these risks are often discounted in development choices3,4. Flooding impacts will worsen given population growth, coastal development and climate change2,5,6. Coastal development also causes losses in coastal habitats, which will further heighten risks7-10. There is a pressing need to advance risk reduction and adaptation strategies to reduce flooding impacts4,6,11. “ Line 177 “However these effects are not foregone conclusions and in some areas reefs are still in good condition and even growing. The challenge will be to maintain, improve and restore healthy reefs, which will likely require more innovative effort in the areas where the protection benefits are greatest, i.e., directly adjacent to populated areas. Better decisions in coastal development could reduce risks to both people and reefs.” Reviewer #4 (Remarks to the Author): I have carefully read the revised paper, the reviewers' comments and the authors’ responses to the comments. I am finding myself agreeing with Reviewer 2 and see limited use of this global approach to quantifying the value of coral reef systems for coastal protection. I agree that the approach is too crude to deliver meaningful results and I am also somewhat puzzled by the methodology. For example, wave transformation is carried out, but Stockdon equation uses deep water wave conditions, and was developed for 'planar' beach profiles. Additionally, I do not see proper consideration of the water levels and how, say, the 1:100 year wave condition is associated with the water level. Wouldn’t this warrant some sort of joint probability approach? We have thoroughly defended our approaches in text and sensitivity analyses. We remain a little surprised that our models are not considered relative to other global flooding models published recently in Nature journals. And that the reviews appear to widely accept the coastal protection benefits of reefs despite the fact that there are only a few site-based studies and none studies that quantify these social or economic benefits. As explained in methods, we have modified Stockdon to factor in reef effects. We have clarified further in the methods that their model was developed in part for barred beaches, which resemble coral reef protected beaches. Line 312 – “In our approach, we assume that Stockdon et al.41 can be applied to coral reefs as the model was developed to include barred beaches, which resemble coral reef protected beaches.” With regard to the consideration of water level, we work with the total water level to estimate flooding. Total Water Level (TWL) combines effects of significant wave height, storm surge, and other sea level components as detailed in the methods. We have reconstructed three decades of the TWL time series to obtain the extreme value distributions of TWL and thus flood levels (including for example the 1 in 100 year flood). We do not need to calculate the joint distribution of the components, because they are all included in the TWL statistics. I think the problem here is that, due to this being a Nature group publication, the methodology is very much truncated, making it difficult for the reader to fully comprehend the approach followed and the assumptions underpinning this modelling exercise. Following the recommendations in reviews 1 and 3, we clarified the models even further in text and most importantly have provided Table S4 (Supplementary information Line 408 and below), which includes a summary of the data and models that we have used and compares them to site-based models. Previously we provided a direct comparison between our model and site-based models. We show that our model performs well and that the results are consistent with other published papers that also rely on similar cross-shore profile approaches (i.e., 1D) to study the hydrodynamics of coral reefs at sites.
Supplementary Table S4| A comparison of key models, data, benefits and limitations between the global approaches in Beck et al. and the approaches possible in local or site-based studies. Global Study (~1,000km) Key Models & Data Benefits & Limitations 1 Offshore hydrodynamics
• Storm Surge (Global every 2º from 18912010) • Waves from reanalysis (Global data 0.25º from 1979-2017) • Astronomical Tide (1º, altimetry) • Local relative sea level rise projections • Global land subsidence • Reanalysis or hindcasts do include validation and calibration with observations
2
Nearshore hydrodynamics
See SI page 2 for a listing of references for these data sources. • Propagation with Snell’s law (accounts for directionality) • Bathymetry: global (~1km) • Global coral reef cover
Local or Site-Based Study (~1km) Key Models & Data Benefits & Limitations
High quality offshore data is available globally.
• Often same as global data
Local observations can be of higher resolution.
Most of these data at the global scale are the same ones commonly used at local scales.
• Local observations in deep water (tidal gauges, waves, surge)
However: Usually there are no existing local observations.
However: The time periods for analysis must be the same and are thus limited by the shortest data set (i.e., waves) Better local data cannot be incorporated (except for local SLR projections).
Downscaling technique required to propagate the full time series to the coral reefs location Comparatively low computational cost. However:
• High resolution reanalysis (~1km) only by downscaling from regional or global data. • Local land subsidence estimates. • Local relative sea level rise projections similar to the ones for other scales
Even when there is better local data, the time series are too short for determining flood return periods required to estimate annual expected damages. The lack of local time series data principally explain why there currently are no local studies that calculate the annual expected flood reduction benefits of reefs.
• Dynamic propagation with numerical models (e.g. SWAN)
All waves propagation processes are considered (linear and nonlinear)
• Bathymetry: high resolution (~10m)
Local observations available to calibrate the model
• High resolution coral
High resolution outputs (waves and storm surge fields ~10m)
map (~1km)
Non-linear propagation processes are not considered
reef cover (~10m) However: Local observations may not be appropriate (limited location and time) for downscaling.
The quality of the bathymetry is not great (affects all regional flood models).
Few shallow, tropical sites have the high resolution bathymetry needed to justify the use of these high resolution models.
No local observations are used to calibrate the model.
3 Reef effect on flooding
• Representative scale of transects: 2,000m • Reef model 1D: Energy balance equation model (breaking and friction) for waves and long wave equations linear model for storm surge • Breaking model includes a specific breaking index for coral reefs • Bathymetry: Global (1km) • Global Coral cover and roughness distribution
The outputs are of relatively coarse resolution (~1km) relative to local studies. Use of 1D phase averaged parametric models: Require only a simple, numerical mesh Reduce the computational costs to reasonable levels (to simulate years of waves and surge data). These models are consistent with the resolution of the bathymetric data available globally (~1km).
However: 2-D wave propagation processes such as refraction-diffraction omitted Simple representation of ecosystems, only by its roughness: friction
Field work is usually required data collection, which limits scale.
• 2D propagations • Reef effect is modelled directly using SWAN which solves a conservation of energy equation with a breaking model and friction equivalent to the global model • Reef effect can also be modelled with XBeach, which includes a similar breaking model and friction equivalent to the global model. • Bathymetry: Local (10m) • High resolution Coral cover and roughness
High computational cost in mesh set-up and modelling. All relevant processes are considered in wave propagation, including non-linear effects and infragravity waves Higher resolution ecosystem data can be used. However: Higher resolution bathymetric and ecosystem data are rarely available. Nonlinear effects and infragravity waves are based on a series of parameterizations that have been validated with only a limited number of field experiments. It is not computationally feasible yet to run these models at regional or global levels. Existing studies simulate a limited number of sea
coefficient for coral reefs (Sheppard 2005).
4 a) Estimate Flooding- Flood height at shoreline
• The wave contribution to the total water level at the shoreline (Runup) is calculated using an empirical formulation • Reconstructions of historical time series of total water level over the full period • Extreme value analysis based on the time series reconstruction
Runup formula considers the case of barred beaches which can be considered similar to coral reefs. The runup formula includes an infragravity wave component obtained empirically. Allows the reconstruction of the full-time series of the total water level required for stochastic risk analysis. Uncoupled calculation of flood height at shore and flooding inland provides future flexibility in rerunning only flooding models (e.g., if new topographic or population data is developed).
distribution
• The wave contribution to the total water level at the shoreline (Runup) is calculated using numerical models • Extreme value analysis of flood height time series is not necessary if coupling flood height calculation and flooding inland processes by using the same numerical model
states or storm events, because XBeach is computationally expensive to run for the full-time series necessary for a stochastic risk analysis. There is no major difference with the global approach in the way the effect of the coral reef is modelled in terms of breaking and friction. Breaking is parameterized using a breaking model and corals are represented using a friction coefficient with the actual bathymetry. Coupled flood height and flooding calculation (“all in one”). Does include the contribution of infragravity waves using a processbased model. However: Applications only for extreme events or storms (high computational cost and limited number of events to be simulated). Quality of flood height estimates is strongly dependent on the quality of the bathymetric and topographic data.
However: The calculation of the flood height at the shoreline and consequent flooding inland is obtained using different models (not coupled). This is a standard approach in global flood models. b) Estimate Flooding- inland
• Modified bathtub approach with hydraulic connectivity
Low computational cost.
• Topography: Global ~90m
No mesh generation process required (same mesh as the topography model).
• Extreme values: Stationary Extreme value analysis
Large scale domains can be run simultaneously (>1,000km). Does not require high resolution topographic data For coarse topographic data, it provides same results as site-based numerical flood models such as RFSM-EDA. It does not require very high-resolution field data (vegetation, buildings) However: Flood calculation does not consider terrain roughness, infiltration, rain, river flow.
• Process-based models (RFSM-EDA) • Topography: high resolution (LIDAR 1m)
Flood calculation considers terrain roughness, infiltration, rain, river flow. Non-stationary analysis (flood cover evolution in time). We can estimate flooding extent at any time step. However: High computational cost Complex mesh generation required. Only applicable to very small-scale domains simultaneously (