In most previous ad hoc network research, two different paradigms have been used to model the MAC ... hopping is generally preferable to direct sequence.
SUBMITTED TO IEEE TRANS. ON WIRELESS COMMUNICATIONS
1
The Guard Zone in Wireless Ad hoc Networks Aamir Hasan and Jeffrey G. Andrews Wireless Networking and Communications Group Department of Electrical and Computer Engineering University of Texas at Austin, TX 78712
{ahasan, jandrews}@ece.utexas.edu
Abstract In this paper, the effect of scheduling on the performance of CDMA wireless ad hoc networks is examined. In ad hoc networks, it is necessary to suppress transmissions by nodes around the desired receiver in order to achieve successful communication. This minimum separation, the guard zone, has important implications on carrier sensing and other MAC-level protocols. But previously, the guard zone has not been well understood. In this paper, the guard zone is investigated in CDMA ad hoc networks, with non-spread spectrum ad hoc networks being a special case where the spreading gain is unity. It is shown that the size of this exclusion zone has a large impact on the transmission capacity of ad hoc networks, and an optimal guard zone is found using stochastic geometry. These results provide useful insight in the design of contention resolution algorithms as compared to pure random access in ad hoc networks.
Index Terms Ad hoc networks, CDMA, spread spectrum, MAC, outage probability, capacity. This research was supported by National Instruments, an SRA grant by the University of Texas at Austin, and an equipment donation by Intel. Part of this work will appear in IEEE Globecom in Dallas, Dec 2004.
SUBMITTED TO IEEE TRANS. ON WIRELESS COMMUNICATIONS
2
I. I NTRODUCTION Wireless ad hoc networks, characterized by the lack of wired infrastructure, pose unique challenges in the design of the air interface. Due to the distributed nature of these networks, and the fact that nodes simultaneously cooperate and compete for use of network resources, design of the medium access control (MAC) protocol plays an important role and has a large impact on the throughput of an ad hoc network [1]. Lately, there has been a growing interest in determining the capacity of ad hoc networks [2], [3], [4], [5], and [6]. In most previous ad hoc network research, two different paradigms have been used to model the MAC protocol. The first model comprises ALOHA-based access methods where nodes transmit their contention packet without any coordination between them. All nodes have the same probability of transmission and no effort is made to resolve collisions which occur due to interference caused by simultaneous transmissions [7]. The second model is based on carrier sensing and generally assumes some sort of local scheduling to avoid collisions. A simple method to avoid collisions is to sense the channel before transmission of a packet. If there is another node receiving a transmission in close proximity, it is obvious that a transmission should be delayed. This type of scheduling can be modelled with a guard zone, or interference range, which is usually larger than the radio range. The radio range is the maximum distance that two nodes can communicate over (assuming no interference). The interference range is the minimum distance away that an interferer can be located and not cause an insurmountable amount of interference at the receiving node. This model allows for a circular guard zone with some radius D around each receiving node to ensure a successful transmission. The guard zone is necessary in order to maintain a desired Signal to Interference plus Noise Ratio (SINR) at the receiver. Clearly, the size of the guard zone effects throughput (per node) in an ad hoc network as nodes within the disc b(0, D) are inhibited. In an ad hoc network employing some sort of scheduling, only a subset of contending transmitters are allowed to transmit simultaneously. The choice of selecting the subset of transmitters is critical as it affects the performance measures (end-to-end delay, outage, throughput, power levels) of the network. The other aspect is the complexity in the implementation of the scheduling mechanism due to the distributed nature
SUBMITTED TO IEEE TRANS. ON WIRELESS COMMUNICATIONS
3
of ad hoc networks. These issues will play a significant role in both current and future research for ad hoc networks [8]. This work is not an attempt to explore or design optimum scheduling mechanisms and their implementation techniques. However, the results presented in this paper will reinforce the importance of scheduling on the performance of ad hoc networks, and provide guidelines for choosing an appropriate exclusion region. In the limit of a large number of nodes, Gupta and Kumar [2] derived upper and lower bounds on the capacity of ad hoc networks. However, their protocol model achieves these bounds with the assumption that guard zone is greater than the transmission range. They also show that the network capacity degrades as the size of the guard zone increases. Optimum transmission ranges in a direct sequence CDMA (DSCDMA) multihop packet radio network were found by Sousa and Silvester [9], and while their work does not consider any type of scheduling, it provides useful insight to the performance of CDMA networks in a random access protocol (pure ALOHA). The multiple access and anti-multipath properties of spread spectrum make DS-CDMA desirable at the physical layer of ad hoc networks [10]. Recently there is a growing interest in using spread spectrum in ad hoc networks, [11], [12], [13], [14], [15] and [16]. Bounds derived for the transmission capacity of CDMA ad-hoc networks [3], [17] show that frequency hopped CDMA (FH-CDMA) achieves a higher network throughput (in probabilistic sense) than DS-CDMA for path loss exponent α > 2. The result reinforces earlier work [18] which uses error probabilities for spread spectrum ad hoc networks to show that frequency hopping is generally preferable to direct sequence. FH-CDMA divides the available bandwidth into M subchannels, each of bandwidth
W . M
This effectively thins out the set of interfering transmitters at a receiver.
A receiver attempting to decode a signal from a transmitter on sub-channel m only sees interference from other simultaneous transmissions on sub-channel m. In DS-CDMA, the data signal of bandwidth W/M is spread by a noise like sequence to have bandwidth W . In DS-CDMA, the spreading factor reduces the minimum SINR required for successful reception. Capacity, termed transmission capacity [3], is defined in this paper as the maximum permissible density of simultaneous transmissions that satisfies a certain target SINR at each receiver (with some specified outage probability). The results presented assume a simple path loss model for propagation and
SUBMITTED TO IEEE TRANS. ON WIRELESS COMMUNICATIONS
4
neglects routing, end-to-end delay as well as energy efficiency. These issues are critical in evaluating the performance of any communication system, however, we consider primarily a physical and MAC layer view of the network. The focus of this paper is to highlight the increase in capacity of ad-hoc networks by employing a suitable guard zone around each receiver. We show that an optimal guard zone exists which maximizes the capacity. This result will impact the design of scheduling mechanisms and will highlight the shortcomings of purely random access techniques in ad hoc networks. The rest of the paper is organized as follows. Section II introduces the system model and examines the aggregate interference in an ad hoc network. Section III highlights the performance loss incurred by DS-CDMA systems as compared to FH-CDMA using a pure ALOHA protocol. Transmission capacity bounds with local scheduling (by employing a guard zone around each receiver) are derived in Section IV . Section V provides capacity results for the optimal guard zone which maximizes the transmission capacity. In Section VI, we evaluate the distribution of transmitters resulting from the introduction of a guard zone around each receiver. We conclude this paper by summarizing our results and their significance in Section VII.
II. S YSTEM M ODEL The system model, similar to the one used in [3], utilizes a homogenous Poisson point process (PPP) Π = {Xi } on the plane R2 with parameter λ to model the location of the nodes. We neglect both short term and long term fading and consider only path loss where the received power Pr = ρr−α at a distance r from the transmitter with transmitted power ρ (multiplied by some constant). The total noise power is assumed to be η for FH-CDMA system and M η for DS-CDMA system. The two other simplifications in the model are i) all transmitters utilize the same transmission power ρ and ii) all transmission distances are over the same distance r. Although this model requires some compromising assumptions, they allow the intuition surrounding the optimal guard zone to be cleanly developed, while capturing the important trends. We allow maximum intensity λ of the process Π such that outage probability is less than ², for 0 < ² ¿ 1. Limiting ² to a small value ensures that capacity is not wasted due to excessive collisions, back-off
SUBMITTED TO IEEE TRANS. ON WIRELESS COMMUNICATIONS
5
times, retransmissions, and other MAC overhead. Here outage implies that the SINR (post-despreading) at the desired receiver is below some threshold, β. We carry out the analysis on a receiver placed at the origin and denote Ri = |Xi | for the distance from the node i to the origin. Assuming the PN code crosscorrelation is 1/M [19] (which is conservative relative to 1/3M in [20]) the appropriate requirements on λ for DS-CDMA and FH-CDMA are given below: µ ¶ ρr−α β o P ≤ DS P ≤ ², M M η + i∈Π ρRi−α µ ¶ ρr−α o P FH P ≤β ≤² η + i∈Πm ρRi−α
(1) (2)
where Πm denote the set of transmitters which select sub-channel m, for m = 1, · · · , M in the case of FH-CDMA. Each process Πm is a homogenous Poisson point process with intensity
λ M
as each transmitter
chooses its sub-channel independently. In order to determine this outage probability, we need to obtain the probability density function (pdf ) for the SINR at the receiver. The problem in determining this pdf is due to the unequal interference caused by the transmitting nodes, i ∈ Π. The nodes transmitting close to the origin contribute much more interference than the nodes which are further away from the origin. The pdf and the cumulative P distribution function for the total interference Y = i∈Π ρRi−α , (for ρ = 1) were derived in [9] for the special case when the path loss exponent α = 4, and are π − 3 −π3 λ4y2 , λy 2 e 2 Ã ! 3 π2λ √ FY (y) = 2Q . 2y fY (y) =
(3) (4)
This is the only case for α > 2 in which a closed-form expression is known to exist. The result was also extended to Rayleigh fading channels in [21]. The above results are used in the next section to evaluate the transmission capacity for both CDMA systems employing a purely random access protocol. III. T RANSMISSION C APACITY A NALYSIS WITHOUT A GUARD ZONE , I . E . D = 0 In this section we compare the transmission capacity for both DS-CDMA and FH-CDMA networks using (1) - (4). We determine the normalized transmission capacity (for α = 4 and ρ = 1) for both CDMA
SUBMITTED TO IEEE TRANS. ON WIRELESS COMMUNICATIONS
6
systems using (1), (2) and (4) as r
λDS λF H where κ =
r−α β
µ ¶ 2 κ −1 1 − ² Q , = π3 M 2 r ¶ µ 2 1−² −1 = κQ . π3 2
(5) (6)
− ηρ .
In [3] upper and lower bounds on λ for both DS-CDMA and FH-CDMA were derived in the form λ∗ ≤ λ ≤ λ∗ . The transmission capacity λ ≤ λ∗ ensures outage probability po < ² is definitely met, and λ > λ∗ results in po > ² and it is ensured that an SINR outage will occur. In the absence of a guard zone (D = 0), transmission capacity results for both DS-CDMA and FH-CDMA are; µ ¶ 2 2 α−1 ² ² (M κ) α ≤ λDS ≤ (M κ) α , α π π µ ¶ α − 1 ²M 2 ²M 2 κ α ≤ λF H ≤ κα . α π π
(7) (8)
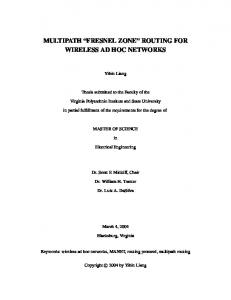
The upper bounds in (7) and (8) are reproduced from [3] while the lower bounds are given in the Appendix and are tighter (for α > 2) than the lower bounds in [3]. The lower bounds in (7) and (8) suggest that for higher path loss exponents the transmission capacity for an ad hoc network approaches the upper bound. This is verified by comparing the above results (for α = 4) with the transmission capacity bounds in (5) λ and (6). The normalized transmission capacity ( M ) as a function of spreading ratio is shown in Fig. 1
for the network parameters of Table I. The capacity of DS-CDMA as compared to FH-CDMA degrades with increasing spreading ratio. This would also be the case if spread spectrum was compared to a non spread system. This results from the known problem in DS-CDMA of the near-far effect [18]. In cellular networks the near-far problem is mitigated using power control, but in ad hoc networks power control is impractical as there is no centralized authority to coordinate the required power levels. Although some work has been done to implement power control in a distributed fashion [4], [15], implementation of these distributed algorithms is still not clear and remains an open area for future research. The work in [4] suggests that power control alone cannot alleviate the near-far problem in DS-CDMA and some sort of exclusion zone around each receiver has to be ensured. By eliminating nearby interferers, the near-far problem of DS-CDMA networks can be largely mitigated.
SUBMITTED TO IEEE TRANS. ON WIRELESS COMMUNICATIONS
7
It is interesting to note that the upper bound, λ∗ in both CDMA systems is almost the same (for ² ¿ 1) as the capacity given by (5) and (6). It is worth mentioning that λ∗ in [3] was determined by considering just one interferer within the disc b(0, s) where s = κ
−1 4
(for FH-CDMA) and s = (M κ)
−1 4
(for DS-CDMA).
For these values of s even a single transmission within b(0, s) causes outage and therefore constrains the transmission capacity. This suggests that in networks where local scheduling is not implemented, capacity is limited by the strongest interferer since it dominates the outage probability. Therefore, an attractive alternate to random access is to inhibit the interferer or interferers in the close vicinity around each receiver. We examine this more concretely in the following section. IV. T RANSMISSION C APACITY A NALYSIS (D ≥ 0) By allowing local scheduling (D ≥ 0) and inhibiting transmissions inside the guard zone by employing a suitable MAC, we extend the results of the previous section. In the ad hoc network of Section III, employing a guard zone D = s ensures that no transmissions occur within the disc b(0, s). Setting the −1
size of the guard zone to D = (M κ) α ensures that a single interferer alone cannot cause an outage for a DS-CDMA system. This can be shown by using (1) and setting i = 1 where the outage probability −1
goes to 0 when R1 = (M κ) α . In this case outage can only occur if there are two or more interferers in the network. By increasing the size of the disc to b(0, D), the receiver can tolerate a higher number of simultaneous transmissions. Inhibiting transmissions inside the guard zone reduces the outage probability and limits the aggregate interference. But since it also restricts the freedom of transmission, employing a large guard zone may not increase the number of simultaneous transmissions, and hence it could limit the total throughput in the ad hoc network. Therefore, the question is: Can the performance of ad hoc networks be improved by employing a suitably sized guard zone, D? And if so, what is the best choice for D? In determining the effect of guard zone on the network capacity, we first consider outage probability for a simple two-user system. Also, to better understand these results, we express D as a function of
SUBMITTED TO IEEE TRANS. ON WIRELESS COMMUNICATIONS
guard zone measure d as
µ D=
d Mκ
¶ α1
8
, (for FH-CDMA, M = 1).
(9)
The guard zone measure d helps quantify the effectiveness of the guard zone. A guard zone measure of 0 implies pure random access and d = i ensures that i interferers alone cannot cause an outage.
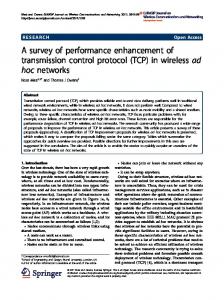
A. Two-user System A two-user system actually involves three nodes: a transmitter Xi communicating to a receiver Yi and an interferer Xj transmitting to some other receiver as shown in Fig. 2, where |Xi | = r and |Xj | = s. A transmission from node Xi is successfully received if the SINR constraint at Yi is met. We assume that the network ensures that all interferers inside the guard zone D are inhibited through some handshaking mechanisms as part of the MAC or in future systems, potentially by utilizing GPS measurements or a special power aware MAC protocol. Again assuming the PN code cross-correlation is 1/M , the outage probability for both DS-CDMA and FH-CDMA can be found using straightforward analysis using (1) and (2) as ¶ α1 ! 1 , = Po s ≤ Mκ Ã µ ¶ α1 ! 1 1 = Po s ≤ . κ M Ã
pDS o pFo H
µ
(10) (11)
Assuming interferer Xj is uniformly distributed in the network of radius R, then it is easily seen that the distribution function for s is FS (s) =
(s2 − D2 ) , (0 ≤ D ≤ R, D ≤ s ≤ R). R2 − D 2
(12)
Considering the ratio of the loss probability for DS over the loss probability for FH (for the same r) we obtain:
³
−2 α
M (M κ) − D pDS o = −2 pFo H κ α − D2
2
´ .
(13)
2
FH = M 1− α and the loss probability ratio monotonically In the absence of any guard zone (D = 0), pDS o /po
increases in α for α > 2. This is similar to the results in [17] where the benefit of FH-CDMA over DSCDMA is more pronounced in transmission areas with high attenuation. This also suggests that when an
SUBMITTED TO IEEE TRANS. ON WIRELESS COMMUNICATIONS
9
ad hoc network is interference constrained, avoiding interference by frequency hopping is preferable to interference suppression (DS-CDMA). The outage probability reduces for both systems with the introduction of a guard zone. The loss probability ratio in (13) approaches 1 for some D = Do , where outage probability for DS-CDMA is the same as that of FH-CDMA. Setting (13) to 1 results in the guard zone Do as s −1 M 1−2/α − 1 Do = κ α . M −1
(14)
The ratio of loss probability in (13) as a function of guard zone measure is shown in Fig. 3 (the plot uses the parameters given in Table I). The performance (in terms of SINR outage) for both systems improve with the introduction of guard zone, which is intuitive since employing a guard zone reduces the probability of a close by interferer. What is interesting is that DS-CDMA results in better performance when D ≥ Do , whereas without a guard zone, it never exceeds FH performance. The outage probability for DS-CDMA goes to 0 as the guard zone measure approaches 1 where one node alone cannot cause an outage.
B. Capacity Analysis for D ≥ 0 Introducing a guard zone around a receiver reduces the aggregate interference and relaxes the SINR constraint in (1) and (2). This reduction in the SINR requirement at the expense of inhibiting nearby transmitters may be a favorable tradeoff if the network can accommodate a higher transmission capacity. In this section we extend the results of the two-user system to an ad hoc network with fixed transmission distance and node distribution similar to the system model in Section II. In addition, a guard zone of radius D around each receiver is introduced, which inhibits transmissions within the disc b(0, D). The paper does not focus on the specifics of how the nodes within the guard zone are inhibited, which is typically handled by the MAC protocol. In the presence of guard zone with radius D, the aggregate interference at a receiver is given by Y =
X
Ri −α , (for ρ = 1)
i∈Π∩¯b(0,D)
where interference is caused by all the transmissions outside the disc b(0, D).
(15)
SUBMITTED TO IEEE TRANS. ON WIRELESS COMMUNICATIONS
10
The probability density function for the aggregate interference Y in [9] cannot be applied in the case where D > 0. In the absence of the probability density function or a suitable model for the aggregate interference, we evaluate the lower bound on the transmission capacity λ∗ (D) as a function of the size of the guard zone. It may be noted that the Gaussian approximation for the aggregate interference is not correct and provides pessimistic capacity results when D is small. This can be explained by the extreme interference caused by the near by nodes as compared to interferers that are far away, resulting in a large variance for Y . We highlight this in the next section. In the following subsection we explain our methodology and the assumptions used for determining λ∗ (D). The purpose here is to highlight the effect of guard zone on the transmission capacity for ad hoc networks and to compare with the capacity results of section III for random access networks. 1) Methodology: The system model in Section II is modified to include a guard zone of size D around the receiver at the origin (see Fig. 4). The remaining interferers outside the guard zone are still distributed according to a homogenous Poisson point process (PPP) Π = {Xi } on the plane R2 with parameter λ. In the presence of a guard zone of size D, we evaluate the lower bound on the Poisson process intensity λ0∗ (D). The intensity λ ≤ λ0∗ (D) ensures po < ², and the outage requirement is definitely met. For this λ0∗ (D) we determine the percentage of receivers ps in the network which will have no interferers inside their guard zone. The lower bound on transmission capacity λ∗ (D) for successful transmissions can be expressed as: λ∗ (D) = λ0∗ (D) ps , 0
(16) 2
= λ0∗ (D) eλ∗ (D)πD .
(17)
Inhibiting transmissions inside the guard zone results in a thinning process which reduces the intensity of the simultaneous transmissions as suggested in (17). The thinning process results in a node distribution which is dependent on the scheduling mechanism. The scheduled transmitters are certainly not distributed with a homogenous Poisson point process since by design, the probability of an active interferer inside the guard zone is 0. Scheduling mechanisms for which the distribution of transmitters can still be approximated as Poisson in the region 1 and 2 are considered for determining λ∗ (D). Under this assumption λ∗ (D)
SUBMITTED TO IEEE TRANS. ON WIRELESS COMMUNICATIONS
11
is definitely a lower bound given the fact that the scheduled transmitters are a subset of a Poisson point process with intensity λ0∗ (D). In section VI we evaluate the node distribution resulting from a simple scheduling mechanism which satisfies this assumption. In order to determine the lower bound on the transmission capacity we first consider the DS-CDMA case. Let (Ω, F, Po ) represent the underlying probability triple for the process Π and ω ∈ Ω represent outcomes of a particular realization of the point process. We define the following three outage events similar to [3]. Definition 1: n F (λ, D, s) =
ω|
i∈Π∩¯b(0,D)
n F1 (λ, D, s) =
X
ω|
o |Xi |−α ≥ M κ ,
i∈Π∩¯b(0,D)∩b(0,s)
n F2 (λ, D, s) =
o |Xi |−α ≥ M κ ,
X
ω|
X
o |Xi |−α ≥ M κ ,
i∈Π∩¯b(0,s)
where D < s. The event F consists of all outage outcomes, F1 consists of all outcomes where the set of transmitters in region 1 generate enough interference power to cause an outage at the origin, and F2 consists of all outcomes where outage is caused by the transmitters in region 2. Recall the definition of region 1 and 2 from Fig. 4. Replacing Π by Πm and M κ with κ would give similar events for FH-CDMA. It may be noted that the events F1 and F2 are independent since they apply to disjoint regions on the plane. We will make use of the following Lemma in computing λ0∗ (D). Lemma 1: For any D ≥ 0, s > D and any x, ² ∈ (0, 1) Po (F1 ) < x² and Po (F2 ) < (1 − x)² ⇒ Po (F ) < ². Proof of Lemma 1 For 0 < s < ∞, F ⊂ (F1 ∪ F2 ). Therefore, Po (F ) ≤ Po (F1 ∪ F2 ). P o (F1 ∪ F2 ) = Po (F1 ) + Po (F2 ) − Po (F1 )Po (F2 ) = x² + (1 − x)² − x(1 − x)²2 < ²
¥
SUBMITTED TO IEEE TRANS. ON WIRELESS COMMUNICATIONS
12
By ensuring a sufficiently small outage probability for both events F1 and F2 corresponding to the disjoint regions 1 and 2 of the network implies that the network outage can be bounded. The above lemma helps obtain a lower bound on λ0∗ (D). It is also straightforward to show that for a given D, P o (F1 ) is increasing in s, while P o (F2 ) is decreasing in s for a fixed λ. Note that the probabilities of both the events increase in λ for a given D and s. Each condition in lemma 1 gives to a lower bound, λxF1 (D, s) and λxF2 (D, s) respectively for a given D and s. We define the lower bound on the transmission capacity λ0∗ (D) as: £ ¡ ¢¤ λ0∗ (D) = max min λxF1 (D, s), λxF2 (D, s) x
(18)
In order to get a tight lower bound for a given s we need to select x such that both the conditions in Lemma 1 are met and λxF1 (D, s) is as close as possible to λxF2 (D, s). In the following paragraphs we show how to calculate λxF1 (D, s) and λxF2 (D, s). 2) Lower bound using event F1 : In order to calculate λxF1 (D, s) we define si as: ¶ α1 µ i , (i = 1, 2 . . . .), si = Mκ
(19)
where i > bDα M κc to ensure s > D. The approach here is to use the property that transmitters are distributed according to the Poisson process in region 1. We determine the exact probability for the event F1 (λ, D, s) and evaluate λxF1 (D, s) by ensuring Po (F1 ) < x². By choosing s as in (19), i or more transmitters in the area b(0, D) ∩ B(0, si ) definitely cause an outage. This can be seen by the fact that if all i transmitters are at the boundary si , outage will still occur. When D = 0 and s = s1 , the event F1 becomes equivalent to the case in Section III. ¡ 0.5 ¢ α1 We give an example where D = M and s = s2 . The outage caused by the event F1 comprises of κ the following disjoint events, 1) Two or more transmitters in region b(0, D) ∩ b (0, s2 ); 2) Exactly one transmitter inside the region b(0, D) ∩ b (0, s1 ) and 0 transmitters inside the region b (0, s1 ) ∩ b (0, s2 ) . Outage probability for event F1 can be computed by summing the probabilities of the above events as: ¡ ¢¤ 2 2 £ Po (F1 (λ, D, s) = 1 − e−πλ(s2 −D ) 1 + πλ s22 − s21 .
(20)
SUBMITTED TO IEEE TRANS. ON WIRELESS COMMUNICATIONS
13
The above example can be extended for any guard zone D and s. However, as D and s increases more events needs to be computed to determine Po (F1 ). Solving Po (F1 ) < x² gives λxF1 (D, s). 3) Lower bound using event F2 : In order to determine the lower bound λxF2 (D, s) we apply Chebychev’s inequality to the aggregate interference caused by the transmitters in region 2. Replacing D by s in (15) gives this aggregate interference as: X
Y =
Ri −α , (for ρ = 1).
(21)
i∈Π∩¯b(0,s)
By Chebychev’s inequality,
Po (Y ≥ M κ) ≤ Po (|Y − µy | ≥ M κ − µy ) , ≤
σy2 (M κ − µy )2
, (µy < M κ)
(22) (23)
where σy2 and µy are the variance and the mean of the aggregate interference in (21) respectively. Application of Campbell’s Theorem [22] results in the following statistics for the aggregate interference caused by the interferers in region 2 (see the Appendix for derivation), 2πλ , (α − 1) sα−2 πλ = (α − 1) s2α−2
µy =
(24)
σy2
(25)
where λ is the intensity of the homogenous Poisson point process. Ensuring outage probability Po (F1 ) < (1 − x) ², and using the above results λxF2 (D, s) can be expressed as: λxF2 (D, s) =
(M κ)2 (1 − x) ² (α − 1) s2α−2 . π
(26)
4) Lower bound λ∗ (D): We use the help of software written in LabVIEW to calculate λxF1 (D, s). The software maximizes the λ0∗ (D) by determining a suitable x such that λxF1 (D, s) = λxF2 (D, s) for a given D and s. The choice for determining s for a given D is important as it effects the error using the inequality (23). As s increases the variance of the aggregate interference (in region 2) decreases making Chebychev’s inequality tighter. Lower bound λ∗ (D) normalized (by M ) as a function of guard zone for both FH-CDMA and DS-CDMA are shown in Fig. 5. The plot uses the parameters of Table I. It may be noted that λ∗ (D) is calculated using
SUBMITTED TO IEEE TRANS. ON WIRELESS COMMUNICATIONS
14
the results λ0∗ (D) obtained through numerical calculation and (17). The above results show that employing a suitable guard zone around each receiver improves the transmission capacity drastically and a higher transmission capacity is achievable than the upper bound obtained through random access. The results confirm that the distribution of the aggregate interference is not Gaussian when D is small. However, the Gaussian approximation performs better when d ≥ 0.5. This is intuitive because with bigger D, the variance of the aggregate interference reduces and the Gaussian approximation becomes more accurate. The result also suggests that there exists an optimal guard zone Dopt which maximizes the transmission capacity and a guard zone bigger than Dopt reduces the transmission capacity as more transmitters gets inhibited. The performance loss in DS-CDMA (for M > 1 and α > 2) as compared to FH-CDMA is similar to the results observed in Section III (D = 0). However, with a guard zone DS-CDMA outperforms the upper bound capacity results for both DS-CDMA and FH-CDMA networks employing random access. It may be noted that we are comparing the lower bound λ∗ (D) obtained with a conservative scheduling mechanism as illustrated in Fig. 6. Both Tx-Rx pairs are inhibited since each receiver has an interferer inside its guard zone. A more intelligent scheduling mechanism would inhibit only one pair so as to allow the remaining pair to communicate.
V. C APACITY A NALYSIS WITH THE OPTIMAL G UARD ZONE The results in the previous section suggest that the optimal guard zone Dopt is achieved by setting D as −1
(M κ) α (M = 1 for FH-CDMA). We verify this by examining λ∗ (D) under various network parameters by choosing different values of path loss exponents, outage, SINR and radio range. In all these cases Dopt was found when d ≈ 1. Employing a guard zone bigger than Dopt effects the transmission capacity negatively as more nodes gets inhibited due a large guard zone. It may be noted that the optimum guard zone in DS-CDMA is smaller than Dopt for FH-CDMA by a factor M
−1 α
. This is useful if the scheduling mechanism requires each receiver to explicitly inhibit the
interferers inside its guard zone, and translates into a requirement that the size of the optimum guard zone should be smaller than the transmission range r. In FH-CDMA networks this requirement cannot be met for β > 1 as Dopt approaches rβ 1/α (assuming η = 0). The effectiveness of the RTS/CTS handshake
SUBMITTED TO IEEE TRANS. ON WIRELESS COMMUNICATIONS
15
in IEEE 802.11 is based on the assumption that hidden nodes are within the transmission range of the receivers [23]. The advantage of DS-CDMA is that a receiver can inhibit all the potential interferers without the need of any carrier sensing. −1
The following analysis uses a fixed guard zone D = s1 (s1 = (M κ) α ) and the separating boundary for the region 1 and 2 as s = s3 . We choose s3 instead of s2 so that error from the Chebychev’s inequality is considerably lowered. In this case outage caused by the event F1 comprises of the following disjoint events, 1) Three or more transmitters in region b(0, D) ∩ b (0, s3 ); 2) Exactly two transmitters inside the region b(0, s1 ) ∩ b (0, s2 ) and 0 transmitters inside the region b (0, s2 ) ∩ b (0, s3 ) . Ensuring outage probability for the event F1 to be less than x², λxF1 (D = s1 ) can be derived; as shown in the Appendix, as
√
λxF1 (D
2
2x² (M κ) α ´ . = s1 ) = ³ 2 α π 2 −1
(27)
Applying Chebychev’s inequality gives the lower bound for region 2, λxF2 (D = s1 ) =
(M κ)2 (1 − x) ² (α − 1) s3 2α−2 . π
(28)
The lower bound on the transmission capacity can be found by determining x which equalizes (27) and (28). Substituting this x in (27) or (28) provides the lower bound, 2 √ h(α, ²) ² (M κ) α 0 λ∗ (D = s1 ) = , where π " # 1 (1 + 2b2 ) 2 − 1 1 , and h(α, ²) = 2 b 2α − 1 ³ 2 ´√ 2 b = (α − 1) 3 α (α−1) 2 α − 1 ².
(29)
See the Appendix for the detailed derivation of (29). We use the above results and (17) to plot the normalized λ∗ (D = s1 ) vs M in Fig. 7. The plot shows the validity of (29) by comparing the results with the λ∗ determined using numerical calculation. The plot in Fig. 8 compares the lower bound with the capacity results of Section III. Both the plots are for
SUBMITTED TO IEEE TRANS. ON WIRELESS COMMUNICATIONS
16
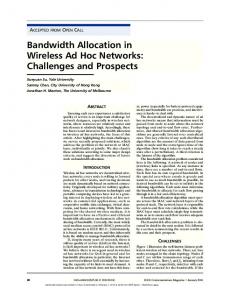
the parameters given in Table I. The results show a significant improvement in transmission capacity over random access networks. DS-CDMA performs better as compared to the upper bound results for FH-CDMA (up to M = 12). VI. D ISTRIBUTION OF T RANSMITTERS WITH D > 0 The results for the lower bound λ∗ (D) in Section IV and V assumes the distribution of transmitters in region 1 and 2 around a receiver to be Poisson. Therefore, in this section we examine the validity of Poisson distribution by considering an exclusion zone of size D > 0 around each receiver. A simple scheduling mechanism is implemented whereby only a subset of contending transmitters, whose corresponding receivers does not have any interferers inside its guard zone, are allowed to transmit simultaneously. Although this scheduling mechanism is not optimum as explained earlier (see Section IV and Fig. 6) but it helps highlight the drastic improvement in transmission capacity via scheduling. By implementing an ad hoc network in a software (written in LabVIEW), we study the distribution of scheduled transmitters via simulation. The simulation considers a spatially distributed set of transmitters according to a homogenous Poisson point process in a circular network of radius R meters [22]. The candidate transmitters with intensity λ0∗ (D) each selects a receiver located at a random location which is at a distance r meters away. We assume all receivers having any interferers inside the disc b(0, D) inhibit their corresponding transmitters. The thinning process schedules only those transmit-receive pairs whose receiver’s guard zone is free of interferers. One realization of this scheduling process with initial candidate transmitters (intensity λ0∗ (D)) alongside scheduled transmissions (with intensity λ∗ (D)) are shown in Fig. 9. In order to verify and test the Poisson process hypothesis, we apply two tests [22]. First, the distribution of the distance t for each scheduled transmitter from the origin is compared with the probability density function ft (t) =
2t . R2
This comparison ensures that given the number of transmitters in R, and due to the
nature of the Poisson process, the distribution of their locations (transmitters) is that of independent and identically distributed transmitters with uniform distribution. Second, we sample the number of scheduled transmitters (with intensity λ∗ (D)) in an area b(0, D)∩b(0, si ) where (si > D) to determine the probability
SUBMITTED TO IEEE TRANS. ON WIRELESS COMMUNICATIONS
17
of k (k = 0, 1, 2, · · · ) interferers inside region 1. These probabilities are then compared with a Poisson distribution with intensity λ∗ (D). The results of the two tests sampled over large realizations are shown in Fig. 9. The plot uses the network parameters given in Table I with R = 100 meters, D = s1 and s = s3 (this is similar to the model used in Section V). The results were also verified using different values of D and s. Using the simulation results shown in Fig. 10b, we also compare the outage probability for event F1 (D = s1 and s = s3 ) with the exact outage probability for a Poisson distribution (see Section IV for details). In all the case (D ≤ Dopt ), the error was found within 3 − 5 %. Therefore, for smaller guard zones the outage probabilities can be approximated using the Poisson distribution.
VII. C ONCLUSION The study illuminates some key dependencies for the capacity of ad hoc networks. In the absence of local scheduling it is better to do frequency hopping than to use spread spectrum techniques as earlier work has shown. Due to the asymmetric nature of interference in ad hoc networks, competing transmissions in the close vicinity of the receiver constitute the vast majority of the total interference. Therefore, employing a guard zone around each receiver improves the capacity of ad hoc networks in general but more so in the case of DS-CDMA networks. We also show that the size of the exclusion zone effects the transmission capacity of the network, and by choosing an optimal guard zone the capacity is maximized. In the present IEEE 802.11 model the exclusion zone is based on RTS/CTS and carrier sensing, however, the size of the exclusion zone and its effect on capacity is not well understood. The result presented will help in providing guidelines for choosing an appropriate guard zone based on the key system parameters. In the case of DS-CDMA the optimal guard zone can be made smaller than the transmission range by appropriately choosing the spreading ratio. This mitigates the hidden node problem in ad hoc networks, since the receiver can explicitly inhibit potential interferers without any carrier sensing. Future work could further explore the guard zone by relaxing some of the simplifying assumptions made in this paper, and by developing suitable distributed MAC and routing protocols that implement and exploit an appropriate guard zone.
SUBMITTED TO IEEE TRANS. ON WIRELESS COMMUNICATIONS
18
R EFERENCES uhlethaler, “A Spatial reuse ALOHA MAC Protocol for Multihop Wireless Mobile Networks,” [1] F. Baccelli, B. Blaszczyszyn, and P. M¨ Technical Report 4955, INRIA, Oct. 2003. [2] P. Gupta and P. R. Kumar, “The Capacity of Wireless Networks,” IEEE Trans. Inform. Theory, vol. 46, no. 2, pp. 388–404, Mar. 2000. [3] S. Weber, X. Yang, J. G. Andrews, and G. de Veciana, “Transmission Capacity of Ad-hoc Networks with Outage Cconstraints,” submitted to IEEE Trans. Inform. Theory. [4] T. ElBatt and A. Ephremides, “Joint Scheduling and Power Control for Wireless Ad-hoc Networks,” IEEE Trans. Wireless Commun., vol. 3, no. 1, pp. 74–85, Jan. 2004. [5] F. Baccelli, M. Klein, M. Lebourges, and S. Zuyev, “Stochastic Geometry and Architecture of Communication networks,” J. Telecommunication Systems, vol. 7, no. 1, pp. 209–27, 1997. [6] S. Toumpis and A. J. Goldsmith, “Capacity Regions for Wireless Ad hoc Networks,” IEEE Trans. Wireless Commun., vol. 2, no. 4, pp. 736–48, July 2003. [7] T. Shepard, “A Channel Access Scheme for Large Dense Packet Radio Networks,” in Proc. SIGCOMM, Aug. 1996, pp. 219–30. [8] X. Yang and G. de Veciana, “Inducing Spatial Clustering in Spread Spectrum Ad hoc Networks for Efficient Usage of Capacity,” submitted in Proc. ACM MobiHoc, May 2005. [9] E. S. Sousa and J. Silvester, “Optimum Transmission Ranges in a Direct-Sequence Spread-Spectrum Multihop Packet Radio Network,” IEEE J. Select. Areas Commun., vol. 8, no. 4, pp. 762–71, June 1990. [10] M. B. Pursley, “The Role of Spread Spectrum in Packet Radio Networks,” in Proc. of IEEE, vol. 75, Jan. 1987, pp. 116–34. [11] E. S. Sousa and J. Silvester, “Spreading Code Protocols for Distributed Spread-Spectrum Packet Radio Networks,” IEEE Trans. Commun., vol. 36, no. 34, pp. 272–81, Mar. 1988. [12] F. J. Block and M. B. Pursley, “A Protocol for Adaptive Transmission in Direct-Sequence Spread-Spectrum Packet Radio Networks,” IEEE Trans. Commun., vol. 52, no. 8, pp. 1388–96, Aug. 2004. [13] R. Negi and A. Rajeswaran, “Capacity of Power Constrained Ad-Hoc Networks,” in Proc. IEEE INFOCOM, vol. 1, Mar. 2004, pp. 443–53. [14] K. Choi and K. Cheun, “Maximum Throughput of FHSS Multiple-Access Networks Using MFSK Modulation,” IEEE Trans. Commun., vol. 52, no. 3, pp. 426–34, Mar. 2004. [15] A. Muqattash and M. Krunz, “CDMA-based MAC Protocol for Wireless Ad hoc Networks,” in Proc. SIGMOBILE, June 2003, pp. 153–164. [16] “IEEE Standard 802.11b, Part II: Wireless LAN Medium Access Control (MAC) and Physical Layer (PHY) Specifications: Higher Speed Physical Layer Extension in the 2.4 GHz Band,” 1999. [17] S. Weber, X. Yang, G. de Veciana, and J. G. Andrews, “Transmission Capacity of CDMA Ad-Hoc Networks,” in Proc. IEEE ISSSTA, Sept. 2004. [18] M. Pursley and D. Taipale, “Error Probabilities for Spread-Spectrum Packet Radio with Convolutional Codes and Viterbi Decoding,” IEEE Trans. Commun., vol. 35, no. 1, pp. 1–12, Jan. 1987.
SUBMITTED TO IEEE TRANS. ON WIRELESS COMMUNICATIONS
19
[19] K. S. Gilhousen and et. al., “On the Capacity of a cellular CDMA System,” IEEE Trans. Veh. Technol., vol. 40, no. 2, pp. 303–12, May 1991. [20] M. Pursley, “Performance Evaluation for Phase-Coded Spread-Spectrum Multiple Acess Communication-Part I,” IEEE Trans. Commun., vol. COM-25, no. 8, pp. 795–99, Aug. 1977. [21] M. Souryal, B. Vojcic, and R. Pickholtz, “Ad hoc, Multihop CDMA Networks with Route Diversity in a Rayleigh Fading Channel,” in Proc. IEEE MILCOM, vol. 2, Oct. 2001, pp. 1003–7. [22] D. Stoyan, W. Kendall, and J. Mecke, Stochastic Geometry and Its Applications, Prentice Hall, - Upper Saddle River, NJ, 2002. [23] K. Xu, M. Ger1a, and S. Bae, “How Effective is the IEEE 802.11 RTS/CTS Handshake in Ad Hoc Networks?” in Proc. IEEE Globecom, vol. 1, Nov. 2002, pp. 72–76. [24] S. Weber, J. G. Andrews, X. Yang, and G. de Veciana, “Transmission capacity of CDMA Ad hoc Networks employing Successive Interference Cancellation,” in Proc. IEEE Globecom, Dec. 2004.
SUBMITTED TO IEEE TRANS. ON WIRELESS COMMUNICATIONS
20
A PPENDIX The aggregate interference caused by the transmitters in Region 2 is, Y =
X
Ri −α , (for ρ = 1).
(30)
i∈Π∩¯b(0,s)
The mean and variance of the aggregate interference in (30) can be computed using Campbell’s Theorem [22] as follows, Z
∞
r−α rdr s ¯∞ 2π ¯ = λr2−α ¯ 2−α s 2π = λ(0 − s2−α ) 2−α 2π 2−α = s λ. α − Z2
µy = 2πλ
σy2 = 2πλ
∞
r−2α rdr
s ¯∞ 2π 2(1−α) ¯ = λr ¯ 2(1 − α) s π = λ(0 − s2(1−α) ) 1−α π 2(1−α) = s λ. α−1
The above result is valid for α > 2. Substituting µy and σy2 in Chebychev’s inequality in (23) results in λxF2 (D, s) resulting in (26). The lower bound, λ∗ (D = 0, s = s1 ) Applying lemma 1 for D = 0 and using the results in [24], λxF1 can be determined by ensuring Po (F1 ) < x² as: λxF1 (D = 0, s = s1 ) =
2 x² (M κ) α . π
(31)
Similarly, using the mean and variance of the aggregate interference for s = s1 , λxF2 can be also be determined by ensuring Po (F2 ) < (1 − x)² as: λxF2 (D = 0, s = s1 ) = Optimizing the bounds over x results in x = λ∗ (D = 0, s = s1 ) given in (7 and (8).
α−1 α
2 (1 − x)²(α − 1) (M κ) α . π
(32)
which ensures λxF1 = λxF2 . Substituting x results in
SUBMITTED TO IEEE TRANS. ON WIRELESS COMMUNICATIONS
21
The lower bound, λ∗ (D = s1 , s = s3 ) In this case outage caused by the event F1 are listed again, which comprises of the following disjoint events, 1) Three or more transmitters in region b(0, D) ∩ b (0, s3 ); 2) Exactly two transmitter inside the area b(0, s1 )∩b (0, s2 ) and 0 transmitters inside the area b (0, s2 )∩ b (0, s3 ) . It may be noted that when D = s1 one node alone cannot cause an outage. Adding the probabilities for the two disjoints events results in P o (F1 (D = s1 )) as: · ´¸ π 2 λ2 ³ 0 2 02 o −πλs03 0 s3 − s2 , P (F1 ) = 1 − e 1 + πλs3 + 2
(33) 0
where s0i = s2i − s21 . We find the first three terms in the MacLaurin expansion of e−πλs3 and neglect terms O(λ3 ) and higher. Again applying lemma 1, λxF1 (D = s1 ) can be determined by ensuring Po (F1 ) < x² as given in (27). Similarly, using the mean and variance of the aggregate interference for s = s3 , λxF2 (D = s1 ) can be also be determined by ensuring Po (F2 ) < (1 − x)² as given in (28). Optimizing the bounds over x to ensure λxF1 (D = s1 ) = λxF2 (D = s1 ) results in (29).
SUBMITTED TO IEEE TRANS. ON WIRELESS COMMUNICATIONS
22
Normalized Transmission Capacity/M
Capacity results using distribution function in (4)
UB RA FH-CDMA LB RA FH-CDMA
UB RA DS-CDMA LB RA DS-CDMA
M, Spreading Ratio
Fig. 1. Normalized transmission capacity vs. spreading factor for D = 0. The DS-CDMA system loses spectral efficiency as the spreading factor increases. The upper bound derived in [3] for both DS-CDMA and FH-CDMA coincides with the exact transmission capacity results in (5) and (6) respectively for this special case of α = 4.
TABLE I N ETWORK PARAMETERS , UNLESS OTHERWISE SPECIFIED Symbol
Description
Value
r
Transmission radius
10m
α
Path loss exponent
4
β
Target SINR
10dB
η
SNR
20dB
²
Outage probability requirement
0.05
ρ
Transmitted power
0dB
M
Spreading Ratio
16
r
Yi
Xi D
s
Xj Fig. 2.
Two-user System. Receiver Yi is at a distance r from transmitter Xi and at a distance s from the interferer Xj .
23
Ratio of loss probability, po(DS)/po(FH)
SUBMITTED TO IEEE TRANS. ON WIRELESS COMMUNICATIONS
Do
d, Guard Zone Measure
Fig. 3.
The ratio of the loss probability for DS-CDMA to FH-CDMA vs. guard zone measure d, where D =
d Mκ
�1
α
. Outage probability
for both CDMA systems improve with increasing guard zone. DS-CDMA performs better as compared to FH-CDMA when D ≥ Do . The results use the network parameters of Table I.
2 1
s D
Tx Rx
Fig. 4. A guard zone of size D around a receiver ensures no transmissions within the disc b(0, D). A boundary s separates the network into two disjoint regions. Region 1 consists of all the transmitters within the area b(0, D) ∩ b(0, s) and region 2 consists of all the transmitters in the area b(0, s).
Normalized Transmission Capacity/M
SUBMITTED TO IEEE TRANS. ON WIRELESS COMMUNICATIONS
24
λ*FH ( D ) λ*DS ( D) RA FH-CDMA
RA DS-CDMA
Modeling aggregate interference as Gaussian
d, Guard Zone Measure
Fig. 5.
Normalized lower bound λ∗ (D) vs guard zone measure d for both DS-CDMA and FH-CDMA. The guard zone D =
d Mκ
�1
α
(M = 1 for FH-CDMA), the plot uses the network parameters of Table I. Employing a guard zone improves the transmission capacity drastically and better results are achieved than the upper bound obtained through random access. The optimum performance is achieved at d ≈ 1. The plot also shows λ∗ (D) obtained using Gaussian approximation for the aggregate interference in (15).
i
D
j
i
D
j
Fig. 6.
Transmitter i and j are inside the guard zone of each others’ receivers.
Tx Rx
Normalized Transmission Capacity/M
SUBMITTED TO IEEE TRANS. ON WIRELESS COMMUNICATIONS
25
α = 4, ε = .1
Numerical calculation Using results in (29)
α = 4, ε = .01 α = 3, ε = .1
α = 3, ε = .01
M, Spreading Ratio
Fig. 7.
Lower bound λ∗ (D = s1 ) for the normalized transmission capacity vs M. The plot compares the lower bound determined using
Normalized Transmission Capacity/M
(29) with the results obtained through numerical calculation
λ* ( D = s1 )
RA FH-CDMA
RA DS-CDMA
M, Spreading Ratio
Fig. 8.
Lower bound λ∗ (D = s1 ) for the normalized transmission capacity vs M. Incorporating a guard zone D = s1 improves the
transmission capacity and achieves lower bound λ∗ which is higher than the upper bound for a random access protocol.
SUBMITTED TO IEEE TRANS. ON WIRELESS COMMUNICATIONS
26
Initial Txs
Scheduled Txs
Fig. 9. A realization of the initial contending transmissions with intensity λ0∗ (D). The scheduled transmitters after the thinning process has
(a)
Probability of k nodes inside the area b(0, s1 ) b(0, s3 )
Probability density function, ft(t)
reduced intensity λ∗ (D).
t, Interferers distance from origin
(b)
k, Number of interferers
Fig. 10. Node distribution for D = s1 : (a) The probability density function of the distance t for each scheduled transmitter from the origin (b) Probability of k (k = 0, 1, 2, · · · ) nodes inside the region 1.