Jul 16, 2010 - American Association for the Advancement of Science, 1200 New York Avenue NW, Washington, DC 20005. (print ISSN 0036-8075; online ...
The Human Transcriptome Map: Clustering of Highly Expressed Genes in Chromosomal Domains Huib Caron, et al. Science 291, 1289 (2001); DOI: 10.1126/science.1056794 This copy is for your personal, non-commercial use only.
If you wish to distribute this article to others, you can order high-quality copies for your colleagues, clients, or customers by clicking here. Permission to republish or repurpose articles or portions of articles can be obtained by following the guidelines here.
Updated information and services, including high-resolution figures, can be found in the online version of this article at: http://www.sciencemag.org/cgi/content/full/291/5507/1289 Supporting Online Material can be found at: http://www.sciencemag.org/cgi/content/full/291/5507/1289/DC1 This article cites 13 articles, 6 of which can be accessed for free: http://www.sciencemag.org/cgi/content/full/291/5507/1289#otherarticles This article has been cited by 393 article(s) on the ISI Web of Science. This article has been cited by 95 articles hosted by HighWire Press; see: http://www.sciencemag.org/cgi/content/full/291/5507/1289#otherarticles This article appears in the following subject collections: Genetics http://www.sciencemag.org/cgi/collection/genetics
Science (print ISSN 0036-8075; online ISSN 1095-9203) is published weekly, except the last week in December, by the American Association for the Advancement of Science, 1200 New York Avenue NW, Washington, DC 20005. Copyright 2001 by the American Association for the Advancement of Science; all rights reserved. The title Science is a registered trademark of AAAS.
Downloaded from www.sciencemag.org on July 16, 2010
The following resources related to this article are available online at www.sciencemag.org (this information is current as of July 16, 2010 ):
ANALYSIS OF GENOMIC INFORMATION
References and Notes
1. T. Lindahl, R. D. Wood, Science 286, 1897 (1999). 2. The data in this paper were based on searches of the Ensembl sequence data freeze of 17 July 2000 and analysis updates as of 13 December 2000; see
3. 4. 5. 6.
7. 8. 9. 10. 11. 12.
www.ensembl.org. Additional data were from the Golden Path server at the University of California at Santa Cruz (http://genome.ucsc.edu/). Expressed sequence tag (EST ) searches used dbEST [M. S. Boguski, T. M. Lowe, C. M. Tolstoshev, Nature Genet. 4, 332 (1993)]. J. A. Eisen, P. C. Hanawalt, Mutat. Res. DNA Repair 435, 171 (1999). L. Aravind, D. R. Walker, E. V. Koonin, Nucleic Acids Res. 27, 1223 (1999). The Arabidopsis Genome Initiative, Nature 408, 796 (2000). An exact match to much of E. coli tag1 was found (AC010537.2), indicating that there is occasional contamination of the draft sequence that warrants caution. J. J. Sekelsky, M. H. Brodsky, K. C. Burtis, J. Cell Biol. 150, F31 (2000). A. Constantinou, A. A. Davies, S. C. West, Cell 104, 259 (2001). O. White et al., Science 286, 1571 (1999). R. E. Banks et al., Lancet 356, 1749 (2000). M. Vignali, A. H. Hassan, K. E. Neely, J. L. Workman, Mol. Cell. Biol. 20, 1899 (2000). J. A. Tainer, E. C. Friedberg, Mutat. Res. 460, 139 (2000). See also the other reviews on the structural biology of DNA repair in this August 2000 issue.
13. K. A. Haushalter, M. W. Todd-Stukenberg, M. W. Kirschner, G. L. Verdine, Curr. Biol. 9, 174 (1999); L. Aravind, E. V. Koonin, Genome Biol. 1, research0007.1 (2000) (available at genomebiology.com/2000/1/4/ research/0007). 14. E. C. Friedberg, L. B. Meira, Mutat. Res. DNA Repair 459, 243 (2000). 15. K. Labib, J. A. Tercero, J. F. X. Diffley, Science 288, 1643 (2000). 16. P. Gonczy et al., Nature 408, 331 (2000); A. G. Fraser et al., Nature 408, 325 (2000). 17. B. B. S. Zhou, S. J. Elledge, Nature 408, 433 (2000). 18. K. W. Kohn, Mol. Biol. Cell 10, 2703 (1999). 19. E. J. Duell et al., Carcinogenesis 21, 965 (2000). 20. B. Ko¨berle, J. R. W. Masters, J. A. Hartley, R. D. Wood, Curr. Biol. 9, 273 (1999). 21. N. Claij, H. te Riele, Exp. Cell Res. 246, 1 (1999). 22. A. Bearzatto, M. Szadkowski, P. Macpherson, J. Jiricny, P. Karran, Cancer Res. 60, 3262 (2000). 23. M. Esteller et al., N. Engl. J. Med. 343, 1350 (2000). 24. Supplemental material is available on Science Online at www.sciencemag.org/cgi/content/full/291/5507/ 1284/DC1.
Downloaded from www.sciencemag.org on July 16, 2010
specifically inhibit DNA repair in these resistant cells by targeting the key enzymes. Genetic polymorphisms in relevant repair genes will be identified and efforts made to correlate them with effects on activity of the respective proteins, with response to particular therapies and with clinical outcomes. Although a number of polymorphisms in DNA repair genes are being reported, there is presently little functional information on the consequences of the attendant amino acid changes. It will be important to find out which polymorphisms actually affect protein function and then concentrate on these in epidemiological and clinical studies. For example, homozygosity for a particular polymorphism in the DNA ligase subunit XRCC1 is associated with higher sister chromatid exchange frequencies in smokers, suggesting an association of this allele with a higher risk for tobacco- and age-related DNA damage (19). Larger studies and comparison with other polymorphisms having known biochemical effects will be needed to further validate and extend these findings. Furthermore, with the use of gene and protein array techniques, it should be possible to compare expression profiles of DNA repair genes in normal and tumor cells—information that could eventually lead to individually tailored therapies with chemicals and radiation. For example, tumors with low levels of NER should be more susceptible to treatment with cisplatin (20). In experimental systems, MMR-deficient cells are highly tolerant to alkylating chemotherapeutic drugs. MMRdefective tumors such as those found in hereditary nonpolyposis colon cancer may be resistant to treatment with such agents (21). Some variation in DNA repair gene expression is epigenetic in origin and has been found for instance with MGMT and MSH6 (22). The MGMT gene promoter is often methylated in gliomas, resulting in suppressed expression that can be associated with an improved response after tumor treatment with an alkylating agent (23). The complete human genome sequence now allows the definition of promoter regions so that the DNA methylation status of relevant CpG islands can be investigated readily. Finally, DNA repair, especially repair of oxidative damage, has often been suggested as a relevant factor in counteracting aging. An examination of polymorphisms and gene expression levels in human DNA repair genes and a comparison with the equivalent genes in shorter lived mammalian species should help determine the importance of DNA repair in normal aging processes.
27 September 2000; accepted 9 January 2001
The Human Transcriptome Map: Clustering of Highly Expressed Genes in Chromosomal Domains Huib Caron,1,2 Barbera van Schaik,1,3 Merlijn van der Mee,3 Frank Baas,4 Gregory Riggins,6 Peter van Sluis,1 Marie-Christine Hermus,1 Ronald van Asperen,1 Kathy Boon,1 P. A. Vouˆte,2 Siem Heisterkamp,5 Antoine van Kampen,3 Rogier Versteeg1 The chromosomal position of human genes is rapidly being established. We integrated these mapping data with genome-wide messenger RNA expression profiles as provided by SAGE (serial analysis of gene expression). Over 2.45 million SAGE transcript tags, including 160,000 tags of neuroblastomas, are presently known for 12 tissue types. We developed algorithms to assign these tags to UniGene clusters and their chromosomal position. The resulting Human Transcriptome Map generates gene expression profiles for any chromosomal region in 12 normal and pathologic tissue types. The map reveals a clustering of highly expressed genes to specific chromosomal regions. It provides a tool to search for genes that are overexpressed or silenced in cancer. GeneMap’99 (1) gives the chromosomal position of 45,049 human expressed sequence tags (ESTs) and genes belonging to 24,106 UniGene clusters. To obtain an expression profile of these genes, we made Department of Human Genetics, 2Department of Pediatric Oncology, Emma Children’s Hospital, Academic Medical Center, University of Amsterdam, Post Office Box 22700, 1100 DE Amsterdam, Netherlands. 3 Bioinformatics Laboratory, 4Neurozintuigen Laboratory, 5Department of Clinical Epidemiology and Biostatistics, Academic Medical Center, University of Amsterdam, Amsterdam, Netherlands. 6Department of Pathology and Department of Genetics, Duke University Medical Center, Durham, NC 27710, USA. 1
use of the SAGE technology and databases. SAGE can quantitatively identify all transcripts expressed in a tissue or cell line (2). It is based on the extraction of a 10 – base pair (bp) tag from a fixed position in each transcript and the sequencing of thousands of these tags. Software programs and databases support the identification of the mRNAs corresponding to the tags in a SAGE library. However, this step is prone to errors, and tag assignment requires manual verification. The National Center for Biotechnology Information (NCBI) SAGEmap database has electronically extracted tags from mRNAs and ESTs in UniGene clusters. A manual
www.sciencemag.org SCIENCE VOL 291 16 FEBRUARY 2001
1289
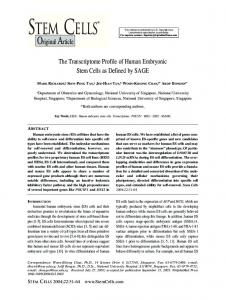
check of 156 tags extracted from 30 UniGene clusters showed that wrong tags mainly stemmed from sequence errors in ESTs and from errors in their 5⬘ and 3⬘ orientations. We developed algorithms to select 3⬘-end clones of 713,489 ESTs assigned to UniGene clusters and identified their tags. Sequence comparison algorithms discarded tags caused by sequence errors while preserving tags from alternative transcripts or single nucleotide polymorphisms [see supplementary information for AMCtagmap details (3)]. We identified reliable tags for 18,954 of the Fig. 1. Whole chromosome view of expression levels of the 1208 UniGene clusters mapped to chromosome 11 on the GB4 radiation hybrid map of GeneMap’99. Each unit on the vertical axis represents one UniGene cluster. UniGene clusters mapped by several markers are only shown once, at the position of the highest lod score (the logarithm of the odds ratio for linkage). Only clusters for which we could extract a tag with our algorithms are included. Expression is shown for SAGE libraries of 8 out of the 12 available tissue types. Expression levels in the libraries are normalized per 100,000 tags. Expression levels from 0 to 15 tags are shown by horizontal blue bars. Tag frequencies over 15 are shown by red bars. The blue-only section to the right represents a moving median with a window size of 39 UniGene clusters generated from the expression levels in “all tissues.” Green bars indicate RIDGEs. The boxed region shows the tissue-specific expression of a cluster of five metalloproteinases and two apoptosis inhibitors in normal breast tissue and breast cancer tissue.
1290
24,106 UniGene clusters mapped on GeneMap’99. Manual analysis of 287 tags extracted from 86 UniGene clusters from intervals of chromosomes 1 and 22 showed an error rate of 6.2% in our electronic tag identification algorithms. To check for errors in UniGene clustering, we verified tags on the available sequenced P1-derived artificial chromosomes (PACs) of the mapped markers and annotated them accordingly [see legend to Fig. 2 and supplementary information (3)]. The Human Transcriptome Map [for
Web site, see (4)] uses these tag assignments to relate 2.31 million tags in public SAGE libraries (NCBI SAGEmap database) (5) and 160,000 tags in our neuroblastoma SAGE libraries to the UniGene clusters mapped in GeneMap’99. The Human Transcriptome Map shows expression profiles for any chromosomal region in 12 tissue types. SAGE libraries of a specific tissue were combined into tissue-specific libraries (e.g., normal colon). We included tissues for which 100,000 or more tags were available, as most transcripts in a tissue are represented in a library of this size (6 ). Five libraries represent normal tissues (colon epithelium, brain, mammary gland, ovary, and prostate), and seven libraries represent tumor tissues (neuroblastoma, glioblastoma, medulloblastoma, and carcinomas of colon, ovary, breast, and prostate). The Human Transcriptome Map has three levels of resolution. The “whole chromosome view” shows gene expression per chromosome (Fig. 1). Each horizontal blue or red bar represents the expression level of a UniGene cluster. UniGene clusters mapped by several markers are shown only once, at the position of the highest reliability (1). The identity, map position, and precise expression of the genes are shown in the “concise interval view.” The highest resolution is given by the “extended interval view,” where expression levels are shown for all individual tags of a gene (Fig. 2). The whole chromosome views reveal a higher order organization of the genome, as there is a strong clustering of highly expressed genes. Chromosome 11 has several large regions of high gene expression, interspersed with regions where gene expression is low (Fig. 1). This pattern is observed in all 12 tissues. An application of a moving median with a window size of 39 genes to the chromosome 11 map even more clearly visualizes the expression differences (Fig. 1, blue graph to the right). Most chromosomes show these clusters of highly expressed genes, which we call RIDGEs (regions of increased gene expression) (Fig. 3). A quantitative definition of RIDGEs is not straightforward, as there is a continuum from small to very large clusters. We analyzed whether RIDGEs can be explained by a random variation in the distribution of highly expressed genes among the 18,954 genes of the Human Transcriptome Map. When defined as regions in which 10 consecutive moving medians have a lower limit of four times the genomic median, we identify 27 RIDGEs (green bars in Figs. 1 and 3). The probability of observing this number of RIDGEs under a random permutation of the order of the 18,954 genes is very low [P ⫽ 10⫺12; see supplementary information (3)]. In addition, Bayesian statistical model-
16 FEBRUARY 2001 VOL 291 SCIENCE www.sciencemag.org
Downloaded from www.sciencemag.org on July 16, 2010
ANALYSIS OF GENOMIC INFORMATION
ANALYSIS OF GENOMIC INFORMATION likely represent a higher order structure in the genome. Analysis of RIDGEs for physical characteristics suggests that many of them have a
high gene density. Chromosome 18 is, on average, weakly expressed, and only 385 genes have been mapped to it on GeneMap’99. The equally large chromosome 19
Fig. 2. Extended interval view of a chromosome 2p region showing neuroblastoma-specific overexpression of the neighboring genes Nmyc (UniGene Hs. 25960) and DDX-1 (UniGene Hs. 78580). A small part of the interval D2S287 to D2S2375 is shown. The left columns show the marker and centiray position as defined on GeneMap’99. The right side shows the UniGene number, tag sequence, and the description of the UniGene cluster. Expression levels in the libraries are normalized per 100,000 tags and shown by colored bars with a range from 0 to 15. Numbers give the tag counts per 100,000 tags. The tags are annotated by symbols. To identify tags produced by hybrid UniGene clusters, we analyzed for each marker of GeneMap’99 the corresponding PAC sequenced in the Human Genome Project, as
well as two adjacent PACs. Tags that are present on these PACs are from ESTs belonging to the mapped marker and are marked by P in a light green box. Tags not present on these PACs are probably derived from a contaminating EST not belonging to the mapped marker and are marked by P in a red box [see Web site (4)]. This check is not yet available for all markers. Tags belonging to more than one UniGene cluster are marked by 2/3 or >3 in a yellow box. The expression levels of tags belonging to more than three clusters are not shown and are not used in the totals of the concise interval maps and the whole chromosome maps. Tags from ESTs of opposite orientation in the UniGene cluster are marked with AS in a purple box.
Fig. 3. Regional expression profiles for 23 human chromosomes show a clustering of highly expressed genes in RIDGEs. Expression levels are shown as a moving median with a window size of 39 genes. There are 74 regions
with one or more consecutive moving medians that have a lower limit of four times the genomic median; 27 of them have a length of at least 10 consecutive moving medians (indicated by green bars).
www.sciencemag.org SCIENCE VOL 291 16 FEBRUARY 2001
Downloaded from www.sciencemag.org on July 16, 2010
ing without prior cluster definition showed that a model of nonrandom distribution provided the best fit with the observed clustering. These analyses show that RIDGEs most
1291
consists of a succession of RIDGEs and harbors 937 mapped genes (Fig. 3). Although many human genes are still unmapped, the difference in gene density of chromosomes 18 and 19 is supported by CpG island density analyses (7). The correlation between RIDGEs and gene density is even more suggestive for chromosomes 3 and 6 (Fig. 4). The RIDGE on chromosome 6 corresponds to the major histocompatibility complex (MHC) region. A correlation between gene expression and density of mapped genes is found for 50 to 60% of the RIDGEs [Web fig. 1 (3)]. Typical RIDGEs count 6 to 30 mapped genes per centiray, compared to 1 to 2 mapped genes per centiray for weakly transcribed regions. In RIDGEs, average expression levels per gene are up to seven times that of the genomic average. This suggests that in RIDGEs, transcription per unit length of DNA is 20 to 200 times that in weakly expressed regions. About 40 to 50% of the RIDGEs are not gene dense. These RIDGEs preferentially map to telomeres, which is remarkable in light of the observed telomeric silencing in yeast (8, 9). Chromosomes 4, 13, 18, and 21 show an overall low gene expression and are devoid of RIDGEs (Fig. 3). The latter three chromosomes are responsible for most constitutional trisomies, suggesting that the low expression and low gene density could limit the lethality of an extra copy of them. The Human Transcriptome Map provides a tool to identify candidate genes that are overexpressed or silenced in cancer tissue. Neuroblastomas frequently show amplification of the distal chromosome 2p region, which targets the N-myc oncogene Fig. 4. Comparison of median gene expression levels and gene density for chromosomes 3 and 6. The left diagrams of each chromosome show the expression levels as a moving median with a window size of 39 UniGene clusters. The right diagram of each chromosome shows gene density. For each UniGene cluster, we calculated the average distance between adjacent clusters in a window of 39 adjacent UniGene clusters. The inverse of this value is shown (inverse centirays per gene).
(10). Comparison of the whole chromosome views of chromosome 2p shows overexpression of two adjacent genes in neuroblastoma SAGE libraries. The extended interval view identifies these genes as N-myc and the often coamplified neighboring gene DDX-1 (Fig. 2). Therefore, global positional information of chromosomal defects is sufficient to identify candidate oncogenes (11). Also, tumor-specific down-regulation can be detected. Examples are a cluster of five matrix metalloproteinases on chromosome 11 [348 to 353 centirays (cR)] that are down-regulated in breast cancer tissue (Fig. 1, box); the E-cadherin tumor suppressor gene on chromosome 16 (406 cR) that is down-regulated in breast cancer tissue, as compared to normal breast tissue; and five carcinoembryonic antigen–related cell adhesion molecule genes on chromosome 19 (238 to 244 cR) that are down-regulated in colon carcinoma tissue, as compared to normal colon tissue (4). Potential error sources in the Human Transcriptome Map are clustering errors in UniGene and the assignment of wrong tags to UniGene clusters. Our algorithms assign ⬃6.2% erroneous tags to UniGene clusters. The influence of these errors is probably attenuated. Assuming a total of 100,000 genes with 2 tags each, 200,000 tags would represent all human genes. Because there are ⬎1 million variants of a 10-bp tag sequence, ⬃80% of the erroneously extracted tags will not match tags present in SAGE libraries and therefore will not influence overall expression profiles. However, individual tags and expression levels of UniGene clusters may harbor
errors and require experimental confirmation. To test whether errors in UniGene clustering and mapping to GeneMap’99 may influence our observation of RIDGEs, we constructed a sequence-based expression map for the annotated chromosome 21 sequence and for a 4.3-Mb annotated contig of the MHC region on chromosome 6 (12, 13). Also, these maps showed that the MHC region is a pronounced RIDGE, whereas chromosome 21 is devoid of RIDGEs and has an overall weak gene expression [see Web fig. 4 for maps (3)]. Therefore, the higher order structure of the genome observed with the Human Transcriptome Map will largely be correct. The existence of RIDGEs is unanticipated, as a comparable SAGE-based transcriptome map for yeast showed an even distribution over the genome of highly and weakly expressed genes (8). Because the Human Transcriptome Map identifies different types of transcription domains, it can now be analyzed as to how they relate to known nuclear substructures, such as nuclear speckles, PML bodies, and coiled bodies (14 –16 ). Definition of the position of tags to the full chromosomal sequences will further increase the resolution of the transcriptome map. Incorporation of the growing number of SAGE libraries from different tissues and various developmental stages will extend the overview of gene expression profiles in the human body. References and Notes
1. P. Deloukas et al., Science 282, 744 (1998). 2. V. E. Velculescu, L. Zhang, B. Vogelstein, K. W. Kinzler, Science 270, 484 (1995). 3. Supplemental Web material is available at www. sciencemag.org/cgi/content/full/291/5507/1289/ DC1. 4. The Human Transcriptome Map is available at http:// bioinfo.amc.uva.nl/HTM/. 5. A. Lal et al., Cancer Res. 59, 5403 (1999). 6. V. E. Velculescu et al., Nature Genet. 23, 387 (1999). 7. J. M. Craig, W. A. Bickmore, Nature Genet. 7, 376 (1994). 8. V. E. Velculescu et al., Cell 88, 243 (1997). 9. D. E. Gottschling, O. M. Aparicio, B. L. Billington, V. A. Zakian, Cell 63, 751 (1990). 10. M. Schwab et al., Nature 305, 245 (1983). 11. N. Spieker et al., Genomics, in press. 12. The MHC Sequencing Consortium, Nature 401, 921 (1999). 13. M. Hattori et al., Nature 405, 311 (2000). 14. D. G. Wansink et al., J. Cell Biol. 122, 283 (1993). 15. X. Wei, S. Somanathan, J. Samarabandu, R. Berezney, J. Cell Biol. 146, 543 (1999). 16. D. A. Jackson, F. J. Iborra, E. M. Manders, P. R. Cook, Mol. Biol. Cell 9, 1523 (1998). 17. We thank A. Luyf and A. Sha Sawari for their help in computational analyses, A. Lash for use of the SAGEmap database and help in tag analyses, and E. Roos for expert digital imaging. Supported by grants from the Stichting Kindergeneeskundig Kankeronderzoek, the A. Meelmeijer Fund, and the Dutch Cancer Society. H.C. is a fellow of the Dutch Royal Academy of Sciences. 23 October 2000; accepted 11 January 2001
1292
16 FEBRUARY 2001 VOL 291 SCIENCE www.sciencemag.org
Downloaded from www.sciencemag.org on July 16, 2010
ANALYSIS OF GENOMIC INFORMATION