Gregory K. W. K. Chung, Project Director, CRESST/University of California, ... the way engineering schools are adopting problem-based instruction to meet the.
The Impact of a Simulation and Problem-Based Learning Design Project on Student Learning and Teamwork Skills CSE Technical Report 599 Gregory K. W. K. Chung CRESST/University of California, Los Angeles
June 2003
Center for the Study of Evaluation National Center for Research on Evaluation, Standards, and Student Testing Graduate School of Education & Information Studies University of California, Los Angeles Los Angeles, CA 90095-1522 (310) 206-1532
Gregory K. W. K. Chung, Project Director, CRESST/University of California, Los Angeles Copyright © 2003 The Regents of the University of California The work reported herein was supported under the Civil and Environmental Engineering Department at the University of California, Los Angeles, PR/Award Number EEC-9700753, as administered by the National Science Foundation. The findings and opinions expressed in this report do not reflect the positions or policies of the Civil and Environmental Engineering Department at the University of California, Los Angeles, or the National Science Foundation.
THE IMPACT OF A SIMULATION AND PROBLEM-BASED LEARNING DESIGN PROJECT ON STUDENT LEARNING AND TEAMWORK SKILLS Gregory K. W. K. Chung and Eva L. Baker CRESST/ University of California, Los Angeles Thomas C. Harmon and Glenn A. Burks Department of Civil and Environmental Engineering/ University of California, Los Angeles Abstract This study examined a civil engineering capstone course that embedded a sophisticated simulation-based task within instruction. Students were required to conduct a hazardous waste site investigation using the simulation software designed specifically for the course (Interactive Site Investigation Software [ISIS]). The software simulated physical processes as well as real-world engineering processes. Our main research question focused on how ISIS impacted students’ learning of course-related content, ability to handle complex, open-ended problems, attitudes toward ISIS and the course, and use of teamwork processes. We also gathered evidence on the validity of knowledge mapping for advanced students. Assessment of student outcomes was based on the use of constructed-response knowledge maps to measure content understanding, and surveys to measure student attitudes, use of cognitive processes, and use of teamwork processes. Students reported very positive attitudes toward the ISIS experience, demonstrated significant gains in knowledge across the course of ISIS use, and perceived the ISIS activity as being generally effective in improving their skills in handling complex projects, linking theory to real-world applications, and improving their problem solving performance. Our assessment of student outcomes was a successful first attempt, but more work is needed to validate our measures with advanced students, particularly when the task is complex and requires interdisciplinary knowledge and teamwork skills.
Modern engineering education is undergoing significant changes, notably in the way engineering schools are adopting problem-based instruction to meet the changing demands of engineering practice (Accreditation Board for Engineering and Technology, Inc. [ABET], 2000; American Society for Engineering Education [ASEE],
1
1996, 1998; Board on Engineering Education [BEE], 1995; Coward, Ailes, & Bardon, 2000; Dowell, Baum, & McTague, 1994; Meyers, 1995). Mastery of technical content is no longer sufficient. Increasingly, engineering programs are requiring students to work on team projects that are open-ended with loosely specified requirements, produce professional-quality reports and presentations, consider ethics and the impact of their field on society, and develop lifelong learning practices. An implicit goal of this shift in curricula is to produce graduates who will be ready to assume engineering tasks upon graduation—that is, with the skills to develop solutions to problems under competing constraints of functionality, cost, reliability, maintainability, and safety (Banios, 1991). The move from focusing solely on technical knowledge to viewing engineering education much more broadly has been driven by the recognition that engineering schools have failed to keep pace with the changing practices of today’s engineers. Various factors—global competition, the shift in spending priorities from national security to economic competitiveness, the use of new information technologies, materials, and processes—create an increasingly complex environment for engineers to work in (Banios, 1991; BEE, 1995; Dowell et al., 1994; Wulf, 2000). Today’s graduates are apprenticed for one to 2 years before they engage in meaningful engineering tasks. The half-life of engineering knowledge ranges from 2 to 7 years, yet the engineered systems are becoming more complex and multidisciplinary (Wulf, 2000). Today’s engineer must adapt to changing environments; engage in lifelong training to maintain their technical skills and knowledge; work effectively in a team; and have knowledge of the business, societal, and environmental impact of their work. To encourage engineering programs to respond to these changes, the Accreditation Board for Engineering and Technology (ABET) has specified 11 criteria for graduating students in their Engineering Criteria 2000 (EC2000). As an example of five of these criteria, EC2000 specifies that graduating students should have (a) an ability to apply knowledge of mathematics, science, and engineering; (b) an ability to design and conduct experiments, as well as to analyze and interpret data; (c) an ability to function in multidisciplinary teams; (d) an ability to identify, formulate, and solve engineering problems; and (e) an ability to communicate effectively (ABET, 2000; Besterfield-Sacre et al., 2000). One of the ways engineering programs have responded to these changes—both the changing demands of engineering and the EC2000 specifications—is to 2
implement capstone courses (Banios, 1991; Bond, 1995; Mertz, 1997; Newcomer, 1999; Safoutin et al., 2000). Banios (1991, p. 162) lists five attributes of a capstone course: Students should (a) have a significant and insightful team design project; (b) be required to focus and use much of the knowledge acquired in the curriculum; (c) solve problems representative of real-life engineering; (d) acquire an understanding of the professional aspects and culture of engineering; and (e) learn and practice project proposing, planning, and control. The problem scope of capstone courses varies by implementation; however, in general, the tasks are complex and cannot be solved by one person. The problems also tend to be ill defined and open-ended in the following sense: Broad requirements are laid out in the form of final deliverables and task-specific constraints, and students are expected to satisfy those requirements. In the process, students engage in activities that exercise a range of skills, including design, judgment, decision making, problem solving, and teamwork. For examples of capstone implementations, see Mertz (1997) for electrical engineering; Neumann and Woodfill (1998) for computer science and engineering; and Banios (1991); Cline and Powers (1997); Ellis et al. (1998); Matthew and Hughes (1994); McCracken and Waters (1999); and Safoutin et al. (2000) for general approaches to designing a capstone course. Current Study In this study we examined the implementation of a capstone course in civil engineering on the topic of hazardous materials. Student teams assumed the role of consultants contracted to carry out a hazardous waste site investigation of an abandoned airfield. Unlike typical capstone courses, the course in this study differed in two important ways. First, simulation software was developed to support the site investigation. The software, designated Interactive Site Investigation Software (ISIS), was custom developed in Java for creating an environment in which students could engage in a simulated site investigation. The software modeled the area under investigation, incorporating soil and contaminant transport properties in three dimensions. Thus, a realistic contaminant scenario could be created and could be varied in complexity. In addition, a traditional problem in this course was that the course duration and voluminous material precluded spending sufficient time on establishing an understanding of the links between theory and real-world situations. It was the instructor’s intent that the students learn these links by completing the ISIS design project.
3
In addition to simulating physical processes, ISIS also simulated the real-world engineering processes involved in a site investigation. For example, when students requested drilling at particular locations, the results of the drill would not be returned immediately. Rather, students were required to follow typical procedures—wait for the drilling to be completed, send the bore sample to the laboratory for analyses, wait for the analyses to be done, and then pay for the analyses from a fixed budget. The laboratory report was realistic in its presentation (i.e., only data were returned). Students needed to use the appropriate data in computations that would help them decide the next step in the investigation. Students engaged in a complex open-ended task with written and oral reports as products, which required students to use the same kinds of processes they would experience in real-world settings. The second significant feature of this course was its focus on attempting to measure the impact of ISIS on student learning, teamwork, and attitudes. While there exist numerous implementations of capstone courses purporting to improve the student experience, in general, there is little evidence supporting such assertions. Further, the evidence reported generally suffers from the following shortcomings: students’ self-reported perceptions of learning (vs. a direct measure of learning), instructors’ anecdotal reports of impact (vs. an experimental manipulation of treatment), use of untested (vs. validated) measures, and small sample sizes. In this study we attempted to address the methodological issues by basing the evaluation of ISIS impact around student outcomes. We used knowledge mapping to assess student learning, and we used surveys to measure teamwork skills and attitudes toward ISIS. However, because we had no prior experience with the use of knowledge mapping with advanced engineering students, we also explored in depth the validity of knowledge mapping measures for this population. Our focus on using modern assessment techniques is consistent with recent calls to use methods beyond course evaluations and student attitude surveys (ABET, 2000; ASEE, 1996, 1998; Waters & McCracken, 1997). This study is among the few to use a performance assessment to measure student learning, and one of the few to address the measurement of teamwork skills in an engineering context. For other examples of use of assessment in engineering education, see Dillon, Kondraske, Everett, and Volz (2000); Helland and Summers (1996); McMartin, McKenna, and Youssefi (2000); and Newstetter and Khan (1997). For assessment issues related to teamwork, see Aller (1993); Chung, O’Neil, and Herl (1999); Gentili et al. (1999); 4
Jacobson, Davis, and Licklider (1998); McKenna, Mongia, and Agogino (1998); and Seat, Poppen, Boone, and Parsons (1996). For general assessment issues in problembased contexts, see Duzer and McMartin (2000); Heywood (1999); and Safoutin et al. (2000). Thus, our evaluation focused on (a) assessment of student learning, (b) assessment of teamwork skills, and (c) assessment of student attitudes toward ISIS. These three issues directly address ABET/EC2000 criteria. Our main research question was, how does students’ use of ISIS impact their overall learning of courserelated content, ability to handle complex, open-ended problems, attitudes toward ISIS and the course, and use of teamwork processes? A second research question addressed differential impact of ISIS on students: Whom does the use of ISIS benefit most? Does ISIS impact different kinds of students differently (e.g., by students’ gender, prior experience with complex projects, academic standing)? These issues were of particular interest for the instructor. And finally, we explored different ways of measuring student learning with knowledge maps in an attempt to understand how to measure learning in students who were already knowledgeable in a particular domain. PILOT STUDY Method A pilot study was conducted to test measures, tasks, and administration procedures. The pilot study occurred during the first implementation of ISIS in winter 1999. Our focus was to gather information on the first deployment of ISIS and develop and test the utility of knowledge mapping to measure content understanding. Knowledge mapping was unfamiliar to the instructor, and CRESST had never used knowledge mapping with engineering students. Participants and Setting Participants. Twenty-eight students, from one civil and environmental engineering capstone design course, participated in this study. In general, the sample was mostly male, mostly White and Asian American, and mostly upperdivision undergraduates. The mean age of the sample was 23 years (SD = 2.56 years; range = 20-30 years). Table 1 shows the distribution of participants by gender and academic standing.
5
Table 1 Distribution of Males and Females by Academic Standing Totala
Junior
Senior
Masters
Other
Male
3
7
6
2
18
Female
1
4
2
0
7
Total
4
11
8
2
25
a
Three participants did not fill out the survey.
Instructional setting. ISIS was implemented for the first time in a senior/master’s-level environmental engineering course. In this course, students were taught the principles of contaminant hydrogeology (physical chemistry, soil physics, and groundwater hydrology) through conventional lectures and homework problems. About halfway into the 10-week course, the students’ outside assignments became (virtual) data collection and interpretation using ISIS. More specifically, student teams completed a design project in the form of a Remedial InvestigationFeasibility Study (RI/FS) for a virtual hazardous waste site. ISIS tasks included drilling, collecting samples, analyzing samples, and performing field tests, and were designed to link theory outlined in the lectures to real-world situations. The lecture portion of the course continued to address only the theoretical aspects of contaminant hydrogeology with two exceptions: (a) Approximately two hours were dedicated to describing field equipment and techniques, and (b) approximately two hours were dedicated to describing real case studies exemplifying projects similar to the one the students were facing. Design and Procedure For the pilot test we attempted to implement a two-group, time-series design. Five mapping sessions were planned as homework exercises; however, because students rarely completed the mapping exercises on time for different reasons (access problems with Internet service providers, compliance), due dates were extended throughout the quarter. Thus, only three mapping exercises were completed. A student survey was administered during the last week of class. Researchers from CRESST demonstrated the use of the knowledge mapping software to the instructor and provided details on how to access the mapper over the Web and how to operate the mapper. The instructor then demonstrated the use of the mapper to his class and assigned knowledge maps as homework. Questions
6
about the knowledge mapper were handled by the course instructor and the course teaching assistant (TA). Tasks The CRESST knowledge mapping system was used to measure content understanding because of (a) its sensitivity to instruction (i.e., as students learn more, their knowledge mapping scores increase), (b) its demonstrated relationship with other measures of content understanding, (c) the ease that student knowledge maps could be scored relative to an expert criterion map, and (d) its availability via the Internet (Herl, Baker, & Niemi, 1996; Herl, O’Neil et al., 1996; Herl et al., 1999; Osmundson, Chung, Herl, & Klein, 1999; Ruiz-Primo, Schultz, & Shavelson, 1997; Ruiz-Primo & Shavelson, 1995). Development of knowledge mapping concepts and relationships. The effectiveness of knowledge maps as measures of content knowledge is dependent on the specification of the most important and relevant concepts and relationships. For this study, the instructor served as the domain expert and specified the concepts and relationships. The instructor used the online knowledge mapping system to build a criterion map, and while doing so refined the set of concepts and relationships. The final knowledge map used in the pilot study contained 25 concepts and 5 relationships, and is given in Table 2. Measures Student knowledge map. The instructor’s knowledge map was used as the expert criterion map for scoring purposes. The scoring algorithm was based on the method developed by Herl, Baker, et al. (1996). Briefly, the number of propositions in the student map (i.e., concept-relationship-concept) that also existed in the expert map was considered the map score. Because the student and expert maps were computer-based, the scoring was carried out automatically. Student survey. A 51-item student survey was used to gather the following kinds of information: (a) demographics; (b) amount of experience with complex projects; (c) amount of time spent on the project; (d) perceived effectiveness of ISIS in helping students with linking theory to real-world applications, large and complex projects, teamwork skills, and communication skills; (e) frequency that students used general problem solving processes; (f) teamwork; (g) availability of ISIS-related resources; and (h) perception of the knowledge mapping activity.
7
Table 2 Knowledge Map Concepts and Relationships Concepts Contaminant transport
NAPL
Darcy’s Law
Permeability
Diffusion
Piezometer
Dispersivity
Raoult’s Law
Distribution coefficient
Retardation
Drawdown test
Silty clay
Film transfer
Soil boring
Hollow-stem auger
Solubility
Hydraulic head
Split-spoon
Hydrogeology
Tracer test
Interstitial velocity
Vapor pressure
MODFLOW
VOC
MT3D Relationships Field activity preceding measurement or identification
Soil or chemical type to soil or chemical property
Measurement to model parameter
Theoretical model to reality
Model parameter to theoretical model
Results Knowledge mapping manipulation checks. Prior to analyzing the data, we examined the survey questions that asked participants how much they understood the knowledge mapping task. When asked about the meaning of the concepts and relationships, many students disagreed or strongly disagreed that the meanings of the concepts were clear (10 of 25), and nearly all students did not think the meanings of the relationships were clear (21 of 25). In addition, when asked how effective they thought the knowledge mapping was for representing their understanding, or helping them think about how the concepts were related, a large majority reported knowledge mapping as being somewhat effective or not effective (18 of 25, and 17 of 25, respectively). Because these results suggest that students did not understand the nature of the knowledge mapping task, the knowledge map data were dropped from the pilot study.
8
ISIS project experience. In general, students reported the ISIS project as being moderately difficult or difficult, and they reported having experienced projects of similar complexity in college, in general, less than 1-2 times before. Only 6 students reported having projects of similar complexity 3 or more times in college. Students reported spending an average of 6.9 hours (S D = 2.9 hours) outside of class (including lab time) on the ISIS project. The number of hours ranged from 4 to 16 hours. Twenty-one students agreed or strongly agreed that they spent much more time on the project than expected. Teamwork. When asked how effective the ISIS project was in helping them develop teamwork skills, 17 of 25 students reported that ISIS was effective or very effective. In terms of how often they used teamwork skills, 13 reported very often and 11 students reported using teamwork skills only sometimes. Overall, students reported that their teams worked effectively together. Access to ISIS. Finally, when asked about ISIS resources, most students (11 of 25) strongly agreed or agreed that their group had sufficient computer time, while most students (14 of 25) reported that more workstations were needed and that in general, greater access was needed. Survey scales. Five scales were formed from the selected items of the student survey: (a) effectiveness of ISIS in helping link theory with learning real-world applications, (b) effectiveness of ISIS in helping develop skills to handle complex projects, (c) attitudes toward ISIS, (d) attitudes toward the course, and (e) general problem solving processes. The scale items and associated alpha reliabilities are contained in Appendix A. Table 3 shows the means, standard deviations, and the correlations among scales and the final course grade. Attitudes toward ISIS and the course correlated significantly with each other, and with the perceived effectiveness of ISIS in helping link theory to real-world applications. Interestingly, use of general problem solving processes was significantly correlated with the course grade. The more positive students’ attitude toward ISIS, the more likely they were to perceive ISIS as effective in helping them link theory to the real-world applications. Similarly, the more students reported using problem solving strategies during the project, the higher their course grade.
9
Table 3 Descriptive Statistics and Interrcorrelations for Scales and Course Grade N
M
SD
2
3
4
5
1. Final grade
28
2. Effectiveness of ISIS in helping link theory to real worlda
25
2.20
0.53
.36
–
3. Effectiveness of ISIS in helping develop skills to handle complex projectsa
25
2.41
0.61
.05
.37
–
4. Positive attitudes toward ISISa
19
2.00
0.53
.40
.49*
.44
–
5. Positive attitudes toward course
25
1.78
0.43
.12
.51*
.27
.51*
–
6. Use of general problem solving processesc
25
1.63
0.32
.43*
.26
.25
.16
.07
b
74.24 13.88
1 –
a
1 = very effective, 2 = effective, 3 = somewhat effective, 4 = not effective. b1 = strongly agree, 2 = agree, 3 = disagree, 4 = strongly disagree. c1 = very often, 2 = sometimes, 3 = rarely, 4 = never.
*p < .05 (two-tailed). **p < .01 (two-tailed).
Analyses of Condition Effects Analyses were done to explore for differences on the final course grade and survey scales based on (a) ISIS usage, (b) prior experience with complex projects, (c) gender, (d) role in team, and (e) academic standing. The Mann-Whitney nonparametric procedure was used to test for group differences on the final grade and each of the scales, as shown in Table 4. Because these analyses were exploratory, no adjustments were made to the p-value. The p-value for all tests was set to .05. Significant differences were found between experienced and less experienced students. Students who reported having three or more projects as complex as the site investigation project during college, compared to students who reported no experience, had higher course grades, reported that the project was more effective in helping them handle complex projects, and reported using more problem solving processes. This finding is interesting because it points to how complex the ISIS project was, and suggests (for those students that did not have experience) that the experience from a project as complex as the site investigation project will be beneficial to them in the future. No other significant differences were found.
10
Table 4 Descriptive Statistics on Student Survey Scales by Various Conditions
Final grade Variable Used ISIS
Condition
Team role
Academic standing
a
M
SD
n
M
SD
Effectiveness of ISIS in helping develop skills to handle complex projectsa n
M
SD
Positive attitudes toward ISISa n
M
SD
Positive Use of general attitudes toward problem solving courseb processesa n
M
SD
n
M
SD
Yes
19 71.81
14.61
19 2.09
0.52
6 2.29
0.63
–
–
19 1.82
0.42
18 1.63
0.35
No
6 76.33
11.83
6 2.53
0.43
6 2.78
0.37
–
–
6 1.67
0.52
9 1.62
0.25
7 82.63* 7.97
7 2.03
0.67
7 1.96*
0.58
4 1.62
0.48
7 1.50
0.55
7 1.42* 0.23
6 68.10
11.13
6 2.49
0.50
6 2.70
0.34
4 1.88
0.63
6 1.79
0.57
6 1.79
0.14
18 71.68
14.73
18 2.24
0.42
18 2.43
0.57
18 2.00
0.48
18 1.81
0.42
18 1.68
0.31
Female
7 76.03
11.89
7 2.09
0.77
7 2.36
0.75
7 2.00
0.71
7 1.71
0.49
7 1.49
0.34
Project manager
5 79.40
15.22
5 1.88
0.67
5 2.15
0.45
5 2.00
0.50
5 1.80
0.45
5 1.45
0.14
Member
20 71.27
13.46
20 2.28
0.47
20 2.47
0.64
14 2.00
0.55
20 1.78
0.44
20 1.67
0.34
Undergraduate
17 67.69* 13.42
16 2.19
0.60
16 2.49
0.58
12 1.92
0.60
16 1.81
0.44
16 1.73* 0.32
Graduate
11 84.35
9 2.21
0.42
9 2.25
0.67
7 2.14
0.38
9 1.72
0.44
Experienced Experienced with complex Not projects experienced Gender
n
Effectiveness of ISIS in helping link theory to real worlda
Male
6.85
1 = very effective, 2 = effective, 3 = somewhat effective, 4 = not effective. b1 = strongly agree, 2 = agree, 3 = disagree, 4 = strongly disagree.
*p < .05 (two-tailed). **p < .01 (two-tailed).
11
9 1.44
0.25
In the pilot study seven teams were formed, two of which did not have access to ISIS. Table 5 shows descriptive statistics for performance on the final team products (written report and presentation). The groups that did not use ISIS reported higher levels of effectiveness of the site investigation project and scored higher on the oral and written presentations. No statistical tests between the ISIS and non-ISIS conditions were performed due to the small sample size. Discussion The results of the pilot study suggested three changes to the evaluation. First, the knowledge mapping task clearly needed revision. Students did not understand the meaning of the relationships, and the use of knowledge maps for homework assignments did not work. Thus, for the main study, we sought to simplify the knowledge mapping task in terms of administration and the specification of concepts and relationships. Second, the correlations observed among the survey scales, particularly the relationships, between the reported use of problem solving processes and final grade, and between the attitude and perceived effectiveness of the project were interesting. These findings suggested to us that we include a measure of students’ self-regulation behavior (i.e., planning and self-checking) to help explain students’ performance. Third, students’ positive responses to questions about the effectiveness of ISIS on developing teamwork skills suggested to us that a measure of teamwork be included to investigate in greater detail teamwork effects.
Table 5 Means and Standard Deviations of Course Outcomes by ISIS Use Presentation
Written report
Condition
n
M
SD
M
ISIS
5
76.70
10.03
85.20
5.81
Non-ISIS
2
92.50
6.36
92.00
2.83
12
SD
MAIN STUDY Method Participants and Setting Participants. Eighteen students, drawn from one civil engineering capstone design course, participated in this study. In general, the sample were mostly White and distributed evenly by academic standing. The mean age of the sample was 25 years (SD = 3.2 years; range = 21-31 years). Table 6 shows the distribution of participants by gender and academic standing. The instructional setting was similar to the pilot test. Design A one-group, nonrandomized pre-posttest design was used in this study. We originally planned to conduct an experimental two-group, randomized pre-posttest design but the enrollment in the class was unexpectedly low. Thus, all students participated in teams that were given access to ISIS and there was no control group. Tasks Data were collected before and after the ISIS project. The pretests consisted of a knowledge mapping pretest, a teamwork survey pretest, and a self-regulation survey. The posttests consisted of a knowledge mapping posttest and a teamwork survey posttest. The same teamwork survey was used for the pre- and posttests. Measures Knowledge mapping. Knowledge maps were used as measures of students’ content understanding. All knowledge maps received two ratings, based on two Table 6 Distribution of Males and Females by Academic Standing
a
Junior
Senior
Masters
Totala
Male
3
2
3
8
Female
2
4
3
9
Total
5
6
6
17
One participant did not fill out the survey.
13
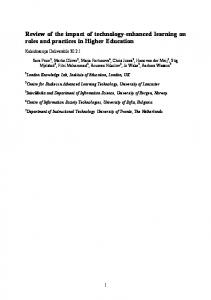
scoring methods: (a) an expert content score and (b) a proposition quality score. Scoring student maps against the expert map provided information on how students understood the concepts overall, while scoring individual propositions provided information about the quality of particular propositions. The difference between the scoring methods is in the information available for instructional purposes. The content score yields a single number for the entire map, and the proposition score yields a single number for each proposition in the map. The development of the knowledge map task for the main study followed the same process as in the pilot study and, in addition, included input from the course TA. The final expert knowledge map contained 17 concepts and 4 relationships and is given in Table 7. The criterion knowledge map is shown in Figure 1 and Appendix B contains the list of propositions for the expert map.
Table 7 Knowledge Map Concepts and Relationships Concepts Contaminant transport
Isotherm test
Darcy's Law
NAPL dissolution
Diffusion
Permeability
Dispersion
Piezometer
Drawdown test
Retardation
Film transfer
Slug test
Groundwater flow
Sorption
Hydraulic conductivity
Tracer test
Hydraulic head Relationships Affects
Measures
Is a model parameter
Models
14
Figure 1. User interface of the online knowledge mapping system. The map shown is the expert criterion map used for scoring students’ maps.
Knowledge map proposition quality. The second scoring approach was adopted from Osmundson et al. (1999). Each proposition was rated for quality, as defined in Table 8. Proposition scores ranged from illogical or impossible connections (score = 0) to most highly principled, most scientifically correct connections (score = 3). The two midpoints represent pragmatic understandings (score = 1) and scientific understandings (score = 2). Once each map proposition is scored on this scale, the number of illogical, pragmatic, scientific, and highly principled propositions is calculated for each student’s map. The instructor (expert) scored each unique proposition culled from all student maps. A total of 192 unique propositions were generated by students across two knowledge mapping occasions (i.e., the pre- and posttests), out of a total of 1,088 possible propositions (c × (c – 1) × l, where c = the number of concepts, l = the number of links). Interestingly, students used about 18% of the possible propositions, which is similar to 15% used in the Osmundson et al. (1999) study (720 out of 5,880 propositions).
15
Table 8 Description and Examples of Propositions Used in the Quality Rating Approach Score
Description of proposition
Example
0
Proposition does not make sense in any circumstance. Illogical/inappropriate.
Tracer test MODELS hydraulic conductivity
1
Proposition appropriate and correct in an everyday, pragmatic sense. Explanatory power is limited to an everyday event.
Tracer test MEASURES hydraulic conductivity
2
Proposition appropriate. Reflects scientific understanding, but has limited explanatory power.
Tracer test MEASURES ground water flow
3
Proposition is abstract and explanatory. Reflects most highly principled, scientific understanding.
Tracer test MEASURES dispersion
The scoring activity resulted in the instructor reporting that the expert knowledge map was incomplete. Some students created propositions that were appropriate and of high quality but excluded from the expert map. Thus, the expert map was modified to include new student propositions and student maps were rescored. New propositions. A subset of students’ posttest knowledge map, which we defined as “new propositions,” was derived from the posttest knowledge map. To operationalize this map, we removed all propositions from the posttest map that also existed in the pretest. This new proposition map was then scored using the expert criterion (content) method and the proposition quality rating method to yield two additional, new-proposition scores. We reasoned that the new-proposition scores would be an indicator of knowledge gained over the course of the ISIS activity. This procedure is numerically similar to computing gain scores, but also allows for the examination of the type of proposition introduced at the posttest. Thus, each student had pretest and posttest content scores, pretest and posttest scores on each type of proposition (nonsense, pragmatic, scientific, principled), a posttest new-proposition content score, and posttest scores for new propositions on each type of proposition. Student survey. A 52-item student survey was used to gather the following kinds of information: (a) demographics; (b) amount of experience with complex projects; (c) amount of time spent on the project; (d) perceived effectiveness of ISIS in helping students link theory to real-world applications, and large and complex projects; (e) frequency that students used general problem solving processes;
16
(f) availability of ISIS-related resources; and (g) perception of the knowledge mapping activity. The full survey is contained in Appendix C. Teamwork survey, pretest and posttest. A 23-item student survey was used to gather information on students’ self-reported use of teamwork processes. The survey was adapted from O’Neil, Wang, Chung, and Herl (2000). This questionnaire consisted of six scales measuring teamwork skills. The six teamwork scales were adaptability (e.g., When I work as part of a team, I help to solve problems by using information provided by the team); coordination (e.g., When I work as part of a team, I focus on completing the team task successfully); decision making (e.g., When I work as part of a team, I identify possible alternatives); leadership (e.g., When I work as part of a team, I exercise leadership); communication (e.g., When I work as a member of a team, I attempt to change incorrect information immediately); and interpersonal skills (e.g., When I work as part of a team, I interact cooperatively with other team members). Survey item responses were (1) almost never, (2) sometimes, (3) often, and (4) almost always. The teamwork survey was administered before and after the ISIS activity. Self-regulation survey. A 32-item student survey was used to gather information on students’ self-reported use of self-regulation skills. The survey was adapted from Herl et al. (1999). This questionnaire consisted of four scales that make up self-regulation. The scales are planning (e.g., I determine how to solve a task before I begin); self-checking (e.g., I check how well I am doing when I solve a task); effort (e.g., I work hard to do well even if I don’t like a task); and self-efficacy (e.g., I believe I will receive an excellent grade in this course). Item responses were (1) almost never, (2) sometimes, (3) often, and (4) almost always. For this study, we were only interested in the scales related to cognitive processing (i.e., planning and self-checking). The affective scales (effort, worry) were not used in the analyses. Course outcomes. Final course grade (0–12 point scale) was used as the course outcome measure. Procedure Pretest. An individual mapping task was administered to all students prior to the start of the ISIS part of the course (Week 6 of 10). For the knowledge mapping task, a blank map was presented to students, and the researcher demonstrated how to add concepts, create relationships, and delete concepts and relationships. During the pretest, the class TA assisted in the data collection. He helped explain the idea of knowledge maps in terms familiar to the students. Students were given up to 20 17
minutes to complete their knowledge maps. Following the knowledge mapping task, students were given the self-regulation and teamwork surveys to complete. The entire pretest activity took less than one hour to complete. During the period between the pretest and posttest, students conducted their site investigation with ISIS and attended the class lectures. Each group was scheduled to use the computer lab twice a week for 2 hours to work on ISIS (ISIS was not accessible outside of the lab). No instructional time was provided to students to work on the ISIS project. Posttest. The posttest occurred during Week 10 of the course. Week 10 was the last instructional week, and Week 11 was when the oral and written group reports were due. The procedure used in the posttest was the same as the pretest, except that the TA was not present to assist. The knowledge mapping task was administered first. The researcher went through a brief demonstration of how to operate the map (most students remembered how to use the software). After the training, students were presented with a blank map and instructed to construct a knowledge map within 20 minutes. Following the knowledge map, students were given the student survey and the posttest teamwork survey. The entire posttest task took less than one hour to complete. Table 9 summarizes the design and procedure for the main study. Results In the following discussion we present results in three sections. First, descriptive statistics and intercorrelations are presented for the student, teamwork, and self-regulation surveys, followed by the knowledge mapping measures. Next, we focus on answering research questions. We examine the effects of ISIS on student Table 9 Design of Main Study Occasion and tasks Week 6 (a) Classroom instruction (b) Knowledge map pretest (c) Teamwork survey pretest (d) Self-regulation survey
Weeks 7-9 (a) Classroom instruction (b) Design project using ISIS
18
Week 10 (a) Classroom instruction (b) Knowledge map posttest (c) Teamwork survey posttest
learning, attitudes, and teamwork, with respect to the relationships among the survey and knowledge map measures. Survey Results ISIS project experience. In general, students reported the ISIS project as difficult or moderately difficult (14 of 17), and they reported having experienced projects of similar complexity previous to ISIS (1-2 times: 9 of 17; 3-5 times: 6 of 17). Students reported spending an average of 4.6 hours (SD = 1.5 hours) on the laboratory activity, and an additional 3.8 hours (SD = 2.3 hours) outside of class on the ISIS project, per week. The number of hours ranged from 1 to 10 hours. Thirteen of 17 students agreed or strongly agreed that they spent much more time on the project than expected. Overall, nearly all students (17 or 18 out of 18) found the use of ISIS interesting, would recommend the course to other students, and felt they learned a lot from the project. Access to ISIS. When asked about ISIS resources, most students (14 of 18) strongly agreed or agreed that their team had sufficient computer time, while most students reported that more workstations were needed (12 of 18), and that in general, greater access was needed (15 of 18). These responses are contradictory in that students reported having sufficient computer time, yet they wanted more access. This result may reflect a desire to have a more convenient means of accessing ISIS resources rather than a need to have more access. Student survey scales. Six scales were formed from the selected items of the student survey: (a) effectiveness of ISIS in helping develop skills to handle complex projects, (b) effectiveness of ISIS in helping link theory with learning real-world applications, (c) problem solving processes used during ISIS, (d) effectiveness of ISIS in helping improve problem solving processes, (e) attitudes toward ISIS, and (f) attitudes toward course. The scale items and associated alpha reliabilities are contained in Appendix D. The reliability for the attitudes toward the course scale was very low (α = .44); therefore, the attitudes scale was dropped from the analyses. Of the remaining scales, alphas ranged from .63 to .77. Table 10 shows the means, standard deviations, and the correlations among the student survey scales. Perceived effectiveness of ISIS with developing skills in managing complex projects was related significantly with perceived effectiveness of ISIS in helping link theory to real-world applications and with positive attitudes toward ISIS. 19
Table 10 Descriptive Statistics and Interrcorrelations (Spearman) for the Student Survey Scales (N = 18) Student survey scale
M
SD
Min. Max.
1 –
2
3
4
5
1.
Final grade
9.44 1.69
6.00 11.00
2.
Effectiveness of ISIS in helping develop skills to handle complex projectsa
3.63 0.73
2.00
5.00
.02
–
3.
Effectiveness of ISIS in helping link 3.56 0.52 theory to real worlda
2.67
4.33
.08
.58*
–
4.
Use of problem solving processesb
3.28 0.42
2.50
4.00
.09
.36
.32
–
5.
Effectiveness of ISIS in improving problem solvinga
3.48 0.60
2.33
4.67
-.00
.12
.12
.07
–
6.
Effectiveness of ISIS in developing positive attitudes toward ISISa
3.47 0.74
2.00
4.50
.00
.65**
.41
.04
.32
a
1 = not effective, 2 = somewhat effective, 3 = moderately effective, 4 = effective, 5 = very effective. b1 = almost never, 2 = sometimes, 3 = often, 4 = almost always. *p < .05 (two-tailed). **p < .01 (two-tailed).
Teamwork survey scales. Table 11 shows descriptive statistics and intercorrelations among teamwork survey scales by occasion. We dropped the adaptability and interpersonal scales because of low alpha reliabilities. For the remaining scales, alphas ranged from .59 to .89 on the pretest and .75 to .85 on the posttest. Subsequent analyses that include the teamwork scales are based only on the posttest scales. Table 11 Descriptive Statistics and Intercorrelations (Spearman) of Teamwork Skills, Pretest, and Posttest Teamwork Occasion scalea
n
Communi- Pretest cation Posttest
17 3.50 0.53
2.50
4.00
18 3.28 0.51
2.50
4.00
M
SD
Min. Max. Communication
Coordination
Decision making
.89** (pre-post)
Coordination
Pretest
17 3.31 0.67
2.00
4.00
.64 (pre)**
Posttest
18 3.06 0.83
1.00
4.00
.82 (post)**
Decision making
Pretest
17 3.40 0.55
2.25
4.00
.76 (pre)**
.64 (pre)**
Posttest
18 3.18 0.53
2.25
4.00
.82 (post)**
.68 (post)**
Pretest
17 2.85 0.66
2.00
4.00
.40 (pre)
.21 (pre)
.56 (pre)*
Posttest
18 2.68 0.63
2.00
4.00
.47 (post)*
.55 (post)*
.51 (post)*
Leadership a
1 = almost never, 2 = sometimes, 3 = often, 4 = almost always.
*p < .05 (two-tailed). **p < .01 (two-tailed).
20
Leadership
.71** (pre-post) .63** (pre-post) .56* (pre-post)
In general, the correlations among the scales were significant, positive, and of moderate magnitude. Leadership was used less than other processes, and the other team processes were used in similar amounts. Correlations for communication and coordination with other team processes were higher in the posttest than pretest. In general, the correlation within a scale, from pretest to posttest, was high for communication and coordination and moderate for decision making and leadership. Self-regulation survey. Table 12 shows descriptive statistics and intercorrelations among the self-regulation scales. A significant correlation was observed between planning and self-checking. The alpha reliabilities of the scales were .81 and .75, respectively. Knowledge Mapping Results Knowledge mapping manipulation check. Prior to analyzing the data, we examined the survey questions designed to evaluate the extent to which students understood the knowledge mapping task. When asked about the meaning of the concepts and relationships, many students agreed or strongly agreed that the meaning of the concept was clear (13 of 18), and most students reported that the meaning of the relationships was clear (10 of 17). These results were a substantial improvement over the pilot test responses; thus, although the number of respondents reporting not understanding the relationships was high, we concluded that most students sufficiently understood the knowledge map task. There were no significant differences on any of the posttest knowledge map measures between students reporting that the meaning of the relationships was clear and those who did not. Table 13 presents descriptive statistics for the three knowledge mapping measures for each scoring type (content, propositional). In general, posttest scores Table 12 Descriptive Statistics and Interrcorrelations (Spearman) for Self-Regulation Scales (N = 18) Self-regulation scalea
M
SD
Min. Max.
Planning
Planning
3.08 0.48
2.13
3.88
–
Self-checking
3.11 0.47
1.88
3.75
.72**
a
1 = almost never, 2 = sometimes, 3 = often, 4 = almost always.
*p < .05 (two-tailed). **p < .01 (two-tailed).
21
Table 13 Descriptive Statistics for Knowledge Mapping Measures Proposition quality score Occasion
Content score
Nonsense
Pragmatic
Scientific
Principled
Pretesta M (SD)
6.59 (2.94)
1.71 (1.45)
5.53 (2.35)
4.76 (2.54)
3.71 (1.93)
Min.
1
0
3
1
0
Max.
10
5
11
9
7
M (SD)
8.67 (1.97)
1.61 (1.33)
4.61 (2.20)
6.33 (1.37)
4.44 (1.62)
Min.
5
0
1
3
2
Max.
12
4
10
9
7
M (SD)
5.12 (1.73)
1.71 (1.31)
3.35 (2.06)
4.59 (1.23)
1.82 (1.38)
Min.
2
0
0
3
0
Max.
8
4
9
7
4
Posttestb
Posttest, new propositions onlya
a
n = 17. bn = 18.
were higher than pretest scores for the content method, and for scientific and principled propositions. When only new propositions were examined, the posttest scores were in general lower than the pretest scores. Because of the small sample size and the low number of nonsense and principled propositions, the propositions were collapsed to form two new measures. Scores for nonsense and pragmatic propositions were combined and scores for scientific and principled propositions were combined. We defined these new groupings as shallow and deep propositions as shown in Table 14. Table 15 presents descriptive statistics and intercorrelations among the three knowledge map measures (pretest, posttest, new proposition) and the final course grade. Assessment of Student Learning To address the issue of ISIS impact on students’ learning, we draw on the results of students’ pretest and posttest knowledge mapping performance. We focus on the relationship between performance on the knowledge map task and final
22
grade, the extent to which students’ content understanding improved from the pretest to the posttest, and the quality of students’ understanding. Knowledge map validity check. Prior to using the knowledge map measures in these analyses, we inspected the relationship among the different knowledge map scoring measures (see Table 15). Based on our prior work (Osmundson et al., 1999), we expected high correlations between the content score and deep proposition scores in general. As expected, there were significant correlations between the content score and the deep proposition score on the pretest (r sp = .94, p < .001), posttest (rsp = .82, p < .001), and new propositions (r s p = .76, p < .001). These correlations were similar to the findings in Osmundson et al. (1999) in direction, magnitude, and significance. These high correlations between the measures of the two scoring methods are expected, as both scoring methods are presumed to measure the same underlying construct (content knowledge). Additional evidence for the validity of knowledge mapping as a measure of student understanding is provided by the set of correlations in Table 16, between the self-regulation processes of planning and self-checking, and the shallow propositions. The more students reported that they engaged in self-regulation cognitive processes, the lower the number of shallow propositions they had overall in their posttest knowledge map. However, while the direction was positive for the content measure and deep propositions, these relationships were not significant. Based on these results, we concluded that the knowledge map measures were sensitive to learning and operating as expected. Table 14 Number of Propositions Classified as Shallow and Deep Propositions No. of propositions Type of proposition
Pretest n = 17
Posttest n = 18
Nonsense
29
29
Pragmatic
94
79
Scientific
81
107
Principled
63
68
Shallow
Deep
23
Table 15 Descriptive Statistics and Intercorrelations (Spearman) of Knowledge Mapping Measures Shallow propositions
Content n
M
SD
Min.
Max.
1
2
3
4
18
9.44
1.69
6
11
–
2. Pretest
17
6.59
2.94
1
10
.63**
–
3. Posttest
18
8.67
1.97
5
12
.37
.31
4. Posttest, new propositions
17
5.12
1.73
2
8
-.15
-.47
.39
–
5. Pretest
17
7.24
2.56
4
13
.19
.02
.03
.20
6. Posttest
18
6.22
2.65
4
11
-.09
.10
-.45
-.26
7. Posttest, new propositions
17
5.06
2.28
0
10
-.20
.03
-.57* -.31
8. Pretest
17
8.47
3.87
1
14
.49*
.94**
.36
-.42
9. Posttest
18
10.78
2.37
6
15
.49*
.50*
.82** .04
10. Posttest, new propositions
17
6.41
1.80
4
10
.01
5
6
Deep propositions 7
8
9
Course outcome 1. Final gradea Expert-based content scores –
Shallow propositions – .55*
–
.46
.94**
–
-.05
.03
-.07
–
-.06
-.23
-.37
.50*
.17
-.08
-.10
-.50*
Deep propositions
a
12-point scale.
*p < .05 (two-tailed). **p < .01 (two-tailed).
24
-.45
.21
.76**
– .23
Table 16 Correlations (Spearman) Between Student Survey Scales and Knowledge Map Measures (N = 18) Knowledge map measure Shallow propositions
Content Posttest
New propositions
Posttest
New propositions
Posttest
Planning
.45
.20
-.68**
-.79**
.44
.30
Self-checking
.36
.31
-.47*
-.56*
.34
.26
Self-regulation processa
a
Deep propositions New propositions
1 = almost never, 2 = sometimes, 3 = often, 4 = almost always.
*p < .05 (two-tailed). **p < .01 (two-tailed).
ISIS impact on learning. To test whether student learning occurred over the period of ISIS activity, paired t tests were conducted on the pretest and posttest scores of the content measure, shallow proposition measure, and deep proposition measure. Significant differences were found between the pretest and posttest on the content scores, t(16) = 2.77, p < .05, and deep knowledge measure, t(16) = 2.63, p < .05. Students had significantly higher content scores on the posttest than pretest, and had more deep propositions in their posttest knowledge map compared to their pretest knowledge map. Students also had fewer shallow propositions in their posttest map, but this difference was not significant (p = .14). To test for differences in the type of new propositions students introduced in their posttest knowledge map, a t test was conducted on the number of new shallow and deep propositions. Students introduced more deep propositions than shallow ones in their posttest, although this difference was not significant (p = .07). Overall, these results suggest that students did acquire knowledge over the course of the ISIS activity. Students’ posttest content scores were significantly higher than their pretest scores. Students introduced more deep propositions at the posttest than pretest and, of the new propositions introduced, most were deep propositions. Further, comparing the posttest content score (M = 6.59) with the posttest deepproposition score (M = 10.78) suggests that about 4 propositions on average were added by students on the posttest knowledge map. These additional propositions were not part of the expert map, yet they were still considered substantive.
25
Apparently, the ISIS activity provided opportunities for students to learn additional content. Quality of student learning: What was learned? An inspection of the most frequent propositions used in students’ maps provides additional information on the specific propositions used. As shown in Table 17, two propositions (draw down test MEASURES hydraulic conductivity; slug test MEASURES hydraulic conductivity) were introduced in the posttest map that were clearly new; that is, for the most part the propositions did not exist in any participant’s pretest map. On the other hand, the proposition, piezometer MEASURES hydraulic head, was used by most students prior to the start of the ISIS activity. Interestingly, most propositions that were added during the posttest mapping task were considered deep propositions, suggesting that students were learning substantive content. Also interesting is the extent that deep propositions existed in students’ pretest maps, which suggests that some students had considerable knowledge of the content prior to the ISIS activity.1 Finally, we examined students’ use of two relationships, is a model parameter and models. We presumed these relationships would be used more often as a result of the ISIS experience. Successful performance on the ISIS project required the use of theoretical formulae and derivation of parameters from the simulation data (i.e., linking theory to [simulated] real-world conditions). Table 18 shows the number of propositions for each relation, by type of proposition. For posttest maps with propositions using either relation, most of these propositions were new. This finding provides additional evidence that students profited from the ISIS experience. Interestingly, most of the shallow propositions were new as well, indicating a concomitant increase in conceptual and non-conceptual knowledge, a finding that is also consistent with prior work (Osmundson et al., 1999). For whom was ISIS effective? The analysis examined different groupings of students by different factors: (a) amount of experience with complex projects; (b) gender; (c) role in the team (member or project manager); and (d) academic standing (undergraduate, graduate). We looked for differences by final grade, survey scales, self-regulation scales, teamwork scales, and knowledge map performance (content score, shallow propositions, and deep propositions). Tests for group differences were conducted using the Mann-Whitney nonparametric procedure. Because this 1This may reflect students’ retention of material covered in earlier courses. A capstone course
typically requires synthesis and application of ideas covered in earlier core courses, as was the case in this study.
26
Table 17 Most Common Propositions Used by Students, Overall and New No. of times useda Posttest mapb
New propositionc Ratio
Proposition scored
Source concept
Relation
Destination concept
15
3
.20
3/D
Piezometer
Measures
Hydraulic head
10
9
.90
2/D
Drawdown test
Measures
Hydraulic conductivity
10
10
1.00
2/D
Slug test
Measures
Hydraulic conductivity
9
4
.44
1/S
Permeability
Affects
Groundwater flow
8
3
.38
3/D
Dispersion
Affects
Contaminant transport
7
4
.57
3/D
Darcy's Law
Models
Groundwater flow
7
3
.43
3/D
Groundwater flow
Affects
Contaminant transport
6
4
.67
3/D
Hydraulic conductivity Is a model parameter
Darcy's Law
6
3
.50
3/D
Isotherm test
Measures
Sorption
6
4
.67
2/D
NAPL dissolution
Affects
Contaminant transport
6
4
.67
3/D
Tracer test
Measures
Dispersion
5
–
–
2/D
Diffusion
Is a model parameter
Contaminant transport
5
–
–
2/D
Hydraulic conductivity Affects
Groundwater flow
5
5
1.00
2/D
Hydraulic head
Is a model parameter
Groundwater flow
5
–
–
2/D
Retardation
Affects
Contaminant transport
5
3
.60
2/D
Retardation
Is a model parameter
Contaminant transport
–
4
–
3/D
Darcy's Law
Models
Groundwater flow
–
4
–
2/D
Film transfer
Is a model parameter
Diffusion
–
4
–
1/S
Film transfer
Affects
Diffusion
–
3
–
2/D
Tracer test
Models
Contaminant transport
–
3
–
0/S
Retardation
Affects
Groundwater flow
a n = 17. bFor the remaining propositions: 8 propositions were used 4 times; 6 propositions 3 times; 21 propositions 2 times; 66 propositions once. cFor the remaining propositions: 19 propositions were used 2 times; 80 propositions once. dD = deep proposition, S = shallow proposition.
27
Table 18 Type of Relationship Used Model-focused relationsa
Other relations
Shallow propositions
Deep propositions
Shallow propositions
Deep propositions
Posttest
42
65
66
109
Posttest, new propositions
35
47
51
62
.83
.72
.77
.57
Proportion of new propositions a
Propositions containing is a model parameter or models.
study was exploratory, we did not adjust for multiple comparisons. The p-level was set to .05. A significant difference was found between experienced and less experienced students on students’ perception of the effectiveness of ISIS on helping them handle complex projects. Experienced students (M = 4.14, SD = 0.50), compared to less experienced students (M = 3.30, SD = 0.67), perceived ISIS as being more effective in helping them handle complex projects. When graduate students were compared to undergraduate students, graduate students had significantly higher final course grades (M = 10.15, SD = 1.21 vs. M = 7.60, SD = 1.34) and reported engaging in selfchecking more often (M = 3.28, SD = 0.30 vs. M = 2.68, SD = 0.59). When gender was examined, males reported using more problem solving strategies (M = 3.50, SD = 0.38 vs. M = 3.10, SD = 0.39) and the teamwork process of leadership (M = 3.47, SD = 0.51 vs. M = 2.95, SD = 0.44). No other differences were found for any of the groupings on any of the measures. Appendix E contains the descriptive statistics for these analyses. Assessment of Teamwork Skills The second series of analyses examined students’ self-reported use of teamwork skills. Teamwork is one of the skills addressed by ABET/EC2000, and we were interested in examining the extent to which we could measure students’ teamwork skills using a survey developed in prior work (O’Neil et al., 2000). When asked how effective the ISIS project was in helping them develop teamwork skills, 10 of 18 students reported that ISIS was very effective or effective. In terms of how often they used teamwork skills, 16 of 18 reported very often or often, and 2 students reported using teamwork skills only sometimes. When asked how effective 28
ISIS was in helping them improve their teamwork skills, 9 reported effective, 6 moderately effective, and 3 somewhat effective. Most students agreed or strongly agreed that their teams worked effectively together (15 of 18). To gain further insight into the nature of teamwork promoted by ISIS, the teamwork survey developed by O’Neil et al. (2000) was used to measure students’ use of teamwork processes. Table 11 shows the descriptive statistics and intercorrelations among the scales for the pretest and posttest administrations. A repeated measures analysis was conducted to test for differences in the reported use of teamwork processes before and after the ISIS project. A repeated-measures 4 (teamwork process) × 2 (occasion) analysis of variance (ANOVA) was used to test for differences across occasions. The within-subjects factors were occasion (pretest or posttest) and teamwork process (communication, coordination, decision making, leadership). A significant main effect was found for teamwork process, F(1.82, 29.06) = 9.83, p < .001. Because the teamwork process factor did not meet the sphericity assumption, the Huynh-Feldt correction was applied. The ANOVA showed differences in students’ reported use of the different teamwork processes features. Follow-up t tests, adjusted for multiple comparisons using the Sidak correction, showed significant differences between the use of leadership and communication, and the use of leadership and decision making. Participants’ reported use of leadership was significantly lower than communication and decision making. There was also a significant effect for occasion, F(1,16) = 5.64, p < .05. Follow-up t tests, adjusted for multiple comparisons using the Sidak correction, showed significant differences between the pretest and posttest for communication. Participants’ reported use of communication was significantly lower on the posttest than on the pretest. No other differences were found, including the teamwork occasion interaction. Relationship of teamwork skills to the impact of ISIS. Finally, we examined the relationship between students’ use of teamwork skills and their perception of effectiveness of ISIS, problem solving processes, and attitudes. As Table 19 shows, all teamwork processes were correlated significantly with reported use of problem solving processes. This finding is consistent with our expectations about the task—presumably, the ISIS task required both teamwork and problem solving processes (consistent with the observed correlations), and apparently students did
29
Table 19 Correlations (Spearman) Between Student Survey Scales and Teamwork Skills (N = 18)
Teamwork processa
Effectiveness of Effectiveness Use of ISIS in helping of ISIS in problem develop skills to helping link solving handle complex theory to real processesa projectsb worldb
Effectiveness of Effectiveness of ISIS in ISIS in improving developing problem solvingb positive attitudes toward ISISb
Coordination
.16
.16
.47*
.35
.06
Communication
.22
.21
.64**
.15
.19
Decision making
.44
.45
.78**
.05
.20
Leadership
.06
.15
.52*
.19
-.08
a 1 = almost never, 2 = sometimes, 3 = often, 4 = almost always. b 1 = not effective, 2 = somewhat effective, 3 = moderately effective, 4 = effective, 5 = very effective.
*p < .05 (two-tailed). **p < .01 (two-tailed).
not profit much in these areas from the activity. However, not finding significant relationships between teamwork processes and the other perceived impact measures was unexpected. Discussion This study examined an exemplar implementation of a capstone course that embedded a sophisticated simulation-based task within instruction. The simulation was comprehensive, approximating physical systems and the broader engineering context. We evaluated the effects of ISIS on students’ learning, teamwork, and attitudes toward ISIS. Our main research question focused on how ISIS impacted students’ learning of course-related content; ability to handle complex, open-ended problems; attitudes toward ISIS and the course, and use of teamwork processes. Limitations of This Study There were two factors of the main study that limit the findings. The most serious limitation is the lack of a control condition. Because of the lower-thanexpected enrollment, there were not enough participants to form a non-ISIS control group; thus, the extent to which the findings are related solely to ISIS is unclear, particularly the observed gains in learning and differences in teamwork processes. The design of this study cannot disentangle the source of the learning effects due to classroom instruction and the design experience with ISIS, nor tease out the learning effects due solely to ISIS (relative to a non-ISIS condition); however, one 30
finding is clear: learning occurred and our measurement of learning was sensitive to this change. While this finding may seem trivial—one expects learning to occur—how one measures complex learning is less obvious. Unlike the situation in the measurement of physical phenomena, where meteorologists routinely calibrate instruments traceable to a higher standard, there exists little validation, much less standardization, in the measurement of complex cognitive phenomena (e.g., critical thinking, problem solving, understanding). Thus, while we acknowledge the limitations of this study, this study adds to a small but growing base of research on the measurement of complex learning. Implications for ISIS The findings of this study point to several provocative implications, particularly in instruction and assessment. With respect to instruction, the use of ISIS was clearly positive. Students reported very positive attitudes toward the ISIS experience, both in the pilot study and the main study. This finding is remarkable considering that students reported an unexpected amount of time and effort required by the project, limited access to the system, the unstable system (during the pilot study), and the added burden of participating in this study. This finding suggests that the unique approach taken by this capstone design course was successful and worthwhile from the students’ perspective, and warrants continued use, development, and refinement. In terms of learning, students appear to have profited over the period of ISIS use. The data from the main study are consistent with the idea that students gained deep content knowledge between the pretest and posttest. There were more deep propositions than shallow propositions (p = .07) in the knowledge maps and there was more use of propositions with theoretical relations. Finally, students reported that they considered the ISIS activity as being generally effective in improving their skills to handle complex projects, linking theory to real-world applications, improving their problem solving performance, and developing positive attitudes toward ISIS. When we examined the issue of for whom ISIS was effective, the data from the pilot study and from the main study suggest experience with complex projects like ISIS was important. Experience in terms of academic standing (graduate vs. undergraduate) also appeared to be a factor. Graduate students had higher course grades, reported using more self-checking processes, and had higher content
31
knowledge map scores. Differences were also found by gender, with males reporting using more problem solving processes and leadership processes with respect to teamwork. Note that these differences should be viewed as preliminary, as the significance testing was not controlled for multiple comparisons. The finding in both the pilot and main studies that experienced students perceived the value of ISIS as more effective in helping them handle complex projects is interesting. This difference was not found when we examined the question by any other factor, in either the pilot or main study. While we are unsure of why this may be so, we speculate that this outcome may be the case of experienced students having a retrospective appreciation for the experience of the project by virtue of their having experienced like projects. An implication of this finding is that less experienced students will profit from the ISIS experience, although they may not be appreciative of this experience. Finally, with respect to teamwork skills, students reported using fewer leadership processes than either communication or decision-making processes. Students reported using fewer communication processes after ISIS as compared to before ISIS. Implications for Assessment in Engineering Education Our attempt to use knowledge mapping as a performance measure of content understanding was generally successful. We detected differences in the students’ performance over the course of ISIS, which point to instructional sensitivity of the measure. However, more work is needed to validate the use of knowledge mapping to measure students’ understanding of complex subject matter, particularly when students are advanced (e.g., upper division students). As occurred in this study, students generated deep propositions that were omitted from the expert map yet were clearly appropriate. This omission also points to the need to use multiple expert maps to have a representative sample of high-level knowledge. Similarly, while our measures of teamwork and cognitive processes yielded interesting findings, they were based on students’ self-reports on surveys. More direct measures of teamwork and learning processes are desirable, and may be possible in an online environment. A clear next step is to develop a broader range of assessments to measure cognitive outcomes that address more of the EC2000 criteria. Assessments of problem solving, teamwork, design skills, lifelong learning, and communication are 32
needed, and we believe they can be embedded within the simulation environment. That is, we can embed within ISIS the capability to track and assess students’ online behaviors—the online equivalent of a 24/7 trained observer assessing the field performance of the team over time. The utility of embedded assessments lies in the timeliness of the reporting of assessment information: Instructors would have realtime access to information about their students’ ongoing performance on the task, and just as important, be able to provide timely feedback to the students. Because many of these activities would be online, we envision ISIS as the genesis of a performance-oriented instructional and assessment platform that can roll up student-level data into larger departmental information systems. Such capability would fulfill the promise of fusing student, classroom, and departmental information to form an indicator system that can help instructors and administrators monitor the health of engineering education. As engineering schools move toward ABET/EC2000 compliance, we anticipate calls to situate student outcomes—individual student learning, teamwork, and attitudes—into a larger system of indicators. We anticipate a movement toward gathering a variety of evidence (vs. a single grade or survey), increasingly from online performance-oriented tasks, to better uncover what students are learning, the depth of their learning, and the process they are using to learn. The goal of such assessments is to provide instructors and administrators with high-quality information about students’ learning, which provides the basis for making sound decisions about instruction and curriculum.
33
References Accreditation Board for Engineering and Technology, Inc. (2000). Criteria for accrediting engineering programs. Baltimore, MD: Author. Aller, B. M. (1993, November). “Just like they do in industry”: Concerns about teamwork practices in engineering design courses. Proceedings of the annual Frontiers in Engineering Education conference (pp. 489–492). Washington, DC. American Society for Engineering Education. (1996). Assessment white paper: A framework for the assessment of engineering education. Author. American Society for Engineering Education. (1998). How do you measure success? Designing effective processes for assessing engineering education. Author. Banios, E. W. (1991, September). Teaching engineering practices. In L. P. Grayson (Ed.), Proceedings of the annual Frontiers in Engineering Education conference (pp. 161-168). West Lafayette, IN. Besterfield-Sacre, M., Shuman, L. J., Wolfe, H., Atman, C. J., McGourty, J., Miller, R. L., Olds, B. M., & Rogers, G. M. (2000). Defining the outcomes: A framework for EC-2000. IEEE Transactions on Education, 43, 100–110. Board on Engineering Education. (1995). Engineering education: Designing an adaptive system. Washington, DC: National Academy Press. Bond, B. (1995, November). The difficult part of capstone design courses. Proceedings of the annual Frontiers in Engineering Education conference (pp. 2c3.1-2c3.4). Atlanta, GA. Chung, G. K. W. K., O’Neil, H. F., Jr., & Herl, H. E. (1999). The use of computerbased collaborative knowledge mapping to measure team processes and team outcomes. Computers in Human Behavior, 15, 463–494. Cline, M., & Powers, G. J. (1997, November). Problem based learning via open ended projects in Carnegie Mellon University’s chemical engineering undergraduate laboratory. Proceedings of the annual Frontiers in Engineering Education conference (pp. 350-354). Pittsburgh, PA. Coward, H. R., Ailes, C. P., & Bardon, R. (2000). Progress of the engineering education coalitions. Final report to the Engineering Education and Centers Division, NSF. Arlington, VA: SRI International. Dillon, W. E., Kondraske, G. V., Everett, L. J., & Volz, R. A. (2000). Performance theory based outcome measurement in engineering education and training. IEEE Transactions on Education, 43, 153–158.
35
Dowell, E., Baum, E., & McTague, J. (1994). Engineering education for a changing world. Washington, DC: American Society for Engineering Education. Duzer, E. V., & McMartin, F. (2000). Methods to improve the validity and sensitivity of a self/peer assessment instrument. IEEE Transactions on Education, 43, 153–158. Ellis, A., Carswell, L., Bernat, A., Deveaux, D., Frison, P., Meisalo, V., et al. (1998). Resources, tools, and techniques for problem based learning in computing. SIGCSE Bulletin, 30(4), 45b–60b. Gentili, K. L., McCauley, J. F., Christianson, R. K., Davis, D. C., Trevisan, M. S., Calkins, D. E., et al. (1999, November). Assessing students’ design capabilities in an introductory design class. Proceedings of the annual Frontiers in Engineering Education conference (pp. 13b1-8–13b1-13). San Juan, Puerto Rico. Helland, B., & Summers, B. G. (1996, November). Assessment techniques for a learner-centered curriculum: Evaluation design for adventures in supercomputing. Proceedings of the annual Frontiers in Engineering Education conference (pp. 301–305). Salt Lake City, UT. Herl, H. E., Baker, E. L., & Niemi, D. (1996). Construct validation of an approach to modeling cognitive structure of U.S. history knowledge. Journal of Educational Research, 89, 206-218. Herl, H. E., O’Neil, H. F., Jr., Chung, G. K. W. K., Bianchi, C., Wang, S-L., Mayer, R. E., et al. (1999). Final report for validation of problem solving measures (CSE Tech. Rep. 501). Los Angeles: University of California, National Center for Research on Evaluation, Standards, and Student Testing. Herl, H. E., O’Neil, H. F., Jr., Dennis, R. A., Chung, G. K. W. K., Klein, D. C. D., Lee, J., et al. (1996). Technical report of year 1 CAETI findings (Report to ISX/DODEA). Los Angeles: University of California, National Center for Research on Evaluation, Standards, and Student Testing. Heywood, J. (1999, November). Problems in the design of assessment led curricula. Proceedings of the annual Frontiers in Engineering Education conference (pp. 12a91–12a9-4). San Juan, Puerto Rico. Jacobson, D., Davis, J., & Licklider, B. (1998, November). Ten myths of cooperative learning in engineering education. Proceedings of the annual Frontiers in Engineering Education conference (pp. 790-794). Tempe, AZ. Matthew, R. G. S., & Hughes, D. C. (1994). Getting at deep learning: A problembased approach. Engineering Science and Education Journal, 3, 234-240. McCracken, M., & Waters, R. (1999, June/July). WHY? When an otherwise successful intervention fails. Proceedings of the SIGCSE/SIGCUE Conference on Innovation and Technology in Computer Science Education (pp. 9-12). Cracow, Poland. 36
McKenna, A., Mongia, L., & Agogino, A. (1998, November). Capturing students’ teamwork and open-ended design performance in an undergraduate multimedia engineering design course. Proceedings of the annual Frontiers in Engineering Education conference (pp. 264-269). Tempe, AZ. McMartin, F., McKenna, A., & Youssefi, K. (2000). Scenario assignments as assessment tools for undergraduate engineering education. IEEE Transactions on Education, 43, 111-119. Mertz, R. L. (1997). A capstone design course. IEEE Transactions on Education, 40, 41–45. Meyers, C. W. (1995). Restructuring engineering education: A focus on change. Report of an NSF Workshop on Engineering Education. Arlington, CA: National Science Foundation. Neumann, W. T., & Woodfill, M. C. (1998, November). A comparison of alternative approaches to the capstone experience: Case studies versus collaborative projects. Proceedings of the annual Frontiers in Engineering Education conference (pp. 470-474). Tempe, AZ. Newcomer, J. L. (1999, November). Design: The future of engineering and engineering technology education. Proceedings of the annual Frontiers in Engineering Education conference (pp. 12b9-12b14). San Juan, Puerto Rico. Newstetter, W. C., & Khan, S. (1997, November). A developmental approach to assessing design skills and knowledge. Proceedings of the annual Frontiers in Engineering Education conference (pp. 676-680). Pittsburgh, PA. O’Neil, H. F., Jr., Wang, S-L., Chung, G. K. W. K., & Herl, H. E. (2000). Assessment of teamwork skills using computer-based teamwork simulations. In H. F. O’Neil, Jr. & D. H. Andrews (Eds.), Aircrew training and assessment (pp. 245-276). Mahwah, NJ: Erlbaum. Osmundson, E., Chung, G. K. W. K., Herl, H. E., & Klein, D. C. D. (1999). Concept mapping in the classroom: A tool for examining the development of students’ conceptual understanding. (CSE Tech. Rep. No. 507). Los Angeles: University of California, National Center for Research on Evaluation, Standards, and Student Testing. Ruiz-Primo, M. A., Schultz, S. E., & Shavelson, R. J. (1997). Concept map-based assessment in science: Two exploratory studies (CSE Tech. Rep. No. 436). Los Angeles: University of California, National Center for Research on Evaluation, Standards, and Student Testing. Ruiz-Primo, M. A., & Shavelson, R. J. (1995, April). Concept maps as potential alternative assessments in science. Paper presented at the annual meeting of the American Educational Research Association, San Francisco.
37
Safoutin, M. J., Atman, C. J., Adams, R., Rutar, T., Kramlich, J. C., & Fridley, J. L. (2000). A design attribute framework for course planning and learning assessment. IEEE Transactions on Education, 43, 188-199. Seat, J. E., Poppen, W. A., Boone, K., & Parsons, J. R. (1996, November). Making design teams work. Proceedings of the annual Frontiers in Engineering Education conference (pp. 272-275). Salt Lake City, UT. Waters, R., & McCracken, M. (1997, November). Assessment and evaluation in problem-based learning. Proceedings of the annual Frontiers in Engineering Education conference (pp. 689-693). Pittsburgh, PA. Wulf, W. A. (2000). How shall we satisfy the long-term educational needs of engineers? Proceedings of the IEEE, 88, 593-596.
38
APPENDIX A PILOT STUDY STUDENT SURVEY SCALE INFORMATION Survey items
Scale
n
α
Learn specific field investigation techniques Prepare you for an actual site investigation Link theory to real-world applications Understand the relationship between theoretical models and real-world environments 24. Understand the relationship between theoretical models and applied field work
Effectiveness of ISIS in helping link theory to real world
24
.24
17. 18. 19. 20.
Effectiveness of ISIS in helping develop skills to handle complex projects
23
.80
21. Develop a positive attitude towards civil and environmental engineering 22. *Develop a positive attitude towards simulations
Effectiveness of ISIS in developing positive attitudes toward ISIS
20
.74
39. *I found the use of ISIS in this course interesting 40. *I liked using ISIS
Positive attitudes toward ISIS
19
.66
41. I would recommend this class to other students 42. I learned a lot from the site investigation project
Positive attitudes toward course
25
.84
25. 26. 27. 28. 29. 30. 31. 32. 33. 34. 35. 36.
Use of general problem solving processes
25
.71
13. 14. 15. 23.
Manage large amounts of information Manage a complex and open-ended project Make sound judgements under uncertain conditions Apply a broad range of previously learned technical skills and knowledge
Planning Organization Knowledge of theoretical concepts Knowledge of theoretical formulas Common sense Logic and reasoning Problem solving Synthesizing large amounts of information Interpreting ambiguous information Guessing Trial-and-error testing Systematic hypothesis testing
*Only answered by students who were in the ISIS conditions.
39
APPENDIX B EXPERT MAP PROPOSITIONS
Concept
Relationship
Concept
Darcy's Law
Models
Groundwater flow
Diffusion
Affects
Film transfer
Diffusion
Affects
Dispersion
Diffusion
Affects
Sorption
Diffusion
Affects
Isotherm test
Dispersion
Affects
Contaminant transport
Drawdown test
Measures
Hydraulic head
Film transfer
Models
Diffusion
Film transfer
Models
NAPL dissolution
Groundwater flow
Affects
Dispersion
Groundwater flow
Affects
NAPL dissolution
Groundwater flow
Affects
Contaminant transport
Hydraulic conductivity
Is a model parameter
Darcy's law
Hydraulic head
Is a model parameter
Darcy's law
Isotherm test
Measures
Sorption
NAPL dissolution
Affects
Contaminant transport
Permeability
Is a model parameter
Darcy's law
Permeability
Is a model parameter
Hydraulic conductivity
Piezometer
Measures
Hydraulic head
Retardation
Models
Sorption
Retardation
Affects
Contaminant transport
Slug test
Measures
Hydraulic head
Sorption
Affects
Retardation
Tracer test
Measures
Dispersion
Tracer test
Measures
Groundwater flow
40
APPENDIX C FINAL STUDENT SURVEY, WINTER 1999
UCLA Center for the Study of Evaluation (CSE) Graduate School of Education & Information Studies ISIS Student Survey Post-simulation, Winter 1999 This survey is part of a study of how the ISIS program affects student learning and attitudes. We need your help to make the results of this study comprehensive and accurate. You are the first class to use ISIS and thus your input is extremely valuable. The information you provide will be kept strictly confidential and examined only by CSE. This survey will not be shared with your instructor. Thank you very much for your participation! Student ID:
1.
2.
Date:
How many times during college have you had projects that were as complex as the site investigation project? [ ] Never [ ] 1 — 2 times [ ] 3 — 5 times [ ] > 5 times Overall, how difficult was the site investigation project? [ ] Very difficult [ ] Difficult [ ] Moderate [ ] Easy
3.
On average, about how many hours a week outside of class did you spend on the site investigation project? Lab time: ______ hours a week Other: ______ hours a week
4.
How much theory from the class did you apply to solving the site investigation problem? [ ] Very much [ ] Moderate amount [ ] Some [ ] Not much or none
41
Please rate how effective the site investigation project has been in helping you in the following areas: Not Somewhat Moderately Very effective effective effective Effective effective [] [] [] [] []
5.
Learn specific field investigation techniques
6.
Prepare you for an actual site investigation
[]
[]
[]
[]
[]
7.
Link theory to real-world applications
[]
[]
[]
[]
[]
8.
Work effectively in a team
[]
[]
[]
[]
[]
9.
Manage large amounts of information
[]
[]
[]
[]
[]
10.
Manage a complex and open-ended project
[]
[]
[]
[]
[]
11.
Make sound judgements under uncertain conditions
[]
[]
[]
[]
[]
12.
Apply a broad range of previously learned technical skills and knowledge
[]
[]
[]
[]
[]
13.
Develop a positive attitude towards civil and environmental engineering
[]
[]
[]
[]
[]
14.
Develop a positive attitude towards simulations
[]
[]
[]
[]
[]
15.
Understand the relationship between theoretical models and real-world environments
[]
[]
[]
[]
[]
16.
Understand the relationship between theoretical models and applied field work
[]
[]
[]
[]
[]
Please rate how often you used the following skills/knowledge/activities to carry out the site investigation project: Almost never Sometimes [] []
Often []
Almost always []
17.
Planning
18.
Organization
[]
[]
[]
[]
19.
Knowledge of theoretical concepts
[]
[]
[]
[]
20.
Knowledge of theoretical formulas
[]
[]
[]
[]
21.
Common sense
[]
[]
[]
[]
22.
Logic and reasoning
[]
[]
[]
[]
23.
Problem solving
[]
[]
[]
[]
24.
Synthesizing large amounts of information
[]
[]
[]
[]
25.
Interpreting ambiguous information
[]
[]
[]
[]
42
Almost never Sometimes [] []
Often []
Almost always []
26.
Guessing
27.
Trial-and-error testing
[]
[]
[]
[]
28.
Systematic hypothesis testing
[]
[]
[]
[]
29.
Teamwork skills
[]
[]
[]
[]
30.
Communication skills
[]
[]
[]
[]
For the same set of questions as above, please rate how effective the site investigation project was in improving those skills/knowledge/activities: Not Somewhat Moderately Very effective effective effective Effective effective [] [] [] [] []
31.
Planning
32.
Organization
[]
[]
[]
[]
[]
33.
Knowledge of theoretical concepts
[]
[]
[]
[]
[]
34.
Knowledge of theoretical formulas
[]
[]
[]
[]
[]
35.
Logic and reasoning
[]
[]
[]
[]
[]
36.
Problem solving
[]
[]
[]
[]
[]
37.
Synthesizing large amounts of information
[]
[]
[]
[]
[]
38.
Interpreting ambiguous information
[]
[]
[]
[]
[]
39.
Systematic hypothesis testing
[]
[]
[]
[]
[]
40.
Teamwork skills
[]
[]
[]
[]
[]
41.
Communication skills
[]
[]
[]
[]
[]
Please rate the extent to which you agree or disagree with each of the following statements: Strongly Disagree []
Disagree []
Agree []
Strongly Agree []
42.
I found the use of ISIS in this course interesting
43.
I liked using ISIS
[]
[]
[]
[]
44.
My group had sufficient computer time
[]
[]
[]
[]
45.
More ISIS workstations are needed
[]
[]
[]
[]
46.
Greater access to ISIS is needed (e.g., Web, 24 hour access to lab, etc.)
[]
[]
[]
[]
47.
I would recommend this class to other students
[]
[]
[]
[]
48.
I learned a lot from the site investigation project
[]
[]
[]
[]
43
Strongly Disagree []
Disagree []
Agree []
Strongly Agree []
49.
My group worked effectively together
50.
I spent much more time on the site investigation project than expected
[]
[]
[]
[]
51.
The meaning of the concepts in the concept map task were clear
[]
[]
[]
[]
52.
The meaning of the links in the concept map task were clear
[]
[]
[]
[]
Thank you very much for taking the time to complete this survey. The information in this survey will be used to improve the ISIS program. Your class is one of the first users of ISIS, and your input is extremely valuable and greatly appreciated.
44
APPENDIX D MAIN STUDY STUDENT SURVEY SCALE INFORMATION
Survey items
Scale
α
6. Prepare you for an actual site investigation 7. Link theory to real-world applications 15. Understand the relationship between theoretical models and real-world environments 16. Understand the relationship between theoretical models and applied field work 33. Knowledge of theoretical concepts 34. Knowledge of theoretical formulas
Effectiveness of ISIS in helping link theory to real world
.68
10. Manage a complex and open-ended project 11. Make sound judgments under uncertain conditions 12. Apply a broad range of previously learned technical skills and knowledge
Effectiveness of ISIS in helping develop skills to handle complex projects
.77
17. 18. 22. 23. 24. 25.
Planning Organization Logic and reasoning Problem solving Synthesizing large amounts of information Interpreting ambiguous information
Use of problem solving processes
.75
31. 32. 35. 36. 37. 38.
Planning Organization Logic and reasoning Problem solving Synthesizing large amounts of information Interpreting ambiguous information
Effectiveness of ISIS in improving problem solving
.75
13. Develop a positive attitude towards civil and environmental engineering 14. Develop a positive attitude towards simulations
Effectiveness of ISIS in developing positive attitudes toward ISIS
.61
42. I found the use of ISIS in this course interesting. 43. I liked using ISIS.
Positive attitudes toward course
.43
Note. n = 18.
45
APPENDIX E DESCRIPTIVE STATISTICS BY VARIOUS CONDITIONS
Table E1 Descriptive Statistics on Student Survey Scales by Various Conditions
Final gradea Variable
Use of problem solving processesc
Effectiveness of ISIS in improving problem solvingb
Effectiveness of ISIS in developing positive attitudes toward ISISb
SD
n
M
SD
n
M
SD
n
M
SD
n
M
SD
n
M
SD
Experience with Experienced 7 complex projects 11 Not experienced
9.00
1.53
7
3.74
0.50
7
4.14*
0.50
7
3.38
0.42
7
3.45
0.58
7
3.79
0.57
9.73
1.79
11
3.44
0.52
11
3.30
0.67
11
3.21
0.44
11
3.50
0.65
11
3.27
0.79
Gender
Academic standing
n
Effectiveness of ISIS in helping develop skills to handle complex projectsb
M
Team role
Condition
Effectiveness of ISIS in helping link theory to real worldb
Male
8
9.63
2.07
8
3.71
0.55
8
3.79
0.67
8
3.50*
0.38
8
3.67
0.58
8
3.50
0.89
Female
10
9.30
1.42
10
3.43
0.49
10
3.50
0.79
10
3.10
0.39
10
3.33
0.61
10
3.45
0.64
Member
4
9.21
1.72
4
3.60
0.48
4
3.69
0.69
4
3.27
0.37
4
3.50
0.51
4
3.50
0.76
Project manager
14
10.25
1.50
14
3.42
0.70
14
3.42
0.96
14
3.29
0.66
14
3.42
0.97
14
3.38
0.75
Undergraduate
5
7.60** 1.34
5
3.47
0.66
5
3.53
0.56
5
3.23
0.49
5
3.53
0.43
5
3.50
0.87
Graduate
13
13
3.59
0.48
13
3.67
0.81
13
3.29
0.41
13
3.46
0.67
13
3.46
0.72
10.15
1.21
a
12-point scale. b1 = not effective, 2 = somewhat effective, 3 = moderately effective, 4 = effective, 5 = very effective. c1 = almost never, 2 = sometimes, 3 = often, 4 = almost always. *p < .05 (two-tailed). **p < .01 (two-tailed).
46
Table E2 Descriptive Statistics on Self-Regulation and Teamwork Survey Scales by Various Conditions Self-regulation processes Planning Variable
Teamwork processes
Self-checkinga
Communicationa
Decision makinga
Coordinationa
Leadershipa
Condition
n
M
SD
n
M
SD
n
M
SD
n
M
SD
n
M
SD
n
M
SD
Experience with complex projects
Experienced
7
3.16
0.49
7
3.09
0.17
7
3.29
0.44
7
3.00
0.82
7
3.32
0.51
7
3.32
0.51
11 Not experienced
3.02
0.49
11
3.13
0.60
11
3.27
0.58
11
3.09
0.88
11
3.09
0.54
11
3.09
0.54
Gender
Male
8
3.05
0.54
8
3.14
0.59
8
3.50
0.55
8
3.25
1.09
8
3.47§ 0.51
8
10
3.10
0.45
10
3.09
0.38
10
3.10
0.43
10
2.90
0.57
10
2.95
0.44
10
2.95
0.44
Project manager
4
3.19
0.31
4
3.47§ 0.36
4
3.25
0.35
4
3.17
0.58
4
3.00
0.54
4
3.00
0.54
Member
14
3.04
0.52
14
0.46
14
3.29
0.56
14
3.02
0.91
14
3.23
0.53
14
3.23
0.53
Undergraduate
5
2.78
0.68
5
2.68* 0.59
5
3.05
0.62
5
2.67
1.13
5
2.95
0.65
5
2.95
0.65
Graduate
13
3.19
0.34
13
13
3.37
0.46
13
3.21
0.69
13
3.27
0.47
13
3.27
0.47
Female Team role
Academic standing
a
1 = almost never, 2 = sometimes, 3 = often, 4 = almost always.
§
p < .10 (two-tailed). *p < .05 (two-tailed).
3.01
3.28
0.30
47
3.47* 0.51
Table E3 Descriptive Statistics on Knowledge Mapping Measures by Various Conditions Content New propositions
Posttest Variable
Shallow
Deep
New propositions
Posttest
New propositions
Posttest
Condition
n
M
SD
n
M
SD
n
M
SD
n
M
SD
Experience with complex projects
Experienced
7
9.14
2.73
6
4.83
1.94
7
5.57
3.15
6
4.67
2.88
7 11.00 3.37
11 Not experienced
8.36
1.36
11
5.27
1.68
11
6.64
2.34
11
5.27
2.00
Gender
Male
8
8.38
2.00
8
5.13
2.03
8
6.38
2.62
8
5.25
10
8.90
2.02
9
5.11
1.54
10
6.10
2.81
9
Project manager
4
8.75
2.63
4
6.00
1.63
4
7.50
1.73
Member
14
8.64
1.86
13
4.85
1.72
14
5.86
Undergraduate
5
8.20
2.39
5
5.60
2.07
5
Graduate
13
8.85
1.86
12
4.92
1.62
13
Female Team role
Academic standing
§
p < .10 (two-tailed). *p < .05 (two-tailed).
48
n
M
M
SD
6
5.67
1.37
11 10.64 1.63
11
6.82
1.94
2.38
8 10.25 1.91
8
6.25
1.67
4.89
2.32
10 11.20 2.70
9
6.56
2.01
4
5.50
1.00
4 10.50 3.32
4
6.75
1.71
2.80
13
4.92
2.56
14 10.86 2.18
13
6.31
1.89
6.40
4.22
5
5.40
3.91
5
6.20
2.28
6.15
1.99
12
4.92
1.38
12
6.50
1.68
5 9.60
SD
2.51
13 11.23 2.24
n
APPENDIX F TEAMWORK SURVEY, PRETEST
UCLA Center for the Study of Evaluation (CSE) Graduate School of Education & Information Studies Teamwork Skills Survey Pre-Simulation, Winter 1999 Please be assured that your responses will be kept confidential. The results of this survey will be reported only for your class as a whole; thus your particular response will not be identifiable in any way. Student ID:
Date:
Directions: This set of questions is to help us understand the way you think and feel about working with others. We know that different parts of your life, such as your job, recreational activities, or service to your community, may involve working with others and have different requirements, and that you may react differently in each kind of activity. Nonetheless, read each statement below and indicate how you generally think or feel. There are no right or wrong answers. Do not spend too much time on any one statement. Remember, give the answer that seems to describe how you generally think or feel. Almost never
Sometimes
Often
Almost always
1. When I work as part of a team, I help to solve problems by using information provided by the team.
[]
[]
[]
[]
2. When I work as part of a team, I exercise leadership.
[]
[]
[]
[]
3. When I work as part of a team, I focus on completing the team task successfully.
[]
[]
[]
[]
4. When I work as part of a team, I work well with men and women from diverse backgrounds.
[]
[]
[]
[]
5. When I work as part of a team, I teach other team members.
[]
[]
[]
[]
6. When I work as part of a team, I identify possible alternatives.
[]
[]
[]
[]
7. When I work as a member of a team, I attempt to change incorrect information immediately.
[]
[]
[]
[]
49
Almost never
Sometimes
Often
Almost always
8. When I work as part of a team, I organize team activities to complete tasks on time.
[]
[]
[]
[]
9. When I work as part of a team, I use available information to make decisions.
[]
[]
[]
[]
10. When I work as part of a team, I interact cooperatively with other team members.
[]
[]
[]
[]
11. When I work as part of a team, I clearly and accurately exchange information with team members.
[]
[]
[]
[]
12. When I work as part of a team, I conduct myself with courtesy.
[]
[]
[]
[]
13. When I work as part of a team, I evaluate the consequences of possible alternatives.
[]
[]
[]
[]
14. When I work as part of a team, I try to figure out what the team is thinking so as to solve problems.
[]
[]
[]
[]
15. When I work as a member of a team, I acknowledge that I understand the information.
[]
[]
[]
[]
16. When I work as part of a team, I serve as a role model in formal and informal interactions.
[]
[]
[]
[]
17. When I work as part of a team, I help other team members.
[]
[]
[]
[]
18. When I work as part of a team, I understand and contribute to the organization s goals.
[]
[]
[]
[]
19. When I work as a member of a team, I pay attention to what others are saying.
[]
[]
[]
[]
20. When I work as part of a team, I respect the thoughts and opinions of others in the team.
[]
[]
[]
[]
21. When I work as part of a team, I keep track of time.
[]
[]
[]
[]
22. When I work as part of a team, I seek a team approach as appropriate.
[]
[]
[]
[]
23. When I work as part of a team, I lead when appropriate, mobilizing the group for high performance.
[]
[]
[]
[]
50
Background Information 24. Age: ______ years 26. Academic standing:
[]
25. Gender: []
Male
Junior [ ] Senior
[] []
Female
Master s
[]
Other ____________
27. Current overall GPA: ____________ 28. SAT-Math:
[]
Not applicable
29. SAT-Verbal:
[]
Not applicable
30. GRE-Math:
[]
Not applicable
31. GRE-Verbal:
[]
Not applicable
32. Major: ________________________ 34. Post-graduation plans:
[]
33. Minor (if any): ____________________
Graduate school
[]
Industry
[]
Other ____________
35. Ethnicity: []
Biracial/multiethnic [ ] African-American [ ] Asian-American [ ] Latino
[]
Native-American [ ] White, non-Hispanic [ ] Other ______________
Thank you very much for taking the time to complete this survey. The information in this survey will be used to improve the ISIS program. Your class is one of the first users of ISIS, and your input is extremely valuable and greatly appreciated.
51
APPENDIX G SELF-REGULATION SURVEY
UCLA Center for the Study of Evaluation (CSE) Graduate School of Education & Information Studies Self-Regulation Survey Winter 1999 Please be assured that your responses will be kept confidential. The results of this survey will be reported only for your class as a whole; thus your particular response will not be identifiable in any way. Student ID:
Date:
Directions: A number of statements which people have used to describe themselves are given below. Read each statement and indicate how you generally think or feel on learning tasks by marking this sheet. There are no right or wrong answers. Do not spend too much time on any one statement. Remember, give the best answer that seems to describe how you generally think or feel. Almost never []
Sometimes []
Often []
Almost always []
1.
I determine how to solve a task before I begin.
2.
I check how well I am doing when I solve a task.
[]
[]
[]
[]
3.
I work hard to do well even if I don t like a task.
[]
[]
[]
[]
4.
I believe I will receive an excellent grade in this course.
[]
[]
[]
[]
5.
I carefully plan my course of action.
[]
[]
[]
[]
6.
I ask myself questions to stay on track as I do a task.
[]
[]
[]
[]
7.
I put forth my best effort on tasks.
[]
[]
[]
[]
8.
I m certain I can understand the most difficult material presented in the reading of this course.
[]
[]
[]
[]
9.
I try to understand the tasks before I attempt to solve them.
[]
[]
[]
[]
10. I check my work while I am doing it.
[]
[]
[]
[]
11. I work as hard as possible on tasks.
[]
[]
[]
[]
12. I m confident I can understand the basic concepts taught in this course.
[]
[]
[]
[]
52
Almost never []
Sometimes []
Often []
Almost always []
14. I almost always know how much of a task I have to complete.
[]
[]
[]
[]
15. I am willing to do extra work on tasks to improve my knowledge.
[]
[]
[]
[]
16. I m confident I can understand the most complex material presented by the teacher in this course.
[]
[]
[]
[]
17. I figure out my goals and what I need to do to accomplish them.
[]
[]
[]
[]
18. I judge the correctness of my work.
[]
[]
[]
[]
19. I concentrate as hard as I can when doing a task.
[]
[]
[]
[]
20. I m confident I can do an excellent job on the assignments and tests in this course.
[]
[]
[]
[]
21. I imagine the parts of the task that I have to complete.
[]
[]
[]
[]
22. I correct my errors.
[]
[]
[]
[]
23. I work hard on a task even if it does not count.
[]
[]
[]
[]
24. I expect to do well in this course.
[]
[]
[]
[]
25. I make sure I understand just what has to be done and how to do it.
[]
[]
[]
[]
26. I check my accuracy as I progress through a task.
[]
[]
[]
[]
27. A task is useful to check my knowledge.
[]
[]
[]
[]
28. I m certain I can master the skills being taught in this course.
[]
[]
[]
[]
29. I try to determine what the task requires.
[]
[]
[]
[]
30. I ask myself, how well am I doing, as I proceed through tasks.
[]
[]
[]
[]
31. Practice makes perfect.
[]
[]
[]
[]
32. Considering the difficulty of this course, the teacher, and my skills, I think I will do well in this course.
[]
[]
[]
[]
13. I try to understand the goal of a task before I attempt to answer.
Thank you very much for taking the time to complete this survey. The information in this survey will be used to improve the ISIS program. Your class is one of the first users of ISIS, and your input is extremely valuable and greatly appreciated.
53
APPENDIX H TEAMWORK SURVEY SCALE INFORMATION Scalea
Survey items
Pretest α
Posttest α
1.
A
.63
.68
7.
When I work as a member of a team, I attempt to change incorrect information immediately. 11. When I work as part of a team, I clearly and accurately exchange information with team members. 15. When I work as a member of a team, I acknowledge that I understand the information. 19. When I work as a member of a team, I pay attention to what others are saying.
COMM
.66
.75
3.
COORD
.59
.79
6. 9.
When I work as part of a team, I identify possible alternatives. When I work as part of a team, I use available information to make decisions. 13. When I work as part of a team, I evaluate the consequences of possible alternatives. 18. When I work as part of a team, I understand and contribute to the organization’s goals.
D
.82
.85
4.
When I work as part of a team, I work well with men and women from diverse backgrounds. When I work as part of a team, I interact cooperatively with other team members. When I work as part of a team, I conduct myself with courtesy. When I work as part of a team, I help other team members. When I work as part of a team, I respect the thoughts and opinions of others in the team.
I
.68
.64
2. When I work as part of a team, I exercise leadership. 5. When I work as part of a team, I teach other team members. 16. When I work as part of a team, I serve as a role model in formal and informal interactions. 23. When I work as part of a team, I lead when appropriate, mobilizing the group for high performance.
L
.89
.82
When I work as part of a team, I help to solve problems by using information provided by the team. 14. When I work as part of a team, I try to figure out what the team is thinking so as to solve problems. 22. When I work as part of a team, I seek a team approach as appropriate.
When I work as part of a team, I focus on completing the team task successfully. 8. When I work as part of a team, I organize team activities to complete tasks on time. 21. When I work as part of a team, I keep track of time.
10. 12. 17. 20.
Note. n = 17. a A = adaptability, COMM = communication, COORD = coordination, D = decision making, I = interpersonal, and L = leadership.
54
APPENDIX I SELF-REGULATION SURVEY SCALE INFORMATION Survey items 1. 5. 9. 13. 17. 21. 25. 29.
I determine how to solve a task before I begin. I carefully plan my course of action. I try to understand the tasks before I attempt to solve them. I try to understand the goal of a task before I attempt to answer. I figure out my goals and what I need to do to accomplish them. I imagine the parts of the task that I have to complete. I make sure I understand just what has to be done and how to do it. I try to determine what the task requires.
2. 6. 10. 14. 18. 22. 26. 30.
I check how well I am doing when I solve a task. I ask myself questions to stay on track as I do a task. I check my work while I am doing it. I almost always know how much of a task I have to complete. I judge the correctness of my work. I correct my errors. I check my accuracy as I progress through a task. I ask myself, how well am I doing, as I proceed through tasks.
3. 7. 11. 15. 19. 23. 4. 8. 12. 16. 20. 24. 28. 32.
α
P
.81
SC
.75
I work hard to do well even if I don’t like a task. I put forth my best effort on tasks. I work as hard as possible on tasks. I am willing to do extra work on tasks to improve my knowledge. I concentrate as hard as I can when doing a task. I work hard on a task even if it does not count.
E
.86
I believe I will receive an excellent grade in this course. I’m certain I can understand the most difficult material presented in the reading of this course. I’m confident I can understand the basic concepts taught in this course. I’m confident I can understand the most complex material presented by the teacher in this course. I’m confident I can do an excellent job on the assignments and tests in this course. I expect to do well in this course. I’m certain I can master the skills being taught in this course. Considering the difficulty of this course, the teacher, and my skills, I think I will do well in this course.
SE
.92
Note. N = 18. a
Scalea
E = effort, SC = self-checking, SE = self-efficacy, P = planning, E = effort.
55