NIH Public Access Author Manuscript Interact Comput. Author manuscript; available in PMC 2011 September 1.
NIH-PA Author Manuscript
Published in final edited form as: Interact Comput. 2010 September 1; 22(5): 417–427. doi:10.1016/j.intcom.2010.03.001.
The impact of progress indicators on task completion Frederick G. Conrad*, Institute for Social Research, University of Michigan, Joint Program in Survey Methodology, University of Maryland Mick P. Couper, Institute for Social Research, University of Michigan, Joint Program in Survey Methodology, University of Maryland Roger Tourangeau, and Institute for Social Research, University of Michigan, Joint Program in Survey Methodology, University of Maryland
NIH-PA Author Manuscript
Andy Peytchev Research Triangle Institute
Abstract A near ubiquitous feature of user interfaces is feedback on task completion or progress indicators such as the graphical bar that grows as more of the task is completed. The presumed benefit is that users will be more likely to complete the task if they see they are making progress but it is also possible that feedback indicating slow progress may sometimes discourage users from completing the task. This paper describes two experiments that evaluate the impact of progress indicators on the completion of on-line questionnaires. In the first experiment, progress was displayed at different speeds throughout the questionnaire. If the early feedback indicated slow progress, abandonment rates were higher and users' subjective experience more negative than if the early feedback indicated faster progress. In the second experiment, intermittent feedback seemed to minimize the costs of discouraging feedback while preserving the benefits of encouraging feedback. Overall, the results suggest that when progress seems to outpace users' expectations, feedback can improve their experience though not necessarily their completion rates; when progress seems to lag behind what users expect, feedback degrades their experience and lowers completion rates.
NIH-PA Author Manuscript
Introduction A friend tries to encourage you by observing “There's light at the end of the tunnel.” The comment may help you persevere because, with the end in sight, the remainder of the task becomes more pleasant or the prospect of abandoning it more unpleasant. In either case, your friend is trying to influence how you perceive the task to help you complete it. The belief seems to be that long, boring tasks will be experienced as shorter and more interesting, or at least more tolerable, when we can tell we are making progress. This appears to be the rationale of designers who provide feedback to users about their progress.
*
Corresponding author:
[email protected], fax: 001-734-764-8263, voice: 001-734-936-1019. Publisher's Disclaimer: This is a PDF file of an unedited manuscript that has been accepted for publication. As a service to our customers we are providing this early version of the manuscript. The manuscript will undergo copyediting, typesetting, and review of the resulting proof before it is published in its final citable form. Please note that during the production process errors may be discovered which could affect the content, and all legal disclaimers that apply to the journal pertain.
Conrad et al.
Page 2
NIH-PA Author Manuscript
Designers routinely employ “progress indicators” to convey this information across a broad range of tasks: downloading files, installing software, flying across the ocean, responding to on-line questionnaires, waiting to speak with a help desk advisor, and so on. The feedback is often graphical (e.g. bars that change size in accord with the proportion of the task completed, an airplane icon that moves across the flight trajectory to indicate current position), though it can be textual, (e.g. “13% completed”), or spoken (e.g. “There are six callers in front of you.”). In all of these cases the goal is to make users feel better about a task that may seem to be moving slowly and thus to reduce the chances that they will abort the task. Progress indicators can be used to track how much of the task has been completed by either the system or the user: the airplane icon on an in-flight “distance from destination” map represents the user's progress traveling across the ocean; the graphical bar that grows while software is installing indicates the system's progress completing the installation process. In both cases the rationale seems to be that giving users information about progress – either theirs or the system's – improves the users' experience; designing an interface that does not display this kind of information (whether intentionally or as an oversight) leaves users in the dark and degrades their experience.
NIH-PA Author Manuscript
Crawford, Couper and Lamias (2001) report an on-line survey experiment in which feedback on the users' progress led to marginally more positive feelings about participating in the survey than no feedback. They suggest that feedback about users' progress can reduce the perception of task burden. Similarly, Myers (1985) reports an experiment in which users carried out a series of search tasks with and without a system progress indicator. The main finding was that users preferred searching when they received feedback on system progress. He suggests that this kind of feedback lowers users' anxiety by allowing them to use “wait” time more efficiently. Meyer, Bitan and Shinar (1995) report that users were more positive about the interface when it displayed information about system wait time in a way that communicated how much waiting remained. For example during a system wait interval they displayed an array of Xs and incremented the array as time passed; Meyer et al. observed more positive evaluations when they enclosed the Xs in a rectangle to indicate how many more Xs could be presented than when the display was unbounded. So there is some evidence that progress indicators positively affect the users' experience. We refer to this as the knowledge is pleasing hypothesis.
NIH-PA Author Manuscript
However, it could be the case that providing feedback on task completion is only likely to please users and improve their experience to the extent that the feedback communicates encouraging news such as the task will be brief or is moving quickly; when the feedback conveys discouraging news, such as the task will last for a long time or is moving slowly, this may displease users and lower their satisfaction. We refer to this as the knowledge cuts both ways hypothesis. A study by Lawrence, Carver & Scheier (2002) demonstrates that positive feedback – evidence of better performance – improves participants' affect relative to negative feedback – evidence of worse performance – even though the absolute levels of performance reached by all participants at the end of the experiment were equivalent. The authors asked participants to guess the meaning of unfamiliar words and gave them “false feedback” about their performance indicating either initially strong performance – 90% correct – dropping to 50% “correct” or initially weak performance – 10% correct – increasing to 50% correct. Participants were pleased to be improving even if only to moderate levels of success whereas their counterparts were discouraged by worsening performance even though their overall performance was better than that of their counterparts. Clearly the content of the feedback – progress is being made or not – affects the way people feel. In a real world task
Interact Comput. Author manuscript; available in PMC 2011 September 1.
Conrad et al.
Page 3
where completion is optional, feedback that makes users feel good should be more likely to increase completion rates than discouraging feedback.
NIH-PA Author Manuscript
A crucial component of how users interpret progress feedback, i.e. whether it is positive or negative, may well be the degree to which it confirms their expectations, particularly expectations about duration. It could be that respondents' metrics for task duration – what is long and what is short – are relative to what they expect. Thus, it will be discouraging to learn that a task is taking longer than expected but encouraging to learn it will end sooner than expected. Boltz (1993) explored the effects of temporal expectations by telling participants they were one third, one half or two thirds finished with an experimental task when in fact they were half way through the task; as a result they expected the task to take more time, as much time or less time than it actually did. She observed that when the task lasted longer than participants expected they judged it to take more time than it actually did and showed evidence of more fatigue (slower response times) than when their expectations were confirmed; when the task lasted less time than participants expected, they perceived it to be shorter in duration than it actually was and responded more quickly. She proposed that people allocate mental resources depending on how long they expect the task to last and if their expectations are violated their perceptions of duration and the efficiency of their performance are affected accordingly.
NIH-PA Author Manuscript
Web Survey Task In the current study, we examine when feedback on task completion might help and when it might hurt. We look at how feedback on users' progress affected their perceptions of the task and the likelihood they completed it. Our test bed is the web survey response task where completion rates are intimately related to the quality of the statistics generated by the survey. When respondents (users) abandon the task it is hard to interpret their missing data. How would they have answered if they had completed the questionnaire? Should their missing answers be statistically imputed or ignored? Will the results of the survey be misleading if the respondents who complete the questionnaire provide fundamentally different answers than the nonrespondents would have provided had they answered? Thus if progress feedback increases completion rates (reduces abandonment) it has great value to the survey enterprise which produces critical data for government, social science, market research, public health, political campaigns, and so on.
NIH-PA Author Manuscript
Given the ubiquity of progress indicators in web surveys, the prevailing view among designers seems to be that knowledge is pleasing and that respondents will be more likely to continue to answer questions if they have some sense of where they are in the process. The unspoken rationale seems to be that progress feedback is an affordance (in Norman's [1988] sense) of paper questionnaires but not web questionnaires and so must be explicitly engineered in the latter. In a paper questionnaire, the proportion of remaining pages, evident by looking at or handling the questionnaire, is a good indicator of the proportion of the task completed. In web questionnaires, most implementations display one page at a time and give no inherent indication of how many pages or questions remain1. The assumption among survey methodologists seems to be that respondents find uncertainty about their position in the questionnaire disconcerting and so attempt to relieve that uncertainty by presenting progress feedback. The assumption is that this will not only increase satisfaction but completion rates as well. However, the evidence that progress indicators improve users' experience and increase completion rates is mixed. Couper, Traugott and Lamias (2001) found no difference in
1Scrolling designs, of course, do communicate progress through the position of the slider but these designs are now relatively rare.
Interact Comput. Author manuscript; available in PMC 2011 September 1.
Conrad et al.
Page 4
NIH-PA Author Manuscript
completion rates when progress indicators were used and when they were not used. They proposed that because the progress indicator was a graphical image (a pie chart indicating percent completed), this increased the download time – page by page – relative to the version of the questionnaire with no progress indicator, thus mitigating any benefits from the feedback. (Note that when the study was conducted most users were likely to have accessed the internet via relatively slow dial-up connections.) Crawford, Couper and Lamias (2001), controlled transfer time and actually found a lower completion rate when progress indicators were used than when they were not. They observed that much of the abandonment occurred on questions requiring users to type free text (“open questions”), presumably a more difficult response task than selecting from fixed choices (usually radio buttons or check boxes). They report a follow-up study in which the open questions were excised and observed a modest but reliable increase in completion rates with a progress indicator.
NIH-PA Author Manuscript
These mixed results could also support the view that feedback cuts both ways. For example, Crawford, et al. (2001), suggest that the progress indicator understated actual progress because the early difficult items took longer than later ones, thus discouraging users who (correctly) believed they were further along than the feedback indicated. In particular, when the feedback indicated that users had completed 20% of the questions, they had in fact spent about 50% of the time they would ultimately spend on the task. In general, discouraging information (e.g., that the task will take a long time or more time than expected) may well deter users from completing the questionnaire. And the timing of the information may matter as well. Encouraging information that occurs late will not motivate users who have already abandoned the task due to discouraging early information or who have stopped attending to the progress indicator because they have determined that it bears only bad news. We explored this and related ideas in two experiments. In the first experiment, we investigated how the speed (fast versus slow) and timing (early versus late) of information displayed in progress indicators affected the completion of an on-line questionnaire. In the second experiment we examined how the frequency of progress feedback (always versus sometimes available) and the initiative required to obtain the feedback (the system volunteers it or the user must request it) affected completion rates.
Experiment One
NIH-PA Author Manuscript
Our first experiment examined whether encouraging feedback led to fewer breakoffs than discouraging feedback and whether early or later progress information had more impact on breakoffs. It could be that users use the early information to calibrate their expectations about the duration and difficulty of the session so that if the feedback indicates the task is easier and quicker than expected they will be more likely to complete the questionnaire (less likely to break off). By the same reasoning, respondents should break off more if the task is harder and slower than expected. We also ask whether progress feedback affects users' subjective experience: does feedback actually make the task seem faster (or slower) and more (or less) interesting or is it just useful information about the pace at which the task is proceeding? Method Progress Indicators—A textual progress indicator (e.g. “17% completed”) appeared at the top of each page for half the users (see Figure 1). The other half was not given any feedback about their progress. Whether or not a particular user received feedback was randomly determined when they began to answer the questionnaire. Progress feedback reflected the percentage of pages on which a question was displayed that had been completed at any given point, including the current page. Progress was not incremented for pages that only announced section breaks so, for example, if page 42 presented a question Interact Comput. Author manuscript; available in PMC 2011 September 1.
Conrad et al.
Page 5
NIH-PA Author Manuscript
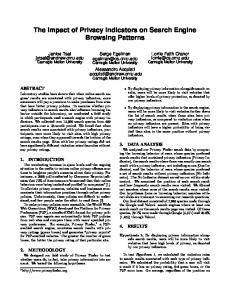
and page 43 did not, they both displayed the same progress information. Questions were displayed on 57 pages and 10 pages served as section breaks (including the final screen) but did not contain questions. To test the impact of progress feedback on the performance and experience of users, we calculated progress in one of three ways for the users selected to receive feedback (see Figure 2). For one type of progress indicator (Constant Speed), we divided each page number by 57 and presented the result as a percent. Thus progress increased as a nearly linear function of pages2 and, therefore, at a constant rate across the questionnaire (Figure 2a). This approach to calculating progress is the typical approach, i.e., a linear function of task completion (see, e.g., Myers, 1985). For another type of progress indicator (Fast-to-Slow) the rate of progress decelerated across the questionnaire, accumulating quickly at first but more slowly toward the end (Figure 2b). We produced this pattern of feedback by dividing the log of each page by the log of the final page (expressed as a percent). For example, after only 9 pages users would pass the 50% mark (progress for page 9 is 52%) but would need to advance through another 36 pages to reach the 90% mark (progress for page 45 is 91%). Thus, the feedback is more encouraging – progress accumulates faster – in the beginning than the end.
NIH-PA Author Manuscript
For a third group (Slow-to-Fast), the rate of progress accelerated across the questionnaire, accumulating slowly at first and more quickly toward the end (Figure 2c). We produced this pattern of feedback by dividing the inverse log of the each page by that of the final page. For example, to reach the 50% mark in the full questionnaire, these users would need to complete 60 pages (progress for page 60 is 52%) but only another 7 pages to surpass the 90% mark (for page 66 the amount of progress displayed is 83% and it jumps to 100% for page 67). Thus this feedback is discouraging (i.e., moves slowly) early on and gets more encouraging as the task unfolds. We varied how progress was calculated in this way for experimental purposes – not because we necessarily advocate its use in production web surveys. The current technique allowed us to vary the speed of progress without varying the actual questionnaire length and content, and to vary the speed at different points in the questionnaire. The progress indicator was designed so that the time to display a page was unaffected by whether or not any feedback was presented: a small script was executed on the user's computer determining what progress, if any, to display, and this script required the same transfer and execution time, irrespective of what it displayed.
NIH-PA Author Manuscript
Difficulty of questionnaire items—To the extent that users judge the difficulty of the task on the basis of early progress information, they might experience difficulty for later questions differently because of their early expectations, even if these were no longer consistent with the external feedback. More specifically, if the early progress feedback led users to believe the task was going quickly, they might find a relatively difficult item to be more tolerable than if the early feedback indicated a more laborious questionnaire. To evaluate this possibility, we included a test item in the middle of the questionnaire that appeared in one of two forms. One form of the question was intended to be relatively easy to answer, requiring users to register their answers by selecting radio buttons. The other form was intended to be relatively difficult to answer, requiring users to enter their answers into text boxes. The topic of the item was automobile ownership. The idea was that if the feedback in the first half had been generally positive, then the difficulty of this item might 2The function was not perfectly linear because progress was unchanged for the 10 pages which served as section breaks.
Interact Comput. Author manuscript; available in PMC 2011 September 1.
Conrad et al.
Page 6
NIH-PA Author Manuscript
not affect breakoffs. However, if users had received generally discouraging feedback from the progress indicator, then the difficult form of the question could lead to more breakoffs than the easy form. Thus the two main factors in this analysis were speed of progress (4 levels – no progress indicator and three different speeds) and the form of the automobile ownership question (2 levels). Participants—Users were recruited from two commercial, “opt-in” panels maintained by Survey Sampling, Inc (SSI). These are essentially lists of email addresses provided voluntarily by users who wish to receive survey invitations. Potential users were invited by email to answer a web-based questionnaire concerning a variety of “lifestyle” topics: health, nutrition, exercise and cars. The invitation indicated that the survey would take five to seven minutes to complete. This was our best estimate based on a previous similar survey but turned out to underestimate actual duration for many respondents.
NIH-PA Author Manuscript
As an incentive to complete the questionnaire, respondents who reached the final page qualified for entry into a sweepstakes in which they could win up to $10,000. A total of 39,217 email invitations to participate in the current questionnaire were sent, in response to which 3,179 persons (8%) logged into the survey3. Approximately half (n = 1563) of those who accessed the questionnaire were randomly selected to receive no progress feedback (the control group)4; the remaining users were randomly assigned to one of the three feedback conditions: constant speed (n = 562), fast-to-slow (n = 530) and slow-to-fast (n = 532). Questionnaire—Of the 57 pages containing questions, usually just one question was presented per page but in a few cases (e.g. the automobile ownership question) multiple questions appeared on a page. The ten pages on which no questions were presented included nine pages that displayed introductory text about the subsequent section and the final page of the questionnaire that thanked users for their participation. Users moved between all pages by clicking a navigation (“Next Screen” or “Previous Screen”) button. There was no conditional logic (i.e., no “skip patterns”) controlling the flow of questions to users so that all questions were displayed to all users irrespective of their particular answers. Thus, a “percent completed” figure was associated with each page and if a respondent revisited a page, the progress information was the same as it had been previously5. Results and Discussion
NIH-PA Author Manuscript
We first present the objective results (breakoffs, response times and item nonresponse) for the entire questionnaire, then we examine breakoffs for the automobile question designed to differ in difficulty in its two forms, and finally we report subjective results (responses to debriefing questions) for the entire questionnaire. 3The 8% response rate is low for surveys in general but is typical for web surveys. The primary concern with a low response rate is that the nonrespondents may differ from respondents on the characteristics measured by the survey. If this is the case, survey statistics may not generalize to the entire population – the goal of most surveys. The debate about this issue for web surveys is on-going (e.g. Chang & Krosnick, 2009; Kaplowitz, Hadlock & Levine, 2004) and it concerns serious topics for social scientists. However, the current study was not conducted to produce population estimates but to explore the impact of progress indicators on completion rates among web respondents. The low response rates do not prevent us from generalizing the current results to other samples of web respondents and, in fact, we test this by partially replicating the current experiment with a somewhat different sample in experiment 2. 4We designed the control group to be relatively large because the survey in which the current experiment was embedded had numerous other purposes that we did not want to compromise in the event that certain progress indicators seriously lowered completion rates. Had this been the case we could have restricted analyses to 50% of users in the control group, a large enough sample to produce reliable data in the other studies. In fact, this was not a problem and we used a smaller control group in experiment 2. 5This would have been more complicated if the questionnaire had implemented a skip pattern because “percent completed” might surge forward when respondents are skipped over a series of questions or might actually move backward at branch points when the denominator in the progress calculation increases. See Kaczmirek, Neubarth, Bosnjak & Bandilla, 2004 for a discussion of how to smooth the changes in progress feedback when a questionnaire branches.
Interact Comput. Author manuscript; available in PMC 2011 September 1.
Conrad et al.
Page 7
NIH-PA Author Manuscript
Breakoffs across the questionnaire—Of the 3,179 users who started the questionnaire 457 broke off, for an overall breakoff rate of 14.4%. The question is how these breakoffs were distributed across the different progress indicator conditions. The breakoff rate was highest (21.8%) when the early progress feedback was discouraging (Slow-to-Fast), lowest (11.3%) when the initial feedback was encouraging (Fast-to-Slow), and intermediate (14.4%) with constant speed feedback and when there was no feedback (12.7%), overall χ2(3) = 31.57, p