The impact of test-first programming on branch coverage and mutation score indicator of unit tests: An experiment Lech Madeyski∗,a a
Wroclaw University of Technology, Wyb.Wyspianskiego 27, 50370 Wroclaw, POLAND
Abstract Background : Test-First programming is regarded as one of the software development practices that can make unit tests to be more rigorous, thorough and effective in fault detection. Code coverage measures can be useful as indicators of the thoroughness of unit test suites, while mutation testing turned out to be effective at finding faults. Objective: This paper presents an experiment in which Test-First vs TestLast programming practices are examined with regard to branch coverage and mutation score indicator of unit tests. Method : Student subjects were randomly assigned to Test-First and TestLast groups. In order to further reduce pre-existing differences among subjects, and to get a more sensitive measure of our experimental effect, multivariate analysis of covariance was performed. Results: Multivariate tests results indicate that there is no statistically significant difference between Test-First and Test-Last practices on the combined dependent variables, i.e. branch coverage and mutation score indicator, (F (2, 9) = .52, p > .05), even if we control for the pre-test results, the subjects’ experience, and when the subjects who showed deviations from the assigned programming technique are excluded from the analysis. Conclusion: According to the preliminary results presented in this paper, the benefits of the Test-First practice in this specific context can be considered minor. ∗
Corresponding author Email address:
[email protected] (Lech Madeyski) URL: http://madeyski.e-informatyka.pl/ (Lech Madeyski)
Preprint of an article in Information and Software Technology 52(2), pp.169-184, Feb 2010
Limitation: It is probably the first-ever experimental evaluation of the impact of Test-First programming on mutation score indicator of unit tests and further experimentation is needed to establish evidence. Key words: empirical study, test-first programming, test-driven development, unit tests; 1. Introduction Test-First (TF) Programming [1], also known as Test-Driven Development (TDD) [2]1 , is a novel software development practice that has gained recent attention in professional settings [1, 3–11] and has made initial inroads into software engineering education [12–22]. However, bringing all members of development teams to accept a test-first work culture may be a tough task. Managers sometimes feel as if they just waste valuable “resources”, as continuous testing and refactoring does not extend functionality. Also, developers sometimes find it difficult to change their habit and to follow strict rules of TF instead of Test-Last (TL) or even “code and fix” chaotic programming. Better production code or better test quality, which in turn influences the quality of the related pieces of production code, might be good arguments in such situations. While most of empirical research concerning the TF practice focuses on direct measurement of production code the aim of the paper is to shed light on the effects of the TF practice from a different, test code, perspective. Hopefully, it can help embrace wider perspective of the possible effects of the TF practice. Moreover, some researchers argue that the quality of tests influences greatly the quality of the production code, because tests are so important and tightly interwoven into both the TL and the TF development practices [16]. The difference between the TF and the TL development practices is, to a large extent, related to when and how often developers perform unit testing. Therefore, the most immediate effect of the TF vs the TL approach is expected in the metrics related to unit tests. The TF practice may have a positive impact on unit tests (e.g., their fault detection effectiveness or thoroughness), as tests should be written for any piece of production code that could possibly break [23, ch. 34]. However, to the author’s knowledge, there is no empirical evidence concerning the impact of 1
According to Koskela [3] TDD and TF are just different names for the same thing.
2
the TF practice on the fault detection effectiveness of unit tests. Therefore, the aim of this paper is to fill this gap. The TF practice is assumed to be a software development technique that can enforce more rigorous, thorough, and effective unit testing. According to Astels [4], TDD leads to improved code coverage. Ambler argues that the TF practice “does not replace traditional testing, instead it defines a proven way to ensure effective unit testing” [24]. Mattu and Shankar also conclude that “TDD defines a proven way to ensure effective unit testing” [25]. As shown in Sections 3.2 and 3.3, code coverage measures can be useful as indicators of the thoroughness of unit test suites [26], while mutation score is a more powerful and more effective measure of the fault finding effectiveness of a test suite than statement and branch coverage [27], as well as data-flow coverage [28, 29]. Therefore, the research question is whether the effect of the TF (vs TL) technique on branch coverage and mutation score indicator is significant or not. Experiments are a systematic, disciplined, quantifiable and controlled way of evaluation [30]. They are viewed by many as the “gold standard” for research [31] and are particularly useful for determining cause-and-effect relationships. Furthermore, experiments, usually done in a laboratory environment, provide a high level of control [30]. Hence, the research question was tested by means of an experiment. It is noteworthy that both code coverage and mutation score indicator investigated in this paper are related to white-box unit level testing (not functional testing). However, according to Boehm [32], as well as IEEE Standard 1008-1987 [33], as much as possible should be tested at the unit level, since there are significant economic benefits in the early detection of faults. This paper is organized as follows. Related empirical studies concerning the TF practice are presented in Section 2. Section 3 presents the conceptual model used to guide the research along with the TF and the TL development methods, fault detection effectiveness and thoroughness of unit tests. The definition, design, and operation of the experiment are described in Section 4; the analysis of the experiment is conducted in Section 5. Threats to validity are discussed in Section 6. Section 7 explains the results, discusses the conclusions and future work.
3
2. Related work A separate report by Madeyski, available online [34], presents a detailed summary of many empirical studies conducted so far, including the references for each study, the environment (e.g. academic or industrial) in which an empirical study was conducted, the number of subjects involved in each empirical study, and statistical significance of the effects of the TF practice (if available), along with textual descriptions of the findings. A short summary including productivity and quality effects of the TF technique is shown in this section. Does the TF practice speed up the development in comparison with the TL technique? Some empirical findings [17, 18, 21, 22, 35] show that the answer to that question might be positive. The others [7–10, 19, 36–38] lead to the opposite conclusion. A neutral answer is given as well [5, 6, 15, 39]. Interestingly, the TF practice is characterized by the higher ratio of active development time (described as typing and producing a code) to passive development time (spent on reading the source code, looking for a bug etc.) [35]. Does the TF practice drive the development to a better code quality? Several industrial case studies (e.g. in Microsoft, IBM, Ericsson AB) concluded that the TF approach reduces defect rates [5, 6, 8–10], fault-slipthrough rates, fault cost and total project cost [40], or maintenance cost [41]. Also, TF developers produce higher quality code, which passes more functional black box test cases [37, 38]. Furthermore, a large portion of students strongly agree (29%) or somewhat agree (44%) with the opinion that the TF development improves quality [14]. On the other hand, some of the empirical studies lead to the conclusion that TF has no significant impact on external quality (number of external tests passed) [16] and that external quality is significantly lower if the TF technique is used instead of TL in case of solo programmers (p = .028) and pairs (p = .013) [19], assuming the same development time. It was also reported that the TF practice does not influence external clients’ assessment of quality [22], in spite of more effort spent on testing (p < .1). A controlled experiment with professionals provided empirical evidence (p < .05) that the TF practice requires more development time, while there is no statistical evidence that the TF practice brings about more accurate and precise unit tests [7]. Moreover, programs developed according to the TF rules are not 4
more reliable [15] and the TF approach provides little or no added value to a team [42]. Researchers reported higher [43], similar [18] or slightly lower [15, 16] code coverage as a result of the TF practice. Package level design quality indicators (package dependencies) are not significantly affected by the TF technique [20]. However, the TF practice seems to have an effect on some class level quality metrics, i.e. high LCOM (lack of cohesion) metric (while WMC, DIT, NOC and RFC did not reveal significant differences) [43] and the tendency to write simpler classes and sometimes simpler methods [11]. Furthermore, M¨ uller [44] studied “the concept of the controllability of assignments” to measure testability of programs and concludes that the number of methods where all assignments are completely controllable is higher for TF projects than for conventional projects. The previous discussion summarizes the productivity and quality effects of the TF practice in different environments. Part of the studies included in this review was performed in an academic setting and therefore their external validity could be limited. On the other hand, several arguments are given in Section 6 to explain why it is acceptable to use students as subjects [45–48]. It is worth mentioning that those empirical findings are often inconclusive. The contradictory results may be explained by the differences in the context in which the studies were conducted, the difficulty in isolating the TF effects from the other variables (e.g. programmers expertise), incomparable measurements etc. Furthermore, many studies do not apply statistical analysis, do not report effect sizes, and do not discuss threats to the validity of each study to allow generalizations. So, readers should consider the empirical findings within the specific context of each study [49]. According to reviewing guidelines by Tichy [47], any empirical study, and especially a novel one, has flaws. Hence, we should not expect perfection or decisive answers, neither should we reject negative results [47]. In fact, the empirical studies on the impact of the TF practice on code coverage are inconclusive [15, 16, 18, 43]. However, it is noteworthy that none of the empirical studies discussed in Section 2 and presented in [34] tackled the research question concerning the impact of the TF technique on mutation score indicator of unit tests. Empirical evidence on the impact of the TF technique on unit test suites characteristics is limited to code coverage. Empirical study presented in this paper builds on previous studies but, at the same time, it extends the empirical body of evidence by analysing new, important characteristic of developed unit test suites (i.e. mutation score indicator with the help of the mutation testing technique), along with code 5
coverage. 3. Conceptual model This section discusses variables in the conceptual model: the main experimental manipulation (TF vs TL), dependent variables (branch coverage and mutation score indicator of unit tests), and variables that can influence the outcome but are not part of the main experimental manipulation. In fact, the conceptual model tested in this study can be seen as a part of a larger model, as unit tests (as well as their thoroughness and fault detection effectiveness) and TF programming constitute only an element of a larger puzzle. According to Maxwell and Delaney, pre-existing differences among subjects are at least as important a predictor of their scores on the dependent variables as any independent variable [50]. Also, the existing research concerning the impact of pair programming (another software development practice of eXtreme Programming methodology) on the thoroughness and the fault detection effectiveness of unit tests shows that the development method accounts for a relatively small proportion of the total variance in the dependent variables [51, 52]. Therefore, it seems justified to take into account also the other variables (shown in Section 4.2) that are not part of the main experimental manipulation (described in Section 3.1) but have an influence on the dependent variables (presented in Sections 3.2 and 3.3). As a result, we apply the multivariate analysis of covariance (MANCOVA) as an experimental design method and take advantage of information concerning the individual differences between the subjects that were present at the start of the experiment task. Since the analysis of covariance is able to compensate, to some extent, for pre-existing differences between groups, it is justified to suggest this type of analysis as a means of addressing the internal validity threats that arise in studies with selection differences between groups [53]. MANCOVA is an extension of the analysis of covariance (ANCOVA) when there are two or more dependent variables. MANCOVA has been used to protect, more conservatively than a series of ANCOVAs performed separately for each dependent variable, against the inflation in the family-wise error rate. MANCOVA also protects against the chance that covariates were influencing the outcome (dependent variables) and, according to Field [79], MANCOVA is preferable to conducting several ANCOVAs. As a result, this study evaluates the impact of the TF practice on mutation score
6
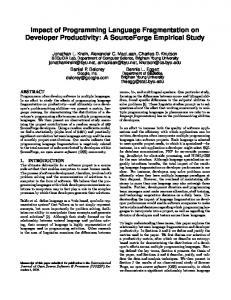
indicator and branch coverage of unit tests, while adjusting for the effect of selected variables (covariates) that can influence the dependent variables. 3.1. Test-first versus test-last programming TF constitutes an incremental development practice which is based on selecting and understanding a requirement, specifying a piece of functionality as a test, making sure that the test can potentially fail, then writing the production code that will satisfy the test condition (i.e. following one of the green bar patterns), refactoring (if necessary) to improve the internal structure of the code, and ensuring that tests pass, as shown in Figure 1. Green bar patterns are strategies used in the TF technique for writing the production code and getting to a green bar. A detailed description of these strategies (i.e. Obvious Implementation, Fake It, and Triangulation) is given by Beck [2], along with code snippets. Refactoring is a disciplined technique for reorganising the existing body of a code in such a way that it improves its internal structure yet does not alter the external behaviour [54]. TF provides feedback through tests, and simplicity of the internal structure of the code through rigorous refactoring. The tests are run frequently, in the course of writing the production code, thus driving the development process. The technique is usually supported by frameworks to write and run automated tests (e.g. JUnit [55, 56], CppUnit, NUnit, PyUnit and XMLUnit [57]). Writing tests before the production code is most central to the TF practice and the most obvious difference between the TF and the TL practices. The reference TL technique, that represents a classic approach for the purpose of investigation, also involves common characteristics, i.e. incremental development, writing tests by the programmer, and regression testing, but the programmer writes all the tests for a new system feature after the corresponding piece of the production code for that feature, as shown in Figure 2. It is also worth mentioning that refactorings are suggested in both, the TF and the TL, techniques. Refactorings are assisted by tests (which are required in both treatments) to increase confidence in the correctness of the refactoring rules application, as all those tests still have to pass after the refactorings. 3.2. Thoroughness of unit tests Programmers who follow the TF or the TL programming technique, and thus write unit tests, would benefit from measures indicating whether their
7
Choose a user story
Understand the story Yes
No Add a single test
Story complete?
Pass
Run test(s)
Fail Result?
Correct the added test that should fail Pass
Correct
Result? Run tests
The added test failed No
Is refactoring needed?
Yes Refactor
Write production code to get to green bar using Obvious Implementation Fake It, Triangulation
Figure 1: Test-First programming activities
software has been thoroughly and effectively tested. Accordingly, the thoroughness of unit tests is discussed in this section, while the fault detecton effectiveness of unit tests is considered in Section 3.3. An important issue is the proper choice of a code coverage measure available from the array of code coverage tools, which measure how thoroughly tests exercise programs [26]. Cornett [58] presents a number of useful insights into this issue and shows that branch coverage includes statement coverage, because exercising every branch leads to exercising every statement. More powerful measures such as Modified Condition/Decision Coverage (used in aviation software) or Condition/Decision Coverage are not offered by available code coverage tools in Java. Therefore, branch coverage as the best of the available code coverage measures, was measured by means of Clover code coverage measurement tool [59] and used in the analysis of the thoroughness
8
Choose a user story
Pass Understand the story Result?
Fail
Correct production code
Run all tests
Correct Run all tests
Fail Result?
Pass No Implement the story Is refactoring needed? Write tests to the story
Yes
Refactor
Run all tests
Correct
Fail Result?
Pass
Figure 2: Test-Last programming activities
of unit tests. 3.3. Fault detection effectiveness of unit tests Mutation testing, proposed by DeMillo et al. [60] and Hamlet [61], appeared to be more powerful and more effective at finding faults than statement and branch coverage [27], as well as data-flow coverage [28, 29]. The effectiveness of test suites for fault localization is estimated on seeded faults inserted into a program by creating a collection of mutants (i.e. faulty versions of the original program). Mutants are produced on the basis of the original program by using mutation operators which describe syntactic changes to the programming language. Then the tests are used to execute these mutants, while the goal is to measure how well a test suite is able to find faults. Mutation testing is not meant as a replacement for code coverage, but as a 9
complementary approach useful in finding a code that is covered by tests but not effectively tested. Mutation score (also called mutation adequacy) is a kind of quantitative test quality measurement that examines a test set’s effectiveness or ability to detect faults [62]. It is defined as a ratio of the number of killed mutants to the total number of non-equivalent mutants. The total number of nonequivalent mutants results from the difference between the total number of mutants and the number of equivalent mutants. The latter always produce the same output as the original program, so they cannot be killed. Determining which mutants are equivalent to the original program is such a tedious and error-prone activity, that even ignoring equivalent mutants is sometimes considered [63]. That means that we are ready to accept the lower bound on mutation score, called the mutation score indicator [51, 52]. Accepting it results in the cost-effective application of a mutation analysis, while it still provides meaningful information about the fault detection effectiveness of test suites. Mutation testing of real-world software would be difficult without a reliable, fast and automated tool that generates mutants, runs them against a test suite, and reports results. Therefore, a new helpful instrument [51, 52, 64] (i.e. Judy mutation testing tool) was used, which supports generation, compilation and execution (i.e. testing) of mutants, implements both traditional and object-oriented mutant operators, and supports JUnit [55] (de facto standard among unit testing frameworks), as well as Ant [65] (Java build tool). Due to the high execution costs of mutation testing, Offutt et al. [66] have proposed a selective mutation technique which uses a subset of the mutation operators, i.e. ABS (absolute value insertion), AOR / ROR (arithmetic / relational operator replacement), LCR (logical connector replacement), and UOI (unary operator insertion). Other mutation operators such as UOD (unary operator deletion), SOR / LOR (shift / logical operator replacement), and COR / ASR (conditional / assignment operator replacement), dedicated to Java language, have been recently presented by Ammann and Offutt [67] along with the aforementioned selective operators. EOA (reference assignment and content assignment replacement) and EOC (reference comparison and content comparison replacement) mutation operators proposed by Ma et al. [68] are able to model object-oriented (OO) faults, which are difficult to detect and therefore, can be considered to be good mutation operators for OO programs [69]. EAM / EMM (accessor / modifier method change), 10
and JTD / JTI mutation operators (this keyword deletion / insertion) [68] were added, because there was no reason to exclude these operators, as there was still no determined set of selective mutation operators for class mutation operators [69]. As a result, the mutation operators set, used in our analysis, consists of the 16 aforementioned mutation operators supported by Judy [52, 64]. Judy makes use of an aspect-oriented approach to speed up mutation testing. In conclusion, branch coverage and mutation score indicator are used as complementary measures to grasp better the essence of unit tests characteristics, such as the thoroughness and the fault detection effectiveness of unit test suites. 4. Experiment description This section describes the definition, design, as well as the operation of the experiment. The following definition determines the foundation for the experiment [30]: Object of study. The objects of study are unit tests. Purpose. The purpose is to evaluate the impact of the TF technique on unit tests. Quality focus. The quality focus investigated in this paper is the thoroughness and the fault detection effectiveness of unit tests, measured by branch coverage and mutation score indicator, respectively. Perspective. The perspective is from the researcher’s point of view. Context. The experiment is run with the help of MSc students as subjects involved in the development of a web-based paper submission and review system in Java. 4.1. Context selection The context of the experiment (described in Table 1) was the E-Business Technologies (EBT) course, and hence the experiment was run off-line in a laboratory setting [30]. Java was the programming language. Eclipse was the Integrated Development Environment (IDE). Java Enterprise Edition (Java EE) was the software platform. The subjects participating in the experiment were third and fourth-year graduate MSc software engineering students. The MSc program of Wroclaw University of Technology (WUT) is a 5-year program after high school. Eighteen subjects can be classified as E2 (i.e. with less than 3 months recent 11
Table 1: The context of the experiment Background before the experiment task: Mean programming experience [years] Mean JUnit experience [months] Mean size (in non-commented lines of code) of the largest software component written solo in Java by subjects The experiment task: Number of user stories used to introduce requirements Duration of the experiment task [weeks] Mean value of overall programming time in Eclipse [hours] Mean number of non-commented lines of production code (P roductionLOC) Mean number of non-commented lines of test code (T estLOC) Mean number of non-commented lines of code (T otalLOC = P roductionLOC + T estLOC)
5.32 6.27 8886 23 9 77 2698 2278 4976
industrial experience), while four subjects can be classified as E4 (i.e. recent industrial experience, between 3 months and 2 years) according to H¨ost et al. classification scheme [70]. Four E4 subjects and four E2 subjects had not only academic but also real world professional software development experience. They were evenly divided into the TF and the TL projects as a result of random assignment. It is also worth mentioning that all subjects had prior experience in programming in C, C++ (using object-oriented approach), .NET and Java programming and had completed various software engineering and programming courses (including algorithms and data structures, C language, concurrent programming, object-oriented programming in C++, C#, .NET, Java and web-applications development) totalling over 450 hours. Software development environment was close to the one used in industry (Java 5 programming language, Eclipse Integrated Development Environment, Eclipse Web Tools Platform, JUnit testing framework for unit tests, Cactus testing framework for in-container testing, Java servlets, Java Server Pages and JSTL available on Jetty web container, SVN code repository etc.). The course recalled or introduced important topics of Java EE web development related to web application architectures, technologies, the TF and the TL development, refactoring etc. The course was taught by the author of the paper. Furthermore, three 2-hour trainings in the TF & TL development, refactoring and aspect-oriented programming were given by developers with recent industrial experience. 12
4.2. Variables selection The independent variable (IV) is the software development technique – TF or TL – used by the experimental groups. Both techniques are presented in Section 3.1. The dependent variables (DVs) are branch coverage (denoted as BC) and mutation score indicator (denoted as M SI), described in Sections 3.2 and 3.3, respectively. Additionally, covariates (CVs), which can be viewed as measures of programmer expertise, are taken into account. Two kinds of indicators of programmer expertise are used. One is based on the pre-test questionnaire answers concerning diverse dimensions of programming experience: • P rogExp captures experience in an academic and school setting. Possible values were between 1 and 17 years. • JSP Exp captures experience (academic or not) in Java Server Pages web applications development. Possible values were between 0 and 36 months. • N onAcademicExp captures a professional, real world software development experience. It was a binary variable. Another indicator (P reT estGrade) attempted to measure programming skill more directly on the basis of the results of the pre-test programming tasks described in Section 4.7. A traditional 2 to 5 grade system was used: 2.0 (fail), 3.0 (pass), 3.5 (between pass and good), 4.0 (good), 4.5 (between good and very good), 5.0 (very good). This categorical covariate, dummy coded into binary variables, was used in the analysis of covariance. Only four dummy variables (P reT estGrade3.5, P reT estGrade4.0, P reT estGrade4.5 and P reT estGrade5.0) were created for the sake of covariance analysis, as there were only five groups of subjects with assigned grades 2, 3.5, 4.0, 4.5, or 5.0 (i.e. the grade 3.0 was not given to any subject) and, as mentioned in literature [71], one fewer dummy variable is always needed than the number of groups. Experience and the so called pre-test results are often used as covariates, because experience and how the subjects score before treatments generally correlate with how they score after treatments [72]. By adjusting for the effects due to the aforementioned covariates, the error variance (i.e. the variance brought by other “nuisance variables”, such as individual differences) can be reduced. 13
4.3. Hypotheses formulation The following null hypotheses are to be tested: • H0 BC, T F/T L — there is no difference in branch coverage (BC) between the TF and the TL projects. • H0 M SI, T F/T L — there is no difference in mutation score indicator (M SI) between the TF and the TL projects. 4.4. Selection of subjects The choice of the subjects was based on convenience. They were students taking the EBT course. Prior to the experiment, the students filled in a pre-test questionnaire. The aim of the questionnaire was to get a picture of the subjects’ background. It turned out that the mean value of programming experience in calendar years was over 5 (see Table 1). The ability to generalize from this context is further elaborated, when discussing threats to the validity of the experiment in Section 6. 4.5. Design of the experiment The design is one factor (i.e. the software development method), with the two treatments (TL and TF). All of the subjects were supposed to follow the rules of the assigned development technique (TL or TF), as well as the general rules of the project (e.g., coding standard by Sun Microsystems, Inc., test naming convention, commit rules). The assignment of treatments was randomized. Randomization on the allocation of subjects to the TF and the TL groups was used to average out the effect of a factor that may otherwise be present [30]. Moreover, some differences between subjects were taken into account by means of analysis of covariance. Analysis of covariance design versus Treatments × Blocks design is discussed by several researchers. The greater sensitivity of analysis of covariance over blocked analyses for the same data is, according to Maxwell and Delaney, a very general result [50]. Although randomized block analyses address similar questions to ANCOVA, they generally should be avoided in favour of ANCOVA for several reasons [50]. The direct effect of the concomitant variable will have 1 degree of freedom associated with it in ANCOVA, while b − 1 degrees of freedom in randomized blocks (b equals the number of blocks). That proves to be a disadvantage for the randomized block analysis because the linear trend accounts for the main part of the explainable 14
variance in most applications in the behavioural sciences [50]. ANCOVA interaction tests consume fewer degrees of freedom than a blocking analysis. The loss of degrees of freedom in blocking analyses can become critical in designs using relatively few subjects [50], such as this one. Furthermore, the greater sensitivity of ANCOVA comes from the fact that ANCOVA makes use of all the quantitative information in the covariate, whereas the randomized block analysis typically ignores information due to some heterogeneity of data within blocks [50]. In the case of one of the TL projects, as well as one of the TF projects, tests were written in such a way that metrics calculation was not possible. Furthermore, with the help of an ActvitySensor Eclipse plugin [35] it was possible to exclude from analysis (presented in Section 5) three TF projects that were not, in fact, conducted in a test-first manner. As a result, the design was unbalanced, with 9 TF and 10 TL projects. 4.6. Instrumentation and measurement The instruments and materials for the experiment were prepared in advance, and consisted of pre-test and post-test questionnaires, requirement artefacts (user stories), a detailed description of software development techniques (TF and TL), subjects’ duties, instructions how to use the experiment infrastructure (e.g. SVN version control system) etc. They were available to the subjects via a dedicated web site and assigned SVN accounts. BC and M SI were collected by means of Clover [59] and Judy [51, 52, 64] tools, respectively. In order to enable better measurement of the development process, especially how development techniques were carried out (e.g. whether tests were written before related pieces of a production code), the ActivitySensor plugin [35], integrated with the Eclipse IDE, has been developed at WUT before the experiment, tested in practice [35] and used by the subjects. 4.7. Experiment operation The experiment was run in 2006 and consisted of: pre-study, preparation and execution (i.e. the main experimental task) phases. The pre-study was run before the main part of the experiment (i.e. before the preparation, as well as the execution phase) with three fifth-year graduate MSc software engineering students in order to check the experiment procedures, infrastructure and instruments (see Section 4.6).
15
The preparation phase consisted of exercises prepared to enhance development expertise of the subjects in the areas related to the main experiment task (e.g. web applications development, the TL and TF development techniques, refactoring). The subjects were given pre-test programming assignments concerning the development of three versions of the voter web application developed using Java EE technologies (servlets, Java Server Pages, JavaBeans) and different web architectures (e.g. Model 1 and Model 2 [73]). In this way, the subjects had the opportunity to check the advantages and disadvantages of different architectural patterns. Web application based on model 2 architecture, which in turn is based on Model-View-Controller (MVC) architectural pattern, was covered by unit tests (using JUnit testing framework) and in-container tests (using Cactus testing framework [74]) using the TL technique. Additional functionalities (e.g. questionnaires web management capabilities of defining, removing and serving different questionnaires, support for different roles and access rights) were developed according to the TF technique. Requested method coverage for JavaBeans and servlets was about 90-100% level (e.g. with exception of getters and setters automatically generated in Eclipse). More advanced architectural frameworks such as Presentation-Control-Mediator-Entity-Foundation (PCMEF) and eXtensible Web Architecture (XWA) [75], combining strengths of the MVC and PCMEF frameworks, were also introduced as convenient ways to deal with application complexity. Refactoring exercises consisted of six practice-oriented refactoring tasks. The subjects had to refactor different samples of the existing code. One of the refactoring tasks was to refactor the code of the voter application developed earlier. The latest (optional) set of exercises concerned aspect-oriented development. Lectures and exercises were given by the author, as well as by developers with recent industrial experience. The goal of the preparation phase was to prepare subjects sufficiently well to perform the tasks required of them during the main experimental phase, as well as to get the pre-test results. The subjects obtained theoretical and practical training in order to avoid the situation that they would be overwhelmed by the complexity of, or unfamiliarity with, the main experimental task [47]. Therefore, the preparation phase took six weeks. In the execution phase, the subjects were given an introductory presentation of a web-based paper submission and review system’s requirements, and were asked to implement it during nine weeks assigned to that phase. The subjects were randomly divided into the TL and the TF groups. In addition, they filled in pre-test and post-test questionnaires that made it possible to 16
know their experience, opinions, and to enable qualitative validation of the quantitative results. The subjects were not aware of the actually formulated hypotheses. The measurement data were collected automatically by tools described in Section 4.6. The industry standard for code coverage is in the range 80-90% [5, 58, 76] and the same method coverage level for Java Beans and servlets was suggested, but not required, during the experiment. It was also emphasized that the TF method is not a testing or quality practice per se, as it may appear. It is primarily a development, design and coding practice (guided by tests), with possible side effects. The experimental task was not trivial. User stories were created on the basis of requirements gathered at WUT on the basis of recent experience with several paper submission and review systems (e.g. OpenConf by Zakon Group LLC). The project can be classified as an artificial (I2) project according to the H¨ost et al. classification scheme [70]. 4.8. Power estimation There are two primary kinds of power estimation, a priori and post hoc. The first one alerts the researcher as to how many subjects per group will be needed for adequate power. The latter may help to interpret the results of completed studies (e.g. researchers insensitive to the power problem may interpret non-significant results as demonstrating that treatments made no difference [72]). Typically, we use an α-level of .05, and additionally in this study we assume two dependent variables. The power of a test is the probability that a given test will find an effect, assuming that one exists. In the two-group case, F values will be identical in all multivariate test statistics [77]. Power estimations are calculated on the basis of the guidelines by Stevens [72]. Given power .66(.44) (i.e. 66 or 44 percent chance of finding a difference if one exists), an α-level of .05, and medium effect size (D2 = .64), 25(15) subject group sizes are needed [72]. The obtained power estimations suggest careful interpretation of possible non-significant results [72]. Fortunately, meta-analysis makes it possible to combine results from a series of studies, each of which had insufficient statistical power to reliably accept or reject the null hypothesis. Presented results contain effect size calculations and are detailed enough to be included in meta-analysis, where results from independent studies can be combined and summarized in a quantitative way. Furthermore, calculated effect sizes provide a measure of the importance of
17
the experimental effect which is much less affected by sample size than statistical significance and, therefore, is a better indicator of practical significance. 5. Analysis of the experiment The experiment data are analysed with descriptive analysis and statistical tests. 5.1. Descriptive statistics The descriptive statistics of gathered measures are summarized in Table 2. Columns “Mean”, “Std.Dev.”, “Std.Error”, “Max”, “Median” and “Min” stand for the mean (M ), standard deviation (SD), standard error (SE), maximum, median (M dn) and minimum values for each measure (BC and M SI) and development method (“Dev.Meth.”). The first impression is that the differences between the TL and the TF groups are not large. The accuracy of the mean as a model of the data can be assessed by the standard deviation which is rather large (compared to the mean) in the case of M SI. The standard deviation and box plots in Figure 3 tell us more about the shape of the distribution of the results. Summarizing descriptive statistics in APA (American Psychological Association) format [78], we can conclude that branch coverage in the TL (M = .56, SD = .14) and the TF projects (M = .64, SD = .17) differ, as higher levels of branch coverage are reached in the case of the TF projects. Mutation score indicators in the TL (M = .17, SD = .10) and the TF projects (M = .17, SD = .12) are almost identical. The whiskers coming out of the top of the boxes located in Figure 3 show that the distribution is skewed in the case of the TL group of the BC box plot. Furthermore, there is one extreme point (that extends for more than 3 box-lengths from the edge of the box) on the M SI box plot and one possible outlier (that extends for more than 1.5 box-lengths) on the BC box plot, as shown in Figure 3. The outliers’ scores are genuine, not just errors. Fortunately, square root transformation reduces the impact of these outliers, as there are no outliers in M SIT (i.e. M SI after square root transformation). Transformations are suggested by Tabachnick and Fidell [77] to improve the analysis and to reduce the impact of outliers but transformed variables are sometimes more difficult to interpret. To answer the question whether the impact of the TF technique on BC or M SI is significant, or not, statistical tests must be performed, preceded by the testing of underlying assumptions. 18
Figure 3: BC and M SI box plots
5.2. Assumption testing We start with an exploratory analysis of the collected data to check whether they follow the assumptions of MANCOVA. By doing this we address practical limitations of the technique. In designing the study it was ensured that covariates were measured prior to the treatment or experimental manipulation (IV) to avoid scores on covariates also being influenced by the treatment. Otherwise, when MANCOVA controls for covariates, it will also remove some of the treatment effect, thereby reducing the likelihood of obtaining a significant result. An additional assumption concerning the reliability of covariates involves choosing the most reliable measuring tools available. Owing to the nature of data collection procedures, there is no reason to expect unreliability of a magnitude harmful to covariance analysis. The assumptions that observations should be independent, and that the collected data must be measured on an interval or ratio scale are met. The Table 2: Descriptive statistics for (M SI) Measure Dev. Mean Meth. (M ) BC TL .56 TF .64 M SI TL .17 TF .17
branch coverage (BC) and mutation score indicator Std.Dev. (SD) .14 .17 .10 .12
19
Std.Error (SE) .04 .06 .03 .04
Max .72 .86 .33 .47
Median (M dn) .57 .68 .16 .15
Min .29 .30 .03 .06
sample size assumption — that the minimum required number of cases in each cell of MANOVA is equal to the number of dependent variables — is met as well (there are two levels of the independent variable, and the two dependent variables). Moreover, SPSS (ver.14, SPSS Inc., USA) adjusts automatically for unequal group sizes. The assumption of normality and multivariate normality is that our data have come from a population that has normal distribution, i.e. each dependent variable is normally distributed within each group and the dependent variables (collectively) have multivariate normality with the groups. Objective tests of the distribution are the Kolmogorov-Smirnov and the Shapiro-Wilk tests. For the BC data the distribution for the TL, as well as the TF projects appears to be normal (p > .05). For the M SI data the distribution for TL is normal, whereas that for TF seems to be non-normal (p < .05), according to the Kolmogorov-Smirnov and the Shapiro-Wilk tests. Fortunately, the distribution becomes normal after square root transformation of the M SI data, since the Kolmogorov–Smirnov and the Shapiro–Wilk test statistics return significance values greater than .05, see Table 3. To check for outliers, z-scores were inspected. Fortunately, non of the z-scores is greater than 2.58, and only one is greater than 1.96. To test for multivariate normality, the Mahalanobis distances were determined, as shown in Table 4. It appeared that the maximum Mahalanobis distance (6.78) is less than the critical value (13.82), so, fortunately, there are no substantial multivariate outliers. The aforementioned critical value is determined by using critical values of chi-square table at α = .001, with degrees of freedom (df ) equal the number of dependent variables [77]. The assumption of homogeneity of variance-covariance matrices means that the variances in each
Table 3: Tests of normality DV
DevMeth
Kolmogorov–Smirnov1 Statistic df2 Sig.
BC
TL TF TL TF
.166 .259 .131 .248
M SIT
10 9 10 9
.2003 .083 .2003 .118
1
Shapiro–Wilk Statistic df2 Sig. .926 .918 .971 .875
Lilliefors Significance Correction Degrees of freedom 3 This is a lower bound of the true significance. 2
20
10 9 10 9
.412 .374 .903 .138
Table 4: Mahalanobis distance — residual statistics Min Max Mean (M ) Std.Dev.(SD) N Mahalanobis Distance
.036
6.778
1.895
1.844
19
group are roughly equal (homogeneity of variance) for each dependent variable, and the correlation between any two dependent variables is the same in all groups. This assumption is examined by testing whether the population variance-covariance matrices of the different groups in the analysis are equal. If this assumption is true, Levene’s test, as a preliminary check, should not be significant for any of the dependent variables. Levene’s tests, as shown in Table 5, are non-significant (significances p > .05) for any of the dependent variables, indicating that the variances in the different experimental groups are roughly equal (i.e. not significantly different). However, Levene’s test does not take account of the covariances and so the variance-covariance matrices should be compared between groups using Box’s test [79]. That statistic tests the null hypothesis that the variance-covariance matrices are the same in all groups. For our data the value of Box’s test is non-significant (p = .848), as shown in Table 6; hence, the covariance matrices are roughly equal and the assumption is tenable. The assumption of linearity refers to the presence of a straight-line relationship between the dependent variables. It is done separately for the TL and the TF projects. Scatter plots between the dependent variables do not show evidence of non-linearity; thus the assumption is satisfied. Multicollinearity and singularity assumption refers to the problems with a correlation matrix that occur when variables are highly correlated (.9 and above), and the variables are redundant (one of the variables is a combination of the other variables), respectively [77]. However, multicollinearity is not an issue, as the dependent variables are not highly correlated (Pearson correlation r = .24). Singularity is avoided due to the knowledge of what the
Table 5: Levene’s test of homogeneity1 DV BC M SIT 1
Levene Statistic .315 .082
df1 1 1
df2 17 17
Sig. .582 .779
Design: Intercept+DevMeth
21
Table 6: Box’s Test of Equality of Covariance Matrices1 Box’s M F df1 df2 Sig. 1
.927 .269 3 92265.543 .848
Design: Intercept+DevMeth
variables are, and how the scores are obtained. The assumption of homogeneity of regression slopes refers to the requirement that the relationship between the outcome and covariates be the same for both groups. In MANCOVA heterogeneity of regression implies that there is interaction between the independent variable and the covariates [77]. For MANCOVA, an overall test of homogeneity of regression is required, in addition to stepdown tests, as described by Tabachnick and Fidell [77]. The overall test of homogeneity of regression with two DVs (F = 1.38, p = .28), as well as step down tests with one DV each, i.e. M SIT (F = .42, p = .79) and BC (F = 2.99, p = .09), turned out to be non-significant. Hence, the assumption of homogeneity of regression has not been violated. After checking the assumptions, we may proceed to the interpretation of the effect of development method (DevM eth) on BC and M SIT MANOVA results (when covariates are not included), and then MANCOVA results (when covariates are included, i.e. if each participant had the same scores on the covariates), are presented in Section 5.3. 5.3. Multivariate analysis Table 7 shows the main table of results when covariates are not included. Multivariate test statistics Pillai’s trace, Wilk’s lambda, Hotelling’s trace, and Roy’s largest root are all identical when there are only two levels of a between-subjects independent variable [77] and, as shown in Table 7, nonsignificant (p = .58). Consequently, we may conclude that the employed development method had non-significant effect on the outcome (F (2, 16) = .56, p > .05; Wilks’ Lambda = .94; partial eta squared = .07). Investigating further, it seems reasonable to take into account the other variables (covariates), which are not part of the main experimental manipulation but have an influence on the dependent variables [79]. Therefore, experience based covariates (P rogExp, N onAcademicExp, JSP Exp) and 22
Effect
Intercept Wilks’ Lambda2 DevMeth Wilks’ Lambda2
Table 7: Multivariate tests (MANOVA)1 Value F Hypo- Error Sig. Partial thesis df Eta df Sq. .044
1743
2
16
.000
.956
.935
.5603
2
16
.582
.065
1
Design: Intercept+DevMeth In the two-group case, F values will be identical in all multivariate test statistics Pillai’s trace, Wilk’s lambda, Hotelling’s trace, and Roy’s largest root [77] 3 Exact statistic 2
pre-test results are included in the model. Again, the multivariate tests are not significant in the case of DevM eth (see Table 8), which leads to the conclusion that the effects of development method on dependent variables are still non-significant, even after adjusting for the effects of experience-based covariates, and pre-test results (F (2, 9) = .52, p > .05; Wilks’ Lambda = .90; partial eta squared = .10). The multivariate tests are significant in the case of JSP Exp, P rogExp, as well as the P reT estGrade3.5 dummy variable. Between-subjects effects are presented in Table 9. The significance values in Table 9 imply that neither DevM eth nor covariates significantly predict the dependent variables after the Bonferroni adjustment, which involves dividing the original alpha level of .05 by the number of analyses (in this case we have two dependent variables to investigate). Effect size, indicated by the corresponding partial eta squared value, is very small for BC and somewhat larger for M SIT . As a result, the development method DevM eth accounts for an extremely small proportion of the total variance in BC (only 0.3 percent), while 7.3 percent of the variance in M SIT can be explained by DevM eth. After including the covariates (P rogExp, JSP Exp, N onAcademicExp, P reT estGrade) into analysis, one may conclude that the statistically significant difference between the TL and the TF groups would unlikely be observed in practice in BC because of small effect size, while more likely to be observed in M SIT due to medium effect size, justifying further investigation. What is even more interesting is that the MANCOVA model is able to explain quite a large portion of the total variance in the dependent variables — 64 percent of the total variance in BC and 66 percent of the total variance in M SIT — mainly on the basis of the previous sub23
Table 8: Multivariate tests (MANCOVA) – analysis of selected projects with pre-test and experience-based covariates1 Effect Value F Hypo- Error Sig. Partial thesis df Eta df Sq. Intercept Wilks’ Lambda2 .264 12.5133 2.000 9.000 .003 .736 PreTestGrade3.5 Wilks’ Lambda2 .410 6.4703 2.000 9.000 .018 .590 PreTestGrade4.0 Wilks’ Lambda2 .785 1.2303 2.000 9.000 .337 .215 PreTestGrade4.5 Wilks’ Lambda2 .848 .8063 2.000 9.000 .476 .152 PreTestGrade5.0 Wilks’ Lambda2 .925 .3643 2.000 9.000 .705 .075 NonAcademicExp Wilks’ Lambda2 .860 .7303 2.000 9.000 .509 .140 ProgExp Wilks’ Lambda2 .506 4.3973 2.000 9.000 .047 .494 JSPExp Wilks’ Lambda2 .413 6.3903 2.000 9.000 .019 .587 DevMeth Wilks’ Lambda2 .896 .5223 2.000 9.000 .610 .104 1 Design: Intercept+PreTestGrade3.5+PreTestGrade4.0+PreTestGrade4.5+PreTestGrade5.0+ NonAcademicExp+ProgExp+JSPExp+DevMeth 2 Pillai’s trace, Wilk’s lambda, Hotelling’s trace, and Roy’s largest root are identical [77] 3 Exact statistic
jects’ experience and the pre-test results. The most effective are JSP Exp covariate (able to explain 23% of the variance in BC, and 35% of the variance in M SIT , according to the corresponding partial eta squared values) and P reT estGrade3.5 (able to explain 32% of the variance in BC, and 27% of the variance in M SIT ). However, it is worth mentioning that partial eta squared is an overestimate, though a consistent measure of the actual effect size [72]. 6. Validity evaluation When conducting an experiment, there is always a set of threats to the validity of the results. They are discussed on the basis of the list of threats by Cook and Campbell [53] and Wohlin et al. [30]. 24
Table 9: Test of between-subjects effects with pre-test and experience-based covariates Source DV Type III df Mean F Sig. Partial Sum of Sq. Eta Squares Sq. Corrected Model
BC M SIT
.2891 .1892
8 8
.036 .024
2.264 2.395
.113 .098
.644 .657
Intercept
BC M SIT
.250 .022
1 1
.250 .022
15.652 2.192
.003 .170
.610 .180
PreTest Grade3.5
BC M SIT
.074 .036
1 1
.074 .036
4.622 3.677
.057 .084
.316 .269
PreTest Grade4.0
BC M SIT
.032 .000
1 1
.032 .000
1.985 .035
.189 .856
.166 .003
PreTest Grade4.5
BC M SIT
.025 5,35E-5
1 1
.025 5,35E-005
1.541 .005
.243 .943
.134 .001
PreTest Grade5.0
BC M SIT
.006 .001
1 1
.006 .001
.369 .117
.557 .739
.036 .012
NonAcademicExp
BC M SIT
.026 .002
1 1
.026 .002
1.620 .250
.232 .628
.139 .024
ProgExp
BC M SIT
.040 .031
1 1
.040 .031
2.529 3.108
.143 .108
.202 .237
JSPExp
BC M SIT
.047 .052
1 1
.047 .052
2.975 5.305
.115 .044
.229 .347
DevMeth
BC M SIT
.000 .008
1 1
.000 .008
.030 .790
.865 .395
.003 .073
Error
BC M SIT
.159 .099
10 10
.016 .010
Total
BC M SIT
7.310 3.180
19 19
Corrected Total
BC M SIT
.448 .288
18 18
1 2
R Squared = .644 R Squared = .657
25
Threats to the statistical conclusion validity are concerned with issues that can lead to incorrect conclusions about the relations between the treatment and the outcome of the experiment (e.g. choice of statistical tests, tools and samples sizes [30]). Robust statistical techniques and tools (e.g. SPSS) were used but limited statistical power is a threat, as shown in Section 4.8. In particular, it is possible that the “non-significant” results are due to lack of power. Fortunately, effect size estimations provide a valuable (and much less affected by sample size than statistical significance) measure of the magnitude of a treatment effect. The assumptions of the multivariate analysis have been thoroughly checked (see Section 5.2). However, the selection of covariates to include in the analysis is not specified on the basis of the data from previous similar experiments, since there were no such experiments whatsoever. MANCOVA was used, instead of multiple ANCOVAs, to protect against the inflation in the family-wise error rate. A risk that the variation due to random heterogeneity of subjects is larger than that due to the treatment, was minimized with the help of covariates. Moreover, the heterogeneity was reduced because all the subjects were graduate MSc students. Treatment implementation is considered reliable, since it was as standard as possible over different subjects. Random irrelevancies in the experimental setting were controlled via regular meetings and investigated by post-test questionnaires. The internal validity of the experiment concerns the true causes of the outcomes observed in the study (i.e. whether the effect is caused by the independent variables or by other factors). Random assignment rules out most threats to internal validity, but not all [53]. The selection-history interaction is not threatening, as only one treatment was applied to each object during the experimental task. Also, there is no reason to expect strong selectionmaturation interaction (i.e. very different rates of “maturation” or change). However, it is possible that the considered groups matured a bit differently. For example, the TF technique was considered more difficult and the subjects might have been more tired. In the pre-test questionnaire, 8 subjects (42.1%) strongly agreed, 7 subjects (36.8%) agreed, 1 subject (5.3%) disagreed, and 1 subject (5.3%) strongly disagreed with the statement that “the TF development method is more difficult than TL”, while 2 subjects (10.5%) sat on the fence. Also, in the post-test questionnaire, 9 subjects (47.4%) strongly agreed, 2 subjects (10.5%) agreed, 4 subjects (21.1%) disagreed, and 1 subject (5.3%) strongly disagreed with the statement “the TF development method is difficult”, while 3 subjects (15.8%) were neutral. In26
ternal validity threat can be due to the fatigue effect. Software engineering students are accustomed and prepared to work on 15-weeks’ (or sometimes even longer) projects. However, there is a need for a trade-off between the aforementioned fatigue effect and the threat coming from the fact that the training and experimental task periods would be too short. A shorter training period would result in a situation in which subjects might be overburdened by the level of difficulty and the unfamiliar character of the task [47]. A shorter experimental task period would reduce external validity. Longer training and experimental tasks would cause a fatigue effect. Concerning the internal validity, the risk of compensatory rivalry (also called the John Henry effect) or resentful demoralization of subjects receiving less desirable treatment must be considered. The group using TL may do their best to show that the classical method is competitive. On the other hand, subjects receiving less desirable treatment may not perform as well as they generally do. In order to reduce the aforementioned risk, both treatments required testing, refactoring etc. as described in Section 3.1. Informal interviews with the subjects conducted in the course of the experiment indicate that this risk is small. Preventing possible diffusion or imitation of treatments is not an easy task. Shadish et al. [80] suggest separating the two treatment conditions as much as possible, either geographically or by using different practitioners in each. The latter was the case applied during this experiment. Another possibility is to provide ongoing reminders to subjects about the need not to imitate other treatments [81]. Such reminders were given in a regular manner in the course of the experiment. To monitor the extent to which the imitation of treatment occurred, the ActivitySensor plugin reports were used. Moreover, conversational interviews with the subjects were conducted to prevent the threat from reaching a level that would seriously undermine the validity of the experiment. To check whether subjects produced their code independently, JPlag (a plagiarism detection tool) [82] was employed during the project but plagiarism was not detected. Compensatory equalization of treatments was not given and thus has not affected the outcome. It is interesting that some of these threats (e.g. compensatory rivalry, resentful demoralization, diffusion of treatments, compensatory equalization) were classified as threats to internal validity by Cook and Campbell [53], and Wohlin et al. [30], while by Shadish et al. [80] — as the threats to construct validity. Threats to construct validity concern the extent to which measures accurately reflect the theoretical concepts they are intended to measure. The 27
mono-operation bias is a threat, as the experiment was conducted on a single software development project. To reduce mono-operation bias, two outcome measures of treatment were examined [80]. Furthermore, it turned out that the numbers of unit tests written in the TL projects (M = 134, SD = 95) and the TF projects (M = 136, SD = 72) were similar, however, the standard deviation in the TL projects was higher than in the TF projects. Hence, there was greater uncertainty in the TL projects. Using a single type of observation is a mono-method bias threat. To reduce mono-method threats, the post-test questionnaire was added, to enable qualitative validation of the results. For example, in the post-test questionnaire 8 subjects (42.1%) strongly agreed, while 9 subjects (47.4%) agreed with the statement that “TF leads to better code coverage”. On the other hand, only 1 subject (5.3%) strongly disagreed with the statement, and 1 subject (5.3%) sat on the fence. Also, in the post-test questionnaire 3 subjects (15.8%) strongly agreed, while 4 subjects (21.1%) agreed with the statement “TF leads to better quality of tests”. On the other hand, 4 subjects (21.1%) disagreed, and 2 subjects (10.5%) strongly disagreed with the statement, while 6 subjects (31.6%) were neutral. There seems to be no apparent contradiction between qualitative and quantitative results. However, qualitative results suggested more obvious difference in code coverage levels between the TF and the TL techniques. Furthermore, the validity of the subjects’ opinions concerning the differences between TF and TL must be considered within the context of the limitations of the study (e.g., limited training time). Justifications, as well as limitations of BC and M SI, were given when discussing dependent variables in Sections 3.2 and 3.3, respectively. In this experiment, the concept of programmer expertise was operationally defined by covariates presented in Section 4.2. The pre-test measure reflects programmer expertise but clearly does not cover all the aspects of expertise that can influence the outcome of the subjects. Therefore, experience-based measures were also taken into account. Interaction of different treatments is limited due to the fact that the subjects were involved in one study only. Other threats to construct validity are social threats (e.g. hypothesis guessing and experimenter expectancies). As neither the subjects nor the experimenters have any interest in favour of one technique or another, we do not expect it to be a large threat. As with most empirical studies in software engineering, an important threat is the process conformance represented by the level of conformance of the subjects to the prescribed techniques. Process conformance is a threat to statistical conclusion validity, through 28
the variance in the way the processes are actually carried out, and also to construct validity, through possible discrepancies between the processes as prescribed and the processes as carried out [83]. Unfortunately, this threat is often neglected in experimentation in software engineering, even though this is a serious threat, especially in the case of the TF programming practice, which can be difficult to follow. Wang and Erdogmus [84], Madeyski and Szala [35], as well and M¨ uller and H¨ofer [85] raised the issue of process conformance in the context of the TF experimentation recently. Process conformance threat was addressed by taking several precautions. The subjects were informed of the importance of following the assigned procedures. Regular meetings and discussions about various details or problems related to the assigned development techniques were held to avoid possible deviations. In the post-test questionnaire, the subjects were asked how strongly they agree with process conformance with intention to exclude those who disagreed. Also, a formal criterion to gauge conformance in the experiment group was applied: the TF subjects who did not write enough tests to achieve at least 1 : 2 ratio of non-commented lines of the test code (T estLOC) to non-commented lines of the production code (P roductionLOC) were deemed not consistent with an expert application of TF. Some practitioners suggest that the test code should be written in about the same amount as the production code to be consistent with an expert application of the TF technique. This rule, cited as an anecdotal opinion by Williams et al. [5], was followed during the course of the experiment (see Table 1). The ratio T estLOC : P roductionLOC = 50123 : 59359, obtained in the experiment, is even higher than reported by some TF studies performed in industry. For example, 34KLOC : 64.6KLOC was achieved in the TF study at IBM reported by Williams et al. [5], while the average ratio across all ten releases was .61 as reported by Sanchez et al. [9]. Moreover, the ActivitySensor plugin, integrated with Eclipse IDE, collected programmers’ activities and enabled further analysis how development techniques were carried out (e.g. whether tests were written before or after related pieces of a production code). The primary objective of the plugin is to monitor developer’s activities related to writing production code and tests, performed refactorings and unit test executions. Each developer’s activity is characterized by many parameters: start and end time of the activity, type of the activity (typing, refactoring, test execution), related artefact, that is its name, type (e.g. class, interface, method), file path etc. Refactoring type and test execution result are collected as well. After a detailed analysis of 29
the subjects’ activities gathered by the ActivitySensor plugin, with the help of a developer with recent industrial and TF experience, it was possible to exclude from analysis three subjects who showed serious deviations from the prescribed TF technique. The subjects were excluded because they wrote tests after rather than before related pieces of a production code, while the objective was to compare the TL technique with TF (not a mix of both techniques). As a result, the presented analysis was run with the subjects involved in the 19 projects conducted by 10 TL programmers and 9 TF programmers. An example of a symptom that the subject violated the TF process is presented in Table 10. According to Wang and Erdogmus [84], who formally defined programming cycles, a single programming cycle involves writing unit tests, production code, and ends with execution of tests. Precedence metric (PM) is the number of programming cycles in which the latest modified resource, before execution of tests, was production code minus the number of programming cycles in which the latest modified resource (before execution of tests) was test. Precedence metric changes were calculated automatically on the basis of the ActivitySensor logs to draw the TF expert’s attention to the specific activities and subjects, supporting analysis. The variance in the way the processes are actually carried out may also come from the possibility that “poor” students did not apply as many refactorings as “bright” students, or that all the students did not apply the same number or the same set of refactorings, simply because of time pressure. However, the difference in the number of performed refactorings supported by Eclipse (and gathered by means of the ActivitySensor plugin) between the TF and the TL groups is not statistically significant (t(17) = 1.04, p = .31, r = .24). Furthermore, the difference in the number of varying types of per-
no. 1 2 3 4 5 6 7 8
Table 10: Development process analysis - an example Precedence Comments Activity description Metric (PM) Modified tests 0 Modified production code 0 Tests execution 1 Modified production code 1 Tests execution 2 Modified production code 2 Modified tests 2 Symptom of TF Tests execution 1 process violation
30
formed refactorings between the TF and the TL groups is not statistically significant either (t(17) = −.07, p = .95, r = .02). Also, user stories are of varying complexities and could have been handled by subjects in different orders. However, people-oriented processes, and the eXtreme Programming methodology in particular, assume that developers must be able to make all the technical decisions [86] (e.g., concerning the order in which functionalities, accepted for the current iteration, should be implemented). External validity refers to the generalization of research findings, either from a sample to a larger population or to settings and populations other than those studied. The largest threat stems from the fact that the subjects were students who had little experience in the assigned development techniques. Their experience in JUnit testing framework was over 6 months on average. Consequently, the results of this study might be a conservative measure of the effects of TF, since the subjects had probably not reached their maximum level of efficiency. To minimize this threat, the 6-week preparation phase of the experiment preceded the main experimental task (see Section 4.7). The differences between novice developers and the most skilled developers are reported by Arisholm and Sjøberg [87]. On the other hand, similar improvement trends were identified among freshmen students, graduate students and professionals [45]. The dispersion was larger in the freshmen group, and graduate students did the tasks in a significantly shorter time than freshmen students. Host et al. [46] also found that students may be relevant as subjects in empirical software engineering research [46]. Further arguments why it is acceptable to use students as subjects are given by Tichy [47] and Kitchenham et al. [48]. Tichy argues that students are acceptable when used to establish a trend. An important argument given by Tichy is that when an empirical study compares two methods to see which is better, then if one method has a clear relative advantage over the other with students as subjects, it may be argued that there will be a difference in the same direction (although perhaps of a different magnitude) for professionals. Furthermore, student subjects are useful to eliminate alternative hypotheses, as it is almost impossible to find professional subjects if there is no evidence of difference between the compared methods. Tichy maintains that it is unlikely that a large effect will surprisingly appear in a professional setting if it is absent in an academic environment. Hence, results with students help the community to get better understanding of the compared methods and to focus on the most promising approaches. In fact, the empirical studies with students are a prerequisite for getting professionals to participate. Fur31
thermore, software engineering students are technically up to date and much closer to the world of software professionals than, for example, psychology students are to the general population [47]. Kitchenham et al. [48] also state that students are the next generation of software professionals and thus, are relatively close to the population of interest. Moreover, TF is a rather new development practice and long-term experience in TF is rare, even in industry. The experimental systems in this experiment were rather small, 5KLOC on average, as shown in Table 1, compared with industrial object-oriented software systems, but probably much larger than usually developed as a result of experiments in software engineering. Moreover, programming time measured in Eclipse development environment by means of the ActivitySensor plugin was 77 hours on average. Nevertheless, it is possible that the effects of TF programming would have been different in more complex and longer projects. The interaction of setting and treatment was reduced by making the experimental setting and material as realistic and close to the industrial one as possible. Furthermore, interaction of selection and treatment is limited, because all of the subjects were software engineering graduate students. 7. Discussion, conclusions and future work To the author’s knowledge, the conducted experiment includes the firstever evaluation of the impact of TF programming on mutation score indicator of unit tests. The goal was to shed new light on the effects of TF from a different, test code perspective. Additionally, code coverage was measured to get a more complete picture of the experimental manipulation. Branch coverage and mutation score indicator were examined to get some insights how thoroughly unit tests exercise programs, and how effective they are, respectively. MANCOVA helped to exert stricter experimental control by taking confounding variables into account and reducing pre-existing differences among the subjects to give a purer measure of the effect of the experimental manipulation. The main result of this study is that the TF programming practice, used instead of the classic TL technique, does not significantly affect branch coverage and mutation score indicator, even if we control for the pre-test results, the subjects experience, and when the subjects who showed serious deviations from the prescribed programming techniques are excluded from the analysis. However, the validity of the results must be considered within 32
the context of the limitations discussed in the validity evaluation section (e.g. limited power). An interesting finding is that the development method (TL or TF) as an explanatory variable accounts for a rather small proportion of the total variance in the dependent variables. Therefore, in future experiments it might be reasonable to take account of variables that are not part of the main experimental manipulation but have an influence on dependent variables (e.g. characteristics of subjects) with the help of the analysis of covariance, or to reduce the variation in scores due to random differences between subjects by means of the repeated-measures experimental design. For the impact of TF on branch coverage, effect sizes can be compared across previously conducted experiments [15, 18] mentioned in Section 2, including the experiment presented in this paper. Unfortunately, not all of the studies presented in Section 2 and summarized in [34] provide enough details to calculate effect size [16]. Effect size determination program by Wilson (the co-author of [88]) has been used. The program calculated an effect size measure r (based on provided p-values and degrees of freedom df ) that can be interpreted consistently for all studies. The effect sizes calculated for the aforementioned studies [15, 18] are r = −.17 and r = −.04, respectively. Both effect sizes are considered small, according to guidelines for empirical studies in software engineering given by Kempenes et al. [89]. The effect size estimate, reported in this paper in Section 5.3, is small as well (only 0.3 percent of the variance in BC can be explained by DevM eth). Therefore, we may conclude that the effect sizes are consistent and small across the empirical studies. It means that the difference in branch coverage created by the TF development method was a small, and therefore unsubstantial, effect. For the impact of TF on mutation score indicator, effect sizes can not be compared across studies, because it is the first experimental evaluation of the impact of TF on mutation score indicator of unit tests. However, preliminary empirical evidence on the impact of TF on mutation score indicator, presented in this paper, suggests that the effect size can be higher, because 7.3 percent of the variance in M SIT can be explained by DevM eth, as reported in Section 5.3. Therefore, the difference in mutation score indicator, rather than branch coverage, between the TL and the TF groups is more likely to be observed in practice and, therefore, it is worth further investigation. We are far from being able to explain why we do not observe the positive effects of TF (e.g. significantly higher mutation score indicator), as the presented experimental evaluation is, to the author’s knowledge, among 33
the earliest in the field. A considerable effort has been made to exclude deviations from the prescribed techniques as a possible explanation of the obtained results. However, the above attempt to explain the results could be considered superficial and there is a need for a more precise definition and description of the TF and the TL techniques, and, consequently, automatic detection of possible discrepancies from the aforementioned techniques. The first explanation of the obtained results is that pre-existing differences between subjects are more important predictors of the outcome than the development technique. This explanation is supported by the obtained results (e.g. partial eta squared values of covariates were much higher than those of development method). In fact, covariates explained a large part of the variance in the dependent variables. The pre-existing differences theory is also consistent with the claim, cited by Maxwell and Delaney [50], that most researchers in the behavioural sciences today expect that individual differences between subjects are at least as important a predictor of the outcome as any treatment variable. However, an alternative explanation is also possible. It turned out that the TF group had increased the maximum value and, consequently, the variation of the dependent variables. That may be explained by the relative difficulty of the TF technique that can be overcome only by few (perhaps more skilful) subjects and only these subjects would benefit from TF. Therefore, more experienced and skilful students or professionals could potentially achieve more substantial improvements. It is consistent with the conclusions by Erdogmus et al. [17]. Consequently, the positive effects of TF can be masked, to some extent, by the relative difficulty of the technique. This explanation is supported by the subjects’ responses concerning the difficulty of the TF technique (responses were collected by means of the pre-test and post-test questionnaires and presented in Section 6). The mechanism of relative difficulty can explain not only the increase in the variation and maximum value of the dependent variables, but also why the development method (as an explanatory variable) accounts for so small a proportion of the total variance in the dependent variables. The relative difficulty theory is preliminary and superficial at best. Therefore, it has to be empirically tested in future experiments (e.g. with the help of repeated-measures experimental design that reduces the unsystematic variability and so provides greater power to detect effects). By doing this, it is possible to reduce the variation in scores between conditions, which is due to random differences between subjects in both groups. 34
In reflecting upon the impact of covariates on the dependent variables, it would be difficult to overemphasize the importance of experience. Experience in JSP web applications technology (JSP Exp) can explain a large portion of total variance in dependent variables. It may be a valuable finding that may be used in practice (e.g. while hiring new developers), as pre-test results are not always available. A plausible explanation of the importance of JSP Exp is that this covariate is the most closely related to the technology domain. It is in line with common sense that developers who have longer experience in the technology used in the course of the project tend to write unit tests which are more effective in finding faults and cover the production code more thoroughly. The pre-test result is another influential covariate typically used in the analysis of covariance because it generally correlates with the score after treatment [72]. By adjusting for the effects due to the covariates, the error variance was reduced. With respect to experimental methodology, it has been found very useful to start with the pre-study to check the infrastructure and the instrumentation of the experiment. However, the study can benefit from several improvements before replication is attempted. The most significant one is securing a sample of large enough size to guarantee a high-power design. Additional improvements stem from the fact that even more sophisticated tools and measures could be used if limitations of the existing measurement tools, presented in Sections 3.2 and 3.3, were addressed. Moreover, further experimentation in different contexts (e.g. in industry) is needed to establish evidence-based recommendations for the impact of test-first programming practice on code coverage and mutation score indicator of unit tests. The raw data for all the tests presented in the paper are available from the author [90]. Acknowledgements The author expresses his gratitude to the students participating in the experiment, as well as his MSc students Adam Piechowiak (the lead developer of the ActivitySensor plugin), Lukasz Szala, Michal Glowacki, Piotr Papala, and especially Norbert Radyk (the lead developer of the Judy mutation testing tool) for their help in preparing the measurement instruments, collecting data and support. The author also would like to thank Malgorzata Bogdan and Andy Field for helpful suggestions concerning statistical analysis.
35
References [1] K. Beck, C. Andres, Extreme Programming Explained: Change, 2nd Edition, Addison-Wesley, 2004.
Embrace
[2] K. Beck, Test Driven Development: By Example, Addison-Wesley, 2002. [3] L. Koskela, Test Driven: Practical TDD and Acceptance TDD for Java Developers, Manning Publications, 2007. [4] D. Astels, Test Driven development: A Practical Guide, Prentice Hall Professional Technical Reference, 2003. [5] L. Williams, E. M. Maximilien, M. Vouk, Test-Driven Development as a Defect-Reduction Practice, in: ISSRE ’03: Proceedings of the 14th International Symposium on Software Reliability Engineering, IEEE Computer Society, Washington, DC, USA, 2003, pp. 34–48. [6] E. M. Maximilien, L. A. Williams, Assessing Test-Driven Development at IBM, in: ICSE ’03: Proceedings of the 25th International Conference on Software Engineering, IEEE Computer Society, 2003, pp. 564–569. [7] G. Canfora, A. Cimitile, F. Garcia, M. Piattini, C. A. Visaggio, Evaluating advantages of test driven development: a controlled experiment with professionals, in: ISESE ’06: Proceedings of the 2006 ACM/IEEE International Symposium on Empirical Software Engineering, ACM Press, New York, NY, USA, 2006, pp. 364–371. [8] T. Bhat, N. Nagappan, Evaluating the efficacy of test-driven development: industrial case studies, in: ISESE ’06: Proceedings of the 2006 ACM/IEEE International Symposium on Empirical Software Engineering, ACM Press, New York, NY, USA, 2006, pp. 356–363. [9] J. C. Sanchez, L. Williams, E. M. Maximilien, On the sustained use of a test-driven development practice at ibm, in: AGILE ’07: Proceedings of the 2007 Conference on Agile Software Development, IEEE Computer Society, Washington, DC, USA, 2007, pp. 5–14. [10] N. Nagappan, E. M. Maximilien, T. Bhat, L. Williams, Realizing quality improvement through test driven development: results and experiences of four industrial teams, Empirical Software Engineering 13 (3). 36
[11] D. Janzen, H. Saiedian, Does Test-Driven Development Really Improve Software Design Quality?, IEEE Software 25 (2) (March–April 2008) 77–84. [12] S. H. Edwards, Rethinking computer science education from a test-first perspective, in: OOPSLA ’03: Companion of the 18th Annual ACM SIGPLAN Conference on Object-Oriented Programming, Systems, Languages, and Applications, ACM, New York, NY, USA, 2003, pp. 148– 155. [13] S. H. Edwards, Teaching software testing: automatic grading meets testfirst coding, in: OOPSLA ’03: Companion of the 18th Annual ACM SIGPLAN Conference on Object-Oriented Programming, Systems, Languages, and Applications, ACM, New York, NY, USA, 2003, pp. 318– 319. [14] Grigori Melnik and Frank Maurer, A cross-program investigation of students’ perceptions of agile methods, in: ICSE ’05: Proceedings of the 27th International Conference on Software Engineering, 2005, pp. 481– 488. [15] M. M. M¨ uller, O. Hagner, Experiment about test-first programming, IEE Procedings-Software 149 (5) (2002) 131–136. [16] M. Panˇcur, M. Ciglariˇc, M. Trampuˇs, T. Vidmar, Towards empirical evaluation of test-driven development in a university environment, in: EUROCON ’03: Proceedings of the International Conference on Computer as a Tool, 2003, pp. 83–86. [17] H. Erdogmus, M. Morisio, M. Torchiano, On the Effectiveness of the Test-First Approach to Programming, IEEE Transactions on Software Engineering 31 (3) (2005) 226–237. [18] T. Flohr, T. Schneider, Lessons Learned from an XP Experiment with Students: Test-First Need More Teachings, in: J. M¨ unch, M. Vierimaa (Eds.), Product Focused Software Process Improvement, Vol. 4034 of Lecture Notes in Computer Science, Springer, Berlin, Heidelberg, 2006, pp. 305–318. [19] L. Madeyski, Preliminary Analysis of the Effects of Pair Programming and Test-Driven Development on the External Code Quality, in: 37
K. Zieli´ nski, T. Szmuc (Eds.), Software Engineering: Evolution and Emerging Technologies, Vol. 130 of Frontiers in Artificial Intelligence and Applications, IOS Press, 2005, pp. 113–123. URL http://madeyski.e-informatyka.pl/download/Madeyski05b. pdf [20] L. Madeyski, The Impact of Pair Programming and Test-Driven Development on Package Dependencies in Object-Oriented Design – An Experiment, in: J. M¨ unch, M. Vierimaa (Eds.), Product Focused Software Process Improvement, Vol. 4034 of Lecture Notes in Computer Science, Springer, Berlin, Heidelberg, 2006, pp. 278–289, http://madeyski.einformatyka.pl/download/Madeyski06.pdf. [21] A. Gupta, P. Jalote, An experimental evaluation of the effectiveness and efficiency of the test driven development, in: ESEM ’07: Proceedings of the First International Symposium on Empirical Software Engineering and Measurement, IEEE Computer Society, Washington, DC, USA, 2007, pp. 285–294. [22] L. Huang, M. Holcombe, Empirical investigation towards the effectiveness of Test First programming, Information and Software Technology 51 (1) (2009) 182–194. [23] R. E. Jeffries, A. Anderson, C. Hendrickson, Extreme Programming Installed, Addison-Wesley Longman Publishing Co., Inc., Boston, MA, USA, 2000. [24] S. Ambler, Introduction to Test Driven Design (TDD) (Accessed 2008). URL http://www.agiledata.org/essays/tdd.html [25] B. Mattu, R. Shankar, Test driven design methodology for componentbased system, in: 1st Annual IEEE Systems Conference, 2007, pp. 1–7. [26] B. Marick, How to Misuse Code Coverage, in: Proceedings of the 16th International Conference on Testing Computer Software, Washington, USA, 1999. URL http://www.exampler.com/testing-com/writings/coverage. pdf [27] P. J. Walsh, A Measure of Test Case Completeness, Ph.D. thesis, Univ. New York (1985). 38
[28] P. G. Frankl, S. N. Weiss, C. Hu, All-Uses vs Mutation Testing: An Experimental Comparison of Effectiveness, Journal of Systems and Software 38 (3) (1997) 235–253. [29] A. J. Offutt, J. Pan, K. Tewary, T. Zhang, An Experimental Evaluation of Data Flow and Mutation Testing, Software Practice and Experience 26 (2) (1996) 165–176. [30] C. Wohlin, P. Runeson, M. H¨ost, M. C. Ohlsson, B. Regnell, A. Wessl´en, Experimentation in Software Engineering: An Introduction, Kluwer Academic Publishers, Norwell, MA, USA, 2000. [31] C. Robson, Real World Research: A Resource for Social Scientists and Practitioner-Researchers, Blackwell Publishing Limited, 2002. [32] B. W. Boehm, A Spiral Model of Software Development and Enhancement, IEEE Computer 21 (5) (1988) 61–72. [33] IEEE standard for software unit testing, ANSI/IEEE Std 1008-1987. [34] L. Madeyski, Empirical studies on the impact of test-first programming, Technical Report I32/09/, Wroclaw University of Technology, Institute of Informatics (2009). URL http://madeyski.e-informatyka.pl/download/ Madeyski09TFStudies.pdf [35] L. Madeyski, L. Szala, The Impact of Test-Driven Development on Software Development Productivity – An Empirical Study, in: P. Abrahamsson, N. Baddoo, T. Margaria, R. Messnarz (Eds.), Software Process Improvement, Vol. 4764 of Lecture Notes in Computer Science, Springer, 2007, pp. 200–211, http://madeyski.einformatyka.pl/download/Madeyski07d.pdf. [36] R. A. Ynchausti, Integrating Unit Testing Into A Software Development Team’s Process, in: M. Marchesi, G. Succi (Eds.), XP 2001: Proceedings of the 2nd International Conference on Extreme Programming and Flexible Processes in Software Engineering, Sardinia, Italy, 2001, pp. 84–87.
39
[37] B. George, L. Williams, An initial investigation of test driven development in industry, in: SAC ’03: Proceedings of the 2003 ACM symposium on Applied computing, ACM, New York, NY, USA, 2003, pp. 1135–1139. [38] B. George, L. A. Williams, A structured experiment of test-driven development, Information and Software Technology 46 (5) (2004) 337–342. [39] A. Geras, M. R. Smith, J. Miller, A Prototype Empirical Evaluation of Test Driven Development, in: IEEE METRICS’2004: Proceedings of the 10th IEEE International Software Metrics Symposium, IEEE Computer Society, 2004, pp. 405–416. [40] L.-O. Damm, L. Lundberg, Results from introducing component-level test automation and Test-Driven Development, Journal of Systems and Software 79 (7) (2006) 1001–1014. [41] L.-O. Damm, L. Lundberg, Quality impact of introducing componentlevel test automation and test-driven development, in: P. Abrahamsson, N. Baddoo, T. Margaria, R. Messnarz (Eds.), Software Process Improvement, Vol. 4764 of Lecture Notes in Computer Science, Springer, 2007, pp. 187–199. [42] P. Abrahamsson, A. Hanhineva, J. J¨aa¨linoja, Improving business agility through technical solutions: A case study on test-driven development in mobile software development, in: R. Baskerville, L. Mathiassen, J. PriesHeje, J. I. DeGross (Eds.), Proceedings of the IFIP TC8 WG 8.6 International Working Conference on Business Agility and Information Technology Diffusion, Vol. 180 of IFIP International Federation for Information Processing, Springer, 2005, pp. 1–17. [43] M. Siniaalto, P. Abrahamsson, A Comparative Case Study on the Impact of Test-Driven Development on Program Design and Test Coverage, in: ESEM ’07: Proceedings of the First International Symposium on Empirical Software Engineering and Measurement, IEEE Computer Society, 2007, pp. 275–284. [44] M. M. M¨ uller, The Effect of Test-Driven Development on Program Code, in: XP ’06: Extreme Programming and Agile Processes in Software Engineering, 7th International Conference, XP 2006, Oulu, Finland, June 17-22, 2006, Springer, 2006, pp. 94–103. 40
[45] P. Runeson, Using students as Experiment Subjects - An Analysis of Graduate and Freshmen Student Data, in: EASE ’03: Proceedings of 7th International Conference on Empirical Assessment and Evaluation in Software Engineering, British Computer Society, 2003, pp. 95–102. [46] M. H¨ost, B. Regnell, C. Wohlin, Using Students as Subjects — A Comparative Study of Students and Professionals in Lead-Time Impact Assessment, Empirical Software Engineering 5 (3) (2000) 201–214. [47] W. F. Tichy, Hints for Reviewing Empirical Work in Software Engineering, Empirical Software Engineering 5 (4) (2000) 309–312. [48] B. Kitchenham, S. L. Pfleeger, L. Pickard, P. Jones, D. C. Hoaglin, K. E. Emam, J. Rosenberg, Preliminary Guidelines for Empirical Research in Software Engineering, IEEE Transactions on Software Engineering 28 (8) (2002) 721–734. [49] R. Jeffries, G. Melnik, Guest Editors’ Introduction: TDD–The Art of Fearless Programming, IEEE Software 24 (3) (2007) 24–30. [50] S. E. Maxwell, H. D. Delaney, Designing Experiments and Analyzing Data: A Model Comparison Perspective, 2nd Edition, Lawrence Erlbaum, Mahwah, 2004. [51] L. Madeyski, On the Effects of Pair Programming on Thoroughness and Fault-Finding Effectiveness of Unit Tests, in: J. M¨ unch, P. Abrahamsson (Eds.), Product Focused Software Process Improvement, Vol. 4589 of Lecture Notes in Computer Science, Springer, 2007, pp. 207–221, http://madeyski.e-informatyka.pl/download/Madeyski07.pdf. [52] L. Madeyski, The Impact of Pair Programming on Thoroughness and Fault Detection Effectiveness of Unit Tests Suites, Wiley, Software Process: Improvement and Practice 13 (3) (2008) 281–295, http://madeyski.e-informatyka.pl/download/Madeyski08.pdf. [53] T. D. Cook, D. T. Campbell, Quasi-Experimentation: Design and Analysis Issues, Houghton Mifflin Company, 1979. [54] M. Fowler, K. Beck, J. Brant, W. Opdyke, D. Roberts, Refactoring: Improving the Design of Existing Code, Addison-Wesley, 1999.
41
[55] E. Gamma, K. Beck, JUnit (Accessed 2006). URL http://www.junit.org/ [56] V. Massol and T. Husted, JUnit in Action, 1st Edition, Manning Publications, 2003. [57] P. Hamill, Unit test frameworks, O’Reilly, 2004. [58] S. Cornett, Code Coverage Analysis (Accessed 2007). URL http://www.bullseye.com/coverage.html [59] Atlassian Pty Ltd, Clover project (Accessed 2008). URL http://www.atlassian.com/software/clover/ [60] R. A. DeMillo, R. J. Lipton, F. G. Sayward, Hints on Test Data Selection: Help for the Practicing Programmer, IEEE Computer 11 (4) (1978) 34–41. [61] R. G. Hamlet, Testing Programs with the Aid of a Compiler, IEEE Transactions on Software Engineering 3 (4) (1977) 279–290. [62] H. Zhu, P. A. V. Hall, J. H. R. May, Software Unit Test Coverage and Adequacy, ACM Computing Surveys 29 (4) (1997) 366–427. [63] A. J. Offutt, R. H. Untch, Mutation testing for the new century, Kluwer Academic Publishers, Norwell, MA, USA, 2001, Ch. Mutation 2000: Uniting the Orthogonal, pp. 34–44. [64] N. Radyk, L. Madeyski, Judy – Mutation Testing Tool for Java (Accessed 2009), http://www.einformatyka.pl/sens/Wiki.jsp?page=Projects.Judy. URL http://madeyski.e-informatyka.pl/download/tools/judy/ judy-0.1.zip [65] Ant project (Accessed 2006). URL http://ant.apache.org/ [66] A. J. Offutt, A. Lee, G. Rothermel, R. H. Untch, C. Zapf, An Experimental Determination of Sufficient Mutant Operators, ACM Transactions on Software Engineering and Methodology 5 (2) (1996) 99–118.
42
[67] P. Ammann, J. Offutt, Introduction to Software Testing, Cambridge University Press, Cambridge, UK, 2008. [68] Y.-S. Ma, Y.-R. Kwon, J. Offutt, Inter-Class Mutation Operators for Java, in: ISSRE ’02: Proceedings of the 13th International Symposium on Software Reliability Engineering (ISSRE’02), IEEE Computer Society, Washington, DC, USA, 2002, pp. 352–363. [69] Y.-S. Ma, M. J. Harrold, Y.-R. Kwon, Evaluation of Mutation Testing for Object-Oriented Programs, in: ICSE ’06: Proceeding of the 28th International Conference on Software Engineering, ACM Press, New York, NY, USA, 2006, pp. 869–872. [70] M. H¨ost, , C. Wohlin, T. Thelin, Experimental Context Classification: Incentives and Experience of Subjects, in: ICSE ’05: Proceedings of the 27th International Conference on Software Engineering, ACM Press, New York, NY, USA, 2005, pp. 470–478. [71] D. Howitt, D. Cramer, Introduction to SPSS in Psychology, 4th Edition, Pearson Education Limited, 2008. [72] J. P. Stevens, Applied Multivariate Statistics for the Social Sciences, 4th Edition, Lawrence Erlbaum, Mahwah, 2002. [73] G. Seshadri, Understanding JavaServer Pages Model 2 architecture – Exploring the MVC design pattern (1999). URL http://www.javaworld.com/javaworld/jw-12-1999/ jw-12-ssj-jspmvc.html [74] Cactus project (Accessed 2006). URL http://jakarta.apache.org/cactus/ [75] L. Madeyski, M. Stochmialek, Architectural Design of Modern Web Applications, Foundations of Computing and Decision Sciences Journal 30 (1) (2005) 49–60. URL http://madeyski.e-informatyka.pl/download/23.pdf [76] L. Williams, A. Shukla, A. I. Ant´on, An Initial Exploration of the Relationship Between Pair Programming and Brooks’ Law, in: ADC ’04: Proceedings of the Agile Development Conference (ADC’04), IEEE Computer Society, Washington, DC, USA, 2004, pp. 11–20. 43
[77] B. G. Tabachnick, L. S. Fidell, Using Multivariate Statistics, 5th Edition, Allyn & Bacon, Inc., Needham Heights, MA, USA, 2006. [78] American Psychological Association, Publication manual of the American Psychological Association, 5th Edition, American Psychological Association, Washington, DC, USA, 2001. [79] A. Field, Discovering Statistics Using SPSS, SAGE Publications, 2005. [80] W. R. Shadish, T. D. Cook, D. T. Campbell, Experimental and QuasiExperimental Designs for Generalized Causal Inference, Houghton Mifflin, 2002. [81] A. Rubin, E. R. Babbie, Research Methods for Social Work, 5th Edition, Wadsworth Publishing, 2004. [82] L. Prechelt, G. Malpohl, M. Phlippsen, Finding Plagiarisms among a Set of Programs with JPlag, Journal of Universal Computer Science 8 (11) (2002) 1016–1038. URL http://www2.informatik.uni-erlangen.de/Forschung/ Publikationen/download/jplag.pdf [83] L. S. Sørumg˚ ard, Verification of Process Conformance in Empirical Studies of Software Development, Ph.D. thesis, The Norwegian University of Science and Technology (February 1997). URL http://www.idi.ntnu.no/grupper/su/publ/phd/sorumgard_ thesis.pdf [84] Y. Wang, H. Erdogmus, The Role of Process Measurement in TestDriven Development, in: C. Zannier, H. Erdogmus, L. Lindstrom (Eds.), XP/Agile Universe, Vol. 3134 of Lecture Notes in Computer Science, Springer, 2004, pp. 32–42. [85] M. M. M¨ uller, A. H¨ofer, The effect of experience on the test-driven development process, Empirical Software Engineering 12 (6) (2007) 593– 615. [86] M. Fowler, The New Methodology (Accessed 2007). URL http://www.martinfowler.com/articles/newMethodology. html
44
[87] E. Arisholm, D. I. K. Sjøberg, Evaluating the effect of a delegated versus centralized control style on the maintainability of object-oriented software, IEEE Transactions on Software Engineering 30 (8) (2004) 521–534. [88] M. W. Lipsey, D. B. Wilson, Practical Meta-Analysis, Sage Publications, California, USA, 2001. [89] V. B. Kampenes, T. Dyb˚ a, J. E. Hannay, D. I. K. Sjøberg, Systematic review: A systematic review of effect size in software engineering experiments, Information and Software Technology 49 (11-12) (2007) 1073–1086. [90] L. Madeyski, The impact of test-first programming on branch coverage and mutation score indicator of unit tests: A raw data from an experiment, (Raw data from SPSS), Wroclaw University of Technology, Institute of Informatics, http://madeyski.einformatyka.pl/download/Madeyski09bExp2RawData.pdf (2009). URL http://madeyski.e-informatyka.pl/download/ Madeyski09bExp2RawData.sav
45