Journal of Industrial Engineering and Management JIEM, 2015 – 8(1): 21-36 – Online ISSN: 2013-0953 – Print ISSN: 2013-8423 http://dx.doi.org/10.3926/jiem.1240
The Impacts of Environmental Performance and Propensity Disclosure on Financial Performance: Empirical Evidence from Unbalanced Panel Data of Heavy-pollution Industries in China
Kai Chang School of Finance, Zhejiang University of Finance & Economics (China)
[email protected] Received: September 2014 Accepted: January 2015
Abstract: Purpose: Environmental performance and propensity disclosure is important for stakeholders to estimate firms’ incentives in environmental management practices. The purpose of this article is to explore the impacts of environmental performance and propensity disclosure on financial performance using unbalanced panel data of eight heavy-pollution industries in China.
Design/methodology/approach: Environmental performance and propensity exhibits mutual causality relationship with Tobin’s Q value using unit root and co-integration test of panel data. Using panel data analysis, we take the impacts of environmental performance and propensity disclosure on financial performance from 2008 to 2012.
Findings: Environmental performance has a significantly negative impact on Tobin’s Q value at the significance levels of 1%, while environmental propensity has a significantly positive effect on Tobin’s Q value at the significance levels of 5%. Firm size, financial leverage and return of assets have significantly positive impacts on financial performance at the significance levels of 1%. Meanwhile the effect of corporate environmental performance and propensity on financial performance has a significantly periodic difference from 2008 to 2012.
Research limitations/implications: Those results are helpful for environmental regulators to evaluate the implementing effect of voluntary environmental policy and for firms’ managers to increase market expectation and improve financial performance.
-21-
Journal of Industrial Engineering and Management – http://dx.doi.org/10.3926/jiem.1240
Originality/value: Environmental performance is estimated by 30 environmental indicators in eight heavy-pollution industries in China. Environmental performance and propensity disclosure has a U-typed relationship with financial performance.
Keywords: environmental performance, environmental propensity, unbalanced panel data, Tobin’s Q, causality test
1. Introduction The measure of environmental performance and propensity increasingly emphasizes the awareness and empowerment of stakeholders. The regulation of environmental performance seems to depend crucially on the content and quality of environmental information disclosure. The stakeholders pay much attention to environmental information disclosure and environmental risk measure with an increase of environmental risk and market risk, and they are anxious to capture more environmental information disclosure and improve environmental risk management. Currently it is widely believed that social responsibility reporting, sustainable development reporting and environmental-protection reporting constitute an effective and efficient way to understand environmental performance and environmental risks. Most firms naturally seek the goodwill of neighboring communities, employees, stockholders, investors, financial institutions, local government and citizens. The widely spreading of environmental responsibility and information has a significant impact on stakeholders’ interests. Most empirical evidences exhibit the relationship between environmental and financial performance in order to analyze firm behaviors and social benefit perspective. Many scholars find different results, such as significantly positive correlation, significantly negative correlation and non-significant correlation. Excellent environmental performance can improve corporate organization efficiency and increase stakeholders’ market expectations (Russo & Fouts, 1997; Dowell, Hart & Yeung, 2000). Better financial performance improve future environmental performance, firm size, financial leverage, marketization, ownership structure, profitability and Tobin’s Q value have significantly positive impacts on environmental performance (Earnhart & Lizal, 2006; Zeng, Xu, Dong & Tam, 2010; Liu & Anbumozhi, 2009; Clarkson, Overell & Chepple, 2011; Zeng, Xu, Yin & Tam, 2012). Environmental responsibility activists argue that greater environmental performance can attract more institutional investors, incline environmental cost and political risk cost etc, and then improve corporate financial performance (Orlitzky, Schmidt & Rynes, 2003; Salama, 2005; Montabon, Sroufe & Narasimhan, 2007; Lucas & Wilson, 2008; Wahba, 2008). Strictly environmental regulation policies compel corporate managers to carry out environmental management practices, to promote green environmental- protection investment and management innovation, those environmental policies effectively improve corporate financial performance and meet
-22-
Journal of Industrial Engineering and Management – http://dx.doi.org/10.3926/jiem.1240
stakeholders environmental interests demand (Nakao, Amano, Matsumura, Genba & Nakano, 2007; Monevan & Ortas, 2010; Sueyoshi & Goto, 2010; Rassier & Earnhart, 2011; Thoumy & Vachon, 2012). Resource and management efficiency theory advocates that environmental pollution denote lower social resource usage, strictly environmental regulation and environmental information mechanism motivate corporate to improve environment-protection technology progress and environmental management innovation, those policies may promote corporate social images, strengthen institutional investors confidence, effectively capture market opportunity and then increase resource usage efficiency. Traditionally classical theory argues that corporate environmental management practices may increase private production costs and incline market competition. A few empirical evidences exhibit that the correlation between environmental performance and financial performance is non-significant or negatively significant. Information disclosure of waste emissions has a nonsignificant effect on financial performance, while information disclosure of greenhouse emission have positively significant effect on financial performance (Konar & Cohen, 2001; Iwata & Okada, 2011). Strictly environmental regulation increase corporate environment-related cost and incline shareholders wealth, more information disclosure of environment-related cost has a negative impact on financial performance (Filbeck & Gorman, 2004). Information disclosure of environmental responsibility has a negative effect on Tobin’s Q value, return of asset and stock return (Jacobs, Singhal & Subramanian, 2010; Lioui & Sharma, 2012). In brief, several results exhibit that strictly environmental regulation and information disclosure in environmental practices and responsibility has a negative impact on financial performance. The identification and assessment of environmental propensity has received much attention, particularly in social responsibility reporting and sustainable development reporting. Desgagne and Gozlan (2003) find that environmental information disclosure may be hazier when the stakeholder is confident or native, corporate favor disclose high-quality environmental performance, safe corporate can set themselves apart more easily from dangerous industrial activity. Livermore (2007) notes that traditional environmental regulations can be supplemented through preference-directed regulation (PDR), and PDR can potentially overcome stagnant political regimes and policies by allowing for more frequent regulatory revision. Environmental performance and propensity assessment is important for sell-side bank analysts to recognize environmental filtration of loan decisions in the assessment of bank risk profile and valuation (Campbell & Slack, 2011). Environmental propensity assessments are critical inputs in the process of organizational decision-making, environmentalists advocate that environmental propensity has a significant effect on corporations’ perceived environmental risk and actual financial performance using social movement theory (Vasi & King, 2012). Sun and Cui (2014) explore that corporate social responsibility (CSR) help corporations to reduce default risk in the ongoing financial crisis, CSR has a strong effect on default risk reduction in high dynamism environments than in low dynamism environments, thereby corporate has strongly environmental preference. Socially responsible firms commit to a high standard of -23-
Journal of Industrial Engineering and Management – http://dx.doi.org/10.3926/jiem.1240
transparency and engage in less bad news hoarding, they would have lower crash risk. However, if managers engage in CSR to cover up bad news and divert shareholder scrutiny, CSR would be associated with higher crash risk (Kim, Li & Li, 2014). To the extent, better environmental propensity has a positive impact on financial performance. This paper has three greater contributions in environmental performance and financial performance. Firstly, corporate environmental performance and propensity is estimated in eight heavy-pollution industries in China from 2008 to 2012. Secondly, environmental performance and propensity is significantly related with financial performance using unbalanced panel data. Thirdly, environmental performance and propensity has a periodic effect on financial performance from 2008 to 2012. Hypothesis development is discussed in section 2. Section 3 proposes empirical methodology. Section 4 presents statistical results of environmental performance and propensity, and Tobin’s Q value. Empirical evidences and discussion are reported in section 5. We conclude in section 6.
2. Hypothesis Development The effect of corporate environmental performance and propensity on financial performance has two opposite theory. Traditionally environmental theory advocate that greater environmental performance expands environmental management activities and practices, increases environmental equipments investment, promotes emission-reduction ability, and then restricts production capacity. More environmental information disclosure may increase disposal cost of environmental assets, related costs of environmental monitoring, assessment and budget, and environmental administration charges, and then increase firms’ operating costs. Environment -supporting theory argues that more environment-protection practices improve energy usage efficiency and effective production process, reduce environment-related costs (e.g., material and energy usage, environment-recovery cost, and waste-recycling returns etc) and then incline corporate operating risk disclosure. Green low-carbon technology attracts customers to consume green products, and then newly business expansion promotes corporate competitive benefits. Hypothesis 1. Environmental propensity is positively associated with financial performance. Seriously environmental accidents are usually destroyed ecological environment, damaged resident health, and then accompanied by a serious of lawsuit events of fine compensation, strictly environmental regulation and environment-protection lawsuits etc. Environmental disasters reduce future market value of listed firms, seriously damage firms’ image and reputation, and then affect market investors’ confidence of future earnings. Many fine compensations and environment-protection lawsuits directly involve cash outflow and profits loss, media exposure. -24-
Journal of Industrial Engineering and Management – http://dx.doi.org/10.3926/jiem.1240
Greater environmental performance and strong propensity exhibit that corporate strengthen systemically environmental management and prevent the occurrence of seriously environmental accidents or disasters, reduce political risk, market risk and environment risk involved by environmental disasters. Stakeholders’ activists advocate that firms’ managers with strongly environmental propensity make environmental practices or policies enhance greater potential for an environmental performance, accordingly stakeholders pay much attention to environmental propensity and performance (Vasi & King, 2012). Environmental propensity is positively associated with financial performance, and stronger environmental propensity could potentially put operations at greater environmental performance and financial performance. Hypothesis 2. Environmental performance and preference are causally related with financial performance. Discretionary disclosure theory advocate that corporate may voluntarily disclose beneficial information while they may not disclose adverse information (Dye, 1985). Listed firms with an increase of firm size have enough financial ability to develop more efficient environmentprotection technology and to carry out environment- protection activities, and then voluntarily disclose more environmental information. Greater environmental performance implies that listed firms voluntarily communicate with stakeholders using proven environmental information. Listed firms in heavy-pollution industries are mainly supervised by government and public media, they may voluntarily communicate with stakeholders through disclosing more environmental information. Stakeholder theory argues that firms need stakeholders’ supports and recognitions improving environmental performance, those firms tell their stakeholders their positions, efforts, and achievements in the implementation of environmental responsibility (Elijido-Ten, 2004). Listed firms must strengthen stakeholders’ confidence, reduce their misunderstanding in the field of environmental protection, and improve relationship with external stakeholders, and then disclose more environmental information. Hypothesis 3. Environmental performance is negatively related with financial performance. Heavy-pollution industries are higher energy-consuming and greater waste-polluting industries. Strictly environment-protection regulation and stakeholders’ pressure compel corporate to increase environment-protection investment and implement energy-saving and emission-reduction policies, those policies increase corporate investment cost and financial burdens in environment -protection practices, and then incline financial performance. Firstly, listed firms in heavy-pollution industries increase research-development investment in energy-saving and emission-reduction activities, and purchase many environment-protection assets, thereby listed firms need enhance debts-financing costs, assets depreciation, supervising and budgeting costs related with environmental protection. Secondly, listed firms carry out energy-saving and emission-reduction activities, and then increase waste disposal
-25-
Journal of Industrial Engineering and Management – http://dx.doi.org/10.3926/jiem.1240
costs, disclosing cost of environmental information and excess costs substituting fossil fuels etc. As a result, listed firm in heavy-pollution industries voluntarily disclose more environmental information, greater environmental performance directly lead to an increase of the environment-related costs and a decline of financial performance.
3. Empirical Methodology 3.1. Sample Selection Ministry of Environmental Protection of China (MEPC) has issued the notice of environmentprotection verification on the application for initial public offering and refinancing of listed firms (MEPC [2003],No.101) and the notice of environment- protection verification on further regulation of initial public offering and refinancing of manufacturing firms in heavy-pollution industries (MEPC [2007], No.105). Those documents provide that heavy-pollution industries contain 13 industries, for instance as thermal electric, non-ferrous metals, steel, coal-oilmining, building materials, chemical, petrochemical, papermaking, brewing, pharmaceutical, textile, leather etc. Initial samples consist of social responsibility reporting and sustainable development reporting issued by listed firms in thermal electric, non-ferrous metals, steel, coal-oil-mining, building-materials, chemical-petrochemical, pharmaceutical and textile-leather industries. Considering the continuity and comparability of initial samples, samples data are sourced from social responsibility reporting and sustainable development reporting issued by listed firms in heavy-pollution industries from 2008 to 2012, including 23 firms in thermal electric industry, 16 firms in steel industry, 19 firms in non-ferrous metal industry, 20 firms in chemical-petrochemical industry, 14 firms in coal-oil-mining industry, 14 firms in buildingmaterial industry, 24 firms in pharmaceutical industry, 12 firms in textile-leather industry. Missing data of social responsibility reporting and environmental reporting are eliminated, and then 685 social responsibility reporting and sustainable development reporting are collected. Social responsibility reporting and sustainable development reporting are sourced from syntaosustainability solutions network and CNINFO network, Tobin’s Q value and other financial performance are sourced from CSMAR database, CNINFO database and GENIUS finance database. Environmental performance is scored by 30 environmental indicators issued by global reporting initiative (GRI) in 2006. Environmental performance is defined by the ratio of actual score sum divided by optimal score sum of environmental information disclosure indicators. Environmental performance is quantified evaluation of environmental information disclosure indicators on the basis of comprehensive consideration of score difference between 17 core indicators and 13 supplementary indicators. Estimated score criterions are as following methodology: Estimated the core indicators, we propose a combination of quantitative and qualitative estimation. Detailed information disclosure is marked 5 score, however inadequate disclosure is marked 3 score in quantitative and qualitative disclosure. Only qualitative -26-
Journal of Industrial Engineering and Management – http://dx.doi.org/10.3926/jiem.1240
information disclosure is marked 1.5 score, undisclosed environmental information is marked 0 score. Estimated the supplementary indicators, detailed information disclosure is marked 3 score, inadequate information disclosure is marked 1 score and undisclosed environmental information is market 0 score. Environmental propensity is defined by the square of environmental performance.
3.2. Research Model Design Konar and Cohen (2001) examine that information disclosure of greenhouse gas emissions may increase firms’ market value (e.g., Tobin’s Q and Q-1). King and Lenox (2002), Nokao et al. (2007) verify greater environmental performance (e.g., information disclosure of greenhouse gas and waste emissions) may enhance financial performance (e.g., Tobin’s Q value and returns of assets), while environmental responsibility is negatively associated with financial performance measured by ROA and Tobin’s Q (Lioui & Sharma, 2012). To investigate how environmental performance and propensity are associated with firm-specific financial performance, we estimate the following models: Qit = γ0 + γ1EPit + γ2PPit + γ3SIZEit + γ4LEVit + γ5ROAit + uit
(1)
Where EPt environmental performance at time t, PPt environmental propensity in information disclosure, defined by the square of environmental performance, SIZEt assets size at time t, estimated the natural logarithm of book value of total assets at year-end, Qt market value at time t, estimated Tobin’s Q value denotes financial performance, LEVt assets leverage at time t, estimated total liabilities are divided by total assets value, ROAt return of assets. In regression model 1, control variables include SIZE, LEV, ROA. ROA and LEV controls for the association among financial performance, environmental performance and propensity (Simon, 2010; Iwata & Okada, 2011; Lioui & Sharma, 2012). SIZE controls for firm size, environmental responsibility, pollution propensity and related environmental visibility of listed firms (Walls, Berrone & Phan, 2012; Dobler, Lajili & Zéghal, 2014).
-27-
Journal of Industrial Engineering and Management – http://dx.doi.org/10.3926/jiem.1240
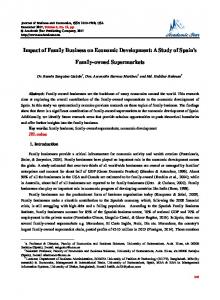
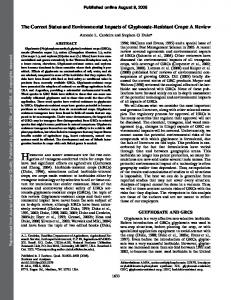
4. Statistical Results of Environmental Variables 4.1. Statistical Results of Environmental Performance Seen from Figure 1, different firms in heavy-pollution industries have greater divergence in the quality of environmental performance. From Table 1, the means of environmental performance in heavy-pollution industries are 0.1652, 0.1843, 0.1845, 0.2012 and 0.2082 from 2008 to 2012, the actual score of corporate environmental performance in heavy-pollution industries is lower. However the mean of corporate EID exhibit an increasing trend, those signs show that corporate in heavy-pollution industries gradually pay much attention to voluntarily disclosing more environmental information and then actively carry out environment -protection activities. The standard deviations of corporate environmental performance are 0.1162, 0.1293, 0.1307, 0.1406 and 0.1407 from 2008 to 2012, and their standard deviation of environmental performance exhibit an enlarging trend. These signs show that corporate in heavy-pollution industries have greater divergence in voluntarily disclosing environmental information, and their environmental difference exhibits an increasing trend from 2008 to 2012.
Figure 1. Corporate environmental performance in heavy-pollution industries
EP
Mean
Standard deviation
maximum
minimum
Observation number
2008
0.1652
0.1162
0.5323
0.0081
128
2009
0.1843
0.1293
0.6532
0.0202
139
2010
0.1845
0.1307
0.6532
0.0081
142
2011
0.2012
0.1406
0.6805
0.0081
141
2012
0.2082
0.1407
0.6815
0.0081
135
Table 1. Statistical results of corporate environmental performance in heavy-pollution industries
4.2. Statistical Results of Environmental Propensity In Table 2, the means of environmental propensity in heavy-pollution industries are 0.0407, 0.0506, 0.0510, 0.0618 and 0.0630 from 2008 to 2012, their means exhibit an enlarging trend, those signs show that corporate pay much attention to voluntarily disclosing more
-28-
Journal of Industrial Engineering and Management – http://dx.doi.org/10.3926/jiem.1240
environmental information, corporate activists advocate greater environmental performance may strengthen better market expectation and improve their stakeholders’ propensity in investment decision.
PP
Mean
Standard deviation
maximum
minimum
Observation number
2008
0.0407
0.0504
0.2833
0.0001
128
2009
0.0506
0.0680
0.4267
0.0004
139
2010
0.0510
0.0661
0.4267
0.0001
142
2011
0.0618
0.0847
0.4699
0.0001
141
2012
0.0630
0.0791
0.4644
0.0001
135
Table 2. Statistical results of corporate environmental propensity in heavy-pollution industries
5. Empirical Results and Discussion 5.1. Causality Test of Panel Data Panel data are pooled by time-series and cross-section data, causality test of panel data considers individual difference and time dynamics. Causality test of panel data may enlarge sample number, improve the freedom of Granger causality test and reduce the co-linearity among the explanatory variable, accordingly Granger causality test of panel data is more strongly accurate than time-series data (Hadri, 2000; Hurlin, 2004). The causal relationship among environmental performance, environmental propensity and financial performance is based on Granger causality methodology of panel data. According to testing step of Granger causality, we examine stationary test of panel data for environmental performance, environmental propensity and financial performance using unit root test. Popular methodologies of unit root test of panel data have LLC (Levin, Lin & Chu, 2002), IPS (Im, Pesaran & Shin, 2003), Fisher-ADF and Fisher-PP testing methodologies. Unit root test of panel data is examined by LLC, IPS, Fisher-ADF and Fisher-PP methodologies in software Eviews 6.0, and exhibit the empirical results among environmental performance, environmental propensity and financial performance in Table 3. Seen from Table 3, unit root test in environmental performance, environmental propensity and financial performance are significant at the confidence levels of 1% using LLC, IPS and FISHER methodologies, empirical results of LLC, IPS, FISHER test can reject initial hypothesis of unit root test, thereby those variables cannot exhibit unit root. Based on the above empirical results, environmental performance, environmental propensity and financial performance are of stationary variables, panel data of those variables directly analyze their Granger causal relationship.
-29-
Journal of Industrial Engineering and Management – http://dx.doi.org/10.3926/jiem.1240
Variable
EP
PP
Q
Methodology
F-statistic
Probability
F-statistic
Probability
F-statistic
Probability
LLC
-22.2998
0.0000
-19.0505
0.0000
-28.5477
0.0000
IPS
-23.1538
0.0000
-22.8838
0.0000
-23.2156
0.0000
Fisher -ADF
306.533
0.0000
302.779
0.0000
312.754
0.0000
Fisher -PP
313.100
0.0000
309.335
0.0000
336.642
0.0000
Table 3. Empirical results of unit root test of panel data (Q, EP, PP)
t-statistic
Probability
Kao test
Test methodology
H0 : ρ = 1
Initial hypothesis
lag
1
ADF
Statistical name
-3.7428
0.0001
Kao test
H0 : ρ = 1
2
ADF
-1.7924
0.0365
Johansen test
None cointegration
(1 1)
Fisher statistic (from trace test)
162.8
0.0000
Johansen test
None cointegration
(1 1)
Fisher statistic (from λ – max test)
140.9
0.0000
Johansen test
At most 1
(1 1)
Fisher statistic (from trace test)
215.8
0.0000
Johansen test
At most 1
(1 1)
Fisher statistic (from λ – max test)
215.8
0.0000
Table 4. Cointegration estimation of panel data between environmental performance and financial performance
Test methodology
Initial hypothesis
lag
Statistical name
t-statistic
Probability
Kao test
H0 : ρ = 1
1
ADF
-3.6247
0.0001
Kao test
H0 : ρ = 1
2
ADF
-1.6650
0.0480
Johansen test
None cointegration
(1 1)
Fisher statistic (from trace test)
158.8
0.0000
Johansen test
None cointegration
(1 1)
Fisher statistic (from λ – max test)
149.8
0.0000
Johansen test
At most 1
(1 1)
Fisher statistic (from trace test)
226.1
0.0000
Johansen test
At most 1
(1 1)
Fisher statistic (from λ – max test)
226.1
0.0000
Table 5. Cointegration estimation of panel data between environmental propensity and financial performance
Co-integration test among environmental performance, environmental propensity and financial performance is tested by Kao and Johansen test methodologies, and their empirical evidences are shown in Table 4 and 5. Empirical results in Table 4 show that environmental performance and financial performance can reject initial hypothesis at the significance levels of 5%, and they exhibit mutual co-integration and causality relationship. Environmental performance has a significant effect on financial performance, meanwhile financial performance has a significant effect on environmental performance, and they show mutual causality relationship. Similarly, empirical evidence in Table 5 shows that environmental propensity and financial performance has mutual co-integration and causality relationship.
-30-
Journal of Industrial Engineering and Management – http://dx.doi.org/10.3926/jiem.1240
5.2. Regression Results and Discussion Do environmental performance and propensity have a significant impact on financial performance? Their correlation directly involve stakeholders’ interests, such as shareholders’ interests, institutional investors’ interests and environmental regulatory effect guided by central and local Ministry of Environmental Protection. Using unbalanced panel data in heavy-pollution industries in China, this paper examine the effect of environmental performance and propensity on financial performance, and their empirical evidences are shown in Table 6. For listed firms in heavy-pollution industries, the related coefficient between environmental performance and Tobin’s Q value is -2.6166, absolute value of t-statistical value is obviously greater than 1, thereby environmental performance is negatively related with Tobin’s Q value at the significance levels of 1%. The related coefficient between environmental propensity and Tobin’s Q value is 4.1840, t-statistical value is obviously larger than 1, accordingly environmental preference is positively related with Tobin’s Q value at the significance levels of 5%. Meanwhile firm size, financial leverage and return of assets have significantly positive impacts on Tobin’s Q value at the significance levels 1%. The fixed effect of panel data shows that environmental performance and propensity on financial performance has an obviously periodic-difference impact on financial performance from 2008 to 2012. Since a series of environmental regulation policies and laws, for instance the notice of corporate environmental information disclosure in 2003 and the ways of environmental information disclosure in 2007 issued by Ministry of Environmental Protection of China, and the guideline of environmental information disclosure issued by Shanghai and Shenzhen Stock Exchange, it is popular for listed firms to voluntarily disclose greater environmental performance using annually financial reporting, social responsibility reporting and sustainable environment reporting etc. In recent years, Chinese government strengthens environmental regulation and interference, enhance corporate environmental performance through strict environment laws and economic fine and encourage corporate increase environmental propensity in stock market. However the quality of corporate environmental performance is relatively lower in heavy-pollution industries from 2008 to 2012. Market investors argue that listed firms are necessary to increase energy-saving and emission-reduction technology and assets investment in environment-protection practices in order to enhance greater environmental performance. More environmental -protection practices increase depreciating costs of environment-protection assets, waste disposing costs and other environment-related costs. Those factors enlarge financial burdens and greater operating risk, and then greater environmental performance reduces market value of listed firms. Based on stakeholder theory, greater environmental performance show that corporate can hold positions and efforts, achieve higher environmental performance in carrying out environmental and social responsibility. Most of corporations with greater environmental performance may raise their environmental propensity, actively communicate with stakeholders through social responsibility reporting and sustainable environment reporting, and weaken stakeholders’ worries in environment-31-
Journal of Industrial Engineering and Management – http://dx.doi.org/10.3926/jiem.1240
protection activities. As a result, greater environmental propensity can improve stakeholders’ confidence and psychological expectations.
Variables
C
EP
Coefficients
9.6642 (14.9277)
-2.6166 (-2.7748)
4.1840** (2.4154)
Variables
SIZE
LEV
ROA
Coefficients
0.3733 (12.9461)
***
PP ***
1.1727 (7.3716)
***
***
4.1197*** (8.6478)
Fixed effect C2008
-0.5330
C2009
0.2873
C2010
0.3975
C2011
-0.0976
C2012
-0.1045
R
0.3680
2
F-statistic
43.6094
AIC
2.9218
Note: ** significance of the estimated coefficients at the significance levels of 5%, *** significance of the estimated coefficients at the significance levels of 1%. The numbers in parentheses are t-statistical value.
Table 6. Empirical results of the effect of environmental performance and propensity on financial performance
6. Conclusions The mean of corporate environmental performance and propensity in heavy-pollution industries in China exhibit an increasing trend from 2008 to 2012, those signs show that listed firms in heavy-pollution industries pay much attention to environmental information disclosure and gradually strengthen their environmental propensity. Meanwhile standard deviation of environmental performance shows an enlarging trend, those signs show that the quality of corporate environmental performance exhibits greater difference. Based on unbalanced penal data in eight heavy-pollution industries in China, environmental performance, environmental propensity and Tobin’s Q value are of stationary variables using unit root and co-integration test of panel data, those variables exhibit mutual co-integration and causality relationship. Environmental performance is negatively related with Tobin’s Q value at the significance levels of 1%, while environmental propensity is positively related with Tobin’s Q value at the significance levels of 5%. Similarly firm size, financial leverage and return of assets have significantly positive impacts on financial performance at the significance levels of 1%. Meanwhile the effect of corporate environmental performance and propensity on financial performance has a significantly periodic difference from 2008 to 2012. Market investors advocate that corporate with greater environmental performance in heavy-pollution industries strengthen their financial burdens and increase higher operation risk, thereby corporate environmental performance has a significantly negative effect on financial performance. -32-
Journal of Industrial Engineering and Management – http://dx.doi.org/10.3926/jiem.1240
Stakeholder theory argues that corporate with greater environmental performance may undertake more social responsibility and environmental responsibility, strengthen their communication with stakeholders, weaken their worries in environmental management problems, and then improve corporate image and market competition, accordingly most of corporate have stronger environmental propensity.
Acknowledgments The authors are grateful for research support from Research Planning of Statistical Science in China (2013LY125); Youth Foundation on Humanities and Social Sciences of Ministry of Education (14YJC7900074);Center for Research of Regulation and Policy of Zhejiang Province (13JDGZ03YB); Statistical Research Planning in Zhejiang Province(2014LZ31).
References Campbell, D., & Slack, R. (2011). Environmental disclosure and environmental risk: Sceptical attitudes of UK sell-side bank analysts. The British Accounting Review, 43(2), 54-64. http://dx.doi.org/10.1016/j.bar.2010.11.002
Clarkson, P.M., Overell, M.B., & Chepple, L. (2011). Environmental reporting and its relation to corporate environmental performance. Journal of Accounting, Finance and Business Studies, 47(1), 27-60. Desgagne, B.S., & Gozlan, E. (2003). A theory of environmental risk disclosure. Journal of Environmental Economics and Management, 45(2), 377-393.
http://dx.doi.org/10.1016/S0095-
0696(02)00056-6
Dobler, M., Lajili, K., & Zéghal, D. (2014). Environmental performance, environmental risk and risk management. Business Strategy and the Environment, 23, 1-17. http://dx.doi.org/10.1002/bse.1754
Dowell, G., Hart, S., & Yeung, B. (2000). Do corporate global environmental standards create or destroy market value. Management Science, 46(8), 1059-1074. http://dx.doi.org/10.1287/mnsc.46.8.1059.12030
Dye, R.A. (1985). Disclosure of Non-proprietary Information. Journal of Accounting Research 3, 123-145.
http://dx.doi.org/10.2307/2490910
Earhart, D., & Lizal, L. (2006). Effects of ownership and financial performance on corporate environmental performance. Journal of Comparative Economics, 34, 111-129. http://dx.doi.org/10.1016/j.jce.2005.11.007
Elijido-Ten, E. (2004). Determinants of Environmental Disclosures in a Developing Country :An Application of the Stakeholder Theory. The Fourth Asia Pacific Inter-disciplinary Research in Accounting Conference, Singapore. -33-
Journal of Industrial Engineering and Management – http://dx.doi.org/10.3926/jiem.1240
Filbeck, G., & Gorman, R.F. (2004). The relationship between environmental and financial performance of public utilities. Environment and Resource Economics, 29, 137-157. http://dx.doi.org/10.1023/B:EARE.0000044602.86367.ff
Hadri, K. (2000). Testing for Stationarity in Heterogeneous Panel Data. Econometrics Journal, 3, 148-161.
http://dx.doi.org/10.1111/1368-423X.00043
Hurlin, C. (2004). Testing Granger Causality in Heterogeneous Panel Data Models with Fixed Coefficients. Mimeo. University Orléans. Im, K.S., Pesaran, M.H., & Shin, Y. (2003). Testing for unit roots in heterogeneous panels. Journal of Econometrics, 11(5), 53-74.
http://dx.doi.org/10.1016/S0304-4076(03)00092-7
Iwata, H., & Okada, K. (2011). How does environmental performance affect financial performance? Evidence from Japanese manufacturing firms. Ecological Economics, 70, 1691-1700.
http://dx.doi.org/10.1016/j.ecolecon.2011.05.010
Jacobs, B.W., Singhal, V.R., & Subramanian, R. (2010). An empirical investigation of environmental performance and the market value of the firm. Journal of Operations Management, 28, 430-441.http://dx.doi.org/10.1016/j.jom.2010.01.001 Kim, Y., Li, H.D., & Li, S.Q. (2014). Corporate social responsibility and stock price crash risk. Journal of Banking & Finance, 43, 1-13.
http://dx.doi.org/10.1016/j.jbankfin.2014.02.013
King, A., & Lenox, M. (2002). Exploring the locus of profitable pollution reduction. Management Science, 48(2), 289-299.
http://dx.doi.org/10.1287/mnsc.48.2.289.258
Konar, S., & Cohen, M.A. (2001). Does the market value environmental performance? The Review of Economics and Statistics, 83(2), 281-289.
http://dx.doi.org/10.1162/00346530151143815
Levin, A., Lin, C., & Chu, C. (2002). Unit root tests in panel data: Asymptotic and finite -sample properties. Journal of Econometrics, 108, 1-24. http://dx.doi.org/10.1016/S0304-4076(01)00098-7
Lioui, A., & Sharma, Z. (2012). Environmental corporate social responsibility and financial performance: Disentangling direct and indirect effects. Ecological Economics, 78, 100-111. http://dx.doi.org/10.1016/j.ecolecon.2012.04.004
Liu, X.B, & Anbumozhi, V. (2009). Determinant factors of corporate environmental information disclosure: An empirical study of Chinese listed companies. Journal of Cleaner Production, 17, 593-600.
http://dx.doi.org/10.1016/j.jclepro.2008.10.001
Livermore, M. (2007). Reviving environmental protection: preference-directed regulation and regulatory ossification. Villanova Environmental Law Journal, 25, 311-386. Lucas, M.T., & Wilson, M.A. (2008). Tracking the relationship between environmental management and financial performance in the service industry. Service Business, 2, 203-218. http://dx.doi.org/10.1007/s11628-008-0035-5
-34-
Journal of Industrial Engineering and Management – http://dx.doi.org/10.3926/jiem.1240
Monevan, J.M., & Ortas, E. (2010). Corporate environmental and financial performance: A multivariate approach. Industrial Management & Data Systems, 110(2), 193-210. http://dx.doi.org/10.1108/02635571011020304
Montabon, F., Sroufe, R., & Narasimhan, R. (2007). An examination of corporate reporting, environmental management practices and firm performance. Journal of Operations Management, 25, 998-1014.
http://dx.doi.org/10.1016/j.jom.2006.10.003
Nakao, Y., Amano, A., Matsumura, K., Genba, K., & Nakano, N. (2007). Relationship between environmental performance and financial performance: An empirical analysis of Japanese corporations. Business Strategy and the Environment, 16(2), 106-118. http://dx.doi.org/10.1002/bse.476
Orlitzky, M., Schmidt, F.L., & Rynes, S.L. (2003). Corporate social and financial performance: A meta-analysis. Organization Studies, 24(3), 403-441. http://dx.doi.org/10.1177/0170840603024003910
Rassier, D., & Earnhart, D. (2011). Short-run and long-run implications of environmental regulation on financial performance. Contemporary Economic Policy, 29(3), 357-373. http://dx.doi.org/10.1111/j.1465-7287.2010.00237.x
Russo, M.V., & Fouts, P.A. (1997). A resource-based perspective on corporate environmental performance and profitability. Academy of Management Journal, 40(3), 534-559. http://dx.doi.org/10.2307/257052
Salama, A., (2005). A note on the impact of environmental performance on financial performance. Structural Change and Economic Dynamics, 16, 413-421. http://dx.doi.org/10.1016/j.strueco.2004.04.005
Simon, T. (2010). Just who is at risk? the ethics of environmental regulation. Human and Experimental Toxicology, 30(8), 795-819.
http://dx.doi.org/10.1177/0960327110379252
Sueyoshi, T., & Goto, M. (2010). Measurement of a linkage among environmental, operational, and financial performance in Japanese manufacturing firms: A use of Data Envelopment Analysis with strong complementary slackness condition. European Journal of Operational Research, 207, 1742-1753.
http://dx.doi.org/10.1016/j.ejor.2010.07.024
Sun, W., & Cui, K. (2014). Linking corporate social responsibility to firm default risk. European Management Journal, 32(2), 275-287.
http://dx.doi.org/10.1016/j.emj.2013.04.003
Thoumy, M., & Vachon, S. (2012). Environmental projects and financial performance: Exploring the impact of project characteristics. International Journal of Production Economics, 140, 28-34.
http://dx.doi.org/10.1016/j.ijpe.2012.01.014
-35-
Journal of Industrial Engineering and Management – http://dx.doi.org/10.3926/jiem.1240
Vasi, I.B., & King, B.,G. (2012). Social movements, risk perceptions, and economic outcomes: The effect of primary and secondary stakeholder activism on firms’ perceived environmental risk and financial performance. American Sociological Review, 77(4), 573-596. http://dx.doi.org/10.1177/0003122412448796
Wahba, H. (2008). Exploring the moderating effect of financial performance on the relationship between corporate environmental responsibility and institutional investors: Some Egyptian evidence. Corporate Social Responsibility and Environmental Management, 15, 361-371. http://dx.doi.org/10.1002/csr.177
Walls, J.L., Berrone, P., & Phan, P.H. (2012). Corporate governance and environmental performance: is there really a link? Strategic Management Journal, 33(8), 885-913. http://dx.doi.org/10.1002/smj.1952
Zeng, S.X., Xu, X.D., Dong, Z.Y., & Tam, V.W.Y. (2010). Towards corporate environmental information disclosure: An empirical study in China. Journal of Cleaner Production, 18, 1142-1148.
http://dx.doi.org/10.1016/j.jclepro.2010.04.005
Zeng, S.X., Xu, X.D., Yin, H.T., & Tam, C.M. (2012). Factors that drive Chinese listed companies in voluntary disclosure of environmental information. Journal of Business Ethics, 109(3), 309-321.
http://dx.doi.org/10.1007/s10551-011-1129-x
Journal of Industrial Engineering and Management, 2015 (www.jiem.org)
Article's contents are provided on a Attribution-Non Commercial 3.0 Creative commons license. Readers are allowed to copy, distribute and communicate article's contents, provided the author's and Journal of Industrial Engineering and Management's names are included. It must not be used for commercial purposes. To see the complete license contents, please visit http://creativecommons.org/licenses/by-nc/3.0/.
-36-