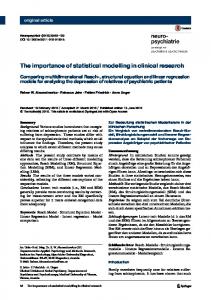
The Importance of Modelling Pattern and Structure in Automated Map Generalisation William Mackaness
Geoffrey Edwards
Department of Geography
Directeur scientifique Le réseau GEOIDE
University of Edinburgh
Pavillon Casault
Drummond St, Edinburgh, EH8 9XP
Université Laval,
United Kingdom
Sainte-Foy, Québec G1K 7P4
[email protected]
[email protected]
Joint Workshop on Multi-Scale Representations of Spatial Data, Ottawa, Canada, July, 7th-8th, 2002, CCRS – Canada Centre for Remote Sensing, Ottawa, Ontario, Canada Abstract We argue that there is special value in viewing any given map as a unique collection of patterns. Symbolisation acts to give emphasis to specific qualities among those patterns. The paper builds on the idea of being able to place any given pattern within a multi dimensional ‘pattern space’ (borrowing from Edelman’s ideas on shape space). The paper also borrows from the ideas of Zacks and Tversky’s ideas on event structures, and argues that patterns can be modelled as objects within an object oriented paradigm. The authors are interested in how patterns manifest themselves and ‘morph’ as we transition scale. A focus of interest is how patterns behave as we transcend large changes in scale – leaping Muller’s conceptual cusps that arise from large changes in scale. In exploring qualities of pattern, we seek to highlight those qualities that should be invariant over large changes in scale and argue that they provide a framework for the meaningful evaluation of representations at small scales (low levels of detail). Keywords pattern, structure, automated generalisation, taxonomy, partonomy. 1.0 Introduction ‘To understand is to perceive pattern’ Isaiah Berlin Research into automated map generalisation has given clarity of the interdependence that exists between scale and pattern, and their role (together with symbolisation) in enabling us to interpret the world around us through the process of abstraction. When viewing the map, the eye discerns patterns – patterns of shape, orientation, connectedness, density and distribution. When combined with experiences and geographical knowledge, the user begins to record them, to explore and categorise these patterns in terms of the processes that formed them. From the user’s point of view, the combination of various patterns enables the creation of 'higher order' phenomenon. For example the geographical extent and relative importance of a town is conveyed by the -1-
densities, metric and topological characteristics and associations among railways, rivers, buildings, streets, airports, historic and cultural landmarks. When we look at a map of a city at 1:25 k (Figure 1a), we don’t see points, lines and areas; we see ribbon development along arterial roads. When we view the city at 1:250 k (Figure 1b) we don't see a white dot - we see a small town among other towns of varying relative size, connected by a network of roads.
Figure 1: (a) 1:25 000, (b) 1: 250 000 (Copyright of the IGN): pattern, process, scale and theme. In assessing the success of our design (our abstraction of this geographic phenomenon) let us assume that both abstractions are drawn from the same database, and the goal is the automatic derivation of maps to support decision-making relating to transportation policy. In the absence of the cartographic human expert, a system needs to be capable of evaluating the success of these designs - even in a 'satisficing' context. For small changes in scale, shape and location measures may be appropriate (i.e. to compare one cartographic incarnation with another). Of more fundamental concern is how to evaluate over large changes in scale. It is suggested that evaluation needs to take place at the database level; furthermore that this evaluation will require the analysis of pattern apparent when the database is viewed at different scales or levels of detail. In essence a thematic map at a particular scale gives emphasis to a particular set of those patterns, emphasising a specific set of geographical qualities (Figure 2). For example choice of scale and symbology will strongly influence what association is seen between morphology and drainage, between the old town of a city and its surrounding suburbs, or the interconnectivity and travel time between major cities. In an automated context, each theme is formed by first selecting from a database a set of data appropriate to the task, choosing a scale and symbol set that best illustrates the qualities you wish to show. Thus a map is a palimpsest of patterns inherent among symbolised objects - the symbols themselves representing an abstracted set of features found in the real world. As we change scale, we see different sets of objects, thus different patterns begin to emerge, whilst others recede and vanish. The challenge in automated generalisation is to present the information at a scale and theme that best conveys a particular set of patterns. -2-
A particular subset of all patterns, apparent at a particular scale (level of detail) and theme.
Pattern Theme (symbolisation)
Scale
Figure 2: Changing scale and theme enables us to see new sets of patterns among geographic phenomenon. The ‘high level’ structures and patterns that we see when viewing a map can be ‘decomposed’ and defined in terms of individual map objects, together with an associated sets of generalisation methods used to manipulate those objects (either at the model level or the cartographic level). As an aside, this hierarchical relationship between high level pattern and their atomic components mirrors Maybury’s (1993) ideas on hierarchical structures in communicative acts. The argument made in this paper is that if we wish to 'control' the viewing of patterns, we need to understand and formalise them, and to make explicit the types of patterns we wish to give emphasis to. In this paper we discuss a number of issues underpinning ideas of meaning, specifically ideas of pattern in interpretation. It is argued that if we wish to automate generalisation across large changes in scale and theme we need to model pattern in a more meaningful and explicit way. Automated generalisation is as much about unearthing these patterns as it is about their symbolisation, and there are important consequences through the spectrum of issues from model to cartographic generalisation. Typically in automated generalisation systems, cartometric analysis is required at the outset in determining appropriate application of methods, and evaluation is required in order to assess the success of generalisation. Considerable research has been devoted to evaluating the appropriateness of various methods, and evaluating resulting solutions overall (Dutton 1999; Brazile 1998). Where the change in scale is small (resulting in low changes in the level of detail) it is appropriate to use evaluation methods at the atomic level (at the level of the individual map feature). But at larger scale changes, we see fundamental changes in the content (for example between Figure 1a and 1b), and we see fundamental changes in the patterns perceived – bringing to mind Minsky’s comment that ‘you cannot tell you are on an island by looking at the pebbles on a beach’. Though it is theoretically possible to derive these images from a single database, the views of information are fundamentally different (not more or less). The changes are so fundamental, it is argued that it is meaningless to measure changes at the individual object level. As part of the evaluation in autonomous systems, it is argued that we need to be able to model the transitions between patterns (what Muller’s (1991) calls ‘conceptual cusps’). Before we explore these -3-
ideas further, it is worth discussing the idea that patterns within and among map objects can themselves be modelled as objects, and also summarising and laterally applying some ideas from Edelman (1999), whose interest is in representing any 3D form within a multidimensional ‘shape space’. 2.0 Patterns as Objects For the purposes of discussion, we use fairly loose definitions of pattern and structure, using the terms interchangeably. One common definition of pattern is a property within an object, or between objects that is repeated with sufficient regularity. For example one could envisage pattern among a dendritic river network, or between vegetation type, slope and aspect. Given the interdependent nature of geographic phenomenon, we frequently see repetition among the structures and associations of geographical objects. Indeed it is the frequency of patterns that enable us develop prototypical views of geographical processes and to infer the likely existence of those processes for any given region of the world. Both Quine (1985) and Zacks and Tversky (2001) examine the idea of events as objects. Their arguments are equally applicable in the context of modelling pattern – that patterns can themselves be treated as objects – bounded in space, organised hierarchically, and recognisable by a set of distinctive qualities, which can be given emphasis through the process of abstraction and symbolisation. Patterns can be viewed as complexes of primitive objects, and relations between those primitives. Their intrinsic properties include shape, extent, orientation, distribution/ density, topology and configuration (the collection of objects that comprise the pattern). They also have extrinsic relations (the properties between different patterns such as relative proximity/ orientation, topology). The hierarchical relationship among various pattern objects constitutes a partonomy (Tversky 1990). It is the partonomic relationships that give rise to distinctive spatial configurations and enable categorisation of pattern (something discussed in more detail in section 3). For example the easily recognisable form of streets configured in such a way that we discern, discriminate and can explain the underlying processes that have formed the urban pattern spaces of Manhattan and Barcelona (Figure 3). Figure 3: a) Manhattan (http://www.aaccessmaps.com/show/map/manhattan) and b) Barcelona (http://europe.cnn.com/TRAVEL/CITY.GUIDES/WORLD/Europe/spain/barcelona.html) Partonomic organisation promotes extrinsic relations among objects. Figure 4 shows a small part of the partonomic relations among features found in the city (developed from some ideas discussed by Titeux (1989).
-4-
road networks are connected via
include
motorways
connect include
bypass
cul-de-sac
include share orientation towns
road segments
surround/ group
are connected via
junctions
connect
separate linked to surround/ linked to group
intersection road/rail (stations)
are composed of
Intersection road/river (bridge)
buildings surround/ group separate
separate
linked to
connect
railway networks
rivers linked to
include
railway lines
Figure 4: A partonomic view for a subset of transportation objects. Whilst partonomic views reveal the relationship between objects, a taxonomic view can be used to categorise pattern. For example a city boundary is a member of the taxonomic category ‘anthropogenic forms’ and it is therefore likely to be comprised of a set of connected lines forming a region. The partonomic organisation promotes an understanding of function and interaction with other patterns. For example the partonomic organisation of a city boundary and its role as a hub to a collection of roads enables us to recognise and accept highly abstracted forms of such a relationship. The cartographer has taken advantage of this partonomic relationship in the representation of Lanvollon as a simple circle, the roads as spokes radiating outwards from its centre (Figure 1b). The existence of such partonomic organisations is what ‘survives’ Muller’s conceptual cusps and makes cartographically acceptable cartographic solutions such as the one shown in Figure 5.
-5-
Figure 5: London and its major arteries: where do all the roads go? It is worth noting that there are linkages between taxonomies and partonomies (how the structure within a pattern contributes to the structural relationships between patterns). For example the relations we see in a map between relative orientation and proximity between buildings and roads, or between varying river sinuosity and elevation. As we change scale, we see these different linkages between geographic phenomenon – thereby understanding the processes that operate at that scale. In summary, patterns can be organised into partonomic hierarchies reflecting relations between parts and subparts. The taxanomic hierarchy reflects ‘kind – of’ relations. Knowledge of the components that constitute a pattern reflects the functions of the pattern and how such components interact. In the same way that Attneave (1954) explored the minimum number of points required to record an image of a cat (Figure 6), we are interested in recording the minimum partonomic form of any given pattern in order to convey a particular set of relationships between a set of geographic phenomenon across scales
Figure 6: Generalising the cat: Is it still recognisable as a cat? 2.1 Variant and Invariant properties of pattern. The question then becomes, what partonomic qualities do we wish to model and how do we represent the many qualities and relationships that define pattern? It is worth noting that some qualities of pattern are invariant over changes in scale whilst other qualities necessarily change (the information content changes -6-
– it does not get more or less). Taking Figure 1 as an example, the invariant qualities among the road network include connectedness, hierarchy within the road classification, relative continuity of road sections, and relative density of nodes and edges in the road graph. Variant qualities include all relationships between roads and individual map objects now absent from the map (land parcel boundaries, buildings, land use categories). Also, the richness of the road graph is significantly reduced in terms of roads shown, and the precise form of the junctions. Furthermore the functions within the town are no longer discernible (the sports ground, the railway station are now absent). What patterns are discernible, (and what qualities are variant/ invariant) appear to change depending on scale and theme (Figure 2). Assuming all the above qualities were modelled as attributes of patterns, one could envisage minimising changes in invariant qualities, whilst being less concerned with changes in variant properties. 3.0 Categorisation of Pattern – the idea of Pattern Space Among a palimpsest of patterns, some patterns are easy to discern, other patterns complement, reflecting the typical interdependent nature of natural and anthropogenic geographic phenomenon. The interpretative process requires successful identification and categorisation of various patterns. The generalisation process should seek to preserve those qualities that facilitate identification and interpretation. This requires us to categorise pattern. In this context it is worth summarising the ideas of Kendall (1984) and Edelman (1999) on the identification and categorisation of shapes in 3D scenes. Edelman, based on the ideas of Kendall (1984), proposes multidimensional feature spaces in which each dimension captures some quality of a shape (both qualitative and quantitative). Any given shape can be placed in this multi-dimensional space – the metric proximity of any set of shape denoting similarity/ dissimilarity of shape. Paralleling Edelman’s idea of shape space, one could imagine categorising patterns in a multidimensional pattern space. These patterns, as objects, can be treated as points that reside in the pattern space, allowing categorisation and identification – creating ‘clouds’ of points according to similarity, creating neighbourhoods of similar patterns. In pattern space the distance between such neighbourhoods is inversely proportional to the similarity between patterns. The idea is conveyed in a simple form in Figure 7.
Figure 7: Pattern Space: patterns embedded in a multi dimensional measurement space (after Edelman).
-7-
Edelman explores ideas of first and second order isomorphisms. First order isomorphism is concerned with changes in the intrinsic qualities of a pattern. Second order isomorphism calls for the representation of the morphing of patterns (modelling the changes from one pattern to another) rather than the representation of its geometry per se. The generalisation of a pattern creates second order changes between the pattern and surrounding patterns. With respect to some multi dimensional pattern space (Figure 8), one can envisage the point representing the location of any given pattern ‘moving’ through pattern space as it is generalised. ‘Acceptable’ forms of generalisation would be instances where such a point did not move more than a specified value (for each dimension) – with respect to either first or second order isomorphisms (Figure 8).
Figure 8: Three new derived forms – the degree of difference from the original form represented as the distance from the original object in a multi dimensional pattern space. 3.1 Labelling the dimension of pattern space To create a viable pattern space we must decide on a set of characteristics by which we might describe any given pattern. To be computationally tractable, the number of dimensions must be low, but of sufficient ‘fidelity’ that we can distinguish and ‘place’ any given pattern, and model second order isomorphism during generalisation. In this context it is worth mentioning the word of Hummel and Biederman (1992) who identified ‘non accidental’ properties of objects in 3D space, and devised approximately thirty six simple 3D forms – called geometric ions or ‘geons’ (Biederman 1987). A subset of geons is shown in Figure 9.
-8-
Figure 9: Examples of Biederman's Geons and of objects that can be constructed with them. These geons can be used as a lexicon for decomposition and description of complex 3D forms. His research was driven by evidence that suggests shape recognition arises through recognition of its components (Biederman 1985; Hummel and Biederman 1992). In the context of pattern, is there a set of pattern ions (or pateons) that can be used as primitives to give a structural description for any given pattern? How many dimensions of pattern description are there (patterns in the attribute space as well the metric and the topological)? How appropriate might it be to use techniques such as principle component analysis (Joliffe 1986) to reduce the dimensionality of pattern space? It is often the case that a number of different patterns can be discerned for any given collection of objects viewed at a particular scale. The pattern might variously convey qualities of similarity, distinctness, regularity or sinuosity. In terms of the analysis of those patterns, methods will be required that allow for the decomposition of the pattern according to a library of pateons. Techniques such as those used to characterise and decompose linear map objects (Plazanet 1995) is one example of the types of methods required for pattern decomposition. 4.0 Conclusion The paper has argued that it is useful to consider any given map (at a specific viewing scale and theme) as a view of the subset of all possible patterns inherent among objects in the database. Secondly to view the process of generalisation as being about manipulation and portrayal of pattern, (at the expense of other patterns), for any given scale and theme. The paper has explored the idea of partonomies and taxonomies of pattern stressing the need to model the generalisation process over large changes in scale. From the perspective of the pattern, we can define generalisation as a set of transformations (from one pattern to another) in which certain partonomic qualities are preserved and others are disregarded; as a result of this process we see different patterns according to changes in scale or theme. The paper has discussed the idea of pattern space; that for any given pattern, over large changes of scale, various descriptors of the pattern will change. While there is no shortage of cartometric analysis tools for analysing patterns among objects, there is no science of morphology dealing with underlying principles of form description (Lord and Wilson 1986) and it is not yet clear what form a library of ‘pateons’ might take. Acknowledgement The authors are grateful for partial funding from National Image and Mapping Agency, NMA201-01-R2003, The Carnegie Trust and The University of Edinburgh Alumni Development fund. 5.0 References Attneave, F. 1954. Some Informational Aspects of Visual Perception. Psychological Review 61:183-193
-9-
Biederman, I. 1987. Recognition by components: A Theory of human image understanding. Psychological Review 94:115-147. Biederman, I. 1985. Human Image Understanding: Recent research and a theory. Computer vision, Graphics and Image Processing 32:29-73
Brazile, F. L. 1998. A Generalization Machine Design that Incorporates Quality Assessment. In A Generalization Machine Design that Incorporates Quality Assessment, pp. 349-360. Vancouver Dutton, G. 1999. Scale, Sinuosity and Point Selection in Digital Line Generalization. Cartography and Geographic Information Systems 26 Edelman, S. 1999. Representation and Recognition in Vision. Cambridge, Mass.: MIT Press Hummel, J. E., Biederman, I. 1992. Dynamic Binding in a Neural Network for Shape Recognition. Psychological Review 99:480-517 Joliffe, I. T. 1986. Principle Components Analysis. New York: Springer Verlag Kendall, D. G. 1984. Shape manifolds, procrustean metrics, and complex projective spaces. Bulletin of London Mathematical Society 16:81-121 Lord, E. A., Wilson, C. B. 1986. The Mathematical Description of Shape and Form: J.Wiley ISBN 0 95312 722 0 Miller, G., Johnson-Laird, P. 1976. Language and Perception. Cambridge: University Press Muller, J. C. 1991. Generalisation of Spatial Databases. In Generalisation of Spatial Databases, ed. D. J. Maguire, M. Goodchild, D. Rhind. Vol. 1, pp. 457-475. London: Longman Scientific Plazanet, C., Affholder, J.-G., Fritsch, E. 1995. The importance of geometric modeling in linear feature generalization. Cartography and Geographic Information Systems 22:291-305 Quine, W. V. O. 1985. Events and Reification. In Events and Reification, ed. E. LePore, B. P. McLauglin, pp. 162-171. Oxford: Blackwell Titeux, P. 1989. Automatisation de problemes de positionnement sous contraintes: application en cartographie. Doctoral Thesis thesis, University Paris 6. - 10 -
Zacks, Tversky. 2001. Event Structure. Psychological Bulletin 127:3-21
- 11 -