The influence of canard position on aerodynamic characteristics of aircraft in delaying stall conditions Setyawan Bekti Wibowo, Sutrisno, and Tri Agung Rohmat
Citation: AIP Conference Proceedings 2021, 060028 (2018); doi: 10.1063/1.5062792 View online: https://doi.org/10.1063/1.5062792 View Table of Contents: http://aip.scitation.org/toc/apc/2021/1 Published by the American Institute of Physics
The Influence of Canard Position on Aerodynamic Characteristics of Aircraft in Delaying Stall Conditions Setyawan Bekti Wibowo1, 2, a) Sutrisno1) and Tri Agung Rohmat1) 1
Department of Mechanical and Industrial Engineering, Faculty of Engineering, Gadjah Mada University, Jalan Grafika 2 Yogyakarta 55281 Indonesia. 2 Department of Mechanical Engineering, Vocation Program, Gadjah Mada University, Jalan Yacaranda Sekip Unit IV Yogyakarta 55281 Indonesia. a)
Corresponding author:
[email protected]
Abstract. The improvement of the performance of fighter aircraft is always made by engineering the flow around the fuselage; one way is by the addition of a canard. The addition of a canard with delta configuration will bring about the appearance of a roll-up vortex, with a vortex core that has a speed higher than its free velocity, from the canard to the main wing. This vortex core, which keeps the flow above the main wing, remains streamlined and delays a stall, thus increasing the aircraft's maneuverability. The interaction of the vortex core from the canard with the airflow over the main wing is strongly influenced by the canard position against the main wing. Investigations needed to be done to see the effectiveness of the flow interactions. A visualization method using a water tunnel gave the advantages of a detailed flow review due to the density and mass diffusion being greater than air, yielding a better visualization. However, this suffered from limitations in getting quantitative data in detail, so that there was a need for computational fluid dynamics (CFD) techniques. The results of this study indicated the effectiveness of canard position on the flow interaction, having a good lift coefficient (Cl) for the canard position on the top and front side of the main wing, with the Cl increased by up to 5%–12.1%. While at a high angle of attack (AoA), the canard position that was closer or coincides with the wings was capable of delaying the stall to 5–10 deg of AoA. Keywords: canard, computational fluid dynamics, delta, fighter aircraft, stall delay, visualization, water tunnel,
INTRODUCTION Various studies have been made to improve the efficiency, flying performance, and other capabilities of aircraft. Several modifications have been made to improve the airflow around the fuselage. The arrangement of the flow can be made by adding a canard in front of the main wing, which at the same time also functions as a stabilizer. The role of the canard becomes very dominant against aircraft control mainly for increasing the ability of aircraft maneuverability. A canard is a part of an airplane that functions as a stabilizer or elevator and is installed in front of the main wing. A canard is used for several reasons, such as increasing lifting force, the stability of the aircraft's controls, and flow changes over the main wing. A delta wing is a typical wing form used in high-speed aircraft, such as fighter aircraft. In addition to avoiding the effects of shock waves on the fuselage, the use of the delta wing can increase the lift force due to the vortex roll-up flow that occurs. The presence of pressure differences on the top and bottom of the wing surface causes the flow to pass through the leading edge to rise and form a vortex. At the center of the vortex there will form a core that has very low pressure and a higher speed than its free stream. This area will cause the addition of lift.1 Similarly, the canard form on a fighter also has a delta configuration, the vortex core formed from the canard has a higher speed than its free stream. The formation of the roll-up vortex from the small-forewing by either the canard or the leading-edge extension (LEX) will create a powerful vortex up to the top of the main wing. When a flow transition occurs on the main wing, the roll-up vortex of the canard interacts and pushes the airflow over the main
The 8th Annual Basic Science International Conference AIP Conf. Proc. 2021, 060028-1–060028-7; https://doi.org/10.1063/1.5062792 Published by AIP Publishing. 978-0-7354-1739-7/$30.00
060028-1
wing and causes the airflow to remain streamlined, which will delay a stall. The configuration of the position of the canard on the main wing will significantly influence the formation of the vortex above the main wing. Therefore, to obtain the ideal performance in a fighter aircraft requires studying canard position configuration. Previous studies have indicated that the addition of a canard is likely to cause a change in performance due to the interaction with the airflow on the main wing. The configuration used will affect the flow and vortex interaction that occurs.2-8 It becomes very important to understand the phenomenon of flow produced by a canard and the vortex interactions that occur. From the flow phenomenon that arises, there will be determined the character of the flow along the fuselage, speed distribution, pressure distribution, vortex formation, and whether there is a delay of separation that delays the stall. The position and dimensions of the canard against the main wing also affect the value of the increase of the lift.9-11 The existence of vortex cores built from the canard will affect the flow conditions on the main wing. So, the position of the canard will affect the manner of the flow interaction and the extent to which the vortex core can delay the occurrence of a stall on the main wing. A flow analysis around the canard and main wings is required to uncover this phenomenon. A visualization method using a water tunnel and computational fluid dynamics (CFD) is a method that can be used to observe the flow that occurs. The use of a water tunnel is very common to obtain data for a visualization of the flow; this is because the water has a higher density and lower mass diffusion than air so it will be able to provide better visualization results than using air.12 In this research, the effect of the canard position on vortex core formation and its influence on the main wing has been studied in depth through computational fluid dynamics (CFD) simulations, and compared with the water tunnel visualization method.
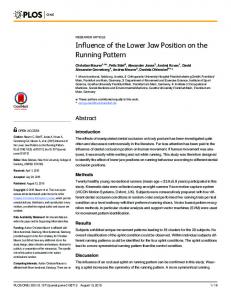
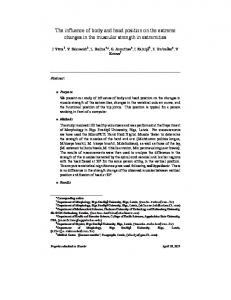
EXPERIMENTAL DETAILS This study was conducted by modeling an aircraft using the delta wing type and using a canard. The dimensions of the aircraft followed a water tunnel visualization model with a total length of 180 mm and a wingspan of 20 mm and a swap angle of 600. The variation of the aircraft model was done by changing the distance between the canard and the main wing either horizontally or vertically. The horizontal changed of size following the size of ¼ root main chord canard was changing the vertical direction based on half the thickness of the canard as shown in Figure 1. The computational model of the aircraft was made half shape in symmetry. The computational mesh was made by the unstructured mesh method with the computational domain as shown in Figure 2. To obtained accurate results, first, a mesh independence study was made to determine the number of the meshes required. An independence study was conducted to obtained the smallest mesh size and the number of meshes required which for the quantitative convergence of the results with the model made. Based on previous research, in this study it was determined that the optimum number of cells is 5.4 million, with the smallest cell size near the wall being 0.00061 based on y+ = 4.13 The test parameters were determined based on the water tunnel experiments and used to validated the computational results. The water tunnel test was performed at a velocity of 0.1 m/s (Re = 18379). Water tunnel flow visualization tests were conducted mainly to obtain better visualization due to the differences in density and mass diffusion.12,14-17 To showed the visualization of the flow, the technique of ink injection from the front of the fuselage was used so that the flow phenomenon along the fuselage could be seen. To measured the forces that occur, a 3DOF force sensor device was installed in the water tunnel section test.18
(a)
(b)
FIGURE 1 Configurations of (a) model’s geometry and (b) canard positions
060028-2
(a)
(b)
FIGURE 2 Computational domain and Mesh model isometric view of aircraft model
Completion of the computational model was done by completing the governing equation in the form of conservation of mass and momentum conservation. (1) The equation was discretized and completed using the finite volume method and using the coupled scheme for pressure–velocity coupling completion. The discrete method used the 2nd upwind. The coupled scheme algorithm completed the momentum equation and pressure-based continuity pressure equation. The solution of the turbulence equation referred to previous research in which the use of the D-DES model gave the best value to get qualitative and quantitative in the case of the flow on the aircraft model.13
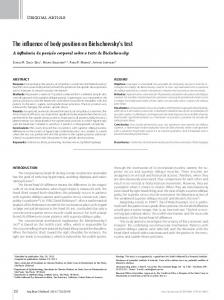
RESULT AND DISCUSSION The results of the study were presented in the values of the lifting force coefficient (Cl) obtained from numerical simulations (CFD) compared to the results of water tunnel experiments as shown in Figure 3a. In the figure could be seen the effect of increasing the lifting forced by the addition of a canard at various positions. Overall, the addition of a canard would increase the lifting coefficient of the aircraft model by about 5.0–12.1%. In the low angle of attack (AoA) area (below 200), the values of Cl for each model were similar. When the AoA was higher than 200, then the values of the coefficient of lifting force began to differ. In the model aircraft without using a canard, the value of Cl increased up to an angle of attack of 350 and after that decreased. This result had a good similarity to the experimental results using a water tunnel. In the configuration with the addition of a canard, the lift coefficient still increased until the maximum AoA was above 400. The increase of maximum AoA in the canard configuration indicates that at an angle higher than 35 0 there was still additional lifting force and no stall yet. Almost all canard configuration configurations used could delay the occurrence of a stall, but in detail, there were differences in the characteristics of the Cl values for each configuration. To see in detail the changes that exist at a higher angle, then for 300–500 AoA a detailed observation of lift coefficient values was presented. Figure 3b and c showed the difference in the coefficient of lift force in detail for 300–500 AoA for a change coplanar/horizontal and vertical canard position on the main wing. Figure 3b showed the difference in Cl values for the coplanar canard position. In the coplanar position, the canard position approaching the main wing (case A0) would produce the highest Cl value. It also caused the maximum AoA value to shifted at a higher angle of attack, so this configuration would be better able to maintain lift. Figure 3c showed the value of lift coefficients in AoA detail with canard position variation as vertically. In the picture it could be seen that as the position parallel to the main wing shifts upwards, a slight increase in lift force was caused. However, the increase in position did not necessarily increase Cl: at vertical distance configuration of ½ tc and tc (cases A1 and A2) showed the highest increase of Cl value, and then decreases.
060028-3
(b)
(a)
(c)
FIGURE 3 Lift coefficient (Cl) at (a) all various canard position and (b), (c) detail Cl at coplanar and vertical position
(a)
(b)
(c)
FIGURE 4 Visualization of vortex core path-line and vortex breakdown location (VBL) on the model without canard: (a) Side view, (b) top view, and (c) visualization from water tunnel (experiment).
To validated the computational model, experiments using the GAMA water tunnel (WaTu) test facility that had been configured (referring to the previous study) as a comparison.19 A validation was done by measuring the Cl and observing the phenomenon of vortex cores and the occurrence of vortex breakdown along the main wing on a noncanard model. Next was to compare the results with the simulation results. The similarity of the Cl values was good, as shown in Figure 3a. The visualization of the vortex core and the position of the vortex breakdown could be seen in Figure 4. The results of simulation and experiment was a good result for qualitative (Cl) and quantitative (vortex visualization). The canard position changing in the horizontal direction caused a difference in the lift coefficient (Cl). This was influenced by the formation of canard flow interactions. Figure 5a, b, and c showed the path-line formation of the vortex core canard for horizontal canard position changes (Cases A0, B0, and C0). The vortex cores formed from the canard would interact with the main wing vortex cores and merge. In the canard position closest to the main wing, the flow interaction occured faster and above the main wing. A farther away canard position caused the trajectory of the canard vortex core to move upwards, and the interaction was going backward from the main wing. Figure 5d and e showed the pressure distribution at the locations of 21 and 43% of the main wing chords for each canard position
060028-4
in a horizontal direction with 400 angles of attack. From the figure it could be seen that the closest canard position configuration resulted in the largest wing cross-section pressure difference, especially at 21% chord location.
(a)
(b)
(d)
(c)
(e)
FIGURE 5 Visualization of vortex core: (a) A0, (b) B0, and (c) C0; and pressure distribution at horizontal variety canard position at AoA 400: (a) 21% and (b) 43 % chord
(a)
(b)
(d)
(c)
(e)
FIGURE 6 Visualization of vortex core: (a) A0, (b) A2, and (c) A4; and pressure distribution at horizontal variety canard position at AoA 400: (a) 21% and (b) 43 % chord
For a 43% chord location, the pressure difference was almost the same, but the canard position slightly forward produced a higher value than the other positions. This indicated that the canard position approaching the wing would produce the largest Cl, but shifting positions slightly more forward will maintain the occurrence of more vortex cores backward. Figure 6 presented the path-line of the canard’s vortex core for variations in vertical position (cases A0, A2, and A4) at an AoA of 400. The interaction of the canard's vortex flow in parallel position caused a lower trajectory and faster merge to the wings, as shown in Figure 6a, b, and c. A higher canard position caused merging backward over the wing. The pressure distributions showed that the canard position above had a bigger pressure
060028-5
difference at the forward position (chord 21%). At a 43% chord distance of the top canard position (A4), and without a canard, there were fluctuating flows that indicate the occurrence of vortex breakdown. In the horizontal position, the canard position close to the main wing (the case with indices A and B) causes a maximum Cl value shift at a larger AoA. This displacement indicates delay of the stall. The vertical canard position above the main wing contributes to the addition of a larger lifting force. However, at the top canard placement indicated, a faster vortex breakdown occured. Therefore the addition of the canard position at a vertical distance does not necessarily increase the lift force. At the highest position (case A4) there was a value lower than for the canard position below it (cases A1, A2).
SUMMARY The results showed that the addition of canard would be able to increase the lifting force coefficient by up to 5%–12.1%. The position of the canard on the main wing affects the vortex flow interaction, the value of the lift coefficient, and maximum angle of attack. A canard position on the upper side and adjacent to the main wing gave the best value of the maximum Cl value shifted between 5–10 degrees, which indicated a stall delay in the aircraft model.
ACKNOWLEDGMENT This research was supported by Universitas Gadjah Mada, the Ministry of Research, Technology and Higher Education, the Republic of Indonesia.
REFERENCES 1. 2. 3. 4. 5. 6. 7. 8. 9. 10. 11. 12. 13.
14. 15.
E. C. Polhamus, A Concept of The Vortex Lift of Sharp-Edge Delta Wings Based on a Leading-Edge-Suction Analogy (National Aeronautics and Space Administration, Washington, D.C., 1966), pp. 154-159. D. Hummel and H. Oelker, J. Aircr. 31, 868-878 (1994). I. H. Tuncer and M. F. Platzer, “A computational study of a close-coupled delta canard-wing-body configuration” in 14th Appl. Aerodyn. Conf. (American Institute of Aeronautics and Astronautics, New Orleans, LA, 1996), pp. 39-44. I. H. Tuncer and M. F. Platzer, J. Aircr. 35, 554–560 (1998). F. Leopold, F. Jagusinski, and C. Demeautis, “Experimental inversitagtion of shock/vortex interaction for slender canard configurations at supersonic speed” in 20th Int. Congr. Instrum. Aerosp. Simul. Facil. 2003. ICIASF ’03, edited by M. J. Gaillard et al. (IEEE Publisher, New York, 2003), pp. 247–257. Z. Guoqing, Y. Shuxing, and X. Yong, Chinese J. Aeronaut. 23, 312–319 (2010). S. Samimi, A. R. Davari, and M. R. Soltani, IJST, Trans. Mech. Eng. 37, 133–147 (2013). A. R. Davari, M. Hadidoolabi, M. R. Soltani and M. Izadkhah, Sci. Iran. 22, 743–755 (2015). A. I. Hale, J. Undergrad. Engineer. Res. 3(2) (2009). M. R. Soltani, F. Askari, A. R. Davari, and A. Nayebzadeh, Sci. Iran. Trans. B, Mech. Eng. 17, 136–145 (2010). M. D. Manshadi, A. Sharafi and M. R. Soltani, J. Aerosp. Sci. Technol. 9, 15–23. 9 (2012). L. P. Erm, “Recent aerodynamics research in the DSTO water tunnel” in 16th Australas. Fluid Mech. Conf. (School of Engineering, The University of Queensland, Crown Plaza, Gold Coast, Australia, 2007), pp. 381– 384. S. B. Wibowo, Sutrisno and T. A. Rohmat, “Pengaruh jumlah jaring pada model komputasi fenomena pusaran pada model pesawat tempur sayap delta (in english: Influence of net number on vortex phenomenon computation model on delta wings fighter aircraft” in Quantum: National Seminary of Physics and Educational Physics, edited by Quantum team (University of Ahmad Dahlan, Yogyakarta, 2018), pp. 55-59. G. Erickson, J. Aircr. 19, 442–448 (1982). L.P. Erm and M. V Ol, An Assessment of the Usefulness of Water Tunnels for Aerodynamic Investigations (Fishermans Bend, Victoria, 2012), pp. 132-139.
060028-6
16. J. H. Delfrate, F. A. Zuniga, and D. F. Fisher, “Summary of in-flight flow visualization obtained from the NASA high alpha research vehicle” in Vor. Flow Aerodyn. (NASA Dryden Flight Research Facility; Edwards, CA, United States, 1991), 149-155. 17. O. V. Jr. Cavazos, “A Flow Visualization Study of LEX Generated Vortices on a Scale Model of a F/A-18 Fighter Aircraft at High Angles of Attack” in Calhoun: The NPS Institutional Archive Dspace Repository (American Institute of Aeronautics and Astronautics, Reston, VA, 1990), pp. 167-169. 18. R.D. Firmansyah, S.B. Wibowo, and R. Mareta, J. Sains Teknol. 6, Ganesha Educational University (2017). 19. S. B. Wibowo, Sutrisno, T. A. Rohmat, A. Zainuri, R.S. Firdaus, R. Mahardika, and F.N. Wega, “An investigation into the use of GAMA water tunnel for visualization of vortex breakdown on the delta wing” in 9th Int. Conf. Thermofluids (AIP Conference Proceedings Journal, Yogyakarta, Indonesia, 2018).
060028-7