Drewno. Pr. Nauk. Donies. Komunik. 2013, vol. 56, nr 189 DOI: 10.12841/wood.1644-3985.015.05
Jan Bocianowski, Krzysztof Joachimiak, Adam Wójciak1
THE INFLUENCE OF PROCESS VARIABLES ON THE STRENGTH PROPERTIES OF NSSC BIRCH PULP. TOWARDS THE LIMITS OF OPTIMIZATION: PART TWO – THE EFFECT OF TEMPERATURE AND COOKING TIME The aim of this work was to establish the best mechanical and strength properties of NSSC pulps using operating conditions at which the lowest (optimal) spent liquors, cooking temperature and time of treatment could be obtained. Minimal and maximal limits of independent variables were proposed using real mill conditions as a starting point. The analyzed variables were: cooking time (13 to 15.5 min), cooking temperature (from 172 to 179°C), liquor- to- wood ratio (from 1.2 to 2.2). In spite of the narrow ranges of controlled cooking variables, the large database and combined statistical methods (analysis of variance, parallel coordinates, principal component analysis) made it possible to distinguish the limits of the optimal ranges of the studied technological factors which determined the tested pulp’s properties. The mechanical and strength testing of the pulp’s sheets showed that the analyzed time, temperature and liquor-to-wood ratio influenced the CMT, SCT, Tear strength and, to some extent, Burst strength. Keywords: NSSC, cooking parameters, pulp, statistical methods
Introduction The high inorganic ratio in spent liquors as compared to the typical sulfite or kraft pulping processes, and the difficulties with the recovery of chemicals makes neutral sulfite semi-chemical pulp (NSSC) production relatively burdensome from a technological and environmental point of view [Area et al. 2001, 1997). The results of studies presented in Part One of this paper [BocianowJan Bocianowski, University of Life Science, Poznan, Poland e-mail:
[email protected] Krzysztof Joachimiak, University of Life Science, Poznan, Poland e-mail:
[email protected] Adam Wójciak, University of Life Science, Poznan, Poland e-mail:
[email protected]
72
Jan Bocianowski, Krzysztof Joachimiak, Adam Wójciak
ski et al. 2012] showed the relationship between liquor-to-wood ratio used during cooking and the strength properties of NSSC pulps. This research indicated that it is possible to obtain acceptable values of CMT, SCT, Burst and Tear strength of NSSC pulps even if they have been cooked at a lower liquor-to-wood ratio (l/w). Liquor-to-wood ratio is only one among a number of important technological variables determining pulp properties during pulping. The aim of this work was to examine the influence of other important operating factors (temperature, cooking time) on the mechanical and strength properties of NSSC pulp paper sheets (CMT, SCT, Burst and Tear) obtained, using mathematical and statistical methods.
Materials and methods Industrial chips obtained from birch trees growing in Poland (Betula verrucosa) were used as the raw material. The chips included the following fractions: >O45 – 1.1%, >II8 – 5.7%, >O7 – 91.0%, >O3 – 2.1%, the rest – 0.1% (O and II mark holes and slot diameter in mm according to the Brecht-Holl classification) [SCAN–CM–40:01]. All cooking experiments were carried out on an industrial NSSC production line with a controlled capacity and with a 82% average yield from the process. The most important units composing the pulp line were: the atmospheric chip bin, plug screw feeder, pressurized impregnator, continual digester and cooked chip disintegration refiner. The wood, after air-release at the chip bin, was squeezed by the screw feeder and then pushed to the pressurized impregnator. The impregnator was connected directly with the digester and this construction had the same operational pressure of 9.2 bar. The initial cooking liquor concentration was the same during all the experiments (165g/dm3 Na2SO3; 50g/dm3 Na2CO3). Two variants of liquor-to-wood ratio (l/w 1.5 and 1.8) were used during all the experiments with different temperatures and times of cooking. After cooking, the chips were defibred by the disintegration refiner with 36% of concentration (more details concerning the production line are presented in Part One of the paper). For each studied technological parameter (liquor-to-wood ratio, time and temperature of cooking, red liquor addition), the obtained pulp samples were refined in a PFI laboratory mill to reach four Schopper-Riegler degrees: 20ºSR, 25ºSR, 30ºSR and 35ºSR. After Schopper-Riegler freeness tests, hand sheets were made from all of the pulp samples. From the dried and conditioned paper sample, four strength properties were examined: SCT – short crush test [EN/ISO 9895], CMT – Concora medium test [EN/ISO 7263], Tear strength [EN 21974] and Burst strength [EN/ISO 2758].
The influence of process variables on the strength properties of NSSC birch pulp. Towards the limits ...
73
Temperature
When studying the influence of temperature on the pulp properties, four steps were taken. Each step assumed a cooking temperature lower by 2ºC than the previous one, starting from 179ºC at the top and 178ºC at the bottom of the digester. The following pairs of temperatures were used in these studies: 179/178ºC, 177/176ºC, 175/174ºC and 173/172ºC. The total number of observations used for the temperature analysis: CMT (320), SCT (479), Burst strength (363), Tear strength (98). Cooking time
Three adjusted cooking times were examined – 13, 14.5 and 15.5 minutes. Longer and shorter times were not possible to set during the pulp manufacture because of the danger of the digester plugging and the insufficient drive unit to get cooking shorter than 13 minutes, respectively. The temperature of cooking was: 179ºC at the top and 178ºC at the bottom of the digester. The total number of observations used for the cooking time analysis: CMT (243), SCT (137), Burst strength (79), Tear strength (25). Statistical analysis
Firstly, the normality of the distribution of CMT, SCT, Tear and Burst was tested using Shapiro-Wilk’s normality test [Shapiro, Wilk 1965]. A three-way analysis of variance (ANOVA) was carried out to determine the effects of the liquid-to-wood ratio, Schopper-Riegler numbers as well as all the interactions with the variability of CMT, SCT, Tear and Burst strength development. The least significant differences (LSDs) for each trait were calculated and, on this basis, homogeneous groups for the analyzed traits were determined. The relationships between CMT, SCT, Tear and Burst were estimated on the basis of correlation coefficients. The relationship between the analyzed properties was presented in the form of a scatterplot [Kozak et al. 2010]. The application of principal component analysis (PCA) made it possible to find on the plane the graphic dispersion of pairs of liquid-to-wood ratio and Schopper-Riegler degrees characterized with respect to all properties treated together. The parallel coordinate plot is proposed as an efficient tool for liquid-to-wood ratio × Schopper-Riegler freeness interaction visualization [Kozak 2010]. All analyses were performed with the procedure in GenStat v. 10.1 [GenStat 2007].
Results and discussion Small variations in operating conditions tested in industrial-scale production suggested the need to search first for significant differences between all results concerning strength properties of pulp recorded at different temperatures, and then
74
Jan Bocianowski, Krzysztof Joachimiak, Adam Wójciak
investigate them for different pulping times (all analysis at diferent SchopperRiegler (SR) freeness numbers). Data was collected from two different cycles of cooking, therefore the application of typical DOE was not convenient. Aware of the strong interaction between temperature and cooking time, it was decided that both technological factors should be varied separately. As with the previous studies [Bocianowski et al. 2012], CMT and SCT, along with Burst and Tear strength properties, were admitted as the most appropriate indices for the evaluation of technological efficiency. The results of the analysis of variance inserted in table 1 showed that, with the exception of Tear strength, the rest of the strength properties differed significantly with regard to cooking temperature as well as to SR freeness. As could be expected, refining (SR tests) also caused significant differences to the development of all the tested strength properties. However, CMT and Tear did not differ significantly with regard to liquor-to-wood ratio. Table 1. Mean squares from the three-way analysis of variance (ANOVA) for the experiment with temperature and SR freeness (for l/w 1.5 and 1.8)
Tabela 1. Średnie kwadraty (śk) z trójczynnikowej analizy wariancji (ANOVA) dla doświadczeń nad wpływem temperatury warzenia i smarności SR (dla modułów 1,5 i 1,8) Source of variation Źródło zmienności
Temperature (T) Temperatura (T)
l/w
moduł
SR SR
l/w × T
moduł × T
l/w × SR
moduł × SR
T × SR T × SR
l/w × T × SR
moduł × T × SR
Residual Błąd
CMT
SCT
CMT
df ss 3 1
mean square średni kwadrat
1150.3*** 113.5
Burst
SCT
df
mean square
ss
średni kwadrat
3
Tear
Przepuklenie
df
mean square
ss
średni kwadrat
1.218***
3
1
0.495*
Przedarcie
df
mean square
ss
średni kwadrat
96879***
3
4458
1
53190***
1
9651
3
6827.2***
3
2.677***
3
75540***
3
64501***
3
3321.4***
3
0.22
3
353
3
8959*
3
853.9***
3
0.264
3
2065
3
41192***
9
797.4***
9
0.303**
9
2898**
9
13636***
27
122.7
27
0.194
27
1752
27
3397
270
109.7
429
0.097
313
1135
48
1617
l/w – liquid-to-wood ratio; moduł – moduł cieczy warzelnej SR – freeness in °SR (Schopper Riegler); SR – smarność w stopniach °SR (Schopper Riegler) df – number of degrees of freedom; ss – liczba stopni swobody * – significant at level of 0.05; istotne na poziomie 0,05 ** – significant at level of 0.01; istotne na poziomie 0,01 *** – significant at level of 0.001; istotne na poziomie 0,001
The influence of process variables on the strength properties of NSSC birch pulp. Towards the limits ...
75
The change of l/w from 1.5 to 1.8 influenced SCT slightly and much more the pulp’s Burst strength. These results indirectly confirm the possible positives of pulping with a lower content of neutral-sulfite cooking liquor. The liquor saving did not necessarily worsen the pulp’s strength development, which depends mainly on refining. One interesting point is that the temperature and l/w ratio together strongly influenced CMT properties. Furthermore, the most significant interactions between the tested process variables (l/w vs. SR and temperature vs. SR) were obtained for CMT indices. Among others, only the SCT and B strength showed significant interactions between cooking temperature and refining. Although Tear strength was also prone to the above-mentioned interactions, the results were not as important as CMT, from the point of view of NSSC pulp’s final application (mainly, corrugated medium). The data in table 2 show the mean values and least significant differences when various pulping times and the l/w ratio at different Schopper-Riegler (SR) freeness were analyzed. Table 2. Mean squares from the three-way analysis of variance (ANOVA) for experiment with l/w (1.5 and 1.8), time (t) and SR freeness Tabela 2. Średnie kwadraty z trójczynnikowej analizy wariancji (ANOVA) dla doświadczeń nad wpływem modułu cieczy warzelnej (1,5 i 1,8), czasu warzenia (t) i smarności SR Source of variation Źródło zmienności
l/w
moduł
time czas SR SR
l/w × time
moduł × czas
l/w × SR
moduł × SR
time × SR czas × SR
l/w × time × SR
moduł × czas × SR
Residual Błąd
Degrees of freedom
CMT
1
2173.2***
2
939.3***
3
8237.7***
Liczba stopni swobody
CMT
SCT SCT
Burst
Tear
Przepuklenie
Przedarcie
0.529*
1185
2498
0.212
8823***
997
3.064***
94993***
77777***
2
100.1
0.079
8658***
4506
3
572.2**
0.153
7395***
6054
6
196.4
0.569***
3927**
11005***
6
462.9***
0.328*
3268*
7448*
112.2
0.132
1150
2399
219
l/w – liquid-to-wood ratio; moduł – moduł cieczy warzelnej time – cooking time; czas – czas gotowania SR – freeness in °SR (Schopper Riegler); SR – smarność w stopniach °SR (Schopper Riegler) * – significant at level of 0.05; istotne na poziomie 0,05 ** – significant at level of 0.01; istotne na poziomie 0,01 *** – significant at level of 0.001; istotne na poziomie 0,001
76
Jan Bocianowski, Krzysztof Joachimiak, Adam Wójciak
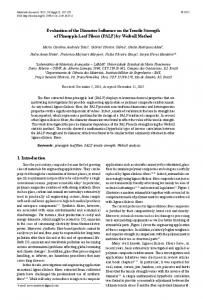
Time of cooking strongly affected the CMT and Burst strength. The latter (B) was the only property influenced by all the studied interactions (cooking time vs. l/w ratio and SR refining, l/w vs. SR refining). There were no interactions between time and l/w ratio, however the liquor content (l/w 1.5 and 1.8) affected the CMT indices significantly, including participation in the strong interaction between the cooking time and SR refining. The only interaction influencing SCT strongly was the cooking time vs. SR refining. The results inserted in table 2 show how complex the changes caused by such small variations in the cooking time were and why the process analysis needed more profound, visualizing statistical methods. The evaluation of significant differences (analysis of variance) did not show the strength development tendencies of the pulp, thus Principal Component Analysis (PCA) was used as a tool facilitating visual comparison of the data sets obtained after the conducting of experiments at different temperatures as well as cooking times. As seen in the key to fig. 1 which presents the results of the PCA obtained for studies on cooking temperature, only 1.61% of the information from the primary data (100% – 74.76% – 23.63%) was lost after transformation from the four-dimensional space to the two-dimensional plane, therefore the observed arrangement of results may be regarded as close to the original. In fig. 1 we can distinguish several groups of points which have formed similar data collections, representing all the analyzed strength properties for two l/w ratios, all ranges of SR freeness and four different temperature sets. The PCA analysis shows that temperature together with l/w and refining are important factors differing the results of pulp’s strength properties. The visualization makes it possible to distinguish two main groups of data: the first one comprising the pulps cooked at temperatures 175/174°C or above for both l/w ratios (1.5 and 1.8), and the second one the set of points obtained after cooking mostly at l/w 1.5 and the temperature 173/172°C. The last group of scattered data indicates that it is refining that substantially differentiates the strength properties of pulps cooked at such operating conditions (l/w 1.5 and temp. 173/172°C). A closer look at the PCA plot also shows that some of the results are clustered according to higher temperature (range 179/178°C – 175/174°C) and SR freeness (25 – 35°SR) and they are all studied for both l/w ratios: 1.5 and 1.8. Pulps cooked at 179/178°C and at a 1.8 l/w ratio in particular form a similar group (except for SR 20) representing the approximated strength properties. The most interesting aspect here is that pulps cooked at the lower l/w of 1.5 and temperatures 175/174°C and above, may attain similar strength properties as the same pulps cooked with a higher liquor volume (l/w 1.8). We can distinguish at least three groups of similar data obtained for both l/w ratios: 1.5 and 1.8. This is another result indicating the possibility of cooking with a low liquor-to-wood ratio.
The influence of process variables on the strength properties of NSSC birch pulp. Towards the limits ...
77
Fig. 1. Confirmation of combinations of liquid-to-wood ratio stages, SR freeness and different temperatures set for CMT, SCT, Tear and Burst strength
Rys. 1. Potwierdzenie kombinacji modułów cieczy warzelnej, smarności masy (SR) i różnych temperatur warzenia w przestrzeni dwóch składowych głównych dla oznaczeń CMT, SCT, oporu przedarcia i przepuklenia
The PCA analysis also made it possible to reduce the set of observations (all analyzed strength indices for 1.5 and 1.8 l/w ratios and for the whole range of studied SR freeness) and to answer the question of whether the little differences in cooking time influence the pulp’s mechanical properties. Fig. 2 represents a visualization of the above-mentioned coordinates in a two-dimensional data space. Only 1.45% of the information from the primary data (100% – 73.81% – 24.74%) was lost following transformation from the four-dimensional space to the twodimensional plane, therefore the observed arrangement of data is suitable for analysis as it is close to the original. As seen in fig. 2, although most of the data is relatively scattered, several regularities can be distinguished which show the influence of cooking time on the properties of the pulp. First of all, the time of cooking affected the strength of pulps refined to low freeness (20°SR) more significantly. In this case, the differences were more distinct for pulps processed at the 1.8 than at the 1.5 liquor-to-wood ratio (20°SR). The different cooking times also influenced the strength properties of the pulps processed at both studied l/ws (1.5 and 1.8) after refining to 25–30°SR. However, in the case of refining to 30°SR, that tendency was stronger for the pulp cooked at 1.8 than at 1.5 l/w. These observations may be explained by the better impregnation and higher rate of diffusion of the active liquor components into wood chips with the increasing neutral sulfite liquor volume, but this deserves experimental confirmation. The influence of cooking time on the strength of pulps refined to the highest freeness (35°SR) were relatively small, independent of the liquor-to-wood ratio used. Taking into consideration the fact that the similarities of the analyzed data sets (cooking time, l/w and freeness)
78
Jan Bocianowski, Krzysztof Joachimiak, Adam Wójciak
along the OX axis (the first principal component) are weaker than along the OY axis (the second principal component) it may even be observed that highly refined pulps (30–35°SR) cooked at longer times (14.5–15.5 min) show a tendency to form similar groups (fig. 2) (15.5/35/1.8; 15.5/30/1.8; 15.5/35/1.5; 14.5/35/1.5).
Fig. 2. Confirmation of combinations of liquid-to-wood ratio stages, SR freeness and different cooking times set for CMT, SCT, Tear and Burst strength.
Rys. 2. Potwierdzenie kombinacji modułów cieczy warzelnej, smarności masy (SR) i różnych czasów warzenia w przestrzeni dwóch składowych głównych dla oznaczeń CMT, SCT, oporu przedarcia i przepuklenia
The most important application of the tested NSSC pulp is the production of corrugated medium, and that is why there has been a focus once more on an analysis of CMT and SCT indices. The data from tables 3 and 4 show the mean values and the least significant differences (LSD’s) for CMT, and separately SCT strength for experiments with different l/w, temperatures and cooking times. The data from tables 3 and 4 fluctuates, although for most of the SR ranges studied (from 20 up to 35) it shows a general increase in value according to temperature. One of the reasons for this may be connected with the specific character of vapour-gas phase cooking at a low l/w ratio, which was commented on in the first part of this paper. In spite of small differences in temperatures, we can observe the LSD’s for both tested liquor-to-wood ratios (table 3). Generally, the highest CMT values were obtained during the experiment with various temperatures after cooking at l/w 1.5. In this case, the increased CMT values appeared in the range of temperatures: 175/174 – 177/176°C. The pulps cooked at 1.8 l/w reached the best CMT strength after processing at 179/178°C. The same tendency (in relation to temperatures and both studied l/w ratios) were observed for SCT strength. Although the highest SCT values were attained at l/w 1.8 (35°SR), the results obtained for pulps refined to 30°SR have a more practical significance (see comments in Part One of this paper, Bocianowski et al. 2012).
SR
LSD0.05
Średnia
Mean
248.4
238.7
4.83 240.5efgh
8
mean
średnia
9
cv
6.6
6
3.42
3.64
243.3
średnie
mean
cv
173/172
mean
średnie
175/174
cv
mean
średnie
177/176
Temperatura
Temperature
CMT
CMT
cv
mean
średnie
179/178
średnie oznaczone tymi samymi literami nie różnią się istotnie
cv
253.4
248.9
239.1
229.8
10
Średnia
Mean
Średnie
Mean
l/w 1.8 moduł 1.8
247.1cde 4.16
244.8def
3.41 242.6efg
4.55 238.6fgh 4.51
7
cv
T: 3.85; SR: 3.85; T´SR: 7.83
269.4a
251.1bcd
239.2fgh
224.4i
6
mean
średnia
179/178
means followed by the same letters are not significantly different
240.1
2.99
256.0b
3.27
35
253.6bc
236.1gh 3.41 238.1fgh 5.34
3.77
5
cv
245.4def 4.25
234.6h
4
mean
średnia
30
2.43
3
cv
177/176
Temperatura (T)
175/174
25
2
222.5i
1
średnia
mean
173/172
20
SR
Temperature (T)
CMT
CMT
l/w 1.5 moduł 1.5
4.82
5.75
5.32
7.35
14
cv
5.003
5.142ab
5.156ab
5.165ab
4.586c
15
mean
średnia
4.9
7.81
5.68
8.86
16
cv
5.173
5.205ab
5.283a
5.205ab
4.989b
17
mean
średnia
T: 0.114; SR: 0.114; T×SR: 0.233
5.061
5.154ab
5.199ab
5.231a
4.737c
13
mean
średnia
5.4
5
5.3
6.3
18
cv
179/178
mean
średnie
cv
173/172
mean
średnie
cv
175/174
mean
średnie
cv
177/176
Temperatura
SCT
Temperature
SCT
mean
średnie
cv
179/178
średnie oznaczone tymi samymi literami nie różnią się istotnie
6.41
6.14
6.43
6.67
12
cv
177/176
Temperatura (T)
175/174
Mean
Średnie
5.18
5.111
5.076
4.718
19
Mean
Średnia
means followed by the same letters are not significantly different
4.828
5.214ab
4.798c
4.699c
4.592c
11
mean
średnia
173/172
SCT
Temperature (T)
SCT
Tabela 3. Wartości średnie i współczynniki zmienności (cv) wskaźników CMT i SCT dla różnych temperatur warzenia i smarności (SR) masy (dane dla modułów1,5 i 1,8)
Table 3. CMT and SCT values and coefficients of variations (cv) for experiment with different temperatures and SR freeness (data for l/w 1.5 and 1.8)
The influence of process variables on the strength properties of NSSC birch pulp. Towards the limits ...
79
233.9g
234.3
35
Mean Średnie
LSD0.05
245.9bcd 2.32 238.9defg 2.7
245.9
248.8bc
242cdef
8
2.64
3.92 3.62
4
2.86
2.1
9
Means followed by the same letters are not significantly different Średnie oznaczone tymi samymi literami nie różnią się istotnie
250.9
260.1a
248.5bc
248.7bc
4.79 246.3bcd
7
T: 4.51; S: 4.51; T×S: 8.29
3.67 244.3bcde 2.88
234.9
250.4b
6
3.73 242.4bcdef 6.72
4.39
30
235.5fg
221h
236.6efg 3.5
3.47
25
5
220.8h
4
20
3
2
1
Tabela 3. Ciąg dalszy
Table 3. Continued
246.8
6.50
5.165
5.316 a
T: 0.153; S: 0.153; T×S: 0.391
4.993
4.29
5.13
18
6.48
5.48 5.272 ab 5.01
5.162 abcd
4.942 abcdef
17
19
5.058
5.014
4.942
4.785
Means followed by the same letters are not significantly different Średnie oznaczone tymi samymi literami nie różnią się istotnie
4.766
6.92 4.875
4.30
4.976 abcdef
4.721ef
5.216 abc
5.005 abcde
7.59
4.999 abcde
6.27
5.41
4.907 bcdef 4.838 cdef
16
15
6.24 4.777 def 6.15
14
4.961 abcdef
13
6.46 4.646 ef 7.80
12
4.585 f
11
243.8 4.792 def 5.47
240.8
234.6
10
80 Jan Bocianowski, Krzysztof Joachimiak, Adam Wójciak
The influence of process variables on the strength properties of NSSC birch pulp. Towards the limits ...
81
Fig. 3. Parallel coordinate plot for sixteen objects (1.5 liquid-to-wood ratio stages; combinations of SR freeness and cooking temperature) and four traits (CMT, SCT, Burst and Tear strength) Rys. 3. Wykresy współrzędnych równoległych dla szesnastu analizowanych obiektów (moduł 1,5; kombinacje różnych czasów warzenia i smarności masy) i czterech cech (CMT, SCT, przepuklenie i opór przedarcia)
Fig. 4. Parallel coordinate plot for sixteen objects (1.8 liquid-to-wood ratio stages; combinations of SR freeness and cooking temperature) and four traits (CMT, SCT, Burst and Tear strength) Rys. 4. Wykresy współrzędnych równoległych dla szesnastu analizowanych obiektów (moduł 1,8; kombinacje różnych temperatur warzenia warzenia i smarności masy) i czterech cech (CMT, SCT, przepuklenie i opór przedarcia)
82
Jan Bocianowski, Krzysztof Joachimiak, Adam Wójciak
Taking this into consideration, again the pulps cooked at 1.5 l/w showed better SCT properties in comparison to those treated at 1.8 l/w. These observations also confirm the comparison of the parallel coordinate plots (PCPs) for both l/w (1.5 and 1.8). As seen in fig. 3 and fig. 4, the pulps processed at 1.5 l/w showed more correlations (e.g. orientations of lines close to the parallel and with a similar angle of inclination) between the variables than pulps cooked at a 1.8 liquor-to-wood ratio. In the case of 1.5 l/w, only five breaking lines [175/174/35; 179/178/30; 173/172/25; 175/174;20; 177/176/20] can be distinguished, as opposed to nearly one half of crossing lines of all the studied relationships for a 1.8 l/w. At the same time, the visualization shows that the best pulp strength properties after cooking at 1.5 l/w (CMT, SCT and B) were gained in the range of 175/174°C – 177/176°C and for SR freeness 30° (the data for 35°SR were excluded due to the reasons mentioned earlier – [Bocianowski, Joachimiak, Wójciak 2012]). It is worth noticing that the presented parallel coordinate plots also show correlations between other studied strength properties (Burst and Tear). Because Burst and Tear have less importance for the final pulp’s application, it was decided that these results should be described at the end of this work (table 5). The analysis of processing time was even more complicated than the evaluation of the cooking temperature. The results of gradually prolonged treatment differed with regard to the liquor-to-wood ratios used and the pulp’s SR freeness (table 4). Generally, in the case of 1.5 l/w, most of the highest CMT values were obtained after the shortest cooking time – 13 min (although it should be noted that the data for 30 – 35°SR did not indicate significant differences). The results for the CMT measurement of pulps processed at 1.8 l/w were more scattered (however, as with the 1.5 l/w, they did not show significant differences between 30 – 35°SR). The SCT strength (5.645) had increased a little as compared to the results obtained for 1.5 l/w (5.599), and for the same cooking time (14.5 min) and 30°SR freeness. The analysis of parallel coordinate plots (PCPs) for both l/w (1.5 and 1.8) did not show the distinct advantages of increased liquor-to-wood ratio use (fig. 5 and fig. 6). In the case of the plot for 1.8 l/w, more of the lines are parallel and have a similar angle of inclination than in the case of 1.5 l/w, but the comparison of data from table 4 and from both plots shows that the best pulp strength properties (CMT, SCT and Burst) were gained for the combination of 1.5 l/w, 13 min cooking time and 25°SR freeness. From a practical point of view, the results of the comparison analysis (based on LSDs) for Burst and especially for Tear strength are not as important as the CMT and SCT indices, therefore attention was paid to the generalities. Burst strength as a rule increased with an increase in temperature and reached a maximum for the pulps refined to 25°SR and cooked at 1.8 l/w (table 5). The pulps processed at 1.8 l/w also showed increased values of Burst strength with prolonged cooking time in comparison to the rather scattered data for pulps cooked at 1.5 l/w. The results for Tear strength (not shown) of pulps cooked at different temperatures and cooking times did not demonstrate significant dependencies, irrespective of the studied l/w ratio.
Średnia
20 25 30 35 Mean
3.67 3.12 3.75 5
246.6
cv
4.58 3.04 5.33 2.94
cv
237.4b 250.1a 247.5a 250.7a
mean
średnia
13
252.7
Mean Średnia
SR
238.2e 256.9abc 252.3bcd 262.9a
mean
średnia
13
20 25 30 35
SR
241.9
231.5bc 235.6b 252.2a 248.4a
średnia
CMT CMT Time (t) Czas (t) 14.5 mean
246.8
229.2f 250.1cd 248.4d 260.6ab
średnia
Time (t) Czas (t) 14.5 mean
CMT
CMT
6.28 3.13 4.14 2.53
cv
3.74 4.55 4.18 2.77
cv
244.5
226.7c 248.1a 252.8a 252a
średnia
15.5 mean
247.8
239.6e 244.2de 246.4de 259.1ab
średnia
15.5 mean
3.3 3.19 3.44 2.59
cv
4.36 7.77 7.29 3.62
cv
231.5 244.5 250.5 250.5
Mean
Średnia
moduł 1.8
l/w 1.8
235.7 250.7 249.1 260.9
Mean
Średnia
moduł 1.5
l/w 1.5
13
5.261
5.081def 5.341bcd 5.243bcde 5.374bc
mean
średnia
5.317
5.080de 5.422abc 5.198cde 5.568ab
mean
średnia
13
7.24 5.53 4.65 5.53
cv
5.78 8.13 7.3 6.26
cv średnia
5.275
4.847f 5.186bcde 5.645a 5.437ab
średnia
6.96 7 7.14 6.72
cv
SCT
6.41 6.88 7.24 6.96
SCT SCT Time (t) Czas (t) 14.5 mean cv
5.403
5.182cde 5.299bcd 5.599a 5.544ab
Time (t) Czas (t) 14.5 mean
SCT
5.237
5.025ef 5.146cde 5.364bc 5.422ab
średnia
15.5 mean
5.28
4.974e 5.506ab 5.510ab 5.171cde
średnia
15.5 mean
8.75 8.09 5.34 6.18
cv
6.78 7.23 6.09 8.16
cv
4.98 5.225 5.406 5.414
Mean
Średnia
5.079 5.407 5.424 5.42
Mean
Średnia
Tabela 4. Wartości średnie CMT i SCT oraz współczynniki zmienności (cv) dla różnych modułów, czasów warzenia (t) i smarności masy (SR)
Table 4. CMT and SCT values and coefficients of variations (cv) for experiment with different l/w, time (t) and SR freeness
The influence of process variables on the strength properties of NSSC birch pulp. Towards the limits ...
83
LSD0.05
Średnia
20 25 30 35 Mean
SR
LSD0.05
Średnia
20 25 30 35 Mean
SR
466.8
5.61 6.22 5.62 6.39 506.8
469.4def 507.4b 509.0b 546.3a
średnia
5.81 4.61 6.81 6.34 534.8
495.5bc 515.4b 564.6a 562.9a
średnia
490
429.4g 494.6e 502.6de 534.7bc
średnia
10.19 6.05 5.59 6.46 534
485.1ef 527.4cd 556.3ab 567.8a
średnia
6.72 5.94 7 4.95 552.6
504.5de 581.2a 559.8ab 565.8a
średnia
10.62 5.2 10.53 8.68
cv
moduł 1.8
179/178 mean
średnie oznaczone tymi samymi literami nie różnią się istotnie
10.19 4.13 3.63 4.67
cv
l/w 1.8
T: 14.57; SR: 14.57; T×SR: 28.52 means followed by the same letters are not significantly different
462.7
416.8g 458.1f 500.2de 480.7ef
średnia
173/172 mean
Temperature (T) / Temperatura (T) 175/174 177/176 mean mean cv cv
cv
7.2 4.74 6.04 15.32
179/178 mean
średnie oznaczone tymi samymi literami nie różnią się istotnie
444.2
410.8h 458.6efg 493.1bcd 515.5b
średnia
Temperature (T) / Temperatura (T) 175/174 177/176 mean mean cv cv
T: 12.33; SR: 12.33; T×SR: 25.11 means followed by the same letters are not significantly different
5.09 4.39 5.48 8.65
cv
400.1h 454.6fg 442.0g 480.6cde
średnia
173/172 mean
moduł 1.5
l/w 1.5
457.1 515.1 528.9 537.2
Średnia
Mean
443.5 483.7 501.7 526.4
Średnia
Mean cv 5.83 4.02 6.4 10.45
cv
509.1
459.0e 5.09 497.1d 8.84 522.3bcd 11.17 552.9a 4.84
średnia
15.5 mean
450.6 516.6 523.6 542.6
Mean
Średnia
497.4
478.4d 483.1d 515.5bc 512.8bc
średnia
4.01 6.17 6.07 6.34
522.2
485.5d 520.9b 553.2a 531.5ab
średnia
15.5 mean
6.79 5.19 3.66 8.3
cv
471.3 505.3 520.7 521.8
Mean
Średnia
średnie oznaczone tymi samymi literami nie różnią się istotnie
4.43 6.7 6.32 6.55
cv
Time (t) / Czas (t) 14.5 mean cv
t: 10.95; SR: 12.59; t×SR: 23.43 means followed by the same letters are not significantly different
495
448.6e 511.5bc 495.2cd 522b
średnia
13 mean
średnie oznaczone tymi samymi literami nie różnią się istotnie
514.8
454.4e 533.9abc 542.2ab 532.7abc
średnia
Time (t) /Czas (t) 14.5 mean cv
t: 13.31; SR: 15.22; t×SR: 27.50 means followed by the same letters are not significantly different
501.9
439.0e 6.2 517.0bcd 6.95 507.8cd 8.45 541.4ab 8.45
średnia
13 mean
Tabela 5. Wartości średnie przepuklenia i oporu przedarcia oraz współczynniki zmienności (cv) dla różnych temperatur warzenia i smarności masy (SR)
Table 5. Burst and Tear values and coefficients of variations (cv) for experiment with different temperatures and SR freeness
84 Jan Bocianowski, Krzysztof Joachimiak, Adam Wójciak
The influence of process variables on the strength properties of NSSC birch pulp. Towards the limits ...
85
Fig. 5. Parallel coordinate plot for twelwe objects (1.5 liquid-to-wood ratio stages; combinations of SR freeness and cooking time) and four traits (CMT, SCT, Burst and Tear strength)
Rys. 5. Wykresy współrzędnych równoległych dla dwunastu analizowanych obiektów (moduł 1,5; kombinacje różnych czasów warzenia i smarności masy) i czterech cech (CMT, SCT, przepuklenie i opór przedarcia)
Fig. 6. Parallel coordinate plot for twelwe objects (1.8 liquid-to-wood ratio stages; combinations of SR freeness and cooking time) and four traits (CMT, SCT, Burst and Tear strength)
Rys. 6. Wykresy współrzędnych równoległych dla dwunastu analizowanych obiektów (moduł 1,8; kombinacje różnych czasów warzenia i smarności masy) i czterech cech (CMT, SCT, przepuklenie i opór przedarcia)
86
Jan Bocianowski, Krzysztof Joachimiak, Adam Wójciak
Conclusions 1. Temperature, time of cooking and liquor to wood ratio are important factors influencing NSSC pulp strength properties. –– Pulp cooked at temperatures 175/174°C – 177/176°C and a low liquor-to-wood ratio (1.5) reached similar strength properties as the same pulp cooked with a higher l/w ratio (1.8). –– Burst strength increased with an increase in cooking temperature, irrespective of the liquor-to-wood ratio used during pulp processing. 2. A short cooking time (13 min) is beneficial for CMT and the SCT strength of pulp produced at a low liquor-to-wood ratio (1.5). The accepted pulp strength properties were obtained for the following combination:13 min cooking, 1.5 l/w ratio, 179ºC at the top and 178ºC at the bottom of the digester, (25°SR).
Acknowledgements The research paper was financed by The European Social Fund within the framework of The Integrated Program of the Regional Development Process.
References Area M.C., Felissia F.E., Nuñez C.E., Venica A., Valade J.L. [1997]: Upgrading Spent Liquors from NSSC Process, in proceedings of Symposium on Structure and Properties of Lignocellulosic Materials, Fifth Chemical Congress of North America, Cancun: 11–15 Area M.C., Felissia F.E., Venica A., Valade J.L. [2001]: NSSC process optimization: pulping, pulps and spent liquors, Tappi Journal 84 [4]: 1–12 Bocianowski J., Joachimiak K., Wójciak A. [2012]: The influence of process variables on the strength properties of NSSC birch pulp. Towards the limites of optimization: Part One – the effect of liquor ratio, Drewno 55 [188]: 17–33 GenStat [2007]: GenStat Release 10 Reference Manual. Lawes Agricultural Trust, Rothamsted, UK Kozak M. [2010]: Use of parallel coordinate plots in the multi-response selection of interesting genotypes. Communications in Biometry and Crop Science 5 [2]: 83–95 Kozak M., Bocianowski J., Sakwojć S., Wnuk A. [2010]: Call for more graphical elements in statistical teaching and consultancy. Biometrical Letters 47 [1]: 57–68 Shapiro S. S., Wilk M. B. [1965]: An analysis of variance test for normality (complete samples). Biometrika [52]: 591–611
List of standards EN 21974 [2002]: Paper – Determination of tearing resistance (Elmendorf method) EN/ISO 2758 [2005]: Paper – Determination of bursting strength EN/ISO 7263 [2008]: Corrugating medium – Determination of the flat crush resistance after laboratory fluting
The influence of process variables on the strength properties of NSSC birch pulp. Towards the limits ...
87
EN/ISO 9895 [2002]: Paper and board – Compressive strength – Short span test. SCAN–CM–40:01 [2001]: Wood chips for pulp production – Size distribution. Scandinavian Pulp, Paper and Board Testing Committee
WPŁYW ZMIENNYCH CZYNNIKÓW PROCESOWYCH NA WŁAŚCIWOŚCI WYTRZYMAŁOŚCIOWE BRZOZOWYCH MAS PÓŁCHEMICZNYCH (NSSC). W KIERUNKU GRANIC OPTYMALIZACJI: CZĘŚĆ DRUGA – WPŁYW TEMPERATURY I CZASU WARZENIA Streszczenie Celem pracy było ustalenie warunków obojętnosiarczynowego roztwarzania drewna brzozowego i otrzymywania mas półchemicznych (NSSC) o możliwie najwyższych właściwościach wytrzymałościowych, przy wykorzystaniu możliwie najniższych wartości czynników procesowych: modułu cieczy warzelnej, temperatury i czasu warzenia. Badania oparto na granicznych (minimalnych i maksymalnych) wartościach zmiennych niezależnych procesu roztwarzania drewna prowadzonego w warunkach przemysłowych. Analizowano następujące zmienne: czas warzenia (od 13 do 15,5 min), temperaturę warzenia (od 172 do 179°C) i moduł cieczy warzelnej (od 1,2 do 2,2). Pomimo bardzo wąskich zakresów kontroli zmiennych procesu roztwarzania, połączenie obszernej bazy danych i zestawu metod analizy statystycznej (analiza wariancji, analiza współrzędnych równoległych, analiza składowych głównych) pozwoliło na wyznaczenie optymalnych zakresów badanych czynników technologicznych determinujących testowane właściwości wytrzymałościowe mas włóknistych. Analizy statystyczne wykazały, że zmienne niezależne (moduł cieczy warzelnej, czas i temperatura warzenia) wpływały na poziom wartości badanych wskaźników wytrzymałościowych: CMT, SCT, oporu przedarcia i do pewnego stopnia również przepuklenia. Obniżając moduł cieczy warzelnej do 1,5, uzyskano masy włókniste o porównywalnych właściwościach wytrzymałościowych do mas warzonych przy wyższych modułach. Ograniczenie ilości dozowanego ługu warzelnego, a zatem możliwość zmniejszenia udziału substancji nieorganicznych do organicznych w ługu powarzelnym, może być korzystne z ekonomicznego punktu widzenia oraz dalszego przerobu ługu powarzelnego. Słowa kluczowe: NSSC, masa obojętnosiarczynowa, parametry roztwarzania, metody statystyczne