I. ELEZ GAROFULIĆ et al.: Croatian Journal of Food Technology, Biotechnology and Nutrition 7 (Special Issue) 9-13 (2012)
9
ORIGINAL SCIENTIFIC PAPER
The Influence of Processing on Physico-chemical Parameters, Phenolics, Antioxidant Activity and Sensory Attributes of Elderberry (Sambucus nigra L.) Fruit Wine Ivona Elez Garofulić1, Karin Kovačević Ganić, Ivana Galić, Verica Dragović-Uzelac, Zvonimir Savić2 1 2
Faculty of Food Technology and Biotechnology, University of Zagreb, Pierottijeva 6, 10000 Zagreb, Croatia Paying Agency for Agriculture, Fisheries and Rural Development, 10000 Zagreb, Croatia
Summary Production of elderberry fruit wine in Croatia is very limited and primarily conducted in small family farms, so the aim of this research was to determine the quality parameters of elderberry fruit and elderberry fruit wine as the final product. Six types of elderberry fruit wines (A, B, C, D, E and F) were produced with addition of different amounts of sugar (0, 0.5, 1, 1.5, 1.5 and 0.5 kg per 4 kg of elderberry fruit) and water (wines C, D, E). Quality of wines was evaluated using physico- chemical analysis, determination of phenolic compounds (total phenols, total flavonoids, hydrolised tannins and anthocyanins), antioxidant activity and sensory evaluation. According to the amount of total sugar after the fermentation, wines A, B, C and F can be considered as dry wines while wines D and E can be categorized as semi-dry wines. Total acidity in all wines was higher when compared to fresh elderberry fruit. Fresh elderberry fruit as well as wines had high concentration of phenolic compound with anthocyanins in the highest extent, although the winemaking process decreased the amount of phenolics. Both elderberry fruit and wine show high antioxidant activity and present a rich source of biologically active compounds. Consumers found the wine with high sugar amount and low acidity to be the most acceptable. Keywords: elderberry wine, physico-chemical parameters, polyphenols, antioxidant activity, sensory attributes
Introduction Elderberry (Sambucus nigra L.) is one of 1000 different species of wild plants that are widespread throughout Europe, and can be used in production of different food products. It’s one of the oldest and most popular medicinal herbs used, and all parts of elderberry tree have been valued for practical and medicinal use for thousands of years (bark, flower, leaf, and berry). The advantage of elderberry use in food is that it grows in natural conditions without direct human intervention, although in recent years it is also cultivated. In Croatia it is widespread and mainly grows as a wild plant, because there are only three elderberry plantations of greater significance. Recently the elderberry fruit is gaining in importance because of its nutritional value and due to its high content of biologically active compounds, particularly phenols (anthocyanins, flavonol glycosides, etc.), vitamins, minerals, pectin substances, organic acids and dietary fibre. Phenolic compounds are secondary plant metabolites that are specific to each fruit. They are developed during ripening and maturation, and significantly contribute to the sensory properties, and as a result of technological processes are subject to enzymatic and non-enzymatic oxidative reactions. Differences in the composition and quantity of phenols depend on many factors, such as geographic area of growth, degree of ripeness, variety, climate, and especially the conditions and methods of processing raw materials. Biologically active compounds of elderberry have certain functional properties and act against oxidative stress. Anthocyanins and other flavonoids show antioxidant, anticancer, immune-stimulant, antibacterial, antiviral and antiallergic properties (Dawidowicz et al., 2006). Therefore, their consumption may contribute to the prevention of degenerative diseases such as cardiovascular disease, cancer, stroke and diabetes (Ma and Kinner, 2002).
Anthocyanins found in elderberry are cyanidin glycosides, mainly cyanidin-3-sambubioside, cyanidin-3-glucoside, cyanidin-3-sambubioside-5-glucoside and cyanidin-3, 5-diglucoside (Goiffon et al., 1999; Youdim et al., 2000). Cyanidin-3glucoside and cyanidin-3-sambubioside make almost 85% in the total amount of anthocyanins (Goiffon et al., 1999). Raw elderberry fruits are not suitable for the consumption, but are suitable for industrial production of jam, jelly, sweets, cakes, candy, soft drinks and other products. Due to high presence of phenolic compounds, elderberry fruit is gaining importance in food industry, mainly as natural colorant in beverages and as antioxidant (Netzel et al., 2005). Industrial processing of elderberry is mostly represented in the countries of northern Europe. Cultivars with pronounced flavour, high content of anthocyanins and soluble solids are mainly used for processing. Production of fruit wine has a long tradition, especially in countries with climate that is not suitable for vines cultivation. In Croatia, fruit wine production does not have a significant place in overall wine production, but in the last decade there are different types of fruit wine on the market such as blackberry, strawberry, cherry, blueberry, black currant wine etc. Fruit in winemaking industry can be divided into wild and cultivated fruit. Wild fruit has higher content of acids, tannin compounds, more pronounced aroma and thus represents a valuable material for wine production (Chapman et al., 2005). In recent years a number of papers focused on production and quality research of different fruit wines, but there was no research on production and quality of elderberry fruit wine. Production of wine from the elderberry in Croatia is very limited and conducted in an uncontrolled manner on small family farms, so the aim of this study is to determine the basic quality parameters of raw elderberry fruit and elderberry wine as a final product.
Corresponding author:
[email protected]
CROATIAN JOURNAL OF FOOD TECHNOLOGY, BIOTECHNOLOGY AND NUTRITION
10
I. ELEZ GAROFULIĆ et al.: Croatian Journal of Food Technology, Biotechnology and Nutrition 7 (Special Issue) 9-13 (2012)
Materials and methods Samples Elderberry fruit harvested in September 2009 in Lika area in Croatia was used for research. After harvesting, berries were separated from stems, packed in plastic bags, frozen and stored at -20°C. Before the analysis elderberries were defrosted, one part was analysed and the rest was processed into wine. Six different wine samples were prepared (wines A, B, C, D, E and F), differing in the amount of sugar and water added. All wines were prepared using the same techniques, except the wine F in which elderberries were not milled for maceration but only squeezed with a hand. All wines were prepared using 4 kg of elderberry fruit. Wine A contained no added sugar, wines B and F had 0.5 kg of sugar, wine C 1 kg and wines D and E 1.5 kg of sugar per 4 kg of elderberry fruit. Wines A, B, D and F were prepared without addition of water, while 2 L of water was added to wines C and E. In all samples 0.2 mL of pectolitic enzyme (Endozym Pectofruit, Ireks Aroma, Croatia), 0.2 g of potassium bisulphite (Vinobran) and 1 g of selected yeast culture Saccharomyces cerevisiae ph. v. cerevisiae (Fermol Rouge, Laffort, France) were added. Maceration and fermentation were conducted at the same time. Fermentation was stopped when desired alcohol content was reached (4 % in wine A, 8 % in wines B and F, 10 % in wine C and 12 % in wines D and E, (v/v)). After the fermentation wine was filtered through the cloth and filled in glass bottles.
Methods Physico-chemical parameters Physico-chemical parameters, soluble solids, pH, total acidity and total sugar content were determined in accordance with Regulation (1983). Soluble solids were measured using a refractometer (Atago, Pal-3) to determine °Brix. The pH value was determined with a pH meter (Mettler Toledo, Seven Easy). Total acidity was determined by titrating each sample with standardized 0.1 M NaOH to pH 8.1 using a pH meter. Determination of directly reducing sugars by Luff solution was based on the principal that reducing sugars (natural invert) convert CuSO4 from the Luff solution into Cu2O. Unspent amount of cupric ion was re-titrated with tyosulphate solution. Quantity of sugars was read from the tables based on the difference of consumption for blind trail and sample. Unreduced disaccharide (sucrose) first had to be inverted (hydrolyzed) to reducing monosaccharide by acid addition, and then it was determined by Luff solution. Difference between obtained total invert and natural invert presented quantity of reducing sugars developed by sucrose inversion. All measurements were done in duplicate. Total phenols and flavonoids content Total phenols were determined in accordance with the modified procedure of Ough and Amarine (1988). Phenols from the fruit and wine were extracted from 5 g of sample using 20 mL 80 % (v/v) aqueous ethanol. The mixture was extracted with reflux for 20 min and filtered through Whatman No. 40 filter paper using a Buchner funnel. Extraction of the residue was repeated using the same conditions. The filtrates were combined and diluted in volumetric flask to 50 mL with 80 % aqueous ethanol. Obtained extract was used for determination of total phenols and total flavonoids. Total phenols in fresh elderberries and wines were determined by Folin Ciocalteu method, measuring absorbance at 765 nm. The total phenolic content was expressed as mg of
gallic acid equivalents (GAE) per kg of fresh weight for elderberries or per L for wines, by reference to the gallic acid standard calibration curve. Total flavonoids were determined using the aluminium chloride colorimetric method described by Zhishen et al. (1999). The absorbance was measured at 510 nm and results were expressed as mg of rutin equivalents (RE) per kg of fresh weight for elderberries or per L for wines by reference to the rutin standard calibration curve. Hydrolysed tannins content Hydrolysed tannins content was determined using method described by Ough and Amerine (1988). Method is based on the principle of hydrolysed tannins precipitation by addition of the cinchonine-sulphate. 5 g of sample was mixed with distilled H20 in a ratio of 1:2. In diluted sample 12.5 mL buffer pH 7.9 and 6.3 mL cinchonine-sulphate solution were added. Mixture was homogenised on magnetic mixer for about 20 minutes and centrifuged at 5500 rpm for 20 min. The obtained supernatant was filtrated into 100 mL volumetric flask. Residue on the filter along with filter paper was rinsed with the 10 mL of 10 % sodium-sulphate solution and centrifuged at 5500 rpm for another 20 minutes. After centrifugation, liquid part was connected with supernatant, pH adjusted to 3.5 by adding 1 M hydrochloric acid and solution was immediately diluted to 100 mL with distilled H20. Residual sediment was dissolved in 25 mL of 1M ethanol’s hydrochloric acid solution. Obtained extract was used for hydrolysed tannins content determination. The results were expressed as mg of gallic acid equivalents (GAE) per kg of fresh weight for elderberries or per L for wines, by reference to the gallic acid standard calibration curve. Total anthocyanins content Total anthocyanin content (TA) in extracts was determined using bisulphite bleaching method (Ribereau-Gayon and Stonestreet, 1965). Anthocyanins were extracted from 2 g of fresh samples using 2 mL of 0.1 % HCl (v/v) in 96 % ethanol and 40 mL 2 % aqueous HCI (v/v). The mixture was centrifuged at 5500 rpm for 10 min. The obtained supernatant was used for determination of TA. The content of TA was measured as follows: 10 mL of extract was added into two test tubes, then 4 mL of 15 % sodium bisulphite was added to one test tube and 4 mL of distilled H20 to the other. After 15 min of incubation at room temperature the absorbance of each mixture was measured at 520 nm. Results were expressed as mg cyanidin- 3-glucoside equivalent (Cy-gE) per kg of fresh fruit or per L of wine. Antioxidant capacity Antioxidant capacity of elderberry fruit and wines was determined using the FRAP method described by Connor et al. (2002). The FRAP method consists in the reduction of Fe3+ ions to Fe2+, which in turn form a blue-coloured complex with 2,4,6-tripirydylo-s-triazine (TPTZ). The intensity of the colour is dependent on the antioxidant concentration. Absorbance was measured at 593 nm. Results were expressed as mmol Trolox equivalents (TE) per kg of fresh fruit or per L of wine, in accordance with Trolox standard calibration curve. All spectrophotometric measurements were performed using UV-Vis spectrophotometer UV-Vis Unicam Helios. Sensory evaluation The sensory evaluation of elderberry wine was carried out by a sensory panel group consisted of twelve members, at Faculty of Food Technology and Biotechnology, Zagreb, Croatia. The wine samples were evaluated for taste and aroma, using a scale from one (unpleasant) to five (pleasant and harmonious).
CROATIAN JOURNAL OF FOOD TECHNOLOGY, BIOTECHNOLOGY AND NUTRITION
I. ELEZ GAROFULIĆ et al.: Croatian Journal of Food Technology, Biotechnology and Nutrition 7 (Special Issue) 9-13 (2012)
11
Table 1. Physico-chemical parameters of fresh elderberry fruit and elderberry wines
Parameters
Fresh elderberry
Wine A
Wine B
Wine C
Wine D
Wine E
Wine F
Soluble solid (%)
14.90±0.23
10.30±0.19 14.20±0.13 10.70±0.11 17.30±0.15 15.20±0.10 10.30±0.11
pH
4.46±0.06
3.20±0.05
3.03±0.06
3.49±0.07
Total acidity (g/L)
6.92±0.09
18.41±0.24 18.97±0.11 13.51±0.16 12.74±0.17 12.25±0.11
9.10±0.08
Sugars (%) Total
6.91±0.08
0.38±0.02
0.93±0.03
1.89±0.08
8.89±0.06
5.50±0.08
0.75±0.01
Reducing
6.76±0.06
0.37±0.03
0.74±0.02
0.19±0.01
8.54±0.05
4.95±0.06
0.19±0.01
Sucrose
0.14±0.01
0.01±0.00
0.17±0.02
1.62±0.02
0.33±0.05
0.55±0.05
0.53±0.01
3.37±0.09
2.92±0.08
3.08±0.07
Values are means of two replication.
Results and discussion Results of physico-chemical analysis of fresh elderberry and elderberry wines are shown in Table 1. Soluble solid determined in fresh elderberry was 14.90 % which is within the average reported by other authors (Mratinić and Fotirić, 2007; Mratinić and Kojić, 1998) as well as the pH value (Mratinić and Fotirić, 2007; Lee and Finn, 2007) and the amount of total sugars (Akbulut et al., 2009). According to literature data, small amount of sucrose is present in raw elderberry (Galić et al., 2009). In this paper it was determined in the amount of 0.14 % which is more than reported by Galić et al. (2009) on elderberry from the same geographic area. The reason may be in different ripening conditions in different harvesting years. About 97.8 % of total sugars determined in raw elderberry were directly reducing sugars. Total acidity in raw berries was 6.92 g/L which is lower than reported by other authors (Akbulut et al., 2009; Galić et al., 2009), probably because of the different climatic and ripening conditions in 2009. Similar results were reported by Veberic et al. (2009) showing the total acidity of 6.38 g/L for elderberry cultivar Haschberg. Soluble solid in elderberry wines varied in relation to production conditions from 10.30 % in wine samples A and F to 17.30 % in wine D. Wine A and F were produced with the lowest addition of sugar (0.5 kg) while to wine D the highest amount of sugar was added (1.5 kg). Although 1.5 kg of sugar was added to wine E, determined soluble solid was lower, 15.20 % due to the fermentation process which was not carried out to the end in the production of wine D, so part of the added sugar remained in wine. The amount of total sugars in wines
was also differing in relation to the production conditions from 0.38 % in wine sample A to 8.89 % in wine sample D. The amount of reducing sugars was below 1 % in all samples except in the wines D and E. According the Regulation (1996) allowed amount of sugar in wine is 4 g/L for dry wines and 4-12 g/L for semi-dry ones. Considering the results obtained, wines A, B, C and F can be classified in category of dry wines while wines D and E can be classified as semi-dry. pH value was fairly uniform in all wine samples and within the range from 2.92 in wine C to 3.49 in wine F. Total acidity of elderberry wines, expressed as citric acid equivalent, varied in relation to processing conditions, mainly the fermentation and water addition. Wine samples A and B had higher acidity (18.41 and 18.97 g/L), while the lowest acidity was determined in wine F. According the Regulation (1996) total acidity of wine has to be at least 4.5 g/L. Unusually high acidity of wine samples A and B can be result of volatile acids formation due to the processing conditions, namely, no or low sugar addition, no water addition and milling the berries for maceration. Furthermore, all wines were analysed immediately after fermentation, so the total acidity was higer as there was no acid precipitation and esterification which occur during wine ageing. Results of phenolic composition of raw elderberry and elderberry wines are shown in Table 2. The amount of total phenols in raw elderberry was very high, 9632.43 mg GAE/kg. Numerous authors had been researching the amount of total phenols in different elderberry cultivars, and reported amounts varied referring to the cultivar, climatic conditions, harvesting period etc. (Akbulut et al., 2009; Kahkonen et al., 1999; Lee and Finn, 2007). Lee and Finn (2007) were researching ten dif-
Table 2. Phenolic compounds in fresh elderberry fruit and elderberry wines Phenolic compounds
Fresh elderberry*
Wine A
Wine B
Wine C
Wine D
Wine E
Wine F
Total phenols mg GAE/L
9632.43 ± 21.36 7401.71 ± 16.58 8307.71 ± 18.36 6401.71 ± 13.58 5632.48 ± 12.56 5948.72 ± 13.55 5136.75 ± 13.87
Flavonoids mg RE/L
1775.85 ± 6.21
1110.34 ± 7.06
1134.48 ± 6.99
693.10 ± 2.31
534.48 ± 1.99
765.52 ± 2.05
568.96 ± 1.78
Hydrolised tannins mg GAE/L
711.53 ± 3.56
615.38 ± 2.59
739.32 ± 3.07
452.99 ± 1.47
397.43 ± 1.56
346.15 ± 1.22
299.14 ± 0.96
3130.35 ± 7.25
2509.20 ± 9.87
3056.55 ± 6.39
3007.35 ± 5.41
Anthocyanins 8526.97 ± 17.20 5061.45 ± 11.07 4821.60 ± 10.33 mg Cy-gE/L
* Concentration of phenolic compounds in fresh elderberry is expressed per kg of fresh weight
CROATIAN JOURNAL OF FOOD TECHNOLOGY, BIOTECHNOLOGY AND NUTRITION
12
I. ELEZ GAROFULIĆ et al.: Croatian Journal of Food Technology, Biotechnology and Nutrition 7 (Special Issue) 9-13 (2012)
ferent elderberry cultivars and reported the amounts of total phenols from 3270 to 5820 mg GAE/kg f.w. Similar results were reported by Akbulut et al. (2009) and Galić et al. (2009). Generally, results of this research show higher total phenols content of raw elderberry than previously reported. Concentration of total phenols in elderberry wines varied from 5136.75 mg GAE/L in wine F to 8307.69 mg GAE/L in wine B. These results show that elderberry wines are rich source of polyphenols. Vasantha Rupasinghe and Clegg (2007) classified the wines in relation to the total phenols content in three groups: wines high in total phenolics, moderately high and low in phenolics. According to this classification, all wines produced in this research can be categorized as wines high in polyphenols
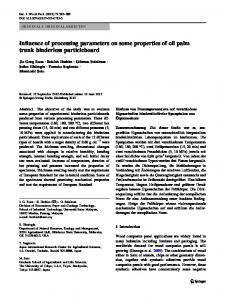
the amounts from 2000 to 10000 mg/kg, which is in accordance with our results. Veberic et al. (2009) also reported high anthocyanin content of two elderberry cultivars and three selections, ranging from 6000 to 12000 mg/kg. Anthocyanins as the predominant pigments in wine derive from fruit to wine in maceration process. In elderberry fruit anthocyanins are present in both fruit skin and flesh so their concentration in wine depends primarily of maceration conditions. In wines A, B, C, D and E berries were milled for maceration while in wine F they were gently squeezed with a hand. So wines A and B had the highest concentration of total anthocyanins (5061.45 and 4821.60 mg Cy-gE/L, while in other wine samples the amount was significantly lower. According to the previous literature reports, these results show higher anthocyanin content of elderberry wines than the one of grape, blueberry and strawberry wines (Klopotek et al., 2005; Sanchez-Moreno et al., 2003). These authors have reported the amount of total anthocyanins of 52.61-170.10 mg/L for red wine, 14.70-162.20 mg/L for blueberry wine and about 130 mg/L for strawberry mash wine. These results indicate that elderberry wines are very rich source of anthocyanins. Results of antioxidant capacity determined by FRAP method in raw elderberry and elderberry wines are shown on Figure 1. Antioxidant capacity of fresh elderberry was 135.83 mmol TE/kg which is higher than previously reported by other authors. Akbulut et al. (2009) reported the antioxidant capacity of four wild elderberry genotypes from 50.4 to 63.7 mmol TE/kg. Halvorsen et al. (2002) reported that wild berry fruit as blueberry, black currant, elderberry, Figure 1. Antioxidant activity of fresh elderberry fruit and elderberry wines blackberry and cranberry has very * Antioxidant activity of fresh elderberry is expressed per kg of fresh weight high antioxidant capacity ranging from 50.3 to 91.7 mmol/kg. Elderberry wine manufacturing decreased the antioxidant along with some red wines and blueberry and black currant capacity with exception of wine A (146.41 mmol TE/L) which fruit wines, as the amount of total phenols is higher than 1500 was produced with no addition of sugar and water. mg GAE/L. Results of sensory evaluation of elderberry wines are Concentration of total flavonoids in raw elderberry was shown in Table 3. Soluble solid, pH and total acidity have 1775.85 mg RE/kg. Among wines the highest amount was deremarkable effect on sensory characteristics of fruit and fruit termined in wines A and B (1110.34 mg RE/L and 1134.48 mg wines (Chapman et al., 2005). Wine E was scored the best for its RE/L) while it was significantly lower in other wine samples. taste and aroma (3.33 and 3.07) and was characterized as wine The concentration of hydrolysed tannins in raw berries with pleasant aroma and wit favourable taste for consumption. was 711.53 mg GAE/kg. Processing influenced on decrease in It was produced with addition of highest amount of sugar (1.5 hydrolysed tannins content of elderberry wines with exception kg) and water which resulted in wine with best sugar/acid ratio. of wine B. The results shown indicate that hydrolysed tannins Wine A and B gained the lowest scores and were characterized are important compounds from flavonoid group present in raw as bitter and sour. These scores are in accordance with physicoberries and elderberry wines. chemical composition as wines A and B had the lowest sugar Anthocyanins are predominant phenolic compounds in content and high total acidity while wine E had high soluble elderberry which are responsible for its colour and have a sigsolid content and total sugars and low total acidity. nificant influence on fruit quality (Lee and Finn, 2007). The concentration of total anthocyanins determined Table 3. Sensory evaluation of elderberry wines in raw elderberry was Parameter Wine A Wine B Wine C Wine D Wine E Wine F 8526.97 mg Cy-gE/kg. Brønnum-Hansen et al. Taste 1.50 1.79 1.92 2.67 3.33 1.92 (1983) researched the Aroma 2.45 2.03 2.94 2.95 3.07 2.67 anthocyanin content of 26 different elderberry Results are expressed as mean values of all individual scores cultivars and reported
CROATIAN JOURNAL OF FOOD TECHNOLOGY, BIOTECHNOLOGY AND NUTRITION
I. ELEZ GAROFULIĆ et al.: Croatian Journal of Food Technology, Biotechnology and Nutrition 7 (Special Issue) 9-13 (2012)
Generally, high acid content had effect on taste and aroma of almost all elderberry wines, so the process of deacidification could be useful during production of elderberry fruit wine.
Conclusions Both fresh elderberries and elderberry wines are exceptionally rich source of biologically active compounds. Processing conditions significantly influenced the quality of fruit wines with fermentation process and addition of sugar being the most influential. Because of the high acidity and low sugar content of raw elderberries, the addition of sugar during the fermentation is essential for the sensory acceptability of elderberry fruit wine.
References Akbulut M., Ercisli S., Tosun M. (2009) Physico-chemical characteristics of some wild grown European elderberry (Sambucus nigra L.) genotypes. Pharmacognosy Magazine, 5, 320-337. Brønnum-Hansen K., Hansen S.H. (1983) Highperfomance liquid chromatographic separation of anthocyanins of Sambucus nigra L. Journal of ChromatogrAphy, 262, 393396. Chapman D.M., Roby G., Ebeler S.E., Guinard J.X., Matthews M.A. (2005) Sensory attributes of Cabernet Sauvignon wines made from vines with different water status. Australian Journal of Grape and Wine Research, 11, 339– 347. Connor A.M., Luby J.J., Hancock J.F., Berkheimer S., Hanson E.J. (2002) Changes in Fruit Antioxidant Activity among Blueberry Cultivars during Cold-Temperature Storage. Journal of Agricultural and Food Chemistry, 50, 893-898. Dawidowicz A., Wianowska D., Baraniak B. (2006) The antioxidant properties of alcoholic extracts from (Sambucus nigra) L. (antioxidant properties of extracts) LWT-Food Science and Technology, 39, 308-315. Galić A., Dragović-Uzelac V., Levaj B., Bursać Kovačević D., Pliestić S., Arnautović S. (2009) The Polyphenols Stability, Enzyme Activity and Physico-Chemical Parameters During Producing Wild Elderberry Concentrated Juice. Agriculturae Conspectus Scientificus, 74 (3),181-186. Goiffon J.P., Mauly P.P., Gaydon E.M. (1999) Anthocyanic pigment determination in red fruit juices, concentrated juices and syrups using liquid chromatography. Analytica Chimica Acta, 382, 39-50. Halvorsen B.L., Holte K., Myhrstad M.C.W., Barikmo I., Hvattum E., Remberg S. F., Wold A.B., Haffner K., Baugerod H., Andersen L.F., Moskaug J.O., Jacobs D.R., Blomhoff R. (2002) A systematic screening of total antioxidants in dietary plants. Journal of Nutrition, 132, 461-471. Kahkonen M.J., Hopia A.I.,Vuorela H.J., Rauha J., Pihlaja K., Kujala T.S., Heinonen M. (1999) Antioxidant activity of plant extracts containing phenolic compounds. Journal of Agricultural and Food Chemistry, 47, 3954-3962. Klopotek Y., Otto K., Böhm V. (2005) Processing Strawberries to Different Products Alters Contents of Vitamin
13
C, Total Phenolics, Total Anthocyanins, and Antioxidant Capacity. Journal of Agricultural and Food Chemistry, 53, 5640-5646. Lee J., Finn C. E. (2007) Anthocyanins and other polyphenolics in American elderberry (Sambucus canadensis) and European elderberry (S. nigra) cultivars. Journal of the Science of Food and Agriculture, 87, 2665-2675. Ma Q., Kinner K. (2002) Chemoprotection by phenolic antioxidants. The Journal of Biological Chemistry 277, 24772484. Mratinić E., Fotirić M. (2007) Selection of Black Elderberry (Sambucus nigra L.) and Evaluation of its Fruits Usability as Biologically Valuable Food. Genetika, 39 (3), 305 -314. Mratinić E., Kojić M. (1998) Samonikle voćne vrste Srbije, Institut za istraživanja u poljoprivredi “Srbije”, 510513. Netzel M., Strass G., Herbst M., Dietrich H., Bitsch R., Bitsch I., Frank T. (2005) The excretion and biological antioxidant activity of elderberry antioxidants in healthy humans. Food Research International, 38, 905-910. Ough C.S., Amerine M.A. (1988) Methods for analysis of musts and wines, 2nd ed., John Wiley & sons, New York, USA. Regulation (1996): Pravilnik o vinu (1996) Narodne novine, broj 96, Zagreb. Regulation (1983): Pravilnik o metodama uzimanja uzoraka te obavljanja kemijskih i fizikalnih analiza radi kontrole kvalitete proizvoda od voća i povrća (1983), Službeni list SFRJ br. 29 (Narodne novine 53/91), Zagreb. Ribereau-Gayon P., Stonestreet E. (1965) Le dosage des anthocianes dans le vin rouge et determination de leur structure. Bulletin de la Societe Chimique de France. 9(419), 2649-2652. Sanchez-Moreno C., Cao G., Ou B., Prior R.L. (2003) Anthocyanin and Proanthocyanidin Content in Selected White and Red Wines. Oxygen Radical Absorbance Capacity Comparison with Nontraditional Wines Obtained from Highbush Blueberry. Journal of Agricultural and Food Chemistry, 51 (17), 4889–4896. Vasantha Rupasinghe H.P., Clegg S. (2007) Total antioxidant capacity, total phenolic content, mineral elements, and histamine concentrations in wines of different fruit sources. Journal of Food Composition and Analysis, 20, 133–137. Veberic R., Jakopic J., Stampar F., Shmitzer V. (2009) European elderberry (Sambucus nigra L.) rich in sugars, organic acids, anthocyanins and selected polyphenols. Food Chemistry, 114 (2), 511-515. Youdim K.A., Martin A., Joseph J.A. (2000) Incorporation of the elderberry anthocyanins by endothelial cells increaces protection against oxidative stress. Free Radical Biology and Medicine, 29, 51-60. Zhishen J., Mengcheng T., Jianming W. (1999) The determination of flavonoid contents in mulberry and their scavenging effects on superoxide radicals. Food Chemistry, 64, 555-559.
CROATIAN JOURNAL OF FOOD TECHNOLOGY, BIOTECHNOLOGY AND NUTRITION