Rosenberry et al., Ervin and Washburn, and Walker have chosen simulation mod- ..... et al. may be attributed to our small sam- ple size, and/or the algorithm ...
The Influence of Technological Progress on the Long Run Farm Level Economics of Soil Conservation Daniel B. Taylor and Douglas L. Young
The complementary interaction between topsoil depth and technical progress for winter wheat in the Palouse region was found to strengthen the long run payoff to conservation tillage. Nonetheless, conservation tillage was found to be competitive with conventional tillage only if its current yield disadvantages were eliminated. Conservation tillage was relatively more competitive on shallower topsoils and for longer planning horizons. Short-term subsidies coupled with research directed towards reducing the cost and yield disadvantages of conservation tillage in the Palouse were advocated to maintain long-term soil productivity.
A dynamic long run perspective is crucial for a comprehensive evaluation of the private benefits of soil conservation. An analysis through time facilitates an examination of the interaction between the yield depressing effects of soil erosion and the yield increasing effects of improvements in agricultural technology. A long run approach also makes it possible to examine the influence of different discount rates and lengths of planning horizons on the economic attractiveness of various erosion control practices. This is important from a policy standpoint because potential differences between individual farmers and society as a whole with respect to appropriate planning horizons and discount rates could lead to a substantial Daniel B. Taylor is an Assistant Professor in the Department of Agricultural Economics at Virginia Polytechnic Institute and State University, Blacksburg, Virginia. Douglas L. Young is an Associate Professor in the Department of Agricultural Economics at Washington State University, Pullman, Washington. This research was completed under Projects 2027 and 5028, College of Agriculture Research Center, Washington State University, Scientific Paper No. 7035. Western Journalof Agricultural Economics, 10(1): 63-76 © 1985 by the Western Agricultural Economics Association
divergence between individual and societal choices on the desirable degree of erosion control. In this paper it is argued that the failure to employ a long run perspective and a total systems approach in economic evaluations can result in an underestimate of the long run payoff of soil conserving farming systems. The objectives of this paper are (1) to present a theoretical model for projecting future crop yields which considers the dynamic interaction between topsoil erosion and general technical progress; and (2) to empirically project future crop yields and net per acre incomes on hilltops and on average slopes for an eastern Washington Palouse' study area. These projections will be made for no-till, minimum-till, and heavy-till systems under alternative assumptions concerning the rate of general technological progress in winter wheat yields. The study area is limited to the 700,000 acres of the Palouse region with sufficient rainfall (18 to 23 inches per year) to permit annual cropping. The Palouse is located in southeastern Washington, and adjacent areas of northwestern Idaho.
July 1985
Western Journalof Agricultural Economics
Theoretical Crop Yield Projection Model
yield penalties for uncontrolled erosion become increasingly severe as the topsoil mantle grows shallower. As erosion progresses, inferior subsoil properties increasingly restrict crop yields.
Crop Yield-Topsoil Depth Relationship The justification for soil conservation on agricultural productivity grounds rests on the decline in crop yields as topsoil is lost when other factors are constant. Crop yield response functions estimated by a number of researchers from field observations on yields and topsoil depths have repeatedly confirmed this relationship (Rosenberry et al.; Pawson et al.; Wetter; Harker et al.; Taylor). Ideally, a crop response function could be expressed as: Y = f(D, Q, M, W, E)
(1)
where: Y is crop yield per acre in time era E; D is topsoil depth; Q is a vector of soil chemistry and structure components (excluding topsoil depth) and land physicaltopographic features that affect yield; M, a vector of management factors; W, a vector of weather, climatic, pest, and other factors; and E, the time era (year or years) during which the function was estimated. E serves as a proxy for the level of general agricultural technology. Ideally, all of these variables would be included as exogenous variables. Since data are not available to estimate this complete model, most researchers have estimated the yield response to topsoil depth alone, taking all the other variables as given. Estimated response functions have generally revealed that both winter wheat and dry pea yields in the Palouse are cut by more than 50 percent by the loss of all topsoil (Pawson et al.; Taylor; Harker et al.). On deep topsoils, yields asymptotically approach a maximum yield as the effective depth of crop root penetration is exceeded. From a long run modeling perspective the most important feature of the crop yield-topsoil depth response functions from the Palouse region is their nonlinearity. Yield declines are relatively modest for erosion from deep soils, but 64
Yield-Technology Relationship The discussion in the previous section underlies the productivity rationale for soil conservation, namely, that with other things constant, yields fall as topsoil is lost. The fundamental complication is that through time "other things" have not remained, and will not remain, constant. Improvements in general agricultural technology, such as machinery and agrichemicals (represented by variable E in equation (1)) have steadily shifted the yield-topsoil depth response relationship upward. The result has been a doubling of Palouse wheat yields between the 1930's and 1970's, in spite of continuous topsoil erosion during this forty-year period. The impressive record of technical progress in U.S. agriculture during the last 50 years is accepted as historical fact, but the likely pace of future technological progress in agriculture is fraught with controversy. Scholars associated with the "limits to growth" perspective argue that rapid depletion of petroleum and other natural resources will place a severe brake on the pace of future technological progress. On the other hand, those associated with the "technological optimism" perspective argue that new biological and agrichemical breakthroughs will sustain crop yield increases at historical rates in spite of depletion of certain natural resources. The rate at which future technical progress shifts the yield function is a critical issue in long run modeling of the economic and environmental performance of alternative farming systems. The way in which technical progress shifts the yield function upward is an equally important, but more neglected, issue. A simple uni-
Taylor and Young
Economics of Soil Conservation
form multiplicative impact of technological progress on yields through time in which yields increase the most on deeper topsoils can be mathematically represented as: Y = f(D,) g(t),
(2)
where: Yt represents yield in period t; f(Dt) is the yield-topsoil depth relationship with topsoil depth now a function of time due to erosion; and g(t) represents the technology shift function. In this paper a simple exponential technical progress function is used with a Mitscherlich-Spillman yield-topsoil depth function which leads to the explicit yield projection function:2 Yt = [a+b(l -RD )P(e-)], 0 < R < 1 and
D = (Do - At) > 0,
(3)
gress boosted winter wheat yields in the Palouse about 60 percent more on deep than on eroded topsoils between the 1950's and 1970's. The multiplicative shift was also supported by agronomic theory and the expectations of surveyed Palouse region farmers (Young; Taylor). The restriction of the analysis to the range 0 < Dt < oo is due to a lack of systematic observation and analysis of crop yields on subsoils (B horizon or lower) in the Palouse. This restriction precludes application of the yield projection model to those areas from which all topsoil has been eroded. Theoretical Implications of the Yield Projection Model
where: a, b, r, and R are parameters for a particular crop and area; Do is initial topsoil depth; A is the average annual inches of topsoil loss predicted by the Universal Soil Loss Equation (USLE); P is a yield penalty associated with a conservation tillage system relative to heavy till (0 < P < 1.00, with 1.00 representing no yield pen-
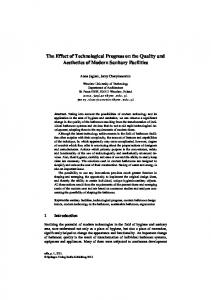
Figure 1 illustrates for a pair of hypothetical examples the joint influence of the nonlinear yield function and the multiplicative technology shift on the projected yield benefits from soil conservation. Response function Y0 could represent an estimated relationship between winter wheat yields and topsoil depths during the 1970's.
beginning of the study period; and e is the exponential operator. Selection of the multiplicative technology shift for the Palouse was based on analysis of available historical winter wheat yield data at various topsoil depths (Young et al.; Kaiser). This analysis showed that technical pro-
yield-topsoil depth relationship prevailing at a future period, n, after several years of further progress in wheat breeding, pest control, and other technical improvements. Let D6 be initial topsoil depth for a deep topsoil location and D3 be the initial topsoil depth for a relatively shallow topsoil location. The use of a soil-conserving system such as minimum till is projected to result in the relatively modest topsoil loss of (D 6 - D5 ) = (D3 - D2 ) over the period from t = 0 to t = n. Use of a more erosive heavy till system leads to the larger topsoil loss of (D 6 - D4) = (D 3 - Di) over the same span of years. The arrows AB and AC project future yield trends under minimum till and heavy till, respectively, assuming an initial generous endowment of topsoil in excess of two feet as existed in much of the eastern Washington-northern Idaho Pal-
alty) 3 ; t is the number of years from the
See Taylor and Young (1985) for a detailed examination of the mathematical properties of the yield projection function in equation (3). More recent empirical work by Young, Taylor, and Papendick indicates that the exponential technical progress function, which assumes uniformly multiplicative technical progress, might somewhat overestimate historical technical progress. This work confirms that technology has boosted Palouse wheat yields substantially more on deeper topsoils, but in a nonuniformly multiplicative manner. 3 For simplicity of exposition in Figure 1, no yield penalty is assigned to minimum till (P = 1.0 for both tillage systems). 2
Yn would then represent the projected
65
July 1985
Western Journal of Agricultural Economics B
^c-""
i I \
120 -
100 -
^lEX.| ~
\\
80
:
F/
0
Go--F-- ~~
m
:
-
|from
60 U) m
40 0)
a)
20
I
oiD1
|
i2
D
i
I 101 D
j
2
i 20
D 3
|} j
i
D5
I|j
30
"Y,topsoil levels reach depths of one foot or less (based on Palouse conditions), contin~ued use of erosive farming practices can lead to a decline in yields (arrow DF in Figure 1) despite continuing technical progress. At this stage, the future yield payoff to soil conservation is large (yield at E minus yield at F in Figure 1). On hilltops and other areas with relatively shallow ~\D natural topsoils, the high payoff soil conservation can exist from the time intensive farming begins. The preceding discussion demonstrates that an inadequate portrayal of the interaction between soil erosion and general technological improvements can result in underestimation of the payoff from soil protect faila to m conservation. Farmers who .
D 6
Inches of Topsoil
Figure 1. Yield-Topsoil Depth and Technological I Progress Interaction. ouse vvhen its prairies were first plowed in
the 18380's. The arrows DE and DF compare tlhe yields for minimum till and heavy till, re,spectively, over the same time span assum ing an initially thinner topsoil layer,
or one reduced to this depth by years of intensive farming. The available evidence strongly suggests that the process summarized in Figure 1, with more technical progress on deeper topsoils, is an accurate description of the relationship existing for the Palouse region (Kaiser; Young et al.). Two conclusions with practical and policy importance emerge from this conceptualization of the interaction between technical progress and topsoil erosion: (1) During the early years of intensive farming of fertile but erosionprone steep slopes, farmers and policymakers may be lulled into a false sense of security by strong growth in yields in spite of heavy erosion (arrow AC in Figure 1). This yield growth is promoted by general agricultural technical progress acting on a literal "cushion" of deep topsoil. (2) Once 66
t .ei.tpo
.
th
n ea
their topsoil in the near term are making themselves vulnerable to a potential double penalty in the future. First, future yields are directly reduced because shal-
lower topsoils produce lower yields at a given level of technology. Second, and equally important, there is a reduction in the capacity to benefit from future improvements in agricultural technology because these improvements have less impact on eroded soils.
Structure of Economic/Physical Simulation Model Several techniques were available for the analysis of the impacts of soil erosion and soil erosion control using the yield projection model. One option was an optimal control theory approach such as Burt's analysis of soil erosion in the Palouse. Control theory has also been employed by McConnell to theoretically examine potential divergence between social and private optimal rates of soil erosion. Bhide et al. have used control theory for an economic analysis of soil erosion in Iowa. Another option was the use of mathematical programming models, such as linear programming. Harker in a short run farm-level study set in the Palouse, Alt
Taylor and Young
and Heady in an analysis of a river basin in Iowa, and Osteen and Seitz in their Corn Belt research are but a small sampling of the studies which have used mathematical programming in the economic analysis of soil erosion. Other researchers, including Rosenberry et al., Ervin and Washburn, and Walker have chosen simulation modeling in long run soil conservation analyses. Each of these techniques has value depending upon the nature and objectives of the study. We chose simulation modeling because it provided a tractable dynamic approach to incorporating the three examined discrete tillage systems which are relevant and cost effective conservation practices for the Palouse (USDA, 1978). These discrete tillage systems did not meet the continuity requirements of optimal control theory. Unique costs, crop yields, and erosion rates were available for the three recognized tillage systems. However, given available data, we had no basis for constructing an artificial continuous "tillage intensity" decision variable. In contrast, Burt's optimal control study of soil conservation in the eastern Palouse chose the continuous decision variable of the percentage of cropland planted to wheat. Unfortunately, this simple decision variable ignores the relevant conservation tillage alternatives. It also violates agronomic constraints in the region, primarily related to disease and weed control, which require rotating winter wheat with a spring crop of dry peas, lentils, or spring barley (USDA, 1978). Burt's control theory solutions recommended up to 85.7 percent wheat rotation. These "optimal" rotations differ markedly from current planting patterns in the eastern Palouse where winter wheat rarely occupies more than 50 percent of the cropland (USDA, 1978; Steep Project). In the drier western Palouse, where summer fallow rotations are used, wheat would represent a higher percentage of the planted cropland. Simulation also offered more flexibility
Economics of Soil Conservation
than programming models in representing the complex interaction through time of topsoil erosion and technical progress on crop yields and farm incomes. In summary, we concluded that the flexibility of simulation permitted the best portrayal of the technology-erosion interaction in light of the discontinuous tillage alternatives to be evaluated. The yield projection equation described in the preceding section was incorporated into a computer simulation model which projected crop yields, topsoil depths, and net income streams from alternative tillage systems on a representative farm composed of several land classes. The present value per acre of on-farm net benefits (calculated as returns to land and owner labor and management) of farming system j (NPVj) as computed in the model was: NPVj =
[
fjk,(Pkk
t=l
Cjkt)/(1 + p),
(4)
k=l K
subject to: ~ fjkt =1.0 for all (j, t) comk=l
binations, where: j is a farming system index; k is a crop or land use index; K is the total number of crop and noncrop land uses included in the rotation; t is a year index; N is the total number of years in the decision horizon for the analysis;
fjkt
is
the fraction of land in crop (or land use) k and farming system j in year t; Pkt is the
farm gate price per unit of crop k in year t; Yjkt is the yield per acre of crop k grown
under farming system j in year t as calculated by the yield projection function of equation (3); Cjkt is the total production
cost per acre of crop k grown under farming system j in year t; p is the discount rate in real terms. The operational simulation model described in detail in Taylor both computes NPVj on a per acre basis for separate Soil Conservation Service (SCS) land classes, and aggregates it to a whole-farm basis. No attempt was made in this farm level 67
July 1985
Western Journal of Agricultural Economics
study to incorporate estimates of off-farm social costs such as downstream pollution or reservoir siltation, but the model could be extended to include these when estimates of their magnitude are available. The salvage value of the land at its time of sale is another economic factor not considered in the NPV analysis framework.
C
0
L
(0 00
?^
L) ur.
I°
5 -00 U) o
cD N-
(.)Grj
CD
r-
?^_
a.
00
-0 't V CIO a,C CL
05
LO cot e coD 000 C00
o o 00o T-
>-
t
o O 0)
00
EL
w..
E 0) an
LL
0 C) 6~ VI
O 00 C§ oD
0-
6 0
=)L
a)
E
ca
0 _
oS
0
.0 0
a. -
0
0
la
0 o c
a
a) E
S=
.a H.
a)
-0
Eo OV 00
0
0o O
0 o
0 CM
a) -5
CM
I
o
0 0*o 0'..
E 0. U(U
.
o
20
0
c
q5
O
La)
0 0 16.
0
o'
N
0n
0
c C)
a C 0,
1)
o
C
« 0
oc.0ao
0>
0
c-0 0
E
_
0) 0
r)
00'- C
0)
e)
O
(o
uJ x a
0O
E 2 L0
c 0
a)a
en
50
D.
I
I-
co
68 0)
1--
_
1= C
W
-..
As Batie (pp. 80-82) discussed, the impact of erosion on the selling price of land is not clear.
0)
) FE E co co a) E L- Q a)
co 0O
~ f a)
o
0 CZu, u
a)
a I
m
2
0
Q
Data and Estimated Relationships Three tillage systems were analyzed in the simulation model for the winter wheat and dry pea (wheat-pea) rotation which is grown in the study area. Table 1 presents the tillage operations for these three tillage systems. Heavy till with moldboard plowing of the winter wheat stubble is the most erosive system, with a USLE C-factor of 0.340. With chisel plowing as the first post harvest tillage operation on both crops, minimum till is of intermediate erosiveness (C = 0.190). No till, seeding directly into the stubble of the preceding crop, is the most soil conserving system. The multiplicative yield penalties (P < 1 indicating lower than standard yields) are based on experimental evidence from local field trials (Harder; Harder et al.). Agronomists generally attribute the yield penalties to increased disease, weed control and germination problems under the "trashy seedbed" conditions characterizing conservation tillage. They should be considered tentative because there is still much debate concerning their magnitude. For example, Cochran et al. found insignificant yield penalties associated with conservation tillage field trials in lower rainfall areas of the Palouse. The annual production costs (Cjkt of equation (4)) of the three tillage systems are presented in 1980 dollars in Table 1 for a typical 1,100 acre Palouse farm (Hinman et al., 1981; Mohasci et al.; Mohasci). It was assumed that the farmer had
Taylor and Young
100% equity in land and no costs were assigned to land, owner-operator labor, or management. Net returns were therefore imputed to these three inputs. The total crop costs for minimum till were lowest ($156.86 per acre), with heavy till having intermediate total costs ($162.38 per acre) and no till having the highest total costs at $171.76 per acre. Machinery costs (fixed and operating) for no till were only slightly lower than heavy and minimum till due to the high cost and relatively low field efficiency of the no till drill. No-till herbicide costs were substantially higher and fertilizer costs were slightly higher than for the other tillage systems. Five-year weighted average prices of $3.66/bu. for winter wheat and $10.50/cwt. for dry peas were employed to represent 1980 crop prices (Walker and Young). Ideally, real production costs as well as yields might vary systematically as topsoil depth and technology change through time. But because reliable information is lacking to project real cost trends through time in the study area for the examined tillage systems and crops, real production costs and input use levels for each system as well as output prices were held constant at the levels specified above for the simulation period. Crop yields and gross returns could continue to increase through time due to the net impact of technical progress and erosion while real production costs will remain constant as assumed here. Net annual returns to land, owneroperator's labor, and management as measured for this study in equation (4) would then increase through time. This does not mean that net returns to owneroperator labor and management would also necessarily grow. It is anticipated that land value appreciation will continue to capture most of the returns from any future productivity increase, as has occurred in the past. The assumption above that real output prices and production costs will maintain the same relative ratio in the future could
Economics of Soil Conservation
be questioned. In the past several decades, the "parity" ratio has declined over time as production costs have risen relative to output prices. However, given the uncertainty about future supply and demand balances in output and input markets, any assumed future rates of change in the parity ratio (including ours) are arbitrary. Our assumption that real production costs and input use will not increase in the future also implies that technical change rates for future crop yields represent changes in net productivity, as opposed to changes in production due to increased input use reflected in rising real production costs. This assumption reflects our view that any future increases in productivity are more likely to come from relatively low cost genetic engineering or other new technical breakthroughs rather than from continued increased use of energy-intensive inputs such as fertilizers and pesticides as has been the case in the past. For an alternative perspective of the future, readers are referred to a recent application of our model by Bauer, who assumed a continuing rise in future real production costs consistent with past trends. Actual future changes in real production costs, and relative price ratios, ultimately remains an empirical question which will be answered only in the future. In this paper simulation results will be presented for SCS land classes IIe-3 and IVe-10 found on the south and west facing slopes of Palouse hills. Land class IIe-3 was chosen to represent the relatively deep topsoil typical of average Palouse slopes. The hilltop IVe-10 land class was chosen to portray average Palouse hilltops with their characteristically shallow topsoils. The estimated parameters of the Mitscherlich-Spillman yield-topsoil depth response functions for wheat and peas are presented in Table 2 for both OLS and nonlinear least squares (NLS) estimators. For the OLS estimates a priori R values of 0.90 and 0.70 for winter wheat and dry peas, respectively, were imposed, based on 69
July 1985
Western Journal of Agricultural Economics
TABLE 2. Winter Wheat and Dry Pea Yield-Topsoil Depth Function Parameter Estimates with OLS and NLS. Estima-
NumParameter Estimatesa
ticTechCrop
nique
a
b
Winter wheatd
OLS
38.923006' (3.4000760) 39.402890 (3.525214) 636.579226' (206.114490) 640.323637 (198.221086)
40.502883' (4.786037) 43.210259 (7.827500) 711.324483' (252.732000) 1,168.121892 (1,006.030582)
NLS Dry Pease
OLS NLS
Fc Rb
0.90 0.918564 (0.032867) 0.70 0.921543 (0.121718)
ber Obser-
Statistic
R2 0
vations
71.62'
0.4515
89 89
7.92'
0.3786
15 15
Parentheses under parameter estimates contain standard errors for the OLS, and asymptotic standard errors for the NLS estimates. b Set equal to 0.90 for winter wheat and 0.70 for dry pea OLS estimates. c For OLS only. d Yields in bushels/acre. e Yields in pounds/acre. f Significantly different from zero at less than the 5% level. a
earlier research with much larger samples by Pawson et al. (p. 66). The NLS estimate of R for winter wheat was close to that of Pawson et al. The difference in the NLS R value for peas from that of Pawson et al. may be attributed to our small sample size, and/or the algorithm employed. 4 The OLS estimates were used in the simulation modeling. The yield response functions were estimated with a combined cross sectional and time series data set which began in 1970 and ended in 1978. To bring these functions up to 1980 for the start of the 50-year analysis, the time index, t, of the technical progress component of equation (3) ranged from 10 to 60. The pure percentage rate of technical progress is defined as the annual rate of yield growth which would occur on a given piece of land in the absence of topsoil erosion. In contrast, the effective percentage rate of technical progress is that rate of technical progress which would be ob4
The Statistical Analysis System (SAS) NLS algorithm was employed for these estimates. It was very sensitive to starting values which could have limited its accuracy for our sample.
70
served with topsoil erosion. With respect to equation (3), the effective percentage rate of technical progress is defined as [(dYt/dt)/Yj](100). With no topsoil erosion (A = 0), the effective percentage rate of technical progress equals the pure percentage rate of technical progress, r(100). In the simulations a derived historic value of r for dry peas of 0.0098 was used (Taylor, p. 152). To assess the impacts of different rates of future technical progress, the following four values of r were employed for winter wheat: 0.02, 0.0167 (the derived historic value of r (Taylor, p. 151)), 0.01, and 0.005. Crop yields, topsoil depths and per acre incomes were simulated from 1981 through 2030. As discussed above, lacking a nonarbitrary basis for projecting future changes in relative prices, we assumed that all input and output prices, measured in 1980 dollars, remained constant over the simulation period. As the analysis was conducted in real (1980 base year) dollars throughout, it was necessary to use real rather than nominal discount rates. The economic results below are reported for real discount rates of zero and five percent.
Economics of Soil Conservation
Taylor and Young
TABLE 3. Projections of Future Winter Wheat Yieldsa and Topsoil Depthsb by Tillage System on the Hilltop Land Class IVe- 10.
Tillage System
Pure Rate of Technical Progress (%)
Heavy
2.00 1.67 1.00 0.50
Minimum
2.00 1.67 1.00 0.50
No
2.00 1.67 1.00 0.50
a
TABLE 4. Projections of Future Winter Wheat Yieldsa and Topsoil Depthsb by Tillage System on Average Slope Land Class lle-3.
Year 1981
2005
2030
66.22 64.07 59.92 57.00 (4.50) 63.24 61.19 57.22 54.43 (4.50) 55.89 54.07 50.57 48.10 (4.50)
97.59 87.24 69.47 58.61 (2.85) 97.36 87.03 69.30 58.47 (3.58) 88.57 79.17 63.04 53.19 (4.11)
141.59 116.54 78.49 58.44 (1.14) 151.36 124.58 83.90 62.47 (2.62) 142.90 117.62 79.21 58.98 (3.71)
In bushels/acre. inches, figures in parentheses.
b In
Results In the interest of brevity, only the yield results of winter wheat are presented. The reader is reminded that the income results presented later also incorporate the dry pea yields. Tables 3 and 4 present the wheat yield and topsoil depth projections for SCS land classes IVe-10 and IIe-3, respectively. Under all assumed rates of pure technical progress, conservation (minimum and no) tillage yields are projected to surpass those of heavy till by 2030 on the shallow topsoils of land class IVe-10 in spite of the conservation systems' substantial yield penalties (see Table 1). On the deeper topsoils of land class IIe-3, however, heavy till consistently produces superior yields. Minimum till maintains its yield advantage over no till after 50 years, on both land classes. Given the nonlinear nature of the yield-topsoil response function, the additional topsoil retained by conservation tillage systems on a deep topsoil base has a very modest impact on
Tillage System
Pure Rate of Technical Progress (%)
Heavy
2.00 1.67 1.00 0.50
Minimum
2.00 1.67 1.00 0.50
No
2.00 1.67 1.00 0.50
Year 1981
2005
2030
93.06 90.04 84.21 80.10 (24.00) 88.88 85.99 80.42 76.50 (24.00) 78.55 76.00 71.07 67.61 (24.00)
149.25 133.41 106.23 89.62 (22.42) 143.04 127.86 101.81 85.89 (23.12) 126.72 113.27 90.20 76.10 (23.63)
243.71 200.60 135.10 100.58 (20.78) 234.71 193.18 130.11 96.87 (22.20) 208.55 171.65 115.60 86.07 (23.24)
a In bushels/acre. b
In inches, figures in parentheses.
yields over a 50-year period and the yield penalty continues to dominate the yield results across tillage systems. On the shallower topsoils depicted in Table 3 a higher rate of technical progress amplifies the relative benefits of soil conservation. For example, in 2030, the difference in yields between heavy and minimum till with r = 0.02 is 9.01 bushels per acre while with r = 0.005, it is only 3.95 bushels per acre. This illustrates the double penalty associated with topsoil erosion discussed earlier. Yields with heavy till are lower in 2030 due to both the reduction of fertility through topsoil erosion and the inability of severely eroded soil to fully capture the benefits of technological progress. This is not the case for land class IIe-3 (Table 4) because erosion on that land class did not reach critical levels in 50 years. In general, the impact of technical progress on the future yield payoff to soil conservation depends upon the interaction of 71
July 1985
Western Journal of Agricultural Economics
TABLE 5. Sum of the Discounted-Before-Tax Net Income Stream from 1981 through the
t
th
Year in 1980 Dollars per Acre for the Hilltop Land Class IVe-10.
Tillage System
Pure Ratea of Technical Progress (%)
Year (t)
0
Heavy
2.00 1.67 1.00 0.50
28.54 24.61 17.01 11.66
Minimum
2.00 1.67 1.00 0.50 2.00 1.67 1.00 0.50
16.39 12.64 5.38 0.28 -6.00 -9.32 -15.73 -20.24
2.00 1.67 1.00 0.50 2.00 1.67 1.00 0.50
31.40 27.47 19.87 14.53 16.39 12.46 4.86 -0.49
No
Minimum
No
a
5 27.18 23.43 16.20 11.11
0 1,527.08 1,258.77 777.36 466.54
With Yield Penalties 1,291.19 15.61 1,028.20 12.04 556.51 5.13 252.13 0.26 736.68 -5.71 500.09 -8.87 75.87 -14.98 -197.80 -19.28 Without Yield Penalties 1,724.97 29.91 1,449.58 26.16 955.67 18.93 636.94 13.84 1,434.68 15.61 1,154.35 11.86 651.72 4.63 327.47 -0.46
0
5
763.21 633.44 397.94 243.78
4,983.73 3.919.53 2,166.77 1,142.46
1,304.62 1,053.41 621.55 355.56
620.15 493.49 263.73 113.41 306.27 192.65 -13.42 -148.18
4,945.92 3,857.71 2,068.73 1,025.68 3,933.66 2,930.01 1,281.79 322.09
1,182.39 930.68 498.88 233.58 789.26 559.83 166.73 -74.43
857.61 724.98 484.39 326.99 628.68 548.06 303.91 144.23
5,962.04 4,822.54 2,949.27 1,857.07 5,723.03 4,533.87 2,581.02 1,443.93
1,514.00 1,250.43 798.28 520.47 1,339.38 1,067.54 601.78 316.05
5
For winter wheat.
erosion rates and conservation tillage yield penalties. 5 Readers are free to select the rate of technological progress from Tables 3 and 4 which agrees most closely with their own expectations about the future. We suspect that the high, pure technical progress rate in Palouse wheat yields of the past 50 years (1.67% per year) is likely to decrease markedly as a result of resource depletion and other technical constraints. Tables 5 and 6 present the discounted net income stream results (NPVj from equation (4)) of the simulations for selected years for land classes IVe-10 and IIe3, respectively. Other studies have shown 5
2030
2005 Discount Rate (%)
1981
A working paper examining the mathematics of this interaction is available from the authors upon request.
72
that the NPV income results in Tables 5 and 6 are particularly sensitive to the multiplicative yield penalties (P parameter in equation (3)) characterizing conservation tillage (Hinman et al., 1983; Taylor). NPV income results are therefore presented for the minimum and no till systems both with and without the yield penalty. In 50 years, minimum till with the yield penalty did not "pay" on land classes IVe-10 or IIe-3 regardless of the discount rate. In the absence of yield penalties, minimum till provided the highest NPV income on the two land classes in both the short and long run due to its relatively low production costs. On both land classes no till subject to a yield penalty consistently had the lowest NPV income. The long run yield gains from topsoil conservation with no till were insufficient to offset the double handicap
Taylor and Young
Economics of Soil Conservation
TABLE 6. Sum of the Discounted-Before-Tax Net Income Stream from 1981 through the tth Year in Dollars per Acre for the Average Slope Land Class lle-3. Year (t)
Pure Ratea of
Technical Tillage System
Progress (%)
Rate (%)
0
5
0
5
0
5
3,585.04 3,188.02 2,476.24 2,017.12
1,843.79 1,653.34 1,307.99 1,082.16
11,230.91 9,531.70 6,742.26 5,118.80
3,034.52 2,647.71 1,985.25 1,579.06
2,675.56 1,408.91 1,078.50 862.45 1,162.35 1,001.10 708.74 517.56
10,105.72 8,474.23 5,796.27 4,237.96 8,227.21 6,780.20 4,405.28 3,023.45
2,675.56 2,304.72 1,669.70 1,280.42 2,070.97 1,742.37 1,179.76 834.90
1,888.53 1,697.73 1,351.76 1,125.53 1,679.98 1,488.93 1,142.52 916.01
11,439.66 9,731.27 6,927.12 5,295.39 10.732.54 9,018.07 6,204.19 4,566.96
3,099.26 2,710.94 2,046.00 1,638.37 2,833.58 2,444.24 1,777.64 1,369.04
Heavy
2.00 1.67 1.00 0.50
85.93 80.41 69.73 62.21
82.84 76.58 66.41 59.25
Minimum
2.00 1.67 1.00 0.50 2.00 1.67 1.00 0.50
70.45 65.17 54.97 47.79 43.32 38.65 29.64 23.29
With Yield Penalties 3,120.18 67.09 2,740.19 62.07 2,058.98 52.35 45.52 1,619.60 2,336.31 41.25 36.81 1,999.98 1,397.04 28.23 22.19 1,008.16
2.00 1.67 1.00 0.50 2.00 1.67 1.00 0.50
88.80 83.27 72.59 65.08 73.78 68.26 57.58 50.06
Without 84.57 79.31 69.14 61.98 70.27 65.01 54.84 47.68
No
Minimum
No
a
2030
2005
1981
~~~~Technical ~Discount
Yield Penalties 3,666.84 3,268.95 2,555.64 2,095.55 3,298.60 2,900.11 2,185.72 1,724.96
For winter wheat.
of higher costs and direct yield penalties within the 50-year time horizon of this study. Without a yield penalty, no till fared much better, but it still failed to produce incomes superior to heavy or unpenalized minimum till on land class IIe3. On land class IVe-4 unpenalized no till was able to compensate for its cost disadvantage relative to heavy till by year 2030 at both discount rates due to its preservation of topsoil. On this hilltop land class, the unpenalized minimum till still produced a higher NPV by 2030 than no till. Comparing the income results in Tables 5 and 6 illustrates that crop production is considerably more profitable on a per acre basis on the deep topsoils of the average slopes than on the shallow topsoils of the hilltops, regardless of tillage system. This
finding is not likely to surprise Palouse farmers. It would not be valid, however, to linearly expand these per acre land class results in calculating the whole farm income change from ceasing to farm erosion-prone hilltops and steep slopes. Such an alteration in farming practices could lead to reductions in machinery field efficiencies and increased weed and pest control problems originating from the uncultivated areas. These factors could increase production costs and/or decrease yields on the remaining farmed areas. Conclusions and Policy Implications In general, the longer the planning horizon, the more conservation tillage stands a chance of paying off. Also, the shallower 73
July 1985
the topsoil (and/or the more erosive the conventional tillage system), the more conservation in the current period benefits future yields and incomes. Future improvements in conservation tillage technology could reduce or eliminate yield penalties and no-till's cost disadvantage. To the extent that further research and experience with conservation tillage in the region can narrow or eliminate these disadvantages, the private economic payoff of conservation tillage will be enhanced. This suggest a two-stage approach to soil conservation policy for the Palouse. In the short run, cost sharing or price support-cross compliance mechanisms could encourage the expansion of conservation tillage. For the longer term, research to improve the relative yield and income position of conservation tillage should be vigorously pursued. The longterm objective of such research would be to eliminate the need to subsidize conservation tillage to make it profitable. This paper has demonstrated the usefulness of simulation for modeling long run farm level economic and physical impacts of soil conserving farming systems. The heavy-till projections tell Palouse farmers and policymakers the consequences of continuing current farming practices. The no- and minimum-till results demonstrate the consequences of changing those practices. Through the comparison of results like these for their own farming situation, farmers can better assess whether or not conservation tillage will pay off for them. Farmers may add to these results any nonmonetary costs or returns associated with using conservation farming systems, plus any government-provided financial incentives for adopting them. We have shown elsewhere how policymakers can use the long run present value model presented in this paper to calculate the incentives required to equate the long run profitability of conservation tillage to conventional heavy tillage under alternative discount rate, time horizon, and technol74
Western Journal of Agricultural Economics
ogy expectations (Taylor and Young, 1982). The potential "double penalty" impact of erosive farming systems on future crop yields identified in this analysis is particularly relevant in view of the current interest in sustaining and increasing national agricultural and industrial productivity. The yield projection model reveals that unchecked soil erosion in areas like the Palouse has the potential to reduce the payoff from future investments in agricultural research and technology development. This is because genetic improvements and other technical advances of the past have had a larger yield payoff in this region when applied to deeper topsoils. This relationship may well continue in the future. Concern over the ability to capture the benefits of improved technology is more urgent now than ever before because historically richly endowed farming regions like the Palouse appear to be nearing the point where further soil loss may not be offset by technological progress and actual yield declines could occur on some land classes. Finally, in a world of diminishing nonrenewable resource stocks and research funds it would be advantageous if research could be devoted primarily to finding substitutes for current energy intensive inputs without also having to seek substitutes for topsoil. References Alt, K. F. and E. O. Heady. "Economics and the Environment: Impacts of Erosion Restraints on Crop Production in the Iowa River Basin." CARD Report No. 75, Iowa State University, December 1977. Batie, S. S. Soil Erosion: Crisis in America's Croplands? Washington, D.C.: The Conservation Foundation, 1983. Bauer, Steven G. "An Economic Analysis of the Onsite Benefits and Costs of Reducing Soil Erosion Through Conservation Tillage." Unpublished M.S. Thesis, Oregon State University, 1984.
Taylor and Young Bhide, S., C. A. Pope III, and E. O. Heady. "A Dynamic Analysis of the Economics of Soil Conservation: An Application of Optimal Control Theory." CARD Report No. 110, SWCP Series III, Iowa State University, August 1982. Burt, O. R. "Farm Level Economics of Soil Conservation in the Palouse Area of the Northwest." American Journal of Agricultural Economics, 63(1981): 83-92. Cochran, V. L., L. F. Elliot, and R. I. Papendick. "Effects of Crop Residue Management on Yield and Water-Use Efficiency of Direct Drilled Winter Wheat." USDA-ARS-Education Administration Draft paper, Washington State University, April 1981. Ervin, D. E. and R. A. Washburn. "Profitability of Soil Conservation Practices in Missouri." Journal of Soil and Water Conservation, 36/2(1981): 10711.
Economics of Soil Conservation Kaiser, V. G. "Soil Erosion and Wheat Yields in Whitman County, Washington." Northwest Science, 41(1976): 86-91. McConnell, K. E. "An Economic Model of Soil Conservation." American Journal of Agricultural Economics, 65(1983): 83-9. McCool, D. K. "Updated USLE C-Factors." Personal communication, Washington State University, September 1981. Mohasci, S. G. "Crop Production Budgets for Selected Palouse Tillage Systems." Personal communications, Washington State University, March-September 1981. Mohasci, S. G., G. S. Willett, M. A. Wright, and R. W. Carkner. "The Costs of Owning and Operating Farm Machinery in Washington." EM 4035, Cooperative Extension Service, Washington State University, August 1980.
Harder, R. W. "Five Years of Dry Pea Yields for Coventional, Minimum, and No Tillage Continuous Cropping Systems." Unpublished data, University of Idaho, 1981.
Osteen, C. and W. D. Seitz. "Regional Economic Impacts of Policies to Control Erosion and Sedimentation in Illinois and Other Corn Belt States." American Journal of Agricultural Economics, 60(1978): 510-17.
Harder, F. W., C. L. Peterson, and E. Dowding. "Influence of Tillage on Soil Nutrient Availability, Physical and Chemical Properties, and Winter Wheat Yield in Northern Idaho." Paper presented at the Tillage Symposium, Bismark, North Dakota, September 9-13, 1980.
Pawson, W. W., O. L. Brough, J. P. Swanson, and G. M. Horner. "Economics of Cropping Systems and Soil Conservation in the Palouse." Agricultural Experiment Station Bulletin Number 2, Idaho, Oregon, and Washington, 1961.
Harker, J. M. "Soil Conservation and Farm Management Planning: A Descriptive Economic Model." Unpublished M.S. Thesis, University of Idaho, 1977.
Rosenberry, P., R. Knutson, and L. Harmon. "Predicting the Effects of Soil Depletion from Erosion." Journal of Soil and Water Conservation, 35(1980): 131-34.
Harker, J. M., D. J. Walker, E. L. Michalson, J. R. Hamilton, and F. Wetter. "Wheat Yield and Topsoil Depth, a Tentative Assessment for the Palouse." Draft paper, Department of Agricultural Economics, University of Idaho, February 1979. Hinman, H. R. "Eastern Whitman County Crop Production Budgeting." Personal communication, Washington State University, September 1981. Hinman, H. R., D. H. Erickson, and G. S. Willet. "1981 Crop Enterprise Budgets for the Eastern Palouse Region of Eastern Washington." EM 4038, Cooperative Extension Service, Washington State University, February 1981. Hinman, H. R., S. G. Mohasci, and D. L. Young. "Impacts of Tenure Status on Economic Incentives for Conservation Tillage." Journal of Soil and Water Conservation, 38(1983): 287-94.
Steep Project. "A Survey of Crop Production in the Palouse." Unpublished results, Washington State University and the University of Idaho, Departments of Agricultural Economics and Rural Sociology, 1980. Taylor, D. B. "Evaluating the Long-Run Impacts of Soil Erosion on Crop Yields and Net Farm Income in the Palouse Annual Cropping Region of the Pacific Northwest." Unpublished Ph.D. Dissertation, Washington State University, 1982. Taylor, D. B. and D. L. Young. "Cost Sharing, Price Supports, and Taxes: What It Takes to Make NoTillage Competitive in the Long Run." Selected paper presented at the American Agricultural Economics Association/Western Agricultural Economics Association meetings, Logan, Utah, August 4, 1982.
75
July 1985 Taylor, D. B. and D. L. Young. "A Mathematical Model for Projecting the Long Run Impact of Technical Progress and Topsoil Erosion on Future Crop Yields." Technical Bulletin No. XB-0949, College of Agriculture Research Center, Washington State University, 1985. Taylor, D. B., D. L. Young, and D. K. McCool. "Physical-Economic Evaluation of Tillage Systems." In Proceedings of the Symposium on Watershed Management 1980, pp. 985-97. American Society of Civil Engineers, New York, 1980. United States Department of Agriculture. Palouse Cooperative River Basin Study. Government Printing Office, Washington, D.C., 1978. Walker, David. "A Damage Function to Evaluate Erosion Control Economics." American Journalof Agricultural Economics, 64(1982): 690-98. Walker, D. J. and D. L. Young. "Soil Conservation
76
Western Journal of Agricultural Economics and Agricultural Productivity: Does Erosion Pay?" Paper presented at the Western Agricultural Economics Association annual meetings, Lincoln, Nebraska, July 1981. Wetter, F. "The Influence of Topsoil Depth on Yields." Soil Conservation Service Technical Note AGRON-10, Colfax, November 1977. Young, D. L. "Modeling Agricultural Productivity Impacts of Soil Erosion and Future Technology." In Future Agriculture Technology and Resource Conservation, B. English, J. Maetzold, B. Holding, and E. Heady (eds.). Iowa State University Press, Ames, 1984. Young, D. L., D. B. Taylor, and R. I. Papendick. "Erosion and Soil Productivity." In Proceedings of the NationalSymposium on Erosion and Soil Productivity. American Society of Agricultural Engineers, St. Joseph, Michigan, 1985.