download times of Web pages and the network bandwidth required. ..... Cristina Hava, Stefan Holban, Liam Murphy, John Murphy, âInitial tool for monitoring the.
The Influence of Web Page Images on the Performance of Web Servers Cristina Hava Muntean, Jennifer McManis and John Murphy Performance Engineering Laboratory, School of Electronic Engineering, Dublin City University, Glasnevin, Dublin 9, Ireland {havac, mcmanisj, murphyj}@eeng.dcu.ie
Abstract. In recent years World Wide Web traffic has shown phenomenal growth. The main causes are the continuing increase in the number of people navigating the Internet and the creation of millions of new Web sites. In addition, the structure of Web pages has become more complex, including not only HTML files but also other components. This has affected both the download times of Web pages and the network bandwidth required. The goal of our research is to monitor the download times of Web pages from different Web sites, and to find out to what extent the images contained in these Web pages influence these times. We also suggest some possible ways of decreasing the bandwidth requirements and download times of complex Web pages.
1 Introduction At the beginning of the World Wide Web in the early 1990s, most Web pages were text based, with file sizes on the order of hundreds of kilobytes. Nowadays, Web pages have become much more complex. Static and animated pictures, sounds, dynamically generated pages and multimedia components have been included, increasing the typical total size of these Web pages to megabytes. In this way Web pages have become more attractive for their clients, but also more resource-intensive to send and retrieve. The immediate effects are increased delays in accessing the documents and overloading of the network. Thus fewer users are able to access Web site information in a given time period. At the same time Web traffic has become the most common type of traffic on the Internet, and the number of Web sites continues to increase dramatically. Most users who navigate on the Internet want to access a Web site as quickly as possible and don’t have the patience to wait a long time to load overly large Web pages. In order to increase the number of the clients who access a site and to keep those who are already visiting it, the owners of commercial sites should constantly monitor the performance of their servers. One of the most critical parameters is the download time, which gives a good indication of the waiting times for potential clients. Because a Web page consists of not only one HTML file, but a collection of many file types (e.g. HTML, images, JavaScript, Active Server Pages (ASP), cascading style sheets (CSS), MacroMedia’s Shockwave), the page download time is the time to
download all the Web page’s components. While it is possible that the user might care about the download times of individual components, we believe the total download time is in general important. We have monitored the download times for different commercial sites, and analysed their composition with respect to file size and type. Our experimental results show that images represent the biggest percentage of Web page size, and hence account for a considerable proportion of the download time for the page. We observed that some sites use dynamic HTML pages generated by JavaScript files or tags and Active Server Pages to minimize download times. These types of files are run on the client machine and can produce the same effect as a static HTML file with a lot of images inside, but are relatively small in size. The main aim of our research is to determine which components make the largest contribution to the total download time. We also suggest some possible solutions to decrease Web page download times and to reduce overloading of the network.
2
The Structure of the Web Pages
Web pages are composed of multiple object documents. The main document is an HTML object, which can consist of one or more HTML files. The other objects are inline images or animations and Java applets. A browser accesses all these objects from the Web server using the HTTP protocol. The number and size of the object documents embedded in the Web page influence the download time of the Web page. Two types of the HTTP protocols are in use. The HTTP/1.0 protocol retrieves objects using a separate TCP connection for each object retrieved. Thus, multiple connections are created simultaneously between the server and the browser. As the number of components increases, more requests must be sent to the server, thereby increasing the total download time. Along with all the requests sent by other clients, these could easily overwhelm the server. The second protocol, HTTP/1.1 supports persistent connections between the server and the client. In this case a single connection is used and all the document objects are delivered sequentially. The use of the HTTP/1.1 protocol reduces the connection overhead by using a single connection for getting all the components. However, the sequential nature of the retrieval might reduce the performance improvement in the case of many components. We analysed a number of Irish commercial Web sites, to determine the structure of their Web pages and the contribution of their components to the overall size. Specifically, we determined the structure of the main Web page (total size of the Web page, number of images, the percent of HTML and image files). The results are listed in Table 1.
Table 1. Statistics about the composition of the studied Web pages
Sites Web Server 1 Web Server 2 Web Server 3 Web Server 4 Web Server 5 Web Server 6 Web Server 7 Web Server 8 Web Server 9 Web Server 10 Web Server 11
Total size (KB) 368.5 331.6 136.9 71.3 72.0 113.2 57.1 78.9 117.6 86.6 51.5
Html file size (%) 1.06 4.70 8.66 3.53 9.30 0.75 17.27 0.23 7.28 13.69 13.66
Images size (%) 98.94 88.53 73.90 76.26 90.70 51.01 68.53 86.33 92.71 85.83 33.39
Other size Number of (%) Images 0 2 6.77 90 17.44 26 20.22 13 0 8 48.24 59 14.11 14 13.44 28 0 6 0.48 43 52.95 88
For the analysed Web sites, we see that - with the exception of Web Server 6 and Web Server 11 - images represent by far the biggest component of the Web pages. Some of the pages also have a large number of images. Both size and number of images could affect both network and server performance, especially in peak hours when there are a lot of clients visiting the page. Apart from images, the studied Web pages included other multimedia components such as JavaScript, ASP, and MacroMedia’s Shockwave files. To find out how images influence the access time of the Web pages, we did different tests for the sites in Table 1. In order to isolate those factors relating strictly to the composition of the Web page, we also analysed the structure of different Web pages from the same site. In this way, we could account for the influence of the network path and the performance of the server machine. These tests and their results are presented in the next section.
3 Experimental Results For our experiments we used the commercial sites presented in Table 1. These sites span a range of sizes, but all of them contain HTML, images, and other types of files. Download times are measured using a tool developed in the Performance Engineering Laboratory at Dublin City University [1, 2]. In our first experiment, we measured the effect of images on download times by comparing download times of the main HTML file for each site with that of the main page in its entirety. In our second experiment, we measured the effect the number of images had on download time under different network and server loadings. Different loadings are achieved by taking measurements throughout the working day. In our third experiment, we attempt to isolate the effect of page composition on performance from other factors of network and server loading. This is achieved by testing different Web pages from the same site.
3.1 Experiment 1: Effect of the Images on Download Times
Download Time Of The Main Web Page For The Web Server 5 6000 5000 4000 3000 2000 1000
:3 0
18
:3 0
:3 0
17
:3 0
15
16
:3 0
:3 0
14
:3 0
13
:3 0
11
12
:3 0
10
08
09
:3 0
0 :4 5
Loaded time (msec)
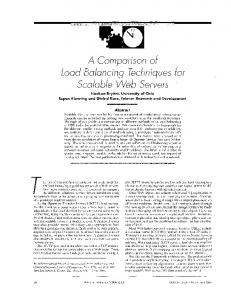
To find out how much the images of a page influence the download time, we made a comparison between the download time of the main page and the download time of the main HTML file. As an example, the load times of the main Web page from the Web Server 5, with and without the images, are shown in Figure 1.
Time with images
without images
Fig. 1. Comparison of the download time of the main page from Web Server 5 with and without all its components
We observe that the time necessary to download the main page and all its associated files is approximately four times as large as the time to download just the main HTML file. This increase is due to the eight images that are part of the page. These eight images represent 90.7% of the size of the Web page. In addition to taking a long time to download, these images are responsible for a significant increase in Web traffic. 3.2 Experiment 2: Sensitivity of Performance to Web Page Composition In our second experiment we demonstrate that Web pages with a large number of images are more sensitive to network and server loading than those with fewer images. We compare measurements for four different pages having a large difference in the number of images. Two of the main pages (Server 5 and Server 9) have less than ten images, while the other two pages (Server 11 and Server 2) have around ninety images each. We periodically monitored the download time for the pages during a weekday, between 8:45 am and 6:30 pm. The download time at 8:45 am is taken to be a baseline measurement and a growth factor is measured as the ratio of the current download time to the download time at 8:45 am. Our results are summarised in Figure 2.
200% 180% 160% 140% 120% 100% 80% 60% 40% 20% 0% -20% -40%
08 :4 5 09 :3 0 10 :3 0 11 :3 0 12 :3 0 13 :3 0 14 :3 0 15 :3 0 16 :3 0 17 :3 0 18 :3 0
Percent
The Download Time Growth Analysed During A Week-Day
Time
Web Server 5
Web Server 11
Web Server 2
Web Server 9
Fig. 2. Download time growth for different Web pages during a day
As can be seen, the pages with a large number of images had a much larger growth than the pages with a small number of images. This indicates that a large number of images can seriously affect Web server performance. 3.3 Experiment 3: Effect of Number and Size of Images on Download Time In Experiment 2, many factors might have influenced the download time including not only the Web page composition, but also the server performance, the network traffic and the distance from the client to the Web server (although all the Web servers are located in Ireland). In order to isolate the effect of page composition on the download time, we compare different pages from the same site. Pages are chosen with different numbers and/or sizes of images. First we look at pages that have varying numbers of images, but are all of similar size and with similar percentage of the size being accounted for by images. Second we look at pages where both number and size of images vary. In both cases the download times are measured for various server loadings, and the relative degradation of performance is obtained. From Web Server 2 we chose three different Web pages with different numbers of images (between sixty-eight and ninety), but with similar image sizes as a percentage of the total size of the Web page. Because most of the problems of the Web servers' performance appear during the peak-hours period, we analysed the response time of the server for that period. Server loads were generated by making parallel requests for the page. Measurements are taken for 1, 10, 30 and 100 parallel requests. These measurements are summarised in Table 2. Growth is defined as the ratio of the current download time to the download time for a single client request.
Table 2. The average download times during the peak hours of different Web pages from Web Server 2 with a variable number of simultaneous accesses
Web Page Number Page 1 Page 1 Page 1 Page 1 Page 2 Page 2 Page 2 Page 2 Page 3 Page 3 Page 3 Page 3
Page Size Number Img. Number Average (KB) of Size (%) of Parallel Download Images Clients Time (sec) 292.5 90 87.51 1 14.88 292.5 90 87.51 10 18.85 292.5 90 87.51 30 25.75 292.5 90 87.51 100 54.39 231.8 75 88.89 1 11.34 231.8 75 88.89 10 12.86 231.8 75 88.89 30 18.89 231.8 75 88.89 100 37.27 209.4 68 89.65 1 12.25 209.4 68 89.65 10 13.50 209.4 68 89.65 30 18.80 209.4 68 89.65 100 39.04
Growth
1.00 1.27 1.73 3.66 1.00 1.13 1.67 3.29 1.00 1.10 1.53 3.19
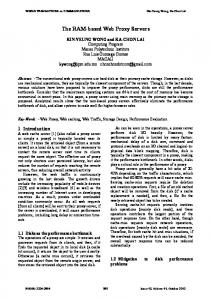
When the number of clients who access the same Web page in parallel increases, the growth factor of the download time is bigger. Thus, more and more requests for the components of the Web page are sent to the server overloading it. Comparing Web Page 3 with Web Page 1 there is a significant difference of the download time growth when there are 100 clients in parallel. The growth factor for the three pages is presented in Figure 3.
Growth
The Growth Of The Access Time For Different Web Pages From The Web Server 2 4 3.5 3 2.5 2 1.5 1 0.5 0 1
10 30 Number of Clients Page 1
Page 2
100 Page 3
Fig. 3. Access time growth during peak-hours for different pages from Web Server 2
We see that Page 1 has the worst performance and it has the largest number of images. Page 1 is also slightly larger than Page 2 and Page 3, with a larger image size.
In order to study the effect of the size of the images versus the number of images on download time, a similar analysis was done for three Web pages from Web Server 8. For these pages, both the size of the images and the number of images varies. The composition of the Web pages is summarised in Table 3. Table 3. The access time of Web pages with various numbers of images from Web Server 8
Web Page Number
Page Size Number (KB) of Images 78.9 27 78.9 27 78.9 27 78.9 27 43.5 39 43.5 39 43.5 39 43.5 39 36.9 17 36.9 17 36.9 17 36.9 17
Page 1 Page 1 Page 1 Page 1 Page 2 Page 2 Page 2 Page 2 Page 3 Page 3 Page 3 Page 3
Img. Size (%) 86.29 86.29 86.29 86.29 54.37 54.37 54.37 54.37 53.20 53.20 53.20 53.20
Number Average of Parallel Download Clients Time(sec) 1 7.90 10 8.83 30 19.65 100 42.19 1 2.78 10 3.98 30 7.30 100 19.09 1 2.23 10 2.55 30 4.01 100 11.62
Growth
1.00 1.12 2.49 5.34 1.00 1.43 2.62 6.87 1.00 1.14 1.80 5.21
A comparison between the download time for Page 2 and Page 3 shows the influence of the number of the images. Although Page 2 and Page 3 are similar in size and size of images, at 100 requests Page 2 takes nearly twice as long to download as Page 3. The growth factors for the three pages are plotted in Figure 4.
Growth
The Growth Of The Download Time For Different Web Pages From The Web Server 8 8.00 7.00 6.00 5.00 4.00 3.00 2.00 1.00 0.00 1
10 30 Number of Clients Page 1
Page 2
100 Page 3
Fig. 4. Growth factors for different Web pages for Web Server 8
A comparison of Page 1 and Page 2 indicates that the number of images has a greater influence on performance sensitivity than the size of images. Page 2 is smaller, but has a greater number of images than Page 1. The growth factors for Page 2 are consistently larger than those for Page 1.
4 Conclusions and Future work The results of this study lead to a number of interesting observations about some factors that could influence Web Server performance. These factors include: the number of images, the total size of the images, a large number of clients accessing the Web server simultaneously, and the period of time (peak/off-peak hours) when the requests are made. The work reported here suggests that the number of images has a disproportionate effect on server performance, particularly when the server is heavily loaded. In order to ascertain if our assumption regarding loading patterns is correct, it will be necessary to either measure or control the loading of the Web pages. Experimental results suggest that images do have a great influence on download time. This indicates that designers of Web pages need to find a compromise between the look of a page (with lots of attractive pictures) and the performance seen by clients of the page (for which download time is a reasonable measure). Many static solutions exist to improve download time: for example, a faster Internet connection, a better-performing server, and smaller Web page sizes. A significant amount of effort has gone into minimizing image sizes and bandwidth requirements. A lot of research on compression algorithms has been done suggesting that one may reduce the size of an image file, keeping a good image quality [3]. Also UC Berkeley's Transend [4], Intel's QuickWeb [5] and Spectrum's FastLane [6] systems tried to improve the access to slow links reducing image size via lossy compression using Web proxies which transform the images in ones with resolution and color reduction. Gilbert and Brodersen [7] proposed a methodology to improve Web access using a new technique called global progressive interactive Web delivery, which entails applying progressive coding to the document transmission process in its entirety. Another solution is to use DHTML animations created with JavaScript, MacroMedia’s Shockwave/Flash, or Microsoft’s DirectAnimation instead of image files (currently, most of the images on the Web are GIF or JPEG [8]). The effect of these files is more spectacular and their use decreases the number of connections created between the browser and Web server, thus reducing bandwidth requirements. Other possible solutions to improve the download time are presented in [9] where ways are suggested to reduce the number of bits each page needs and to make the JavaScript code faster. We suggest that a class of dynamic solutions should also be considered. For example, the Web server could monitor its download times and reduce the amount of information sent during peak times. Transmitting only some of the embedded files will reduce the Web page content quality. In this case a compromise between the quality of the Web page and the performance of the server has to be made. It may also be possible for the client to monitor the speed of the download and control how much information they want to receive. In this way the client's perception of the Web page
would take into account the page's size and composition, and how these affect the expected waiting time.
References 1. 2. 3. 4. 5. 6. 7. 8.
9.
Cristina Hava, Liam Murphy, “Performance measurement of WWW Servers”, 16th IEE UK Teletraffic Symposium, Harlow, United Kingdom, May 2000. Cristina Hava, Stefan Holban, Liam Murphy, John Murphy, “Initial tool for monitoring the performance of Web Sites”, CONTI’2000, Timisoara, Romania, October 2000. Uwe Rauschenbach, “Compression of Palettized Images with Progressive Coding of the Color Information”, SPIE2000, Perth, Australia, June 2000. Fox Armando, Steve Gribble, Yatin Chawathe and Eric Brewer, "The Transend Service", http:// transend.cs.berkeley.edu/about Intel Corporation, "QuickWeb homepage", http://www.intel.com/guickWeb Spectrum Information Technologies homepage, http://www.spectruminfo.com J Gilbert and R. Brodersen, "Globally progressive interactive Web delivery", IEEE Infocom'99 Conference, New York, March 1999. Adrian Vanzyl, “Increasing Web Bandwidth through Image Compression: An overview of GIF, JPEG and Fractal Compression Techniques”, AusWeb95, http://www.scu.edu.au/sponsored/ausWeb/ausWeb95 Michael Wallent, “Frequent Flyers: Boosting Performance on DHTML Pages”, MSDN Online Voices, http://msdn.microsoft.com/workshop/