ACCIDENT RESEARCH CENTRE
THE INTERACTION BETWEEN SPEED CAMERA ENFORCEMENT AND SPEED-RELATED MASS MEDIA PUBLICITY IN VICTORIA
Max Cameron Stuart Newstead Kathy Diamantopoulou Penny Oxley
March, 2003 Report No. 201
ii
MONASH UNIVERSITY ACCIDENT RESEARCH CENTRE REPORT DOCUMENTATION PAGE Report No. Date ISBN Pages 201 March 2003 0 7326 1710 3 xiv + 116 Title: The interaction between speed camera enforcement and speed-related mass media publicity in Victoria Authors: Type of Report & Period Covered: 1996-2000 Max Cameron 1 Stuart Newstead Kathy Diamantopoulou Penny Oxley Sponsoring Organisations: This project was funded through the Centre’s Baseline Research Program for which grants have been received from: Department of Justice Roads Corporation (VicRoads) Royal Automobile Club of Victoria (RACV) Ltd Transport Accident Commission Abstract: The objective of this study was to measure the presence of any interaction between the effect of mobile covert speed camera enforcement and the effect of intensive mass media road safety publicity with speedrelated themes. Previous research had shown the individual effect of each of these powerful road safety programs in Victoria, but had not been able to conclusively assess their interaction effect. During 1999, the Victoria Police varied the levels of speed camera activity substantially in four Melbourne police districts according to a systematic plan. Camera hours were increased or reduced by 50% or 100% in respective districts for a month at a time, during two separate months when speed-related mass media advertising was present and during two months when it was absent. Other Melbourne police districts remained unchanged. Monthly frequencies of casualty crashes, and their severe injury outcome, in each district during 1996-2000 were analysed using Poisson Regression Modelling and Logistic Regression, respectively, to test statistically the effects of the enforcement, publicity and their interaction. In these analyses, the enforcement was represented by five levels of speeding tickets emanating from camera activity during the previous month in the same district, and the publicity by a measure of retained awareness of past and current television advertising intensities. Reductions in crash frequency were associated monotonically with increasing levels of speed camera ticketing, and there was a statistically significant 41% reduction in fatal crash outcome associated with very high camera activity. High publicity awareness was associated with 12% reduction in crash frequency, but publicity appeared to be unrelated to crash severity. The interaction between the enforcement and publicity was not statistically significant. When two styles of speed-related publicity were analysed separately, the above results were seen to be due to emotive-style rather than enforcementstyle advertising. It was concluded that there was no evidence of an interaction between the effects of speed camera ticketing and speed-related publicity awareness on the frequency of casualty crashes. The effect of speedrelated publicity during 1996-2000 was due to advertising with emotive styles. This research questions strategic principles suggesting that speed camera enforcement and speed-related mass media publicity should operate together to produce maximum effect. However, the study considered changes in speed camera hours of only one month duration. Longer periods of increased speed camera activity may produce greater effects and different interactions with mass media publicity.
Key Words: (IRRD except when marked*) Speed, speed camera, enforcement, publicity, advertising, crashes, injury, analysis.
Reproduction of this page is authorised. 1
Author may be contacted by internet e-mail at
[email protected]
Monash University Accident Research Centre, Building 70, Monash University, Victoria, 3800, Australia. Telephone: +61 3 9905 4371, Fax: +61 3 9905 4363
iii
iv
PREFACE Project Manager / Team Leader: Professor Max Cameron Research Team: •
Stuart Newstead, Senior Research Fellow
•
Kathy Diamantopoulou, Research Fellow
•
Penny Oxley, Research Assistant
ACKNOWLEDGEMENTS The authors would like to thank the following for their substantial contributions to this project: •
Mr John Bodinnar, formerly Superintendent, Traffic Camera Office, and subsequently Chief Superintendent, Commercial Development Group, Victoria Police
•
Chief Inspector David Richardson, Officer-in-Charge, Traffic Camera Office, Victoria Police and his staff
•
Mr David Healy, General Manager Road Safety, Transport Accident Commision
•
Mr Terry O’Donoghue, General Manager, Tenix Solutions (formerly LMT Australia) and his staff
Mr Warren Harrison and Ms Emma Fitzgerald contributed to the literature review and to the design, conduct and analysis of the survey component of this project. The views expressed in this report are those of the authors and are not necessarily those of any of the persons acknowledged above.
v
vi
CONTENTS EXECUTIVE SUMMARY ..................................................................................................................... XI 1
INTRODUCTION............................................................................................................................. 1
2
LITERATURE REVIEW................................................................................................................. 2 2.1 SPEEDING AND ENFORCEMENT ............................................................................................. 2 2.2 EFFECT OF PUBLICITY ON SPEED AND CRASHES.............................................................. 3 2.3 INTERACTION BETWEEN ENFORCEMENT AND PUBLICITY............................................ 7
3
STUDY OUTLINE............................................................................................................................ 8 3.1 3.2 3.3 3.4 3.5
4
BACKGROUND ............................................................................................................................ 8 PROJECT OBJECTIVES............................................................................................................... 8 METHODOLOGY ......................................................................................................................... 9 STUDY DESIGN ........................................................................................................................... 9 GENERAL DESIGN ...................................................................................................................... 9
SPEED CAMERA OPERATIONS & SPEED-RELATED PUBLICITY.................................. 13 4.1 SPEED CAMERA HOURS PER MONTH.................................................................................. 13 4.2 SPEED-RELATED PUBLICITY................................................................................................. 17
5
PRELIMINARY CRASH ANALYSIS.......................................................................................... 19 5.1 TRENDS IN THE CRASH DATA .............................................................................................. 19 5.2 CRASH OUTCOME MEASURES .............................................................................................. 20 5.3 PRELIMINARY ANALYSIS METHOD .................................................................................... 21 5.3.1 Casualty Crash Frequency................................................................................................... 21 5.3.2 Crash Severity...................................................................................................................... 22 5.4 SUMMARY OF PRELIMINARY ANALYSIS........................................................................... 23 5.5 LIMITATIONS OF PRELIMINARY ANALYSIS...................................................................... 25
6
ENFORCEMENT AND PUBLICITY INTERACTION EFFECTS ON CRASHES................ 26 6.1 BACKGROUND .......................................................................................................................... 26 6.2 ANALYSIS ISSUES AND AIMS................................................................................................ 26 6.3 CRASH DATA............................................................................................................................. 27 6.4 SPEED ENFORCEMENT DATA................................................................................................ 27 6.5 SPEED-RELATED ADVERTISING DATA............................................................................... 31 6.5.1 Speed-related advertising awareness................................................................................... 33 6.5.2 Speed-related enforcement-style advertising awareness ..................................................... 33 6.5.3 Speed-related emotive-style advertising awareness............................................................. 34 6.6 ANALYSIS METHODOLOGY................................................................................................... 35 6.6.1 Types of analysis .................................................................................................................. 35 6.6.2 Model Assumptions .............................................................................................................. 35 6.6.3 Model Specification ............................................................................................................. 35 6.6.4 Analysis Models ................................................................................................................... 36 6.6.5 Goodness of Fit .................................................................................................................... 37 6.6.6 Inclusion of interaction term................................................................................................ 38 6.7 MODELLING RESULTS ............................................................................................................ 38 6.7.1 Interpretation of Results ...................................................................................................... 38 6.7.2 Model 1: Speed Camera TINs & Speed-related Advertising (all styles).............................. 39 6.7.3 Model 2: Speed Camera TINs & Speed-related Enforcement-style Advertising.................. 44 6.7.4 Model 3: Speed Camera TINs & Speed-related Emotive-style Advertising......................... 48
vii
7
DRIVER PERCEPTIONS AND REPORTED BEHAVIOUR.................................................... 51 7.1 GENERAL DESIGN .................................................................................................................... 51 7.2 TELEPHONE SURVEYS ............................................................................................................ 51 7.3 ANALYSIS................................................................................................................................... 53 7.4 SAMPLE CHARACTERISTICS ................................................................................................. 54 7.5 RESULTS OF THE SURVEY ANALYSIS................................................................................. 55 7.5.1 Sample Description by Condition......................................................................................... 55 7.5.2 Awareness of Advertising ..................................................................................................... 55 7.5.3 Awareness of Enforcement ................................................................................................... 56 7.5.4 Perceived Risk of Detection ................................................................................................. 58 7.5.5 Intention to Speed................................................................................................................. 60 7.5.6 Researchers’ Discussion of Survey Results.......................................................................... 61
8
INTERPRETATION OF THE SURVEY RESULTS .................................................................. 62 8.1 8.2 8.3 8.4
9
TIMING OF ENFORCEMENT EFFECTS .................................................................................. 62 TIMING OF PUBLICITY AWARENESS................................................................................... 63 INTERPRETATION OF SURVEY CONTRASTS ..................................................................... 63 STATISTICAL POWER OF SURVEY CONTRASTS ............................................................... 65
GENERAL DISCUSSION AND CONCLUSIONS ...................................................................... 68 9.1 DISCUSSION OF CRASH ANALYSIS ...................................................................................... 68 9.1.1 Preliminary crash analysis................................................................................................... 68 9.1.2 Analysis of enforcement and publicity interaction effects on crashes .................................. 68 9.1.3 Effects on casualty crash frequency ..................................................................................... 68 9.1.4 Effects on casualty crash severity ........................................................................................ 69 9.2 DISCUSSION OF SURVEY COMPONENT .............................................................................. 70 9.3 GENERAL DISCUSSION ........................................................................................................... 71 9.3.1 Interaction effects................................................................................................................. 71 9.3.2 Effects of levels of speed camera activity ............................................................................. 71 9.3.3 Effects of speed-related mass media publicity...................................................................... 72 9.3.4 Limitations of the study ........................................................................................................ 72 9.4 CONCLUSIONS .......................................................................................................................... 73
10
REFERENCES ................................................................................................................................ 75
11 APPENDIX A: MONTHLY SPEED CAMERA HOURS IN THE COMPARISON DISTRICTS .............................................................................................................................................. 79 12
APPENDIX B : RESULTS FROM PRELIMINARY CRASH ANALYSIS .............................. 83 12.1 METHOD OF ANALYSIS ...................................................................................................... 83 12.1.1 Casualty Crash Frequency .............................................................................................. 83 12.1.2 Crash Severity.................................................................................................................. 85 12.1.3 Hypothesis Tests .............................................................................................................. 87 12.1.4 Statistical Methodology ................................................................................................... 88 12.2 TREATMENT 2: 100% INCREASE IN SPEED CAMERA ENFORCEMENT WITH SPEED-RELATED PUBLICITY PRESENT ................................................................................................................................ 89 12.2.1 Effects on casualty crash frequency................................................................................. 89 12.2.2 Effects on crash severity .................................................................................................. 91 12.3 TREATMENT 1: 100% INCREASE IN SPEED CAMERA ENFORCEMENT WITH SPEEDRELATED PUBLICITY ABSENT....................................................................................................... 93 12.3.1 Effects on casualty crash frequencies .............................................................................. 94 12.3.2 Effects on crash severity .................................................................................................. 95
viii
12.4 TREATMENT 3: 50% INCREASE IN SPEED CAMERA ENFORCEMENT WITH PUBLICITY ABSENT.......................................................................................................................... 96 12.4.1 Effects on casualty crash frequency................................................................................. 96 12.4.2 Effects on crash severity .................................................................................................. 97 12.5 TREATMENT 4: 50% INCREASE IN SPEED CAMERA ENFORCEMENT WITH PUBLICITY PRESENT........................................................................................................................ 98 12.5.1 Effects on casualty crash frequency................................................................................. 99 12.5.2 Effects on crash severity ................................................................................................ 100 12.6 TREATMENTS THAT HAD REDUCTIONS IN SPEED CAMERA ENFORCEMENT LEVELS .............................................................................................................................................. 102 12.6.1 Treatment 5: No speed camera enforcement and no speed-related publicity............... 102 12.6.2 Treatment 6: No speed camera enforcement with speed-related publicity present ....... 103 12.6.3 Treatment 7: 50% reduction in speed camera enforcement with speed-related publicity absent 104 12.6.4 Treatment 8: 50% reduction in speed camera enforcement with speed-related publicity present 106 13
APPENDIX C: SPEED CAMERA TINS BY MONTH DETECTED ...................................... 109
14 APPENDIX D: ANALYSIS MATRIX OF LAGGED SPEED OFFENCE DETECTIONS, BY POLICE DISTRICT AND MONTH DURING 1996-2000 ................................................................ 113 15 APPENDIX E: ANALYSIS MATRIX OF TAC SPEED-RELATED PUBLICITY ADSTOCK, BY STYLE OF ADVERTISING AND MONTH DURING 1996-2000............................................. 115
ix
x
EXECUTIVE SUMMARY Background The Transport Accident Commission and the Victoria Police work together to ensure that advertising campaigns and enforcement programs are coordinated, often with enforcement and advertising programs targeting similar high-risk behaviours. In the speed domain, the combined effect of enforcement and publicity may be simply additive, or potentially synergistic where the combined effect may be larger than expected given the effect of either program on its own. It was considered important to understand how speed camera enforcement and speed-related publicity interact, specifically in relation to their effect on the risk of casualty crashes and the injury severity of the crash outcomes. The study also aimed to determine whether varying the levels and co-presentation of publicity and enforcement resulted in a change in perception of the level of speed enforcement and TAC advertising, and whether there was a change in self reported driving behaviour and perceived risk of being caught when speeding. Previous research conducted by MUARC indicates that the speed camera program conducted by the Police and the road safety publicity program conducted by the TAC are individually linked to reductions in crashes, however, little is understood about the interaction between these two programs. During 1999, speed camera operations were planned to increase in two Melbourne Police Districts, by either 50% or 100% for a month at a time, during two selected months when TAC speed-related publicity was present and two months when it was absent. One of this project’s objectives was to examine the effects on crashes in the two Districts, and also the effects in Districts in which camera operations were reduced, since this had also occurred. In addition, the project also included a component that surveyed drivers’ perceptions and reported driver behaviour in response to the increased speed enforcement and the related publicity. Crash Analysis A preliminary analysis of the crash data was undertaken to examine the direct effects of the changed levels of speed camera hours, during the presence or absence of speed-related publicity, in the Districts and during the months in 1999 when these changes occurred. The preliminary analysis did not hypothesise nor examine any delayed or residual effects of the enforcement or publicity. The preliminary analysis was also limited in that only the months when speed camera enforcement conditions had been changed were considered, i.e. only crashes during April, June, August and November, thereby omitting the other months of the year. This analysis ignored substantial crash data that would increase the statistical power of the tests, particularly in relation to measuring the publicity effects. The principal crash analysis took into account crash data from all of the months of the period 1996-2000, thus providing a more sensitive test of the presence of enforcement and publicity effects and their interaction. This analysis also included seasonality and year-level components, thereby offering a better explanation of the crash variations and increasing the sensitivity of the tests. The analysis represented the enforcement impact level by the number of speeding Traffic Infringement Notices (TINs) from offences detected in the same District during the previous month. It represented the advertising impact level by the Adstock of television TARPs (Target Audience Rating Points) in previous weeks. Adstock is a measure of retained awareness of past and current levels of TARPs, based on an exponential decay function (using a half-life of 5
xi
weeks). The influence of TAC advertising (measured by Adstock) was considered in three different ways, namely: • speed-related advertising (all styles) • speed-related enforcement-style advertising • speed-related emotive-style advertising. The analysis was designed to be conservative, making as few assumptions about the relationships between crash outcomes and the explanatory factors as possible, especially the functional forms of the relationships. The aim was to develop models of monthly casualty crash frequencies and monthly crash severity levels for each Melbourne Police District as functions of the level of speed camera enforcement and the level of speed-related TAC advertising achieved per month, and the interaction between these two input factors. By doing this, the statistical significance of the interaction, and each of the main factors, was tested. Two statistical techniques belonging to the Generalised Linear Modelling family were used to analyse the effect of the enforcement and advertising on crash outcomes during 1996-2000. The first was Poisson Regression Modelling, to determine the effect on casualty crash frequency, and the second was Logistic Regression, to determine the effect on the severity of the crashes. Surveys of Driver Perceptions and Reported Behaviour Telephone surveys of drivers’ awareness of the enforcement increases and publicity presence were conducted in each of the Police Districts in which speed camera activity had been increased in 1999, during the month of increase. There were five survey waves, each conducted over five to eight working days. A survey conducted in February (prior to the first enforcement period) acted as a baseline comparison to allow measurement of the relative effects on the perceived risk of detection of the increased enforcement in the context of the presence or absence of publicity relating to speeding. The surveys were conducted at the end of each relevant month to ensure that the enforcement and publicity had an opportunity to be observed. The surveys of driver perception and self-reported behaviour were analysed and reported before information had been obtained on the actual enforcement and publicity levels and before any crash analysis had been conducted. The survey analysis had assumed that the effects of the increased enforcement and presence of speed-related publicity could be observed in surveys conducted at the end of months in which these changes occurred. Subsequently available data and reconsideration of likely effect mechanisms cast doubt on these expectations. The timing of the surveys was such that drivers were unlikely to have perceived the increase in speed camera activity, by either the receipt of one or more speeding TINs or knowledge of other drivers who had. The covert nature of speed camera operations would have minimised the perception through direct observation. For related reasons, the surveys were unable to provide evidence of the presence or absence of an interaction between the effects of the enforcement increase and the publicity presence. The survey results were considered inconclusive regarding the presence or absence of interaction effects. However, the survey results were conclusive about the effect of the speed-related publicity on the ratings of the perceived risk of detection for speeding. Results and Conclusions This study of the interaction of the effects of mobile covert speed camera enforcement and intensive speed-related mass media publicity in Victoria during 1996-2000 found the following results and reached the following conclusions: 1. There was no evidence of an interaction in the effects of the enforcement and the publicity on casualty crash frequency.
xii
2. The number of speeding tickets detected by speed cameras in Melbourne Police Districts influenced the casualty crash frequency in the same district during the following month. Casualty crashes were reduced by 3.0% following months with very high levels of speeding tickets (more than 30% greater than average) and increased by 6.8% following months with very low levels of speeding tickets (less than 30% lower than average). 3. The risk of fatal outcome of the casualty crashes was also related to the number of speeding tickets detected in the district during the previous month. The fatality risk was reduced by 41% following months with very high levels of speeding tickets and increased by 44% following months with very low levels of speeding tickets. 4. High levels of awareness of TAC speed-related publicity with emotive styles produced casualty crash reductions in Melbourne during the months in which it occurred. Casualty crashes were reduced by 12-13% when awareness, measured by the Adstock of television advertising levels, of emotive-style speed-related publicity exceeded 500 Adstock units, compared with effects during lower levels of awareness of the publicity. 5. There was no evidence of an effect of the emotive-style speed-related publicity on the injury severity outcome of the casualty crashes. 6. Drivers’ perceptions of the risk of detection when speeding was increased by high levels of awareness of the speed-related publicity, compared with the perception when the awareness was at medium levels. The study also reached the following tentative conclusions: 7. There was an interaction effect on fatal casualty crash outcome when there were very high levels of speeding tickets in the previous month and high levels of awareness of enforcement-style speed-related publicity. The reduction in risk of fatal outcome was greater than expected from effects estimated when the enforcement and publicity operated alone at these levels. 8. There was no evidence that awareness of the speed-related publicity with enforcement styles contributed to casualty crash reductions during 1996-2000. This was not inconsistent with the apparent interaction of this type of publicity with the speed camera enforcement in terms of the effect on the severity outcome of casualty crashes (conclusion 7 above). This study is limited in its ability to generalise to all circumstances of speed camera operations in conjunction with speed-related publicity because of the short (one-month) period during which speed camera hours were increased (and decreased) in selected Police Districts during 1999. The 1999 extreme variations in enforcement activity played an important role in the sensitivity of the crash analysis (though it should be noted that there were other months during 1996-2000 when TINs detected by speed cameras achieved very high and very low levels in individual Districts, thus also contributing to the sensitivity of the analysis). It is possible that, with longer periods of change in speed camera levels, drivers may have developed stronger perceptions of the increased enforcement through personal experience of receiving TINs, knowledge of other drivers who had, and perhaps even direct observation of camera operations. A longer period of change may have led to stronger effects of the presence (or absence) of the enforcement on speed behaviour and hence on crashes. The interaction of these enforcement changes with speed-related publicity may also have been different, and the interaction may have been related to the style of publicity in different ways.
xiii
xiv
1
INTRODUCTION
Excessive speed has long been recognised as a major factor in road crashes, and has led to extensive research into the factors which contribute to speeding behaviour (Fildes & Lee, 1993; French, West, Elander, & Wilding, 1993; Gregersen & Bjurulf, 1996; Harrison, Fitzgerald, Pronk, & Fildes, 1998). Speed plays a substantial role in both accident severity and accident causation. There is a clear relationship between speed and accident severity. The energy expended at the time of impact is a function of the mass of the vehicle multiplied by the velocity squared, thus slight increases in speed lead to a much greater increase in the kinetic energy to be dissipated in a crash. Therefore the greater the speed of the vehicle, the greater the likelihood of injury, severe injury or death (Cowley, 1987). The link between accident causation and excessive speed is not as clear, although speed has been shown to play a contributory role in a percentage of accidents. Cooper (1997) reported that drivers who had committed ‘excessive speed’ violations, as opposed to exceeding the speed limit violations, were found to have twice the overall crash rate of drivers who exceeded limit, and these drivers were twice as likely to have unsafe speed associated with their crash involvement. An extensive review of the literature concluded that excessive speed was a factor in between 12% and 16% of all motor vehicle accidents (Fildes & Lee, 1993). There are many factors which have been identified as contributing to speed choice, including both internal person-based factors and external environmental factors (Harrison et al., 1998). A variety of countermeasures have been developed, including environmental traffic-management devices, punishment by way of fines, and changing community attitudes towards speed through mass publicity campaigns. Monash University Accident Research Centre (MUARC) has evaluated many of these countermeasures (Newstead, Cameron, Gantzer, & Vulcan, 1995; Newstead, Cameron, & Narayan, 1998), including the Transport Accident Commission (TAC) road safety publicity campaigns, and various forms of enforcement activity such as Random Breath Testing (RBT) and speed camera use. There is good evidence that a number of factors (including various enforcement programs and public education programs) have contributed to the reduction of casualty crashes in Victoria. The Transport Accident Commission and the Victoria Police work together to ensure that advertising campaigns and enforcement programs are coordinated, often with enforcement and advertising programs targeting similar high-risk behaviours. In the speed domain, the combined effect of enforcement and publicity may be simply additive, or potentially synergistic where the combined effect may be larger than expected given the effect of either program on its own. It was considered important to understand how speed camera enforcement and speed-related publicity interact, specifically in relation to their effect on the risk of casualty crashes and the injury severity of the crash outcomes. The project also aimed to determine whether varying the levels and co-presentation of publicity and enforcement resulted in a change in perception of the level of speed enforcement and TAC advertising, and whether there was a change in self reported driving behaviour and perceived risk of being caught when speeding.
INTERACTION BETWEEN SPEED CAMERA ENFORCEMENT AND PUBLICITY
1
2 2.1
LITERATURE REVIEW1 SPEEDING AND ENFORCEMENT
There has been a number of enforcement countermeasures implemented in Victoria in the last decade. Methods of enforcement include random breath testing (RBT) using "booze buses", speed cameras and special enforcement campaigns (Newstead et al., 1995). Mobile moving mode radar units for speed enforcement were introduced in August 1994 (Diamantopoulou, Cameron, & Shtifelman, 1998) and in October 1997 every police car was supplied with breath testing equipment so that drivers stopped for an offence could be breath tested (Cameron, Diamantopoulou, Mullan, Dyte, & Gantzer, 1997). There is clear evidence that enforcement in general has an impact on driving speed (de Waard & Rooijers, 1994), and there is evidence that the method of enforcement is an important factor. Highly visible enforcement strategies act to remind road users that enforcement is present and potentially increases both the actual and the perceived risk of detection (Fildes & Lee, 1993). Non-visible enforcement acts to increase road user's sense of uncertainty and to prevent them from adapting their speeding behaviour at specific times and locations when speeding enforcement is clearly being carried out (Ostvik & Elvik, 1990). Stationary enforcement, such as a visible marked Police car, has a direct and local effect on traffic speed. This has been termed a distance halo effect and generally this effect has been found to exist for a few kilometres around the enforcement site (Zaal, 1994). Barnes (1984) found that many speeding drivers reduced their speed two kilometres before reaching the enforcement site, and that the effect lasted for about four to six kilometres past the enforcement site. Hauer, Ahlin and Bowser (1982) suggest that the downstream distance-halo effect is halved for every 900m from the site of visible, uniformed enforcement. The time halo effect has also been investigated and it was found that following six days of enforcement, the duration of the time halo for both radar and marked police car was of the order of ten days (Nilsson & Sjogren, 1981). Diamantopoulou et al (1998) reported that mobile speed enforcement (Moving Mode Radar) had little effect on casualty crashes beyond four days after the enforcement was present, in rural areas. In order to be effective, enforcement probably needs to increase the perceived risk of detection by maintaining a certain level of objective probability of detection (Shinar & McKnight, 1985). This has been supported by Rothengatter (1988), who found that increasing apparent enforcement without changing the actual levels of objective enforcement does not influence speed choice, whereas an actual increase in enforcement does have the effect of reducing speeds. Thus, the perceived level of risk is increased in cases where the objective level of apprehension is increased. Generally, marked police cars or on-view stopping have the greatest impact on drivers’ speed. A review of the literature investigating the relationship between real changes in visible speed enforcement and the perceived risk of being caught had shown that enforcement must be increased by a significant degree before changes in perception of enforcement occur (Ostvik & Elvik, 1990; Bjørnskau & Elvik, 1992). It was reported that increasing enforcement on a given road by less than three times does not have an impact on subjective risk of detection. A five fold increase in enforcement has been found to increase the subjective risk of detection, and subsequently to result in a reduction in the percentage of offenders and a reduction in crashes by 20-30% (Ostvik & Elvik, 1990).
1
This review was drafted by Emma Fitzgerald while a member of staff of the Monash University Accident Research Centre. The review has been modified and extended by the authors of this report.
2
MONASH UNIVERSITY ACCIDENT RESEARCH CENTRE
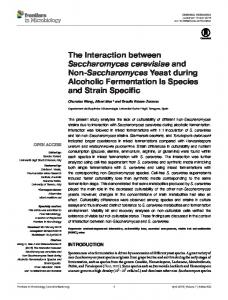
A more recent review, of both manual and automatic enforcement techniques, does not support the existence of marked threshold effects (Elvik 2001). The relationship between the amount of enforcement and the level of road safety appears to be quite smooth, with no sharp discontinuities. Elvik reviewed a large number of studies of the effects of varied levels of traffic enforcement on casualty crashes and concluded that the relationship is of the form shown in Figure 2.1. Some forms of enforcement have more powerful effects than others, but in every case the relationship with crash reductions is not linear. Because of this, there is a level of enforcement activity where the additional saving in crashes may not be worth the additional cost of extra enforcement. Figure 2.1: General relationship between traffic enforcement and crashes identified by Elvik (2001)
Mobile, covert speed camera operations have made a major contribution to the reduction in serious casualty crashes in Victoria, with an estimated percentage reduction of 10-11% each year (Newstead et al., 1998), although the extent to which an increase in enforcement might impact on drivers’ perceptions of enforcement levels, and the mechanisms by which enforcement influences speed-related decisions and crashes are uncertain. 2.2
EFFECT OF PUBLICITY ON SPEED AND CRASHES
The Transport Accident Commission launched a mass media road safety advertising campaign in December 1989 in Victoria. Since this time there have been about fifty different media campaigns launched, each under a general theme, for example drink-driving, speed, concentration and use of restraints (Cameron & Newstead, 1996). The TAC have adopted different styles of advertising to communicate their message to the public, however there have been some common methods including using an ‘emotive’ and ‘attention grabbing’ style of advertising which highlights police enforcement capabilities as well as confronting high risk groups with the consequences of their behaviour. Other advertisements take an educational/informative slant. INTERACTION BETWEEN SPEED CAMERA ENFORCEMENT AND PUBLICITY
3
The major objectives of the public education campaigns are: 1. To place road safety on the public agenda; 2. To increase road users perceived risk of detection or crashing, thereby deterring road users from unsafe behaviours; 3. To provide a supporting rational for the police to undertake enforcement activity by realistically portraying the impact of road crashes upon individuals and the community; 4. To increase the perceived risk of being detected by the police; and 5. To provide information to support decision making to adopt safer forms of behaviour (Healy & Forsyth, 1996) Approximately two thirds of expenditure is devoted to television advertising. In conjunction with television advertising the TAC advertise on the radio, the press, outdoor advertising (including mobile billboards), Sky Channel and cinema to reinforce or complement the main messages from the television advertisements (Healy & Forsyth, 1996). A number of studies have investigated the means by which advertising produces its effect. It has been shown that there are delayed and carryover effects of the main messages, and that advertising does not necessarily produce its full effect in the week it is shown, nor do its effects stop at the end of that week (Cameron, Haworth, Oxley, Newstead, & Le, 1993). A “trigger threshold” for advertising has been established, and is the point at which people become aware of the main message. A burst of intensive advertising at the beginning of a campaign is generally effective in reaching this threshold. The “trigger threshold” has been described as consisting of an average of three viewings of the advertisement (Cameron & Newstead, 1996). This does not however give an indication of the number of viewings by the target audience as opposed to the broader audience. It has been found that the awareness of advertising decays exponentially with time, which has been expressed in terms of its half-life or the number of weeks after which only half the audience is aware of the message (Broadbent 1979, 1984). There have been suggestions the effect of these advertisements may become less with time as the audience becomes sensitised to them. Indeed, weak evidence has been found of advertising wearout, in that the impact of the TAC advertising may be diminishing over time (Fry, 1996). TAC advertisements are intended to make a strong impression on the audience. A study investigated audience reaction to a sample of the TAC’s road safety advertisements (Harrison & Senserrick, 1999). It was found that: •
Attitudes to the TAC approach were generally positive;
•
Six types of responses were identified - two represented reactions to the positive and uncomfortable emotional content of the advertisements respectively. The remaining four were more cognitive in nature and, represented reactions to the seriousness of the content, the simplicity of its delivery, content that included an element of irresponsibility, and the originality of the advertisement and its information content;
4
MONASH UNIVERSITY ACCIDENT RESEARCH CENTRE
•
The likelihood of an advertisement resulting in a behaviour change was associated with its originality or information content and its ability to evoke uncomfortable reactions;
•
Emotional content is an important perceptual dimension and the analysis found that the advertisements divided into two groups, emotive advertisements and enforcement advertisements; and
•
The advertisements in the emotive group were seen as more serious, less pleasant, and more emotional than those in the enforcement group. They were also perceived to be more effective (in terms of self-reported behaviour change), more relevant and more credible.
An earlier American study investigated the difference in responses of women and men to traffic safety messages (Morris, Lynch, Swinehart, & Lanza, 1994). Both men and women were found to be fairly knowledgeable about advertising and marketing strategies, and both sexes reported that the age of the presenter should be close to their own age. They reported that they wanted to see realism and personal reference, and both men and women felt that the threat of financial costs (fines and insurance) was a potentially effective appeal. Alternatively, females responded more favourably to emotional appeals than males and felt that humorous approaches detracted from the seriousness of the material presented, while many men preferred this approach. Females generally had no objections to publicity with an explicit message to take a given action, while most of the males in this sample found this approach authoritarian. The female participants were not as concerned about production values as were men, and they were more likely to watch an entire advertisements, as opposed to men, who would change the channel if they disliked the first few seconds of the advertisement. Women more often than men perceived the information conveyed in publicity as relevant to others in their lives as well as to themselves. They felt the gender of the narrator or protagonist was not important in communicating a safety message, and they were sensitive to the potential for negative genderstereotyping in traffic safety advertising. The TAC publicity campaign in Victoria has been found to have a substantial influence on crash reduction. There have been reductions in crashes in all of the areas targeted by the TAC, which have been directly attributed to the advertising campaigns. Newstead et al (1995) estimated that drink-drive publicity contributed to a 7% reduction in overall level in serious trauma in Victoria in 1990-93 compared to a base year of 1988. The speed-related publicity was estimated to have contributed to approximately 8% decrease in crash numbers for each year between 1991 and 1993 in comparison with 1988 as the base year. There has been no formal evaluation of fatigue related campaigns as it is difficult to attribute fatigue as the cause of a crash. An increase in restraint use has been found, the greatest increase being for rear seat passengers aged 18-25 (from 55.8% to 83.6%) (Diamantopoulou, Dyte, & Cameron, 1996). There was a specific evaluation of the effect of publicity supporting the speed camera program during “low alcohol hours”2, which was launched in April 1990 (Cameron et al., 1993). During the period from April to June 1990, when there was negligible camera use but high levels of television publicity, there was a 24% reduction in casualty crashes and a 29% reduction in their injury severity. A second stage of this evaluation linked the monthly levels of television advertising with the variations in casualty crashes during low alcohol hours on 1990-91, and a statistically significant relationship for all TAC publicity and for the speed-related publicity in 2
The "high alcohol hours" of the week (i.e. 4pm Sunday to 6am Monday, 6pm to 6am on Monday to Thursday nights, 4pm Friday to 8am Saturday, and 2pm Saturday to 10am Sunday) are those periods when the percentage of drivers killed or admitted to hospital with a blood alcohol content exceeding 0.05% was about 36% (Harrison, 1990). The "low alcohol hours" are the converse of these periods, during which less than 4% of the driver of serious casualties had blood alcohol content exceeding 050%.
INTERACTION BETWEEN SPEED CAMERA ENFORCEMENT AND PUBLICITY
5
particular. A New Zealand study reported that after two years, reductions of 14-26% in speedrelated crashes could be attributed to a advertising campaign which had been based on Victoria's TAC road safety publicity campaigns (Graham, 1998). The MUARC research (Cameron et al 1993; Newstead et al 1995) has been questioned by White et al (2000) who re-analysed the data to establish whether the claimed effects of the TAC publicity were real. In their response, Cameron and Newstead (2000) pointed out that White et al’s analysis had strengthened the evidence for the beneficial effect on crashes of TAC’s speedrelated advertising during 1990-93. White et al’s analysis also provided support for the relationship between crash reductions and the number of speeding tickets issued as a result of speed camera detections, first identified by Cameron et al (1992). The mix of styles of TAC’s speed-related advertising has changed since these earlier studies found effects. In line with TAC’s road safety advertising generally (Figure 2.2), the use of almost exclusively emotive-style advertisements during the early 1990’s has changed to include a greater proportion of those with enforcement-style and those combining emotion with enforcement or instructive elements. Adstock (Broadbent 1979) is a measure of retained awareness of past and current levels of advertising (see Section 6.5) and is a function of advertising intensity. Thus the findings relating to predominantly emotive-style speed-related TAC advertising used during the early 1990’s may not be applicable to the advertising mix used during more recent years, in particular the speed-related advertising during 1996-2000 which was the focus of this study. Figure 2.2: Adstock of TAC television advertising in Melbourne, December 1989 to December 2001 16,000
Instructive Enforcement Emotive/ Enforcement Emotive/ Instructive Emotive
14,000
ADSTOCK per month
12,000
10,000
8,000
6,000
4,000
2,000
Dec-01
Apr-01
Aug-01
Dec-00
Apr-00
Aug-00
Dec-99
Apr-99
Aug-99
Dec-98
Apr-98
Aug-98
Dec-97
Apr-97
Aug-97
Dec-96
Apr-96
Aug-96
Dec-95
Apr-95
Aug-95
Dec-94
Apr-94
Aug-94
Dec-93
Apr-93
Aug-93
Dec-92
Apr-92
Aug-92
Dec-91
Apr-91
Aug-91
Dec-90
Apr-90
Aug-90
Dec-89
0
The possibility that different effects of the TAC speed-related advertising may be applicable during the late 1990’s was suggested by a preliminary study which analysed serious casualty crash trends in Melbourne during July 1996 to October 1998 in a similar way to the analysis by Newstead et al (1995). Crash trends during the period up to June 1996 were also analysed. The analysis of the earlier period was able to find statistically significant links between speed-related Adstock and crashes, but the analysis of the later period did not (Diamantopoulou et al 1999). This result may have been due to the relatively short duration of the second period.
6
MONASH UNIVERSITY ACCIDENT RESEARCH CENTRE
2.3
INTERACTION BETWEEN ENFORCEMENT AND PUBLICITY
Although analyses have generally separated the effects of enforcement and publicity, or have evaluated the effect of one in the context of the other, an ‘integration’ effect on driver behaviour and crashes was expected to be a significant contributory factor (Healy & Forsyth, 1996). Wise (1996) noted that the first hallmark of an effective mass media campaign is that it is specifically linked with other elements of a comprehensive intervention. The publicity campaign which accompanied the new speed camera program (introduced in December 1989) aimed to increase “the perception of the level of camera operations and their legitimacy, as well as building a community agenda about speeding and safety” (Cameron, Cavallo, & Gilbert, 1992). Many of the TAC advertisements have aimed to support Police enforcement activities (Cameron & Newstead, 1996). There is little research that has aimed to untangle the relationship between enforcement activity and accompanying publicity campaigns. An evaluation of the rural random breath testing and publicity program in Victoria during 199394 estimated the effects of the enforcement conditional on the level of publicity awareness present at the time the RBT activity was operating. Reductions in serious casualty crashes occurred when "Police cars alone were operating (22% reduction), and especially at times of medium drink-driving publicity awareness" (33%). Interestingly, when there were high levels of drink driving publicity accompanying the use of RBT, or when combinations of cars and buses were operating together, there was little evidence of crash reduction. In fact, in regions and weeks influenced by car and bus combinations, an increase of 148% in HAH serious casualty crashes occurred when high publicity awareness accompanied the enforcement (Cameron et al., 1997). This result was explained as the result of drivers using relatively unsafe minor roads, presumably to avoid the RBT, and this occurred specifically when there was a high level of publicity. This explanation has been supported by the results of surveys of rural hotel patrons (Harrison, 1996, Harrison and Fitzharris, 1999). When moving mode radar use was accompanied by publicity specific to that enforcement device, a 28% reduction in casualty crashes was found which was marginally statistically significant (p = 0.07). It was found that when the publicity was specific to this type of speed enforcement, the effect was stronger than when compared to a more general speed-related publicity (Diamantopoulou, Cameron, & Shtifelman, 1998). When the enforcement was accompanied by high levels of general speed-related publicity, the effects were less, with an 11% reduction in crashes (not statistically significant). The strongest effect on casualty crashes in rural Victoria occurred when the mobile radar enforcement was accompanied by high levels of specific mobile radar publicity, and the effects were strongest one to four days after the enforcement was present. In summary, both road safety publicity and speeding-specific enforcement has been shown to contribute to a reduction in crashes. It is a common practice to link publicity campaigns with enforcement strategies, and there is some evidence that interaction effects exist. There is however no clear understanding of the means by which varying levels of publicity and speed camera enforcement impact on drivers’ perceptions of the risk of detection, their speeding behaviour, or involvement in serious crashes. This project was designed to provide a level of understanding of these issues.
INTERACTION BETWEEN SPEED CAMERA ENFORCEMENT AND PUBLICITY
7
3
STUDY OUTLINE
Previous research conducted by MUARC indicates that the speed camera program conducted by the Police and the road safety publicity program conducted by the Transport Accident Commission, TAC, are individually linked to reductions in crashes, however, little is understood about the interaction between these two programs. The aim of this current study is to explore this interaction using casualty crash frequencies and crash severity as outcome measures in a study using an experimental design. 3.1
BACKGROUND
A proposed experimental study to examine the interaction between speed camera enforcement and levels of supporting publicity was included in the MUARC’s research program in 1996. This study proposed that Victoria be divided into a number of regions and that each region be randomly allocated times of : a) no enforcement or publicity, b) enforcement only, c) publicity only, and d) both enforcement and publicity. The study was proposed because previous MUARC studies of the separate effects of speed cameras and TAC speed-related publicity had been unable to quantify their synergistic effect on crashes. A related project had been planned by (then) Superintendent John Bodinnar of the Traffic Camera Office of the Victoria Police. Two areas exhibiting relatively low crash frequencies and relatively low incidences of speeding would be identified, and in these areas the speed camera hours would be reduced. Camera hours would be increased in two other areas with relatively high crash frequencies and incidences of speeding. Pre-existing enforcement levels would be retained in the remainder of Victoria to provide a control comparison. An integrated study was planned but was unable to be proceed because of the planned impending outsourcing of speed camera operations and image processing. The project was revived in November 1998 after the outsourcing to LMT Australia3 (now Tenix Solutions) had been completed. 3.2
PROJECT OBJECTIVES
During 1999, speed camera operations were planned to increase in two Melbourne Police Districts, by either 50% or 100% for a month at a time, during two selected months when TAC speed-related publicity was present and two months when it was absent. One of the project’s objectives was to examine the effects on crashes in the two Districts, and also the effects in Districts in which camera operations were reduced, if this occurred.
3
LMT (Lockheed Martin Corporation and the Tenix Group) is a provider of infringement processing services to Governments at all levels in Australia, New Zealand and Southeast Asia.
8
MONASH UNIVERSITY ACCIDENT RESEARCH CENTRE
In addition, the project also included a component that surveyed drivers’ perceptions and reported driver behaviour in response to the increased speed enforcement, and the related publicity. The results of the survey component of the project are described in Chapter 7. 3.3
METHODOLOGY
Initial discussions relating to the proposed methodology for this project focused on the use of a crash-based evaluation. This outcome measure has a number of limitations. While a crashbased evaluation can identify changes in crash rates associated with periods of speed enforcement or publicity it cannot account for the changes or the mechanisms underlying them. In view of this, a survey of the impact of speed enforcement and publicity on drivers’ perceptions and behaviour was added to complement the results obtained in the crash-based analysis. The survey results would explore the reasons and mechanisms underlying behaviour changes. 3.4
STUDY DESIGN
It was considered that a quasi-experimental study design would be appropriate for this crashbased evaluation. This type of design would allow for an effective evaluation of the impact of speed enforcement, publicity and an interaction between the two on crash rates. To satisfy the requirements of such a design there was a need to define periods of speed-related publicity and non-publicity, and periods with varying levels of Police speed camera enforcement. MUARC research has identified a link between speed camera use and reductions in the number and severity of crashes. For this reason MUARC did not consider it ethical to propose to remove or reduce this effective countermeasure. However, due to resource constraints, the Police had to consider this possibility. Some previous research suggested that small changes in Police traffic enforcement activity may not be detected by drivers (and therefore may not translate into reductions in crashes or in behavioural changes), and that quite large increases in the actual levels of Police traffic enforcement are required to increase drivers’ perceived risk of detection for speeding (Ostvik and Elvik, 1990). This evidence suggested that the increases in the levels of the speed camera enforcement may need to be large in order to achieve measurable effects. 3.5
GENERAL DESIGN
A quasi-experimental design was adopted to investigate the interaction between road safety speed-related publicity and speed camera enforcement on crash outcomes. Victoria Police and their private speed camera operators (LMT Australia) were able to increase the amount of speed enforcement in two Police Districts by factors of 50% and 100% during various months in 1999. These months coincided with planned periods of speed-related and no speed-related publicity funded by the Transport Accident Commission in various media. The combination of publicity and enforcement is shown in Table 3.1.
INTERACTION BETWEEN SPEED CAMERA ENFORCEMENT AND PUBLICITY
9
Table 3.1
Basic Experimental Design
Speed-related publicity present PUBLICITY Speed-related publicity absent
ENFORCEMENT LEVEL 50% increase on normal 100% increase on normal speed camera operational speed camera operational levels levels 50% increase in 100% increase in enforcement & publicity enforcement & publicity present present 50% increase in 100% increase in enforcement & publicity enforcement & publicity absent absent
The initial crash-based analysis made use of casualty crash data from prior years, 1996-1998 and from the year after the experiment i.e. 2000 to act as comparison crashes to measure the changes that occurred during the increases in the enforcement. In addition crashes from other metropolitan Districts in Victoria where there had been no change in enforcement levels during 1999 were used as a comparison group to account for changes other than increases in speed camera enforcement that may have occurred during the evaluation period. Thus, the design of the initial crash analysis was as shown in Table 3.2, with the addition of the inclusion of prior and post years’ crash data as an additional comparison.
Table 3.2
PUBLICITY
Experimental Design for Crash Analysis
Speed-related publicity present Speed-related publicity absent
ENFORCEMENT LEVEL No change in 50% increase on 100% increase in enforcement levels normal speed normal speed (other Metropolitan camera operational camera operational levels levels Police Districts used as controls) Publicity & no Publicity & 50% Publicity & 100% change in increase in increase in enforcement enforcement enforcement No publicity & no No publicity & 50% No publicity & 100% change in increase in increase in enforcement enforcement enforcement
A more comprehensive crash analysis was subsequently defined which made fuller use of the crash data over the period 1996-2000 and allowed for delayed or residual effects of the enforcement and publicity. The design of this analysis is given in Chapter 6 following the preliminary analysis. Table 3.3 shows the timing of the enforcement program incorporating the publicity periods and use of the Police Districts that acted as the comparison group during the months of 1999, whilst Figure 3.1 displays the location of each Melbourne Police District. Table 3.3 reflects Police reaction to the experimental design. The design had not intended there to be enforcement reductions. The Police decided that this was necessary because of resource constraints.
10
MONASH UNIVERSITY ACCIDENT RESEARCH CENTRE
Table 3.3
Timing of Enforcement, Publicity & Survey Component of the Evaluation
MONTH DURING 1999 Police Jan Feb Mar Apr May Jun Jul Aug Sep Oct Nov District Publicity Publicity Publicity Publicity absent present absent present N+100 Y+50 N+50 Y+100 E N+50 Y+100 N+100 Y+50 I N-100 Y-50 N-50 Y-100 C N-50 Y-100 N-100 Y-50 H no no no No B, D, F, change change change change G, J, K* * Other Metropolitan Police Districts with no change in speed camera enforcement – used as a comparison group of crashes (Note: District A did not have speed camera operations)
The notation used in Table 3.3 refers to eight (treatment) conditions that were defined for subsequent analysis as follows: T1.
100% increase in speed camera hours with no publicity (N+100): This condition included data collected from E District in April and from I District in August.
T2.
100% increase in speed camera hours with publicity (Y+100): This condition included data collected from E District in November and from I District in June.
T3.
50% increase in speed camera hours with no publicity (N+50): This condition included data collected from E District in August and from I District in April.
T4.
50% increase in speed camera hours with publicity (Y+50): This condition included data collected from E District in June and from I District in November.
T5.
No speed camera hours with no publicity (N-100): This condition included data collected from C District in April and from H District in August.
T6.
No speed camera hours with publicity (Y-100): This condition included data collected from C District in November and from H District in June.
T7.
50% reduction in speed camera hours with no publicity (N-50): This condition included data collected from C District in August and from H District in April.
T8.
50% reduction in speed camera hours with publicity (Y-50): This condition included data collected from C District in June and from H District in November.
INTERACTION BETWEEN SPEED CAMERA ENFORCEMENT AND PUBLICITY
11
Dec
Figure 3.1
Map of Melbourne Police Districts
E and I: C and H: B, D, F, G, J & K:
Districts treated with increases in speed camera enforcement Districts treated with decreases in speed camera enforcement Districts where there had been no change in speed camera enforcement
The following chapter documents the monthly levels of speed camera operational hours actually achieved during 1999 in the Police Districts that had changed speed camera enforcement conditions. The monthly levels of TAC speed-related publicity achieved during 1999 are also presented.
12
MONASH UNIVERSITY ACCIDENT RESEARCH CENTRE
4
SPEED CAMERA OPERATIONS & SPEED-RELATED PUBLICITY
The following section documents the monthly number of speed camera hours of operation achieved in the treated Police Districts (the comparison Districts are documented in Appendix A). The monthly speed camera hours are shown for 1999, the year of changed enforcement conditions, as well as for the comparison years, 1996-1998 and 2000. Figure 4.1 shows the number of speed camera hours of operation achieved for all Melbourne Police Districts. The monthly level of speed camera hours achieved remained relatively constant at approximately 2,515 hours. The exception was during December 1998 when the number of hours achieved was considerably greater than average at approximately 3,570 hours. A substantial increase in camera hours occurred in most Districts during this month. It should be noted that speed camera operational data for January-February 1999 was not made available to MUARC so does not appear in the following charts for these months. This information was missing for reasons unassociated with the experimental study. Camera operations are understood to have been at normal levels during those two months. Figure 4.1 Number of hours of speed camera operations achieved per month for the Melbourne Police Districts, 1996-2000 4000
3500
NOTE: Speed Camera Operational Data for JanuaryFebruary 1999 was not made available to MUARC
Speed Camera Hours
3000
2500
2000
1500
1000
500
Jan-96 Feb-96 Mar-96 Apr-96 May-96 Jun-96 Jul-96 Aug-96 Sep-96 Oct-96 Nov-96 Dec-96 Jan-97 Feb-97 Mar-97 Apr-97 May-97 Jun-97 Jul-97 Aug-97 Sep-97 Oct-97 Nov-97 Dec-97 Jan-98 Feb-98 Mar-98 Apr-98 May-98 Jun-98 Jul-98 Aug-98 Sep-98 Oct-98 Nov-98 Dec-98 Jan-99 Feb-99 Mar-99 Apr-99 May-99 Jun-99 Jul-99 Aug-99 Sep-99 Oct-99 Nov-99 Dec-99 Jan-00 Feb-00 Mar-00 Apr-00 May-00 Jun-00 Jul-00 Aug-00 Sep-00 Oct-00 Nov-00 Dec-00
0
4.1
SPEED CAMERA HOURS PER MONTH
The following charts show the monthly number of speed camera hours achieved in the Police Districts that experienced either increased or decreased levels of speed camera enforcement during certain months of 1999. Figure 4.2 displays the number of hours of speed camera operations achieved in District E during 1996-2000. During April 1999 and November 1999 it was planned that there would be a 100% increase in the level of speed camera hours achieved, whilst in June 1999 and August
INTERACTION BETWEEN SPEED CAMERA ENFORCEMENT AND PUBLICITY
13
1999 there would be a 50% increase in the level of speed camera hours. The actual increases achieved were a 96% increase in April compared to the previous month; a 98% increase in November compared to the previous month and 45% increases in June and August compared to the relevant previous months. Thus the actual increases matched the planned 100% and 50% increases fairly accurately for District E. For the other months of 1996-2000, the number of speed camera hours achieved was relatively stable at about 270 hours per month on average. The exception was during December 1998 in which the number of speed camera hours was about 370 hours. This was because Police had increased their speed camera operations during that month. This increase did not affect the preliminary crash analysis, which used crashes in previous years as a reference level. This was because December was not one of the treated months in 1999, so December 1998 was not used. Figure 4.2
Number of hours of speed camera operations per month for District E during 1996-2000
600
500 *Speed Camera Operational Data for January-February 1999 was not made available to MUARC
Speed Camera Hours
400
300
200
100
Jan-96 Feb-96 Mar-96 Apr-96 May-96 Jun-96 Jul-96 Aug-96 Sep-96 Oct-96 Nov-96 Dec-96 Jan-97 Feb-97 Mar-97 Apr-97 May-97 Jun-97 Jul-97 Aug-97 Sep-97 Oct-97 Nov-97 Dec-97 Jan-98 Feb-98 Mar-98 Apr-98 May-98 Jun-98 Jul-98 Aug-98 Sep-98 Oct-98 Nov-98 Dec-98 Jan-99 Feb-99 Mar-99 Apr-99 May-99 Jun-99 Jul-99 Aug-99 Sep-99 Oct-99 Nov-99 Dec-99 Jan-00 Feb-00 Mar-00 Apr-00 May-00 Jun-00 Jul-00 Aug-00 Sep-00 Oct-00 Nov-00 Dec-00
0
Figure 4.3 displays the number of hours of speed camera operations achieved in District I during 1996-2000. During June 1999 and August 1999 it was planned that there would be a 100% increase in the level of speed camera hours achieved, whilst in April 1999 and November 1999 there would be a 50% increase in the level of speed camera hours. The actual increases in speed camera hours achieved were a 50% increase in April, a 90% increase in June, a 97% increase in August and a 55% increase in November compared to the appropriate prior months. Hence the actual increases achieved in District I were approximately those that had been planned for the experimental months. For the other months of 1996-2000, the number of speed camera hours achieved in District I was relatively stable at about 270 hours per month on average.
14
MONASH UNIVERSITY ACCIDENT RESEARCH CENTRE
Figure 4.3
Number of hours of speed camera operations per month for District I during 1996-2000
600 *Speed Camera Operational Data for JanuaryFebruary 1999 was not made available to MUARC 500
Speed Camera Hours
400
300
200
100
Jan-96 Feb-96 Mar-96 Apr-96 May-96 Jun-96 Jul-96 Aug-96 Sep-96 Oct-96 Nov-96 Dec-96 Jan-97 Feb-97 Mar-97 Apr-97 May-97 Jun-97 Jul-97 Aug-97 Sep-97 Oct-97 Nov-97 Dec-97 Jan-98 Feb-98 Mar-98 Apr-98 May-98 Jun-98 Jul-98 Aug-98 Sep-98 Oct-98 Nov-98 Dec-98 Jan-99 Feb-99 Mar-99 Apr-99 May-99 Jun-99 Jul-99 Aug-99 Sep-99 Oct-99 Nov-99 Dec-99 Jan-00 Feb-00 Mar-00 Apr-00 May-00 Jun-00 Jul-00 Aug-00 Sep-00 Oct-00 Nov-00 Dec-00
0
Figure 4.4 displays the number of hours of speed camera operations achieved in District C during 1996-2000. During April 1999 and November 1999 it was decided to have no speed camera operations in District C, whilst in June 1999 and August 1999 there would be a 50% reduction in the level of speed camera hours of operation. The actual reductions were a 37% reduction in June and a 47% reduction in August compared to the appropriate prior months. Thus the 50% reduction occurred only in August, approximately. For June the actual reduction was considerably less than 50%. During April and November there were no speed camera hours of operation as decided. For the other months of 1996-2000, the number of speed camera hours achieved was relatively stable at about 265 hours per month on average. The exception was during December 1998 in which the number of speed camera hours was about 430 hours. This was because Police had increased their speed camera operations during that month across Melbourne.
INTERACTION BETWEEN SPEED CAMERA ENFORCEMENT AND PUBLICITY
15
Figure 4.4 1996-2000
Number of hours of speed camera operations per month for District C during
600 NOTE: Speed Camera Operational Data for January-February 1999 was not made available to MUARC
500 * NO speed camera operations during April & November, 1999 ** 50% reduction in speed camera operations during June & August 1999
Speed Camera Hours
400
300
200
100
Jan-96 Feb-96 Mar-96 Apr-96 May-96 Jun-96 Jul-96 Aug-96 Sep-96 Oct-96 Nov-96 Dec-96 Jan-97 Feb-97 Mar-97 Apr-97 May-97 Jun-97 Jul-97 Aug-97 Sep-97 Oct-97 Nov-97 Dec-97 Jan-98 Feb-98 Mar-98 Apr-98 May-98 Jun-98 Jul-98 Aug-98 Sep-98 Oct-98 Nov-98 Dec-98 Jan-99 Feb-99 Mar-99 Apr-99 May-99 Jun-99 Jul-99 Aug-99 Sep-99 Oct-99 Nov-99 Dec-99 Jan-00 Feb-00 Mar-00 Apr-00 May-00 Jun-00 Jul-00 Aug-00 Sep-00 Oct-00 Nov-00 Dec-00
0
Figure 4.5 displays the number of hours of speed camera operations achieved in District H during 1996-2000. During April 1999 and November 1999 it was decided to have a 50% reduction in the level of speed camera hours of operation, whilst in June 1999 and August 1999 there would be no speed camera activity. For April and November the actual reductions were approximately 53% compared to the relevant previous months. For June and August there were no speed camera operations in District H as decided. These reductions in speed camera enforcement are evident from Figure 4.5. For the other months of 1996-2000, the number of speed camera hours achieved in District H remained relatively stable at about 260 hours per month on average.
16
MONASH UNIVERSITY ACCIDENT RESEARCH CENTRE
Figure 4.5
Number of hours of speed camera operations per month for District H during 1996-2000
600 NOTE: Speed Camera Operational Data for January-February 1999 was not made available to MUARC
500 * NO speed camera operations during June & August, 1999 ** 50% reduction in speed camera operations during April & November,1999
Speed Camera Hours
400
300
200
100
Jan-96 Feb-96 Mar-96 Apr-96 May-96 Jun-96 Jul-96 Aug-96 Sep-96 Oct-96 Nov-96 Dec-96 Jan-97 Feb-97 Mar-97 Apr-97 May-97 Jun-97 Jul-97 Aug-97 Sep-97 Oct-97 Nov-97 Dec-97 Jan-98 Feb-98 Mar-98 Apr-98 May-98 Jun-98 Jul-98 Aug-98 Sep-98 Oct-98 Nov-98 Dec-98 Jan-99 Feb-99 Mar-99 Apr-99 May-99 Jun-99 Jul-99 Aug-99 Sep-99 Oct-99 Nov-99 Dec-99 Jan-00 Feb-00 Mar-00 Apr-00 May-00 Jun-00 Jul-00 Aug-00 Sep-00 Oct-00 Nov-00 Dec-00
0
Charts analogous to Figures 4.2 to 4.5 can be found for the comparison districts in Appendix A. 4.2
SPEED-RELATED PUBLICITY
The television exposure of the TAC’s speed-related road safety advertisements was measured weekly using Target Audience Rating Points (TARPs), a measure of audience reach, during January-December 2000. TARPs are a summation of the Rating Points, or percentage of persons in the Target Audience in the viewing area estimated to be watching the specific television channel at the time of the advertisement. Figure 4.6 gives the distribution of TARPs per month for 1996-2000. During the months in 1999 when there were changes in the levels of speed camera enforcement, the number of TARPs achieved for speed-related advertisements are shown in this chart. For April 1999 and August 1999 there were no speed-related advertisements shown on television hence no TARPs measured. These months will signify the times when there was no speed-related publicity accompanying the enforcement. During June 1999 and November 1999 speed-related road safety advertisements were aired on television with corresponding TARPs of about 270 and 340 units, respectively.
INTERACTION BETWEEN SPEED CAMERA ENFORCEMENT AND PUBLICITY
17
Jan-96 Feb-96 Mar-96 Apr-96 May-96 Jun-96 Jul-96 Aug-96 Sep-96 Oct-96 Nov-96 Dec-96 Jan-97 Feb-97 Mar-97 Apr-97 May-97 Jun-97 Jul-97 Aug-97 Sep-97 Oct-97 Nov-97 Dec-97 Jan-98 Feb-98 Mar-98 Apr-98 May-98 Jun-98 Jul-98 Aug-98 Sep-98 Oct-98 Nov-98 Dec-98 Jan-99 Feb-99 Mar-99 Apr-99 May-99 Jun-99 Jul-99 Aug-99 Sep-99 Oct-99 Nov-99 Dec-99 Jan-00 Feb-00 Mar-00 Apr-00 May-00 Jun-00 Jul-00 Aug-00 Sep-00 Oct-00 Nov-00 Dec-00
TARPS
Figure 4.6
18 Target Audience Ratings Points (TARPs) achieved per month for speed-related TAC road safety advertising for Melbourne: January 1996-December 2001
900
* NO speed-related publicity aired during April & August, 1999
800
**Speed-related publicity aired during June & November, 1999
700
600
500
400
300
200
100
0
Month
MONASH UNIVERSITY ACCIDENT RESEARCH CENTRE
5
PRELIMINARY CRASH ANALYSIS
A preliminary analysis of the crash data was undertaken to examine the direct effects of the changed levels of speed camera hours, during the presence or absence of speed-related publicity, in the Districts and during the months when these changes occurred. The preliminary analysis did not hypothesise nor examine any delayed or residual effects of the enforcement or publicity. It examined the crash outcomes associated with each of the eight treatment conditions (see Section 3.5) separately and did not, at this stage, test for the presence of an interaction between the enforcement and publicity. 5.1
TRENDS IN THE CRASH DATA
Figure 5.1 and Figure 5.2 show the annual number of casualty crashes that occurred in each Metropolitan District considered in the crash analysis during 1996-2000. These were plotted, particularly for the comparison Districts (i.e. Districts B, D, F, G, J & K), to see if the crash trends during 1996 to 2000 were relatively stable. During 1996-1998 the crash numbers in the comparison Districts were relatively stable – fluctuating by about 1%-2% each year, and averaging about 7,160 per year (Figure 5.1). There was an approximate 1.6% increase on this average during 1999, and another 1.7% increase in 2000. Because the annual casualty crash frequencies in the comparison Districts remained relatively stable during 1996 to 2000, these crashes were combined in the preliminary crash analysis. Figure 5.1
Annual casualty crash numbers for the comparison group (Metropolitan Police Districts B, D, F, G, J & K): 1996-2000
8,000 7255
7146
7079
7277
7404
7,000
Number of casualty crashes
6,000
5,000
4,000
3,000
2,000
1,000
0
1996
1997
1998
1999
2000
Year of crash
INTERACTION BETWEEN SPEED CAMERA ENFORCEMENT AND PUBLICITY
19
Figure 5.2
Annual number of casualty crashes for each treated District: 1996-2000
1,800
1,600
Number of casualty crashes
1,400
1,200
1,000
800
600
C
400
E
H
I
200
0
1996
1997
1998
1999
2000
Year of crash
5.2
CRASH OUTCOME MEASURES
For the crash analysis, the outcome measures considered were both changes in the number of casualty crashes that occurred during the period of increased enforcement as well as changes in crash severity. For the crash severity outcome measure, the casualty crashes were divided into those that had resulted in a fatality or serious injury, denoted as serious casualty crashes and those that resulted in a minor injury. The proportion that were fatal or serious measured crash severity. It was considered reasonable, for the purposes of the preliminary analysis, to expect that crash effects will occur in the same months as the changed enforcement because of the relatively short lapsed time between the date of the speeding offence and the date the speeding traffic infringement notice (TIN) was issued. During 1999 about 60% of speed camera TINs were issued within 7 to 14 days from the date of the offence (Figure 5.3). Thus at least some of the crash effects should be reflected in the month in which the enforcement occurred. However, for offences that occurred towards the end of the month, the changed enforcement conditions may not be reflected in that month’s crashes but rather in the next month’s crashes. This possibility was considered to weaken the preliminary analysis (and was addressed in later analysis reported in Chapter 6).
20
MONASH UNIVERSITY ACCIDENT RESEARCH CENTRE
Figure 5.3 Lapsed time between speed camera offence detection date and TIN issue date during 1999 (excluding lapsed times > 100 days) 70000
Speed Camera TINs Issued
60000
50000
40000
30000
20000
10000
0 2
5
8
11 14 17 20 23 26 29 32 35 38 41 44 47 50 53 56 59 62 65 68 71 74 77 80 83 86 89 92 95 98
Lapsed Time (Days)
The aim of the preliminary analysis was to see if there had been (i) a change in casualty crash frequency and/or (ii) a change in crash severity (i.e. a change in the proportion of casualty crashes that resulted in a fatality or serious injury) associated with each of the treatment conditions in the months and Districts in which they occurred. 5.3 5.3.1
PRELIMINARY ANALYSIS METHOD Casualty Crash Frequency
The number of casualty crashes that occurred in the Police Districts during the months in 1999 when there were changed speed camera enforcement conditions were compared with: i.
the annual average number of casualty crashes that occurred in the same Districts during the same months three years earlier (1996-1998);
ii.
the number of casualty crashes that occurred in the same Districts during the same months one year later (2000), and
iii.
the annual average number of casualty crashes that occurred in the same Districts during the same months for combined four years 1996-1998 and 2000.
These estimates, expressed as percentage changes, represented an initial estimate of the effect of the changed levels of speed camera enforcement. The possible effects of other factors affecting crashes during the same months were taken into account by analysing the changes in casualty crash frequencies that occurred in the Metropolitan Police Districts that had not had any changed speed camera enforcement conditions during the
INTERACTION BETWEEN SPEED CAMERA ENFORCEMENT AND PUBLICITY
21
relevant months of 1999 (i.e. Districts B, D, F, G, J & K). These crashes were assumed to be relatively unaffected by the changed speed camera enforcement conditions during 1999. The percentage change in this ‘comparison’ group of crashes was considered to measure the effects of other factors that may have affected crashes during the same months as the speed camera enforcement changes. To estimate the difference between the percentage change in the ‘treated’ crashes and the percentage change in the ‘comparison’ crash group, a net percentage change was calculated. The net percentage change was considered to estimate the effect of the change in speed camera enforcement, after the effects of other factors had been taken into account. 5.3.2
Crash Severity
The net percentage change in crash severity was calculated in a similar way to the net percentage change in crash frequency but with another dimension added, the severity of the crash (i.e. a serious casualty crash or a minor injury crash). This net percentage change gave the change in the proportion of casualty crashes that were serious which occurred during the period of changed speed camera enforcement conditions in the treatment Districts, relative to that expected from the crash experience in the same Districts when the enforcement level was unchanged, and taking into account other factors via the comparison Districts. Appendix B gives the estimated net percentage change in casualty crash frequency and crash severity that occurred under each treatment condition. Details of the calculations and the methods of testing the statistical significance of each type of percentage change are also given in the Appendix.
22
MONASH UNIVERSITY ACCIDENT RESEARCH CENTRE
5.4
SUMMARY OF PRELIMINARY ANALYSIS
For the four treatment conditions in which speed camera enforcement levels were increased in appropriate Districts during 1999, a summary of the main findings with the comparison Districts are given in Table 5.1. Table 5.1
Summary of main findings for Districts that had increased levels of speed camera enforcement
LEVEL OF SPEED CAMERA ENFORCEMENT INCREASE 100% increase 50% increase
Speed-related publicity PRESENT Significant reduction in crash severity (T2) Significant increase in casualty crash frequency (T4)
Speed-related publicity ABSENT Non-significant reduction in crash frequency (T1) Significant reduction in casualty crash frequency (T3) Non-significant reduction in crash severity (T3)
There were no statistically significant changes in crash frequency or crash severity associated with the treatment conditions where the speed camera enforcement levels had decreased by 50% or 100% (see Appendix B). There appeared to be evidence of a statistically significant increase in casualty crash frequency associated with the treatment condition of a 50% enforcement increase with publicity present (i.e. District E in June 1999 & District I in November 1999). This increase in casualty crash frequency was found in comparison to the untreated Melbourne Districts. Closer examination of the data found that the increase was mainly due to the relatively large number of casualty crashes that occurred in District E in June. When only District I was considered in the analysis, a net 2.7% reduction in casualty crash frequency was found. The increase in casualty crash frequency found for this treatment condition may also have been due to an artifact in the analysis method used or the way in which the measures of enforcement and advertising were defined. An alternative method of analysis and alternative measures of enforcement and advertising are described below. It was also noted that the months of June and July, and September and October, 1999 were associated with relatively high speeding offence detection rates in District E, particularly for the relatively high risk speeding offences. Figure 5.4 shows the monthly offence rates for vehicles assessed by speed cameras in District E, where the offences of exceeding the speed limit by 1629 km/h and by 30 km/h or above, respectively, have been weighted by the relative risk associated with these behaviours in urban areas, found by Kloeden et al (2002).
INTERACTION BETWEEN SPEED CAMERA ENFORCEMENT AND PUBLICITY
23
Figure 5.4
Speeding offence rate detected by speed cameras in District E Relative-risk weighted TINs detection rate per vehicle assessed District E, January 1996 to June 2000
14.0%
12.0%
10.0%
8.0%
6.0%
4.0%
2.0%
6 M ay -9 6 Ju l-9 6 Se p96 N ov -9 6 Ja n97 M ar -9 7 M ay -9 7 Ju l-9 7 Se p97 N ov -9 7 Ja n98 M ar -9 8 M ay -9 8 Ju l-9 8 Se p98 N ov -9 8 Ja n99 M ar -9 9 M ay -9 9 Ju l-9 9 Se p99 N ov -9 9 Ja n00 M ar -0 0 M ay -0 0
-9 ar
M
Ja
n-
96
0.0%
If the speed camera detection rate can be considered a reliable measure of speeding on Melbourne roads, then Figure 5.4 suggests that (especially risky) speeding was at a relatively high level in District E during June 1999. This was in contrast with the offence detection rate during that month across all Melbourne Police Districts (Figure 5.5). The relatively high level of risky speeding may explain the statistically significant increase in casualty crashes in District E in June 1999, reported in Table 5.1. Figure 5.5
Speeding offence rate detected by speed cameras in all Melbourne Districts Relative-risk weighted TINs detection rate per vehicle assessed All Metropolitan Districts, January 1996 to June 2000
16.0%
14.0%
12.0%
10.0%
8.0%
6.0%
4.0%
2.0%
24
6 M ay -9 6 Ju l-9 6 Se p96 N ov -9 6 Ja n97 M ar -9 7 M ay -9 7 Ju l-9 7 Se p97 N ov -9 7 Ja n98 M ar -9 8 M ay -9 8 Ju l-9 8 Se p98 N ov -9 8 Ja n99 M ar -9 9 M ay -9 9 Ju l-9 9 Se p99 N ov -9 9 Ja n00 M ar -0 0 M ay -0 0
ar -9
M
Ja
n-
96
0.0%
MONASH UNIVERSITY ACCIDENT RESEARCH CENTRE
5.5
LIMITATIONS OF PRELIMINARY ANALYSIS
The relative interaction between enforcement levels and associated publicity was not examined in the preliminary analysis. Only the separate effects of each of the eight treatment combinations on casualty crash frequency were examined. The preliminary analysis was also limited in that only the months when speed camera enforcement conditions had been changed were considered. That is, only crashes during April, June, August and November were considered in the analysis, thereby omitting the other months of the year and ignoring substantial crash data that could increase the statistical power of the tests, particularly in relation to measuring the publicity effects. A method of analysis (eg. a type of time series analysis) which takes into account crash data from all of the months of the evaluation period 1996-2000 would provide a more sensitive test of the presence of enforcement and publicity effects and their interaction. This analysis would also include seasonality and trend components, thereby offering a better explanation of the crash variations and increasing the sensitivity of the tests. The preliminary analysis also made the following implicit assumptions: 1. The influence of the enforcement change occurred throughout the month of change and did not extend beyond it. In contrast, past speed camera research suggests that the principal influence on crashes is the receipt of the speeding TINs arising from camera activity, typically 7-14 days after the camera session, and that the effects commenced from that date for up to three weeks (Cameron et al 1992, Rogerson et al 1994, Newstead et al 1995). Thus substantial effects during the month following the enforcement change could be expected in addition to, and perhaps greater than, any effects during the month of change. 2. The influence of the TAC speed-related television advertising was throughout the month in which it appeared and did not extend beyond it. In contrast, past MUARC research has shown that the awareness of TAC speed-related advertising has a half-life of about 5 weeks and a substantial retained base-level (Cameron et al 1999). Thus the awareness of speedrelated publicity during months when the publicity was considered absent (April and August 1999) may have been retained in drivers’ minds due to publicity in previous months. 3. The speed-related advertising (which used emotive styles during June and November 1999) potentially interacted with the increased speed camera activity, and that advertising with other themes and styles did not. In contrast, past MUARC research has suggested that drivers discriminate only between emotive and enforcement-related advertising, no matter what theme (Harrison and Senserrick 2000). Other MUARC research has shown that a speed enforcement-related advertisement, specifically related to moving mode radar speed detection units, magnified the effect of that enforcement on crashes (Diamantopoulou et al 1998). 4. The influence of the enforcement change was only in the Police District in which the change occurred. There were possible contamination effects in adjacent Districts. This would have reduced the sensitivity of the preliminary analysis in its ability to detect treatment effects.
INTERACTION BETWEEN SPEED CAMERA ENFORCEMENT AND PUBLICITY
25
6 6.1
ENFORCEMENT AND PUBLICITY INTERACTION EFFECTS ON CRASHES BACKGROUND
As outlined in the earlier chapters, during 1999 the Victoria Police varied the levels of speed camera activity substantially in four Police Districts according to a systematic plan aimed at providing information on the effects of the enforcement, the supporting TAC publicity, and particularly the interaction between these two programs. This was the first time in many years that the Police had varied their enforcement operations in a way that facilitates scientific research. Previous MUARC research on the two programs has relied on natural operational variation to provide a basis for seeking relationships with road crashes. For this reason, it was important that a comprehensive analysis of the 1999 variations in enforcement and publicity be undertaken in a way that allows the interaction effects to be examined. 6.2
ANALYSIS ISSUES AND AIMS
Based on the findings and limitations of the preliminary analysis, it was decided that the main issues for the comprehensive crash analysis were: 1. Representing the enforcement impact level by the number of speeding TINS received in a month (but detected in current and previous months). The TINs should be categorised into high, medium and low levels, and effects examined for each level, rather than assuming any functional relationship between TINS and crash outcomes. 2. Representing the advertising impact level by the Adstock of television TARPs in previous weeks. Adstock (Broadbent 1979) is a measure of retained awareness of past and current levels of TARPs, based on an exponential decay function (using a half-life of 5 weeks). This should be categorised into high and low levels, rather than assuming any functional relationship with crash outcomes. 3. Considering the influence of TAC advertising (measured by Adstock) in three different ways, namely: (a) speed-related advertising (all styles) (b) speed-related enforcement-style advertising (c) speed-related emotive-style advertising. Separate consideration of the enforcement-style and emotive-style advertising was undertaken because of the possibility that the enforcement-style advertising may interact differently with the speed camera enforcement, perhaps displaying greater synergy with the enforcement than emotive-style advertising. (Diamantopoulou et al 1998 found a related effect for advertising supporting moving mode radar speed enforcement.) The Adstock of enforcement-style advertising, with either drink-driving or speeding-related themes, was also considered but did not display any statistically significant links with crash outcomes. 4. Ignoring contamination effects in adjacent Districts, because most motorists become aware of the enforcement presence principally through the receipt of a speeding TIN, which specifies the location of the camera when the offence occurred. 5. Including trend and seasonal effects in the representation of crash outcomes over the five years 1996-2000. The representation of these effects is likely to increase the sensitivity of the statistical tests by reducing apparent chance variation. It will also serve to remove potential bias from the estimates of the effects of the factors of interest. To avoid any 26
MONASH UNIVERSITY ACCIDENT RESEARCH CENTRE
assumptions of functional form, the trend would be represented by a yearly step change in the level of the series and the seasonality by eleven dummy step variables, for each District. Both would be treated as categorical variables in the analysis,without any assumptions of functional form. 6. Testing the statistical significance of parameters representing the step effects of the enforcement levels, advertising levels, and the interaction between these two, using generalised linear models of the crash outcomes(crash frequency and crash severity, respectively) by District and month during 1996-2000. The analysis was designed to be conservative, making as few assumptions about the relationships between crash outcomes and the explanatory factors as possible, especially the functional forms of the relationships. It was decided that if the parameter estimates are suggestive of monotonic effects, a subsequent step may be to develop models of crash outcomes as functions of enforcement levels (measured by TINs issued in the month), advertising levels (measured by Adstock), an interaction term, and trend and seasonality. It was expected that the analysis would produce more definitive results regarding the presence of interaction effects than the preliminary crash analysis conducted earlier. The parameterisation of the generalised linear models was expected to be more conclusive in answering the research question. In summary, the aim of this further analysis was to develop models of monthly casualty crash frequencies and monthly crash severity levels for each Melbourne Police District4 as functions of the level of speed camera enforcement and the level of speed-related TAC advertising achieved per month, and the interaction between these two input factors. By doing this, the statistical significance of the interaction, and each of the main factors, can be tested. 6.3
CRASH DATA
For the evaluation period 1996-2000, the road trauma outcome criteria considered were: • Number of casualty crashes, per month per district • Proportion of the casualty crashes which were serious (resulting in death or serious injury), per month per district • Proportion of the casualty crashes which were fatal, per month per district 6.4
SPEED ENFORCEMENT DATA
It was intended that the level of speed camera enforcement would be represented by TINs issued per month in each district. Ideally, the TINs issuance date should have been used to represent the enforcement impact level. Past research suggested an influence on crashes around camera sites for up to three weeks after the TINs were received, thus the issuance date TINs may more accurately reflect the impact on crashes. However, due to incomplete data of TINs issuance for the years 1999 and 2000, the data on TINs based on the actual speed offence date was used instead of the TINs issuance date. Figure 6.1 to Figure 6.4 show the TINs by month of offence detection for Districts E, I, C and H.
4
District A was not considered because for most of the analysis period, 1996-2000, speed camera operations were not conducted in this District.
INTERACTION BETWEEN SPEED CAMERA ENFORCEMENT AND PUBLICITY
27
Generally, speeding offence TINs are issued approximately 1-2 weeks after speed offence occurrence. Thus a change in behaviour that may influence crash outcomes may be expected to occur during the month following that in which the speeding offence occurred. To compensate for this time discrepancy in speed offence occurrence and the potential effect on crashes, the speed camera offences were ‘lagged’ one month (i.e. one month earlier than the month of crash occurrence), so that they could be approximately comparable to the month in which TINs issuance has its expected effect on crash rates. Hence the TINs detected in one month were considered to affect the following month’s crashes. Figure 6.1
Monthly TINs detected in Police District E Number of speed camera TINs per month (based on offence date not issuance date) for DISTRICT E, January1996-December 2000
5000 4500
Number of TINs
4000 3500 3000 2500 2000 1500 1000
0
Jan-96 Feb-96 Mar-96 Apr-96 May-96 Jun-96 Jul-96 Aug-96 Sep-96 Oct-96 Nov-96 Dec-96 Jan-97 Feb-97 Mar-97 Apr-97 May-97 Jun-97 Jul-97 Aug-97 Sep-97 Oct-97 Nov-97 Dec-97 Jan-98 Feb-98 Mar-98 Apr-98 May-98 Jun-98 Jul-98 Aug-98 Sep-98 Oct-98 Nov-98 Dec-98 Jan-99 Feb-99 Mar-99 Apr-99 May-99 Jun-99 Jul-99 Aug-99 Sep-99 Oct-99 Nov-99 Dec-99 Jan-00 Feb-00 Mar-00 Apr-00 May-00 Jun-00 Jul-00 Aug-00 Sep-00 Oct-00 Nov-00 Dec-00
500
Month of speed camera offence
Figure 6.2
Monthly TINs detected in Police District I Number of speed camera TINs per month (based on offence date not issuance date) for DISTRICT I, January1996-December 2000
8000 7000
Number of TINs
6000 5000 4000 3000 2000
0
Jan-96 Feb-96 Mar-96 Apr-96 May-96 Jun-96 Jul-96 Aug-96 Sep-96 Oct-96 Nov-96 Dec-96 Jan-97 Feb-97 Mar-97 Apr-97 May-97 Jun-97 Jul-97 Aug-97 Sep-97 Oct-97 Nov-97 Dec-97 Jan-98 Feb-98 Mar-98 Apr-98 May-98 Jun-98 Jul-98 Aug-98 Sep-98 Oct-98 Nov-98 Dec-98 Jan-99 Feb-99 Mar-99 Apr-99 May-99 Jun-99 Jul-99 Aug-99 Sep-99 Oct-99 Nov-99 Dec-99 Jan-00 Feb-00 Mar-00 Apr-00 May-00 Jun-00 Jul-00 Aug-00 Sep-00 Oct-00 Nov-00 Dec-00
1000
Month of speed camera offence
28
MONASH UNIVERSITY ACCIDENT RESEARCH CENTRE
There were substantial increases in the number of speed offences detected in Districts E and I during April, June, August and November 1999, corresponding to the months when speed camera hours were increased by approximately 50% or 100% in those months, according to the experimental design for this study. The figures also show considerable variation in the number of TINs detected during other months in 1996-2000, a period when the speed camera operational hours per month were relatively stable (apart from December 1998). A relatively high level of TINs detected during December 1998 is apparent in District E but not in District I. In part because of this substantial variation in monthly TINs detected throughout 1996-2000, not just in 1999 (as expected), it was decided that the analysis should examine relationships between monthly crash outcomes and the enforcement (represented by the speed camera TINs detected in the previous month) throughout the period 1996-2000. By making use of 60 months of crash data for each District, not just 12 months, it was expected that this would increase the statistically sensitivity of the tests for any enforcement effects and their interaction with speedrelated publicity. Thus, in contrast with the original study design focussed on effects during 1999, the study became an examination of the effects of variations in speed camera enforcement (measured by TINs), speed-related TAC advertising (measured by Adstock), and their interaction, over the whole period 1996-2000. The 1999 peaks in enforcement activity played a role in providing some extremes in the level of enforcement, but were no longer the principal focus of the crash analysis. Figure 6.3
Monthly TINs detected in Police District C Number of speed camera TINs per month (based on offence date not issuance date) for DISTRICT C, January1996-December 2000
7000 6000
4000 3000 2000 1000 0
Jan-96 Feb-96 Mar-96 Apr-96 May-96 Jun-96 Jul-96 Aug-96 Sep-96 Oct-96 Nov-96 Dec-96 Jan-97 Feb-97 Mar-97 Apr-97 May-97 Jun-97 Jul-97 Aug-97 Sep-97 Oct-97 Nov-97 Dec-97 Jan-98 Feb-98 Mar-98 Apr-98 May-98 Jun-98 Jul-98 Aug-98 Sep-98 Oct-98 Nov-98 Dec-98 Jan-99 Feb-99 Mar-99 Apr-99 May-99 Jun-99 Jul-99 Aug-99 Sep-99 Oct-99 Nov-99 Dec-99 Jan-00 Feb-00 Mar-00 Apr-00 May-00 Jun-00 Jul-00 Aug-00 Sep-00 Oct-00 Nov-00 Dec-00
Number of TINs
5000
Month of speed camera offence
INTERACTION BETWEEN SPEED CAMERA ENFORCEMENT AND PUBLICITY
29
Figure 6.4
Monthly TINs detected in Police District H Number of speed camera TINs per month (based on offence date not issuance date) for DISTRICT H, January1996-December 2000
6000
Number of TINs
5000 4000 3000 2000
0
Jan-96 Feb-96 Mar-96 Apr-96 May-96 Jun-96 Jul-96 Aug-96 Sep-96 Oct-96 Nov-96 Dec-96 Jan-97 Feb-97 Mar-97 Apr-97 May-97 Jun-97 Jul-97 Aug-97 Sep-97 Oct-97 Nov-97 Dec-97 Jan-98 Feb-98 Mar-98 Apr-98 May-98 Jun-98 Jul-98 Aug-98 Sep-98 Oct-98 Nov-98 Dec-98 Jan-99 Feb-99 Mar-99 Apr-99 May-99 Jun-99 Jul-99 Aug-99 Sep-99 Oct-99 Nov-99 Dec-99 Jan-00 Feb-00 Mar-00 Apr-00 May-00 Jun-00 Jul-00 Aug-00 Sep-00 Oct-00 Nov-00 Dec-00
1000
Month of speed camera offence
As expected, in the Districts where the level of speed camera activity was reduced, there were consequential reductions in the number of speeding offences detected. There were none detected in District C during April and November, and in District H during June and August, when the cameras were deployed elsewhere. There were also apparent reductions in offences detected in these Districts during the months in which camera hours were reduced by approximately 50%. The monthly variation in the number of TINs detected in Metropolitan Police Districts which were not subject to variation in speed camera operations is shown in Appendix C. The detected speed offences were divided into 5 categories indicating whether the level of speed camera detections for a particular month in a particular district was considered Very Low (LL), Low (L), Medium (M), High (H) or Very High (HH). These categories were determined on the basis of the average monthly TINs value for a given district, plus or minus 10% and 30% of the average. That is: LL L M H HH
= Very Low = Low = Average = High = Very High
(30% more than the average)
The TINs categorisation was district and month based. Each district had different rates of speed camera offences and thus required different values for each of the 5 category boundaries. These values for each district are shown in Table 6.1.
30
MONASH UNIVERSITY ACCIDENT RESEARCH CENTRE
Table 6.1
District B C D E F G H I J K
Categorisation of monthly speed camera TINs for each Police District
- 30% 1768 2547 1487 1399 1926 3356 1941 2789 2063 1971
-10% 2273 3274 1912 1799 2476 4315 2495 3586 2653 2534
Average 2526 3638 2125 1999 2751 4794 2773 3985 2948 2816
+ 10% 2778 4002 2337 2199 3027 5274 3050 4383 3242 3097
+ 30% 3283 4729 2762 2598 3577 6232 3604 5180 3832 3660
For example, in District B, the monthly level of TINs detected by speed cameras was classified into one of the following categories during each month of 1996-2000: LL: L: M: H: HH:
3283
The complete matrix of lagged speed offence detections, categorised for each month within each district based on the above table, is shown in Appendix D. 6.5
SPEED-RELATED ADVERTISING DATA
The advertising impact level per month was represented by the Adstock of TARPs in previous weeks (using a half-life of 5 weeks), categorised into high and low levels. This representation was applied to TARPs covering the period 1996-2000. The category boundaries for discriminating between high and low levels of Adstock depended on the specific style of speedrelated advertising considered (see below). Adstock was first developed by Broadbent (1979) to describe the way that the audience’s retained awareness is related to current and past levels of advertising measured by TARPs. MUARC has used Adstock among a set of predictors of road trauma trends in a number of studies (Cameron et al 1993, 1997; Newstead et al 1995, 1998) based on the assumption that awareness of the advertising messages may have influenced behaviour. Later studies by Broadbent (1984) and MUARC (Cameron et al 1999) found that, as well as an exponential decay in awareness with time, there appears to be a base level of awareness for the moreimpactful advertising programs. When Cameron et al (1999) related the awareness of TAC speed-related advertising to Adstock during 1995-1998, they found that the emotive-style advertising appeared to have a stronger influence on awareness levels than the enforcement-style advertising. Other MUARC research has shown that these two advertising styles may have varying effects on people in terms of advertising impact and awareness (Harrison and Senserrick 2000). Emotive-style advertisements were perceived to be more serious, relevant and credible, and more effective (in
INTERACTION BETWEEN SPEED CAMERA ENFORCEMENT AND PUBLICITY
31
terms of self-reported behaviour change). It may be expected that different advertising styles had differing effects on crash outcomes. The influence of TAC advertising (represented by Adstock) was measured in three different ways, in parallel analyses, namely: • • •
speed-related advertising (all styles) speed-related enforcement-style5 advertising speed-related emotive-style6 advertising.
The advertisements classified by style are presented in Table 6.2. Advertisements launched prior to 1996 (the start of the evaluation period) are also included because the advertising was quantified by the Adstock function which represents past as well as current levels of publicity awareness. Table 6.2
TAC Speed-related advertisements by STYLE: 1996-2000
Advertisement Title
Style
Launch Date
Beach Road Speed camera Tracey 6 O’Clock News Courtroom Mum in a Hurry Gravel Truck Mobile Radar Laser 10 kph less Covert Young Cops Blame Consequences
Emotive Enforcement Emotive Emotive Emotive Emotive Emotive Enforcement Enforcement Emotive/Instructive Enforcement Enforcement/Emotive Emotive Enforcement
April 1990 April 1990 August 1990 September 1993 November 1993 September 1995 June 1996 November 1996 November 1996 May 1997 October 1997 June 1998 November 1999 July 2000
The Adstock of different advertising styles was categorized into high and low levels of advertising using somewhat arbitrary cut-off points to discriminate between high and low levels. These cut-off points for each advertising style are shown on Figure 6.5 to Figure 6.7 representing each of the three advertising styles. Television advertising in Melbourne covers the whole metropolitan area. Therefore, monthly Adstock was available only for the entire Melbourne area, not each District separately. The matrix indicating whether the advertising style was considered high or low for each style of advertising, by month in 1996-2000, is shown in Appendix E. 5
Also included one advertisement aired during the evaluation period, “Young Cops”, that was classed as a mix of enforcement/emotive styles. 6 Included one advertisement aired during the evaluation period, “10 kph less”, that was classified as a mix of emotive/instructive styles, as well as the “Young Cops” advertisement (i.e. a mix of emotive/enforcement styles).
32
MONASH UNIVERSITY ACCIDENT RESEARCH CENTRE
6.5.1
Speed-related advertising awareness
Figure 6.5 shows the variation in speed-related advertising (all styles) from 1996 to 2000 in Adstock units. The advertising has been divided into high and low using a cut-off at 750 Adstock units, chosen to provide discrimination during 1999 in particular. The graph indicates that the advertising is cyclical in nature, that is, there were periods of high advertising awareness and periods of low. Speed-related advertising was a frequently-used theme from January 1996 to the end of 1998, after which there appeared to be a drop in advertising intensity for this particular theme. Figure 6.5
Speed-related Adstock per month, Melbourne 1996-2000
3500 3250 3000 2750 2500
Adstock units
2250 2000 1750 1500 1250 1000 750 500 250 Jan-96 Feb-96 Mar-96 Apr-96 May-96 Jun-96 Jul-96 Aug-96 Sep-96 Oct-96 Nov-96 Dec-96 Jan-97 Feb-97 Mar-97 Apr-97 May-97 Jun-97 Jul-97 Aug-97 Sep-97 Oct-97 Nov-97 Dec-97 Jan-98 Feb-98 Mar-98 Apr-98 May-98 Jun-98 Jul-98 Aug-98 Sep-98 Oct-98 Nov-98 Dec-98 Jan-99 Feb-99 Mar-99 Apr-99 May-99 Jun-99 Jul-99 Aug-99 Sep-99 Oct-99 Nov-99 Dec-99 Jan-00 Feb-00 Mar-00 Apr-00 May-00 Jun-00 Jul-00 Aug-00 Sep-00 Oct-00 Nov-00 Dec-00
0
6.5.2
Speed-related enforcement-style advertising awareness
The enforcement-style advertising with speeding themes has been divided into high and low using a cut-off at 300 ADSTOCK units as shown on Figure 6.6. This type of advertising had not been used for many years until late 1996. The peaks in awareness of this advertising style occurred around January each year during 1997-1999 and around June during 1997-1998. The style was not so commonly used after mid-1999, so awareness levels were apparently relatively low during this period.
INTERACTION BETWEEN SPEED CAMERA ENFORCEMENT AND PUBLICITY
33
Figure 6.6
Speed-related Enforcement style (including enforcement/emotive style) Adstock per month, Melbourne 1996-2000
2700 2400 2100
Adstock units
1800 1500 1200 900 600 300
Jan-96 Feb-96 Mar-96 Apr-96 May-96 Jun-96 Jul-96 Aug-96 Sep-96 Oct-96 Nov-96 Dec-96 Jan-97 Feb-97 Mar-97 Apr-97 May-97 Jun-97 Jul-97 Aug-97 Sep-97 Oct-97 Nov-97 Dec-97 Jan-98 Feb-98 Mar-98 Apr-98 May-98 Jun-98 Jul-98 Aug-98 Sep-98 Oct-98 Nov-98 Dec-98 Jan-99 Feb-99 Mar-99 Apr-99 May-99 Jun-99 Jul-99 Aug-99 Sep-99 Oct-99 Nov-99 Dec-99 Jan-00 Feb-00 Mar-00 Apr-00 May-00 Jun-00 Jul-00 Aug-00 Sep-00 Oct-00 Nov-00 Dec-00
0
6.5.3
Speed-related emotive-style advertising awareness
The emotive-style advertising was less cyclical in nature and the trend appears to more variable than the enforcement style, as demonstrated in Figure 6.7. This was a common style of advertising with speed-related themes from 1996 to 1998. It appears to have increased in intensity near the end of 2000 after a reduction during 1999. Figure 6.7
Speed-related Emotive style (including emotive/instructive and emotive/enforcement styles) Adstock per month, Melbourne 1996-2000
3250 3000 2750 2500
Adstock units
2250 2000 1750 1500 1250 1000 750 500 250 Jan-96 Feb-96 Mar-96 Apr-96 May-96 Jun-96 Jul-96 Aug-96 Sep-96 Oct-96 Nov-96 Dec-96 Jan-97 Feb-97 Mar-97 Apr-97 May-97 Jun-97 Jul-97 Aug-97 Sep-97 Oct-97 Nov-97 Dec-97 Jan-98 Feb-98 Mar-98 Apr-98 May-98 Jun-98 Jul-98 Aug-98 Sep-98 Oct-98 Nov-98 Dec-98 Jan-99 Feb-99 Mar-99 Apr-99 May-99 Jun-99 Jul-99 Aug-99 Sep-99 Oct-99 Nov-99 Dec-99 Jan-00 Feb-00 Mar-00 Apr-00 May-00 Jun-00 Jul-00 Aug-00 Sep-00 Oct-00 Nov-00 Dec-00
0
34
MONASH UNIVERSITY ACCIDENT RESEARCH CENTRE
6.6 6.6.1
ANALYSIS METHODOLOGY Types of analysis
Two statistical techniques, both belonging to the Generalised Linear Modelling family, were used to analyse the effect of speed camera enforcement and speed-related advertising on crash outcomes during 1996-2000. The first was a Poisson Regression Modelling approach, to determine the effect on casualty crash frequency, and the second was a Logistic Regression to determine the effect on the severity of the crashes. Poisson Regression Modelling was used to model crash frequency. This technique assumes that the underlying distribution is not necessarily continuous. In the situation where crash frequency is modelled, it allows the choice of an appropriate error structure which will model the observed discrete crash frequency response by using a Poisson log-link function. This is also known as log-linear modelling. This function restricts the fitted values to positive values, which is realistic when modelling crash frequency and, being on a log scale, represents the multiplicative effect of a change in one of the independent variables. The Generalized Linear Modelling also allows a mixture of continuous and discrete independent variables to be modelled. Logistic Regression was used in the analysis to model crash severity. This was analysed using two separate regressions, where the difference lay in the dependent variable. The first regression used the proportion of total casualty crashes that were fatal as the dependent variable, and the second regression considered the proportion of crashes that were serious casualty crashes. Serious casualty is defined as those that were either fatal or serious injury crashes. Whether the crash was fatal (or, alternatively, whether the crash was a serious casualty one) is a dichotomous response and therefore these crash severity rates are appropriately modelled using a logistic regression which models binary dependent variables as a function of independent variables. 6.6.2
Model Assumptions
The Poisson Regression Model and Logistic Regression make similar assumptions. Both techniques assume independence among the independent or explanatory variables. Multicollinearity leads to biased results and inflated standard errors, which leads to Type II errors, i.e. not rejecting the null hypothesis, when in fact the effect is real. They also both also assume that the model has been correctly specified and that all relevant variables have been included in the model and irrelevant variables not included. The Hosmer and Lemeshow (1989) goodness-of-fit test was carried out on each of the logistic regression models to determine whether the fitted model was an adequate fit. Each model produced a non-significant result thus suggesting an adequate fit. 6.6.3
Model Specification
The effect of speed camera enforcement and different styles of advertising on the crash number and severity was modelled, as well as any synergistic or interaction effect from any particular combination of enforcement and advertising. An interaction is when the effect of one level of a factor depends on the level of another factor. The effects of these factors may not be simply additive and may have a synergistic effect. There are potentially ten interactive combinations effects for each model analysed, that is, five levels of enforcement by two levels of advertising. The relevant hypotheses to test for an effect are:
INTERACTION BETWEEN SPEED CAMERA ENFORCEMENT AND PUBLICITY
35
H0: H1:
αi = 0 αi ≠ 0
i.e. there is no enforcement effect, i.e. there is an enforcement effect
where i=1,2,3,4,5
H0: H1:
βj = 0 βj ≠ 0
i.e. there is no advertising effect, i.e. there is an advertising effect
where j=1,2
H0: H1:
αβij = 0 αβij ≠ 0
i.e. there is no interaction effect i.e. there is an interaction effect
However, in order to measure these effects, all other influences on crash frequency and crash severity rate should be accounted for in the model. It was seen in Figure 5.2 that the different districts have different crash frequencies. This was allowed for in the model by specifying a dummy variable which modelled the district as a fixed factor. Since monthly crash frequency was analysed, it was hypothesised that some kind of seasonal effect could be expected where, across the years, there may be months of high crash frequency and months of low crash frequency. This was modelled by using a dummy indicator variable to represent each month of crash. To capture any yearly trends over the five-year period 1996–2000, an indicator variable to represent year of crash was specified. The model also allowed for any interactions between the district, year and month. This was done by including two-way interaction terms in the model. The Month by Year interaction assumes seasonality effects are not the same every year. Including the District by Month and District by Year interactions, allows the effect of month and yearly trend to vary by district as well. A Month by Year by District three-way interaction term was not included in the model as this would serve to effectively explain all of the variation in crash outcomes by itself and leave no purpose for the modelling process. The representation of these additional effects is likely to increase the sensitivity of the statistical tests by reducing apparent chance variation. These variables, as well as the variables of interest, are explained in Equation 1 (see below) which represents the general model used in the analysis. 6.6.4
Analysis Models
There were three models considered to test the effect of speed camera enforcement, publicity, and the interaction effect of both together, on crash frequency and crash severity. These models are summarised in Table 6.3. Table 6.3
Model 1 2 3
Model Summary
Speed Camera Enforcement Five categories based on TINs detected* " "
Advertising Theme / Style Speed-related (all styles) Speed-related Enforcement style Speed-related Emotive style
* Traffic Infringement Notices for speeding offences detected in the District during the previous month
The principal difference in Models 1-3 related to the different advertising styles as described in Section 6.5. The general model and specification of independent variables for the Poisson Regression Modelling and the Logistic Regression were the same, but the dependent variable was different for the different types of techniques. The Poisson Regression modelled the casualty crash 36
MONASH UNIVERSITY ACCIDENT RESEARCH CENTRE
frequency, whereas the Logistic Regression modelled the binary outcomes of (i) fatal or nonfatal casualty crash, and (ii) serious or non-serious casualty crash. The following Equation 1 represents the crash analysis model. Equation 1
General Equation used in the Poisson Regression and Logistic Regression
Log (Crashijklm)= α + β1i*Districti + β2j*Monthj + β3ki*Yeark + β4l* TINsl(t-1)+ β5m* Advertisingm + β6lm*(TINsl(t-1) * Advertisingm) + β7jk*(Monthj*Yeark) + β8ij*(Districti*Monthj) + β9ik* (Districti * Yeark) + εijklm Where, Crash
=
No. of casualty crashes, for the Poisson Regression analysis. P/(1-P), for the Logistic Regression, where P is the probability of (i) fatal or (ii) serious casualty outcome in a crash.
District
=
District effect for district i where i = B, C, D, E, F, G, H, I, J, K.
Month
=
Dummy variable for each of the 12 months where j = Jan, Feb, … , Dec.
Year
=
Dummy variable for each of the 5 years where k = 1996, 1997, 1998, 1999, 2000.
TINs
=
Categorical coding of speeding offences detected in the District during the previous month into 5 levels, as described in section 6.4. Reference level = Medium. where l = 1,2,3,4,5
Advertising
=
Categorical coding of advertising Adstock into High and Low, as described in section 6.5. Reference level = Low. where m = 1,2
TINs*Advertising
=
Interaction effect of TINs and advertising at different levels.
Month*Year
=
Allows seasonality to change across years.
District*Month
=
Allows seasonality to vary by district.
District*Year
=
Allows yearly trends to vary by district
6.6.5
Goodness of Fit
The scaled deviance of each of the Poisson Regression models was assessed to determine whether the regression model gave an adequate fit. If the regression model is an adequate fit, then the ratio of deviance to the degrees of freedom should be close to one. Each of the models gave a scaled deviance of approximately 1.2 which suggests an adequate model. Under the Poisson Regression Modelling analysis, when comparing the scaled deviances between competing models it was found that all three models had approximately the same
INTERACTION BETWEEN SPEED CAMERA ENFORCEMENT AND PUBLICITY
37
value. Therefore this test did not discriminate between the models to help decide which best fitted the crash data and best represented reality. 6.6.6
Inclusion of interaction term
The statistical significance of the interaction term in the models was determined by examining the change in scaled deviance in a reduced model, which did not include the interaction term, in comparison with a saturated model, which included the term. The scaled deviance is a measure of the goodness of fit and is able to distinguish between competing models regarding whether an effect helps to explain any additional variation in the model. The relevant hypothesis is: H0: H1:
Reduced Model without additional effect Model with additional effect
i.e. effect = 0 i.e. effect ≠ 0
The scaled deviance of the Enforcement by Publicity interaction was analysed to see if the term contributed to explaining the variation in the model. It was found that when testing the interaction for significance, a non-significant result was found for all models (see detailed results below). Therefore it could be concluded that the interaction term is not necessary to be included in the model to help explain the effects of speed camera enforcement and publicity, and did not contribute to explaining the variation in the crash outcomes. 6.7
MODELLING RESULTS
The full model, Equation 1, was fitted to the monthly crash outcomes over the five years 19962000 (60 months) and the ten Police Districts (600 observations in all). When the crash outcome was the number of casualty crashes, the equation fitted was the Poisson Regression Model. When the crash outcome was a dichotomous variable representing the severity of the casualty crashes (see Section 6.3), the equation fitted was the Logistic Regression. While the models aimed at a comprehensive representation of the 600 crash outcomes in each case, the principal focus was on the enforcement and publicity factors and their interaction. The results for each of the three styles of speed-related publicity considered, outlined in Table 6.3, are given below. The tables present only the modelling results for the variables of interest speed camera enforcement, publicity and the enforcement/publicity interaction. All other variables as specified above in Equation 1 were included to help explain the crash outcomes, but were otherwise of limited interest and are therefore not presented. However, to determine the effect of the principal factors, the analysis needed to consider the influence of all factors, including the district, month and year variables. 6.7.1
Interpretation of Results
The Poisson Regression Model coefficient estimates are interpretable multiplicatively as a percentage change, holding all else constant in the model. The direction of an effect is defined by whether the coefficient is positive or negative, indicating an increase or decrease in the dependent variable, the number of casualty crashes. For example, at low levels of enforcement we might expect a positive coefficient to suggest that with lower levels of enforcement, there would be an increase in crash frequency. The 95% confidence limits for the percentage change are interpreted in the same way.
38
MONASH UNIVERSITY ACCIDENT RESEARCH CENTRE
Interpretation for the Logistic Regression is slightly different to that of the Poisson Regression Model. The coefficient is given in terms of the log odds and this is more interpretable as an odds ratio (relative risk) by taking the exponent. Odds ratios are given in the relevant tables below. If the odds ratio is greater than one, then the particular effect is associated with higher odds of fatal or serious casualty outcome of the casualty crashes. Again, the 95% confidence limits are interpreted in the same way as odds ratios. Each effect is compared to a reference group. For the level of enforcement, the reference group is the Medium level of TINs detected. By choosing an average level as the reference group, it was more convenient to interpret effects from the lower and higher levels in relation to an average group and whether the effects are in the expected direction, i.e. an increase or decrease. The publicity reference group was selected to be Low level. A negative coefficient associated with the effect would suggest that high levels of advertising awareness are associated with a decrease in crash frequency. The signs of the coefficients of the interaction terms are directly interpretable but need to be considered in conjunction with the parameterisation (particularly reference levels) of the two main effects (enforcement and publicity) in order to determine direction. Each combination of enforcement and publicity levels which include a reference group for one of these factors (Medium enforcement and Low publicity, respectively) becomes a reference level for the interaction. The other interaction coefficients represent an adjustment for the effect when the two main effect coefficients are combined. The Poisson Regression Modelling uses an asymptotic chi-square test to test for statistical significance of each individual level of effect, compared to the reference group. For the logistic regression, the Wald chi-square value tests the hypothesis that a particular total effect (all levels) is zero. The associated p-value (value of statistical significance) is shown beside each chi-square statistic. All significant values at the 5% value have been highlighted. 6.7.2 6.7.2.1
Model 1: Speed Camera TINs & Speed-related Advertising (all styles) Number of casualty crashes
Table 6.4 shows the estimated coefficients of the enforcement, publicity and interaction terms in the Poisson Regression Modelling of monthly casualty crashes. The coefficients for district, month, year and their interactions are not presented because, although statistically significant, these factors are not relevant to the tests for the presence of enforcement and publicity effects.
INTERACTION BETWEEN SPEED CAMERA ENFORCEMENT AND PUBLICITY
39
Table 6.4 Parameter
Model 1 Poisson Regression Table of Estimates d.f
Enforcement Very Low 1 Low 1 High 1 Very High 1 Medium 0 Publicity High 1 Low 0 Enforcement * Publicity Very Low * High 1 Very Low * Low 0 Low * High 1 Low * Low 0 High * High 1 High * Low 0 Very High * High 1 Very High * Low 0 Average * High 0 Average * Low 0
Percentage Change
Percentage Change CI Lower Upper
ChiSquare
p-value
6.82 3.62 -2.11 -3.00 0.00
-1.63 -2.10 -7.21 -8.23 0.00
15.99 9.67 3.27 2.52 0.00
2.46 1.51 0.61 1.17 .
0.116 0.220 0.435 0.280 .
-12.20 0
-22.62 .
-0.39 .
4.08 .
0.043 .
-4.35 0 -1.29 0 2.01 0 3.63 0 0 0
-12.46
4.50
-7.54
5.38
-4.37
8.83
-3.35
11.14
0.97 . 0.15 . 0.37 . 1 . . .
0.324 . 0.697 . 0.546 . 0.316 . . .
A global test of the statistical significance of the interaction coefficients was undertaken by examining the increase in scaled deviance when the enforcement by publicity interaction was removed from the model. The increase in deviance was 3.42 on 4 d.f., which was not statistically significant (p = 0.490). None of the four interaction coefficients were individually statistically significant (Table 6.4). While not significant, the signs and magnitudes of the interaction coefficients were consistent with negative synergy, ie. when high enforcement and high publicity awareness operated together, their combined effect was less than expected from their individual effects. A global test of the enforcement coefficients was also performed by examining the increase in scaled deviance when the enforcement factor was removed from the reduced model above. The increase was 6.53 on 4 d.f., which was only marginally statistically significant (p = 0.163). None of the enforcement coefficients were individually significant. However, their montonic pattern of estimated effects was consistent with the expected enforcement effect, decreasing from an estimated 6.8% increase in casualty crashes associated with very low levels of enforcement, to a 3.0% decrease in crashes with very high levels of enforcement. The estimated effects for the intermediate levels of enforcement are consistent with the smooth relationship identified by Elvik (2001; see Section 2.1). The coefficient of the publicity factor was statistically significant (p = 0.043) and, being dichotomous, this factor did not require a global test. High levels of speed-related advertising awareness were associated with a 12.2% reduction in casualty crashes, relative to the effect at low levels of awareness.
40
MONASH UNIVERSITY ACCIDENT RESEARCH CENTRE
6.7.2.2
Adequacy of the crash frequency model
As noted in section 6.6.5, each of the Poisson Regression Models of monthly casualty crashes had scaled deviance approximately 1.2 times the degrees of freedom, suggesting that the model was an adequate fit to the data. Comparisons of the crash frequencies predicted by Model 1 with the actual monthly crashes in Districts E, I, C and H (the districts in which camera hours were manipulated during 1999) are shown in Figure 6.8 to Figure 6.11. These figures confirm the relatively good fit of Model 1 to the monthly casualty crashes during 1996-2000 in all ten districts. It is noteworthy that Model 1 severely underestimates the actual crash frequency in District E during June 1999. It will be recalled that the relatively high number of crashes in this situation was apparently the source of the statistically significant increase associated with the combination of 50% increase in speed camera hours when speedrelated publicity was present (see Section 5.4). That same month appeared to be associated with a relatively high level of risky speeding in District E (see Figure 5.4). There were no similar findings for District I in November 1999, the other situation in which 50% increase in camera hours was combined with the presence of speed-related publicity. These observations confirm the limited nature of the preliminary analysis, which focused on only four months of crash outcomes compared with 60 months in the comprehensive analysis reported in this chapter. The finding from District E during June 1999 may have been artifactual, especially since it was not confirmed in District I during November 1999 under the same conditions. The comprehensive analysis was less susceptible to possibly chance fluctuations in speeding behaviour from month to month, which apparently occurred in District E during 1999. It was also more specifically focused on the likely effects of the changed enforcement on the crashes during periods subsequent to the month in which the change occurred (see Section 6.4). Figure 6.8
Fit of Model 1 to District E crashes, 1996-2000 District E: Monthly casualty crashes represented by Model 1
160
140
100
80
60
40
20 Observed Predicted 0 Ja n9 M 6 ar -9 M 6 ay -9 6 Ju l-9 Se 6 p9 N 6 ov -9 Ja 6 n9 M 7 ar -9 M 7 ay -9 7 Ju l-9 Se 7 p9 N 7 ov -9 Ja 7 n9 M 8 ar -9 M 8 ay -9 8 Ju l-9 Se 8 p9 N 8 ov -9 Ja 8 n9 M 9 ar -9 M 9 ay -9 9 Ju l-9 Se 9 p9 N 9 ov -9 Ja 9 n0 M 0 ar -0 M 0 ay -0 0 Ju l-0 Se 0 p0 N 0 ov -0 0
All Casualty Crashes
120
Month
INTERACTION BETWEEN SPEED CAMERA ENFORCEMENT AND PUBLICITY
41
Ja n9 M 6 ar -9 M 6 ay -9 6 Ju l-9 Se 6 p9 N 6 ov -9 Ja 6 n9 M 7 ar -9 M 7 ay -9 7 Ju l-9 Se 7 p9 N 7 ov -9 Ja 7 n9 M 8 ar -9 M 8 ay -9 8 Ju l-9 Se 8 p9 N 8 ov -9 Ja 8 n9 M 9 ar -9 M 9 ay -9 9 Ju l-9 Se 9 p9 N 9 ov -9 Ja 9 n0 M 0 ar -0 M 0 ay -0 0 Ju l-0 Se 0 p0 N 0 ov -0 0
All Casualty Crashes Ja n9 M 6 ar -9 M 6 ay -9 6 Ju l-9 Se 6 p9 N 6 ov -9 Ja 6 n9 M 7 ar -9 M 7 ay -9 7 Ju l-9 Se 7 p9 N 7 ov -9 Ja 7 n9 M 8 ar -9 M 8 ay -9 8 Ju l-9 Se 8 p9 N 8 ov -9 Ja 8 n9 M 9 ar -9 M 9 ay -9 9 Ju l-9 Se 9 p9 N 9 ov -9 Ja 9 n0 M 0 ar -0 M 0 ay -0 0 Ju l-0 Se 0 p0 N 0 ov -0 0
All Casualty Crashes
Figure 6.9
Figure 6.10
42 Fit of Model 1 to District I crashes, 1996-2000 District I: Monthly casualty crashes represented by Model 1
180
160
140
120
100
80
60
40
20 Observed
0 Predicted
Month
Fit of Model 1 to District C crashes, 1996-2000
District C: Monthly casualty crashes represented by Model 1
140
120
100
80
60
40
20 Observed
0
Predicted
Month
MONASH UNIVERSITY ACCIDENT RESEARCH CENTRE
Figure 6.11
Fit of Model 1 to District H crashes District H: Monthly casualty crashes represented by Model 1
160
140
All Casualty Crashes
120
100
80
60
40
20 Observed Predicted Ja n9 M 6 ar -9 M 6 ay -9 6 Ju l-9 Se 6 p9 N 6 ov -9 Ja 6 n9 M 7 ar -9 M 7 ay -9 7 Ju l-9 Se 7 p9 N 7 ov -9 Ja 7 n9 M 8 ar -9 M 8 ay -9 8 Ju l-9 Se 8 p9 N 8 ov -9 Ja 8 n9 M 9 ar -9 M 9 ay -9 9 Ju l-9 Se 9 p9 N 9 ov -9 Ja 9 n0 M 0 ar -0 M 0 ay -0 0 Ju l-0 Se 0 p0 N 0 ov -0 0
0
Month
6.7.2.3
Casualty crash severity
The severity of the monthly casualty crashes was measured in two ways: (i) the proportion of such crashes resulting in a fatality, and (ii) the proportion of crashes resulting in death or serious injury. Logistic Regression was used to model these monthly proportions. 6.7.2.3.1
Fatal crash rate
Table 6.5 shows the Logistic Regression results for crash severity measured by the fatality rate, ie. the proportion of casualty crashes resulting in a fatality. The odds ratios measure the estimated relative risk that the casualty crash outcome will be fatal under the particular enforcement or publicity condition, relative to the risk under the condition of the reference category (ie. Medium enforcement and Low publicity, respectively). Neither the enforcement by publicity interaction, nor the publicity awareness level, had a statistically significant effect on the fatality rate. Hence, while there are some apparently quite substantial departures in relative risk from one for these two factors, there is no reliable evidence that these effects are real and not due to chance. In contrast, the level of speed camera enforcement measured by TINs detected in the previous month, was statistically significantly associated with the fatality rate. The odds ratio of 0.59 associated with Very High level of enforcement was individually statistically significantly different from one (p = 0.035), suggesting that the risk of fatal casualty crash outcome associated with speed camera offence detections at this level is 41% less than expected from medium levels of enforcement. The relative risk appears to range from 1.44 associated with Very Low levels of enforcement to 0.59 associated with Very High levels.
INTERACTION BETWEEN SPEED CAMERA ENFORCEMENT AND PUBLICITY
43
Table 6.5
Model 1 Logistic Regression estimates for fatal crash severity
Parameter
d.f
Enforcement Very Low 1 Low 1 High 1 Very High 1 Medium 0 Publicity High 1 Low 0 Enforcement * Publicity Very Low * High 1 Very Low * Low 0 Low * High 1 Low * Low 0 High * High 1 High * Low 0 Very High * High 1 Very High * Low 0 Average * High 0 Average * Low 0
6.7.2.3.2
Odds Ratio
Odds Ratio 95% CI Lower Upper
ChiSquare
p-value
1.44 0.94 0.97 0.59 .
0.77 0.60 0.63 0.36 .
2.70 1.49 1.49 0.96 .
1.29 0.06 0.03 4.47 .
0.255 0.803 0.872 0.035 .
1.80 .
0.60 .
5.36 .
1.10 .
0.294 .
0.69 . 0.93 . 0.92 . 1.54 . . .
0.35 . 0.55 . 0.55 . 0.83 . . .
1.36 . 1.57 . 1.56 . 2.83 . . .
1.16 . 0.08 . 0.09 . 1.88 . . .
0.281 . 0.775 . 0.768 . 0.171 . . .
Serious casualty crash rate
The Logistic Regression results for serious casualty rate (ie. the proportion of casualty crashes resulting in death or serious injury) did not suggest any statistically significant effects associated with the enforcement, publicity or enforcement by publicity interaction. For this reason, no regression estimates are presented here because there is no reliable evidence that the apparent effects were real and not due to chance. 6.7.3
Model 2: Speed Camera TINs & Speed-related Enforcement-style Advertising
The format and process of analysis for Model 2 was identical to Model 1, except that the Adstock of only the enforcement-style of speed-related advertising was considered as an explanatory factor (see Section 6.5.2). Model 1 had included the Adstock of all styles of speedrelated advertising. 6.7.3.1
Number of casualty crashes
Table 6.6 shows the results of Poisson Regression Modelling of monthly casualty crashes for Model 2. The increase in scaled deviance when the enforcement by publicity interaction was removed from the model was 3.64 on 4 d.f., which was not statistically significant (p = 0.457). None of the four interaction coefficients were individually statistically significant. There was no clear pattern suggestive of positive or negative synergy in these non-significant coefficients. Overall, there was no apparent evidence of any interaction effect.
44
MONASH UNIVERSITY ACCIDENT RESEARCH CENTRE
Table 6.6
Model 2 Poisson Regression Table of Estimates
Parameter
d.f
Enforcement Very Low 1 Low 1 High 1 Very High 1 Medium 0 Publicity High 1 Low 0 Enforcement * Publicity Very Low * High 1 Very Low * Low 0 Low * High 1 Low * Low 0 High * High 1 High * Low 0 Very High * High 1 Very High * Low 0 Average * High 0 Average * Low 0
Percentage Percentage Change CI Change Lower Upper
ChiSquare
p-value
0.99 3.62 -1.05 -1.38 0
-3.42 0.23 -4.62 -5.09 0
5.61 7.13 2.64 2.46 0
0.19 4.39 0.32 0.51 .
0.664 0.036 0.571 0.476 .
14.57 0
1.22 0
29.69 0
4.630 .
0.032 .
3.19 0 -2.72 0 0.68 0 1.27 0 0 0
-3.60 . -7.83 . -5.83 . -5.69 . . .
10.47 . 2.66 . 7.64 . 8.74 . . .
0.82 . 1.01 . 0.04 . 0.12 . . .
0.366 . 0.315 . 0.843 . 0.729 . . .
The global test of the effect of the enforcement factor was also not statistically significant. However, the coefficient associated with a Low level of enforcement was (p = 0.036). An estimated 3.6% increase in monthly casualty crashes was associated with this level of enforcement. However, the results suggested that Very Low enforcement was associated with only 0.99% increase in crashes (though this result was not necessarily reliable). The absence of a monotonic trend of effects on crash frequency associated with increasing levels of enforcement, in contrast with previous findings (Elvik 2001), casts doubt on the reliability of the set of estimates of the enforcement effects. The coefficient of the publicity factor was statistically signficant (p = 0.032) and the estimate suggested that High levels of enforcement-style speed-related advertising awareness were associated with a 14.6% increase in casualty crashes. This result was counter-intuitive, because at worst it could be expected that the advertising had no effect on crashes, but not actually increase the risk of a casualty crash. In part, this result may have been an artifact of the modelling brought about by the strong statistically significant effect of the emotive-style speedrelated advertising (see Section 6.7.4.1), which in turn seemed to explain most of the effect of speed-related advertising of any style (Section 6.7.2.1). During more than half of the months in 1996-2000, the level of awareness of TAC’s enforcement-style speed-related advertising was low when the awareness of the emotive-style was high, or vice-versa (Table 6.7). Thus in the modelling described here, where the enforcement-style advertising replaced speed-related advertising of any style, the estimated effect of the advertising may have reversed its sign because the advertising factor was mainly a proxy for the absence of high awareness of the emotive-style advertising.
INTERACTION BETWEEN SPEED CAMERA ENFORCEMENT AND PUBLICITY
45
Table 6.7: Comparison of levels of awareness of the two styles of speed-related TAC advertising each month during 1996-2000
Awareness of enforcement-style advertising High Low
Awareness of emotive-style advertising High Low 15 7 26 12
This apparently artifactual effect of the inclusion of the enforcement-style advertising in the modelling, combined with the absence of a monotonic trend in the estimated enforcement effects, casts considerable doubt on the Model 2 representation of the monthly casualty crashes. For this reason, it may be difficult to reach conclusions about the effect of the enforcement-style advertising on casualty crash frequency (see discussion in Sections 9.1.3 and 9.3.3). 6.7.3.2
Casualty crash severity
As for Model 1, the severity of the monthly casualty crashes was measured in two ways in the analysis of Model 2: (i) the proportion of such crashes resulting in a fatality, and (ii) the proportion of crashes resulting in death or serious injury. 6.7.3.2.1
Fatal crash rate
Table 6.8 shows the Logistic Regression results when crash severity was measured by the fatality rate. The fatality rate was associated with the level of speed camera enforcement, with the odds ratio of 0.74 associated with Very High enforcement being statistically significant (p = 0.052). The odds ratio of 0.76 for High enforcement was similar and marginally statistically significant (p = 0.069). This suggests that the risk of fatal casualty crash outcome was 24-26% less at these levels of enforcement compared with medium and lower levels (the latter having odds ratios not significantly different from one). However these relative risk estimates need to be tempered by the apparent interaction between the enforcement level and publicity awareness. While the odds ratio associated with High levels of awareness of the enforcement-style advertising was 0.56 (but not statistically significant), the combination of High level enforcement and High publicity awareness had a conditional odds ratio of 1.77 which was statistically significant (p = 0.040). Thus the estimated relative risk associated with this combination of enforcement and publicity was 1.77 x 0.76 x 0.56 = 0.75, relative to the risk with medium enforcement and low publicity awareness. In contrast, the estimated relative risk associated with Very High enforcement and High publicity awareness was 0.74 x 0.56 = 0.41 (ignoring any adjustment by the conditional odds ratio of 1.16 because it was not statistically significant). Thus, when there was an increase in the level of speed camera enforcement (measured by TINs detected in the previous month) during months when there was high awareness of enforcementstyle speed-related advertising, there appeared to be a substantial reduction in the risk of fatal crash outcome when the enforcement level was very high but not when it was only high (see definitions in Section 6.4). The magnitude of this reduction in fatality rate is large enough to outweigh the apparent increase in casualty crash risk associated with high awareness of this type of publicity (assuming that the estimate of the effect of the publicity on crash risk is real and not an artifact of Model 2; see Section 6.7.3.1).
46
MONASH UNIVERSITY ACCIDENT RESEARCH CENTRE
Table 6.8
Model 2 Logistic Regression estimates for fatal crash severity
Parameter
d.f
Enforcement Very Low 1 Low 1 High 1 Very High 1 Medium 0 Publicity High 1 Low 0 Enforcement * Publicity Very Low * High 1 Very Low * Low 0 Low * High 1 Low * Low 0 High * High 1 High * Low 0 Very High * High 1 Very High * Low 0 Average * High 0 Average * Low 0
6.7.3.2.2
Odds Ratio
Odds Ratio 95% CI Lower Upper
ChiSquare
p-value
0.94 0.90 0.76 0.74 .
0.66 0.69 0.56 0.55 .
1.35 1.17 1.02 1.00 .
0.10 0.65 3.30 3.76 .
0.752 0.421 0.069 0.052 .
0.56 .
0.19 .
1.61 .
1.17 .
0.279 .
1.22 . 0.96 . 1.77 . 1.16 . . .
0.71 . 0.61 . 1.03 . 0.63 . . .
2.11 . 1.50 . 3.06 . 2.11 . . .
0.51 . 0.04 . 4.24 . 0.23 . . .
0.474 . 0.852 . 0.040 . 0.634 . . .
Serious casualty crash rate
Table 6.9 shows the Logistic Regression results when crash severity was measured by the serious casualty rate. The results have similarities to those for the fatality rate, as may be expected since fatal crashes are included in serious casualty crashes, except that the variations in odds ratios were no more than 10% above or below the reference value (one) apart from one situation. The serious casualty rate was associated with the level of enforcement to a limited degree, with only the odds ratio of 0.92 associated with High enforcement being statistically significant (p = 0.038). The odds ratio associated with the publicity level was close to one and not statistically significant. The combination of High level enforcement and High publicity awareness had a conditional odds ratio of 1.16 was statistically significant (p = 0.050). Thus while there were some statistically significant associations between the serious casualty rate, the enforcement level, and the enforcement by publicity interaction, the magnitudes of the changes in relative risk were small by comparison with the apparent effects of the same factors on the fatality rate. This is consistent with the Model 1 analysis of the serious casualty rate, where no statistically significant effects of these factors were found (though there was a statistically significant effect on the fatality rate, as found for Model 2).
INTERACTION BETWEEN SPEED CAMERA ENFORCEMENT AND PUBLICITY
47
Table 6.9
Model 2 Logistic Regression estimates for serious casualty crash severity
Parameter
d.f
Enforcement Very Low 1 Low 1 High 1 Very High 1 Medium 0 Publicity High 1 Low 0 Enforcement * Publicity Very Low * High 1 Very Low * Low 0 Low * High 1 Low * Low 0 High * High 1 High * Low 0 Very High * High 1 Very High * Low 0 Average * High 0 Average * Low 0
6.7.4
Odds Ratio
Odds Ratio Lower
95% CI Upper
ChiSquare
p-value
0.98 0.98 0.92 0.95 .
0.89 0.91 0.85 0.87 .
2.70 1.05 1.00 1.04 .
0.15 0.43 4.32 1.28 .
0.696 0.512 0.038 0.258 .
1.10 .
0.83 .
1.45 .
0.44 .
0.506 .
1.04 . 1.01 . 1.16 . 1.08 . . .
0.90 . 0.89 . 1.00 . 0.92 . . .
1.21 . 1.13 . 1.34 . 1.26 . . .
0.29 . 0.01 . 3.84 . 0.89 . . .
0.591 . 0.936 . 0.050 . 0.346 . . .
Model 3: Speed Camera TINs & Speed-related Emotive-style Advertising
The format and process of analysis for Model 3 was identical to Models 1 and 2, except that the Adstock of only the emotive-style of speed-related advertising was considered as an explanatory factor (see Section 6.5.2). 6.7.4.1
Number of casualty crashes
Table 6.10 shows the results of Poisson Regression Modelling of monthly casualty crashes for Model 3. The results are similar to those for Model 1 in which all styles of speed-related advertising were considered. The increase in scaled deviance when the enforcement by publicity interaction was removed from the model was 3.35 on 4 d.f., which was not statistically significant (p = 0.50). None of the four interaction coefficients were individually statistically significant, but their signs and magnitudes were consistent with negative synergy between the enforcement and publicity (as observed for Model 1). The global test of the effect of the enforcement factor was not statistically significant, and nor were any of the individual enforcement coefficients (Table 6.10). However, the monotonic pattern of estimated effects was consistent with the expected enforcement effect.
48
MONASH UNIVERSITY ACCIDENT RESEARCH CENTRE
The coefficient of the publicity factor was statistically significant (p = 0.036), suggesting that High levels speed-related emotive-style advertising were associated with a 12.6% reduction in casualty crashes, relative to effects at low levels of awareness of this publicity. Table 6.10
Model 3 Poisson Regression Table of Estimates
Parameter
d.f
Enforcement Very Low 1 Low 1 High 1 Very High 1 Medium 0 Publicity High 1 Low 0 Enforcement * Publicity Very Low * High 1 Very Low * Low 0 Low * High 1 Low * Low 0 High * High 1 High * Low 0 Very High * High 1 Very High * Low 0 Average * High 0 Average * Low 0
Percentage Percentage Change CI Chip-value Change Lower Upper Square 5.92 2.46 -2.16 -3.48 0
-0.89 -2.57 -7.08 -8.66 .
13.20 7.75 3.04 2.00 .
2.88 0.9 0.68 1.58 .
0.090 0.344 0.409 0.209 .
-12.62 0
-22.97 .
-0.88 .
4.4 .
0.036 .
-3.62 0 0.16 0 2.03 0 4.28 0 0 0
-10.60 . -5.76 . -4.42 . -2.81 . . .
3.88 . 6.44 . 8.92 . 11.88 . . .
0.93 . 0 . 0.36 . 1.36 . . .
0.335 . 0.960 . 0.547 . 0.243 . . .
As well as being similar to Model 1, the results of the Model 3 analysis are consistent with the expected effects of the enforcement and publicity found in previous research (at least the research relating principally to TAC’s emotive-style speed-related advertising; see Section 2.2). This provides support for the conclusion that Models 1 and 3 provide similar good representations of the variations in monthly casualty crashes in the Melbourne Police Districts during 1996-2000. The same cannot be said for Model 2. 6.7.4.2
Casualty crash severity
As for Models 1 and 2, the severity of the monthly casualty crashes was measured in two ways in the analysis of Model 3: (i) the proportion of such crashes resulting in a fatality, and (ii) the proportion of crashes resulting in death or serious injury. 6.7.4.2.1
Fatal crash rate
The Logistic Regression results for the fatality rate did not suggest any statistically significant effects associated with the enforcement, publicity or enforcement by publicity interaction. No regression estimates are presented here because there is no reliable evidence that the apparent effects were real and not due to chance. There was one marginally significant result (p = 0.064) associated with very high levels of enforcement. This was similar to the statistically significant
INTERACTION BETWEEN SPEED CAMERA ENFORCEMENT AND PUBLICITY
49
finding from the Model 1 analysis of the fatality rate (Table 6.5), providing support for the presence of a real effect. 6.7.4.2.2
Serious casualty crash rate
The Logistic Regression analysis of serious casualty rate also did not produce any statistically significant effects. There was one marginally significant result (p = 0.061) associated with the interaction of high levels of enforcement and high levels of publicity. This was similar to the statistically significant finding from the Model 2 analysis of the serious casualty rate (Table 6.9).
50
MONASH UNIVERSITY ACCIDENT RESEARCH CENTRE
7 7.1
DRIVER PERCEPTIONS AND REPORTED BEHAVIOUR7 GENERAL DESIGN
A quasi-experimental design was adopted to investigate the interaction between road safety publicity and enforcement on drivers' self-reported behaviour and perceptions. Victoria Police and their private speed-camera operators (LMT Australia) were able to increase the amount of speed enforcement in two Police Districts by factors of 50% and 100% at various times during 1999. These periods coincided with planned periods of speed-related and no speed-related publicity funded by the Transport Accident Commission in various media. The combination of publicity and enforcement is shown in Table 7.1.
Table 7.1: Basic Experimental Design
ENFORCEMENT LEVEL 50% increase on normal speed camera operational levels
100% increase on normal speed camera operational levels
Speed-related publicity present
Publicity and 50% increase in enforcement
Publicity and 100% increase in enforcement
No speed-related publicity
No publicity and 50% increase in enforcement
No publicity and 100% increase in enforcement
PUBLICITY
The study was conducted in two Police Districts in the Melbourne metropolitan area, selected by the Victoria Police for operational reasons. The two areas served to control (partially) for the potential influence of the time of the year on enforcement effects by counterbalancing the conditions as discussed below. Police Districts E and I were used. The factorial design was complicated by the need to collect and incorporate data from a preprogram period to detect differences in the various outcome measures compared to a nopublicity/normal enforcement period. It was considered important to have pre-program data to serve as a comparison. The result of this was to direct part of the statistical analysis towards simple comparisons between the pre-program responses and the responses during various combinations of increased enforcement and publicity to detect the effects of increased enforcement under different publicity conditions. 7.2
TELEPHONE SURVEYS
Data were collected using random-number telephone surveys conducted by MUARC staff according to the timetable discussed below. The surveys were conducted in the evenings using 7
Material included in this chapter and the survey described therein were prepared and carried out by Warren Harrison and Emma Fitzgerald while members of staff of the Monash University Accident Research Centre. An interpretation of the results of the survey is given in the following chapter.
INTERACTION BETWEEN SPEED CAMERA ENFORCEMENT AND PUBLICITY
51
telephone numbers collected from the Melbourne telephone directory using random page numbers and column numbers and lists of appropriate suburbs for inclusion in the survey sample. Only licensed drivers were sampled. There were five survey waves, each conducted over five to eight working days during the periods outlined in Table 7.2. In the analysis of the survey data, a pre-intervention survey conducted in February (prior to the first enforcement period) acted as a Baseline comparison to allow measurement of the relative effects on the perceived risk of detection of the two levels of increased enforcement (compared to each other and to the Baseline measures) in the context of the presence or absence of publicity relating to speeding. The timing of components of the evaluation is shown in Table 7.2. The surveys were conducted at the end of each relevant month to ensure that the enforcement and publicity had an opportunity to be observed.
Table 7.2: Timing of Enforcement, Publicity, and Survey Components of Evaluation
F
M
A
M
J
J
A
S
O
N
No
TAC
No
TAC
Publicity
Publicity
Publicity
Publicity
E District
♦
♦
♦
♦
♦
I District
♦
♦
♦
♦
♦
KEY
♦
50% increase in speed camera operational levels 100% increase in speed camera operational levels Survey of perceived risk of detection etc.
The survey instrument incorporated items to collect information on the following: • • • • • • • •
Driving exposure – including the amount and type of driving undertaken by participants The perceived risk of detection for speeding for other drivers and for the participant in the week following the survey. The crash-related anxiety of the driver when speeding in the week following the survey. The behavioural intentions of the driver regarding speeding in the week following the survey. The strength of speed-reduction influence of a number of factors. Some general attitude measures relating to driving and speeding. The detection and crash history of the participant. Information regarding recent contact with enforcement and recent exposure to road-safety publicity.
The perceived risk, crash-anxiety, and behavioural intention items collected data on each measure for four different driving conditions arranged in a two by two factorial structure. Responses to each item were provided for daytime, 60 and 100km/h speed zones, and nighttime 60 and 100km/h speed zones. It was considered that contact with the speed camera program might influence driver responses differently in these driving situations.
52
MONASH UNIVERSITY ACCIDENT RESEARCH CENTRE
7.3
ANALYSIS
The data collected from the two Districts were combined so that five conditions were defined for subsequent analysis: •
Preliminary data (P): This condition included data collected from both Districts in February, serving as a no-publicity and standard-enforcement period for comparison purposes.
•
No publicity and 50% increase in enforcement (N50): This condition included data collected from I District in April and from E District in August.
•
No publicity and 100% increase in enforcement (N100): This condition included data collected from I District in August and E District in April.
•
Publicity and 50% increase in enforcement (Y50): This condition included data collected from I District in November and from E District in June.
•
Publicity and 100% increase in enforcement (Y100): This condition included data collected from I District in June and E District in November.
The survey data sets contributing information about driver perceptions and behaviour under each enforcement/publicity condition are shown in Table 7.3. Table 7.3: Symbols used to describe each survey data set, related to the level of speed camera increase (50% or 100%) and the presence (Y) or absence (N) of speed-related publicity
F
M
A
M
J
J
A
S
O
N
No
TAC
No
TAC
Publicity
Publicity
Publicity
Publicity
E District
P*
N100
Y50
N50
Y100
I District
P
N50
Y100
N100
Y50
* Preliminary data (P) collected during month of no camera increase and no speed-related publicity
Responses to relevant items were then subjected to an analysis that had the broad intention of comparing the P condition with each of the other conditions to measure any changes in responses (compared to the no-publicity, standard enforcement condition). The analysis of the data for the evaluation of the enforcement and publicity program therefore involved a series of pairwise comparisons. It was considered that such an analysis would fail to allow a comparison between the different publicity and enforcement conditions, however. It is possible that differences between the enforcement and publicity conditions would provide pointers towards the most effective approach. A subsequent analysis was conducted using the publicity and enforcement conditions as factors in a two by two design, with the intention of providing some guidance towards potentially-effective programs in future.
INTERACTION BETWEEN SPEED CAMERA ENFORCEMENT AND PUBLICITY
53
7.4
SAMPLE CHARACTERISTICS
In total, 6594 telephone calls were made from the Monash University Accident Research Centre to households in Police Districts E and I over the duration of the project. Of these, 233 calls resulted in an engaged signal, there was no driver at home in 370 cases, 778 calls resulted in being connected to an answering machine, there was no answer in 1616 cases, and 658 telephone numbers were not connected. Of calls which were successfully connected, 1822 (62%) people refused to participate, and 1115 (38%) people agreed to participate in the survey. The results of calls for each survey phase are shown in Table 7.4.
Table 7.4: Results of telephone calls in each survey phase
Result of call Agreed Refused Refusal Rate
Phase 1 N % 224 20 330 30 60%
Phase 2 N % 218 22 296 30 58%
Phase 3 N % 209 14 420 29 67%
Phase 4 N % 222 20 274 25 55%
Phase 5 N % 242 13 502 26 67%
No driver in household Not connected No answer Answering machine Engaged
123 204 98 93 35
96 184 102 56 25
153 402 173 60 54
107 258 142 64 46
179 568 261 97 73
11 18 9 8 3
10 19 10 6 3
10 27 12 4 4
10 23 13 6 4
Analyses were conducted to determine whether those who agreed to participate in the survey differed from those who refused to participate. There was a significant relationship between refusal rate and sex of the participant (χ2 = 13.1, p