pores are uniformly filled with liquid and gas is struck head-on by a planar ... the flow field that is developed inside a porous medium after it is struck head-on by.
c 2006 Cambridge University Press J. Fluid Mech. (2006), vol. 563, pp. 159–188. � doi:10.1017/S0022112006001133 Printed in the United Kingdom
159
The interaction of planar shock waves with multiphase saturated flexible porous materials – a numerical investigation By D. L E V I-H E V R O N I1 , A. L E V Y1 , G. B E N-D O R1 A N D S. S O R E K1,2 1
Pearlstone Center for Aeronautical Engineering Studies, Department of Mechanical Engineering, Ben-Gurion University of the Negev, Beer Sheva, Israel 2 Environmental Hydrology and Microbiology, J. Blaustein Desert Research Institutes, Ben-Gurion University of the Negev, Sde Boker Campus, Israel
(Received 14 February 2005 and in revised form 1 February 2006)
The three-dimensional governing macroscopic equations of the flow field which is developed when an elasto-plastic highly deformable open-cell porous medium whose pores are uniformly filled with liquid and gas is struck head-on by a planar shock wave, are developed using a multiphase approach. The one-dimensional version of these equations is solved numerically using an arbitrary Lagrangian Eulerian (ALE) based numerical code. The numerical predictions are compared qualitatively to experimental results from various sources and good agreements are obtained. This study complements our earlier studies in which we solved, using an ALE-based numerical code, the one-dimensional governing equations of the flow field which is developed when an elasto-plastic flexible open-cell porous medium, capable of undergoing extremely large deformations, whose pores are saturated with gas only, is struck headon by a planar shock wave.
1. Introduction Levy, Ben-Dor & Sorek (1996) presented a comprehensive numerical investigation of the propagation of planar shock waves through gas-saturated elastic rigid porous materials, able to undergo only very small deformations. (We use the term ‘rigid’ in the loose relative sense, which is common when applied to porous materials, in general, and in particular, i.e. deformations do not exceed a few per cent.) Their study consisted of (i) development of the governing equations, (ii) developed of a total variation diminishing (TVD) based numerical code for solving the equations, (iii) simulation of the interaction process, and (iv) comparison of their numerical predictions with experimental results that were conducted by them. Levi-Hevroni et al. (2002) complemented this study by considering gas saturated elasto-plastic flexible porous materials, capable of undergoing extremely large deformations. In their study they (i) developed, using a multiphase approach, the three-dimensional governing equations of the flow field, (ii) developed an arbitrary Lagrangian Eulerian (ALE) based numerical code for solving the equations, (iii) solved numerically the onedimensional version of these equations, and (iv) compared qualitatively the numerical predictions to experimental results from various sources. In the present study, we extend the investigation of Levi-Hevroni et al. (2002) from a two-phase medium, i.e.
160
D. Levi-Hevroni, A. Levy, G. Ben-Dor and S. Sorek
a gas-saturated solid flexible foam, to a three-phase medium, i.e. a solid flexible foam saturated with two different fluids, a gas (air) and a liquid (water). As stated in Levy et al. (1996) and Levi-Hevroni et al. (2002) if a local study of the flow field that is developed inside a porous medium after it is struck head-on by a shock wave is required, an analysis based on a continuum multiphase approach, rather than a single-phase approach (e.g. the mixing approach), should be carried out. In the multiphase approach, the porous medium is considered to be composed of a few phases, namely the solid matrix of which the foam skeleton is made and the fluids that occupy its pores, which interact with each other. Baer & Nunziato (1986) presented a detailed description of this approach. Baer (1988) presented a one-dimensional two-phase analysis with air as the fluid phase. Biot’s (1956) analysis referred to microscopic representations of the phase balance equations within the framework of the theory of mixtures and was probably the first one to employ the notion of wave propagation in porous media. A large number of papers have appeared in the literature following Biot’s pioneering (e.g. Degrande & de Roeck 1992; Nigmatulin & Gubaidulin 1992; Smeulders, de La Rosette & van Donger 1992). Most refer to linear acoustic waves that take place when the momentum dissipation terms dominate. Corapcioglu (1991) presented an extensive literature survey of similar approaches. Macroscopic mass, momentum and energy balance equations for the fluid phases and the solid matrix were formulated on the basis of representative elementary volume (REV) concepts by Bear & Bachmat (1990). These macroscopic balance equations were composed of averaged flux terms together with integrals of the microscopic exchange flux terms at the phase interfaces. Some unique macroscopic parameters, which emerged from the averaging process, were the tortuosity factor that represented a tensor associated with the matrix directional cosines, the hydraulic radius of the pore spaces, and the porosity that represented the volume fraction of the pores, filled by the fluids. Consequently, unlike preceding models (e.g. Baer 1988), which accounted only for the properties of the phases, the macroscopic model developed by Bear & Bachmat (1990) also accounted for the geometrical properties. Based on these studies, Bear & Sorek (1990) developed the dominant macroscopic forms of the mass and momentum balance equations following an abrupt pressure impact in gas-saturated porous materials under isothermal conditions. They showed that during a certain time period, owing to the domination of the momentum inertial terms the fluid momentum balance equation conforms to nonlinear waveforms for which the wave speed was also a function of the internal structure of the porous material. This initiated the establishment of the macroscopic theoretical basis for wave motion in multiphase deformable porous media. Bear et al. (l992) and Sorek et al. (l992) elaborated on these for the case of thermoelastic porous media, describing the theoretical basis for obtaining displacement and shock waves, respectively. Levy et al. (l995) introduced additional Forchheimer terms (an additional macroscopic inertial term emerging from the exchange of microscopic inertia between the fluid and the solid phases at their solid–fluid interface) and obtained a variety of nonlinear wave equation forms. These together with the development of the evolving balance equations that follow an abrupt simultaneous change of the fluid temperature and pressure, were the major novel theoretical aspects when compared with Nikolaevskij (1990). Levy et al. (1995) conducted a dimensional analysis of these macroscopic balance equations and obtained the macroscopic momentum and energy balance equations, for a gas-saturated elastic rigid (limited to very small deformations) porous medium.
Interaction of planar shock waves with multiphase porous materials
161
(The term gas-saturated in this study means that the same gas occupies all the pores.) Unlike the model of Levy et al. (1996), the model of Levi-Hevroni et al. (2002) included the capability of the solid matrix to undergo extremely large deformations. As a result the governing equations included different constitutive equations. In addition, Hooke’s law was expressed in terms of the stress rate as a function of the strain rate, i.e. σ˙ = f (˙ε), rather than the stress as a function of the strain σ = f (ε) as was the case in Levy et al. (1996). This change resulted in an additional differential equation in the set of the governing equations, which, in turn, required an additional integration. The ability of the porous medium to undergo extremely large deformations prevented Levi-Hevroni et al. (2002) from adopting the TVD-based computer code, which was developed by Levy et al. (1996). Instead, a new code, which included an interface tracking technique, originally proposed by Chan (1975), aimed at tracking the porous medium interface, was developed. The upwind TVD shock-capturing scheme (which is based on an Eulerian method) was extended to solve the governing equations of the gaseous phase, and a Lagrangian method was extended to solve the governing equations of the solid phase. As a result, a mixed Lagrangian and Eulerian method (ALE) was implemented in order to predict the characteristics of the entire flow field. A comprehensive theoretical and experimental study of the interaction of a planar shock wave propagating inside water and striking a semi-infinite fully and partially saturated column of porous medium, which was based on the mixed approach, was conducted by van der Grinten et al. (1988). (By fully saturated porous medium we generally mean that all the pores are filled with liquid. By partially saturated porous media we mean that some of the pores are filled with liquid and some of them are filled with gas. In van der Grinten et al., the liquid was water and the gas was air.) In their analytical model they assume that the nonlinear terms (i.e. the terms that are related to the square of the velocity) in the conservation equations, the changes in the density of the solid matrix, and the temperature changes are all negligibly small. As a consequence of the constant temperature assumption, their analytical model does not account for the conservation of energy equation. In addition, they assume that all the variables are complex amplitudes that exponentially depend on time, t, and frequency, ω e.g. p = p˜ exp(iωt). They also assume that the momentum transfer between the phases depends on the frequency, and that the dependence can be expressed in terms of a Darcy type momentum flux (i.e. a linear friction dependence between the phases) multiplied by a respective function. In their model they also accounted for the added mass. The equation of state of the water was expressed as a function of the water compressibility; Hooke’s law was used to express the stresses in the solid; and the strain was expressed as an inverse function of the relative volume of the water. The numerical solution of van der Grinten et al. (1988), for the fully saturated case, revealed the existence of two wavefronts that were moving at different velocities. The first wave was developed inside the porous medium and it compressed the entire medium (i.e. the liquids and the solid). The second wave, which was slower, was developed inside the liquid and it further compressed the liquid. Van der Grinten et al. (1988) also solved numerically the partially saturated case. They presented various results as a function of the degree of saturation (percentage of air). They showed, for example, that for the case of 0.1 % air, the pressure amplitude in the pores was lower than in the fully saturated case. However, the amplitude of the effective stress was larger. The opposite was revealed behind the second wave, namely, the pressure amplitude is larger and the effective stress amplitude is smaller. They also reported that the amplitude of the first wave was barely noticed when the degree
162
D. Levi-Hevroni, A. Levy, G. Ben-Dor and S. Sorek
of saturation was increased to 1 %. The numerical calculations of van der Grinten et al. (1988) indicated that there is a strong dependence between the properties of the porous medium and the liquid filling its pores. The numerically predicted results were validated by experiments, which were conducted in a vertical shock tube. The investigated porous medium (column) was made of epoxy-glued sand. A planar incident shock wave, propagating in air, hit an air/water interface. The transmitted wave interacted with the porous medium. The porous medium contained pressure transducers, which measured the pressure in the pores along the column. The measurements revealed a two-step pressure increase in the pores. The first stage was a sharp jump, which was close to being constant, and the second stage was a gradual increase, until a constant value was reached. Similarly, the experiments indicated that the strain jumps sharply to a constant value that is maintained until its magnitude gradually decreased to a constant value. 2. Three-dimensional governing equations Levi-Hevroni (2000) presented a detailed derivation of the three-dimensional macroscopic governing equations governing the flow field, which is developed when waves propagate through a multiphase saturated porous medium. In the following, only the assumptions used in the derivation of the governing equations and the final form of the equations are given. 2.1. The assumptions 1. The fluids filling the pores are gas and liquid (they are denoted by g and �, respectively). 2. The fluids are ideal (i.e. inviscid, µf = 0, and thermally non-conductive, λf = 0. Here, µf is the dynamic viscosity and λf is the thermal conductivity of the fluid, which is denoted by f (≡ g, �)). 3. The pressure due to the surface tension of the liquid phase is negligible. 4. The gas obeys the equation of state of a perfect gas. 5. The dispersive and the diffusive mass fluxes of the phases are much smaller than the corresponding advective mass fluxes, and can, therefore, be neglected. 6. The dispersive momentum fluxes of the phases are much smaller than their advective momentum fluxes, and can, therefore, be neglected. 7. The conductive and the dispersive heat fluxes of the fluids phases are negligibly small compared to their advective heat fluxes. 8. The microscopic solid/fluid interfaces are material surfaces with respect to the masses of both the fluids and the solid phases. 9. The solid matrix is flexible, and is assumed to behave as an elasto-plastic material. 10. The stress–strain relationships of the solid matrix, at the microscopic level, and of the solid matrix, at the macroscopic level, have the same form. 11. The material of which the skeleton of the porous material is made is incompressible. 12. The specific heat capacity at constant volume of the fluids, Cf , are constant. 13. The energy processes of the gaseous phase are reversible. Energy associated with viscous dissipation is negligibly small. 14. There are no external energy sources. Rates of heat transferred between the fluids and the solid phases are negligibly small. 15. The energy associated with viscous dissipation in each phase is negligible.
Interaction of planar shock waves with multiphase porous materials
163
16. The solid phase is isothermal. 17. The initial distributions of both fluids, i.e. the liquid and the gas, are uniform. 2.2. The balance equations The macroscopic mass balance equation for the liquid, the gas and the solid phases are: ∂ (θ� ρ� ) = −∇ · (θ� ρ� V � ), ∂t ∂ (θg ρg ) = −∇ · (θg ρg V g ), ∂t ∂ [(1 − φ)ρs ] = −∇ · [(1 − φ)ρs V s ], ∂t
(1) (2) (3)
where ρα is the density of the α-phase, V α is its velocity vector, φ is the porosity and θα is the volume fraction of the α fluid phase which occupies the pores of the porous media. The storativity (Sα ) of the α fluid, which defines the percentage of the α fluid in the pores of the porous matrix, may be used (θα = Sα φ) to define the porosity of the media. φ = θ� + θg = S� φ + (1 − S� )φ.
(4)
The macroscopic momentum balance equations for the liquid and the gas phases are: ∂ (θ� ρ� V � ) = −∇ · [θ� ρ� V � V � ] − θ� T∗ [∇p� + ρ� g∇Z] − F˜�s θ� ρ� V �s V �s − F˜g� θg ρg V g� V g� , ∂t (5) ∂ (θg ρg V g ) = −∇ · [θg ρg V g V g ] − θg T∗ [∇pg + ρg g∇Z] ∂t − θg ρg (F˜gs V gs V gs − F˜g� V g� V g� ), (6) where pα , which is the partial pressure of the α-phase, is prescribed by the equation of state [pα = pα (ρα , eα ), α = �, g], g is the acceleration due to gravity in the Zdirection, F˜αβ and T∗ are the Forchheimer tensors for an isotropic solid matrix and the tortuosity tensor associated with the directional cosines at the α−β interface, and V αβ (≡ V α − V β , α = �, s, g, β = �, s, g, α �= β) is the relative velocity between the α and β phases, respectively. The macroscopic momentum balance equation for the solid phase is: ∂ [(1 − φ)ρs V s ] = −∇ · [(1 − φ)ρs V s V s ] + ∇σs� − φpc ∇S� ∂t − (1 − φT∗ )∇pv + F˜�s θ� ρ� V �s V �s + F˜gs θg ρg V gs V gs , where the capillary and the void pressures are defined by � pc = pg − p� , pv = S� p� + (1 − S� )pg ,
(7)
(8)
and σ �s is the effective stress tensor of an elasto-plastic solid matrix as given by Terzaghi (1925) and expressed by σ �s = (1 − φ)(σ s + pv I).
(9)
164
D. Levi-Hevroni, A. Levy, G. Ben-Dor and S. Sorek
The macroscopic energy balance equation for the liquid and the gas phases are written, respectively, in the forms: � � � �� � �� ∂ V 2� V 2� θ� ρ� e� + = −∇ · θ� ρ� V � e� + ∂t 2 2 ∗ ˜ − T θ� V f ∇p� − F�s θ� ρ� V �s V �s V s − F˜g� θg ρg V g� V g� V � , (10) � � � �� � �� V 2g V 2g ∂ θg ρg eg + = −∇ · θg ρg V g eg + ∂t 2 2 ∗ − T θg V g ∇pg − θg ρg (F˜gs V gs V gs V s − F˜g� V g� V g� V � ),
(11)
where eg is the internal energy of the fluid. The equation of state for the gas phase, which is assumed to be a perfect gas, is: pg = ρg �Tg .
(12)
Here, � is the specific gas constant and Tg is the gas absolute temperature. The equation of state for the liquid phase having a constant compressibility factor, βp , is: (13) p� = βp ρ� . It should be noted here that unlike Levy et al. (1996), who treated a thermo-elastic solid matrix, the present model assumes an elasto-plastic model. This, in turn, enables the solid matrix to undergo extremely large deformations. As a result, Hooke’s law was expressed in terms of the effective stress rate (˙ σsi� ) tensor components depending on the strain rate (˙ ε i ) tensor components: σ˙si� = λ��s
V˙ + 2µ�s ˙εi , V
(14)
where µ�s and λ��s are the Lam´e constants of a solid and V is the relative volume of the solid matrix. The dot means a Lagrangian time derivative along a particle path. It should be noted here that natural strain is used when Hooke’s law is expressed in the form of equation (14). Natural strain means that the strain of an element referred to the actual configuration instead of the original configuration. The macroscopic strain rate tensor for the solid matrix is defined by, ε˙ = 12 [∇V s + (∇V s )T ].
(15)
The volumetric strain can be obtained from the macroscopic mass balance equation. The solid macroscopic mass balance equation along a particle path is, D [(1 − φ)ρs ] = −∇ · V s . (16) Dt We can define the relative volume, V =ρ¯so /ρ¯s , where ρ¯so = (1 − φo )ρs and ρ¯s = (1 − φ)ρs , and rewrite the mass balance equation in the following form, 1 DV = ∇ · V s. (17) V Dt The stresses can be decomposed into a hydrostatic component, P (the mean of the three principal stresses), and a deviator component, τ : σsi� = −Psi + τi .
(18)
Interaction of planar shock waves with multiphase porous materials With the aid of equations (7) and (11), Hooke’s law can be expressed as, � � 1 V˙ V˙ � , P˙ = −K , τ˙si = 2µs ˙εi − 3V V
165
(19)
where K is the bulk modulus. The yield condition (von Mises) was written as, τ12 + τ22 + τ32 6 23 (Y o )2 ,
(20)
o
where Y is the yield strength in simple tension. Following the calculation of the stress deviators, using Hooke’s law (equation (12)), the yield condition, given by equation (20), was checked. If the yield condition was not fulfilled, the solid was allowed to deform plastically under a constant stress equal to the maximum value that satisfied√equation�(20). This was accomplished by multiplying each of the stress deviators by 2/3Y o / τ12 + τ22 + τ32 . The normal stress was independent of the plastic deformation, and an equation of state having the form P = P (V ) was used to calculate the normal stress. 2.3. One-dimensional governing equations In the present study, the one-dimensional version of the above set of three-dimensional governing equations for an isothermal gas and liquid phases was solved. The mass, momentum and energy balance equations, respectively, of the gas phase occupying the pores of the porous medium are: ∂ ∂ (θg ρg ) = − (θg ρg ug ), ∂t ∂x ∂ ∂pg ∂ (θg ρg ug ) = − [θg ρg ug ug ] − θg T ∗ − θg ρg (F˜gs ugs ugs − F˜g� ug� ug� ), ∂t ∂x ∂x � � � �� � �� u2g u2g ∂ ∂ θg ρg eg + =− θg ρg ug eg + ∂t 2 ∂x 2 ∂pg − T∗ θg ug − θg ρg (F˜gs ugs ugs us − F˜g� ug� ug� u� ), ∂x
(21) (22)
(23)
and pg = (γ − 1)ρg eg . (24) Here, γ is the heat capacities ratio. The mass and momentum balance equations of the liquid phase occupying the pores of the porous medium, by virtue of equation (13), are respectively: ∂ ∂ (θ� ρ� ) = − (θ� ρ� u� ), ∂t ∂x ∂ ∂p� ∂ (θ� ρ� u� ) = − [θ� ρ� u� u� ] − θ� T ∗ − θ� ρ� F˜�s u�s u�s + θg ρg F˜g� ug� ug� , ∂t ∂x ∂x p� = βp ρ� ,
(25) (26) (27)
where θ� + θg = φ. The mass and momentum balance equations of the solid phase, by virtue of equation (14), are respectively: ∂ ∂ [(1 − φ)ρs ] = − [(1 − φ)ρs us ], ∂t ∂x
(28)
166
D. Levi-Hevroni, A. Levy, G. Ben-Dor and S. Sorek
� ∂ ∂ � ∂ � (1 − φ)ρs u2s [(1 − φ)ρs Vs ] + (τs − Ps ) + ∂t ∂x ∂x ∂S� ∗ ∂ + F˜gs θg ρg ugs ugs + F˜�s θ� ρ� u�s u�s . (29) = −(1 − φT ) pv − φpc ∂x ∂x Finally, the conservation of mass and momentum equations of the solid phase along a particle path are: ∂us Dρ¯s (30) = −ρ¯s Dt ∂Xs and ∂pg Dus ∂σs� = (1 − φT ∗ ) + F˜gs φρg ugs ugs + F˜�s θ� ρ� u�s u�s . (31) + ρ¯s Dt ∂Xs ∂Xs The conservation of mass and momentum equations of the liquid phase along a particle path are: ∂u� Dρ¯� , = −ρ¯� Dt ∂X� Du� ∂p� = −θ� T ∗ − θ� ρ� F˜�s u�s u�s + θg ρg F˜g� ug� ug� . ρ¯� Dt ∂X
(32) (33)
3. The numerical method An upwind TVD shock-capturing scheme, originally developed by Harten (1983), was extended by Levy et al. (1996) to solve the problem of the gas flow, which described the propagation and interaction of waves in saturated porous media. Since, in this scheme, it is difficult to keep track of the porous media interface, as it moves through the Eulerian mesh, a mixed Lagrangian and Eulerian method was developed in order to keep track of the front and still be able to calculate exchange terms between the fluids and the solid phases. The developed numerical scheme is based on an arbitrary Lagrangian Eulerian (ALE) method (for more details see Hint, Amsden & Cook 1974), where the gaseous phase flow fields were predicted with a TVD based numerical scheme and flow fields of both the liquid and the solid phases were predicted using a Lagrangian scheme. 3.1. The TVD-scheme for solving the conservation equations of the gaseous phase The one-dimensional governing equations of the gaseous phase in a conservative vector form were written as follows ∂F ∂U + = Q. (34) ∂t ∂x In this equation the variables vector, U, the flux vector F, and source vector Q, are as follows: ⎡ ⎤ 0 ⎡ ⎤
⎢ ⎥ mg ρ¯g ⎢ T ∗ P ∂θg − ρ¯ (F˜ |v |v + F˜ |v |v ) ⎥ ∗ ¯ ⎦ g gs gs gs g� g� g� ⎢ ⎥. ⎣ U = mg ; F = ug ρ¯g + T P g Q =⎢ ∂x ⎥ ⎣ ⎦ Eg ug (Eg + T ∗ P¯ g ) ∗ ∂θg − ρ¯g (F˜gs |vgs |vgs us + F˜g� |vg� |vg� u� ) ug T P ∂x (35) In these vectors, the macroscopic density and the pressure are ρ¯g = θg ρg and P¯g = θg Pg , respectively. The momentum and the energy are mg = ug ρ¯g and
Interaction of planar shock waves with multiphase porous materials
167
Eg = ρ¯g ( 12 u2g + eg ), respectively, and the relative velocity between the gaseous and the liquid and solid phases, vgα , is defined as vgα = vg − vα . The scheme for solving these conservation equations is � � U n+1 = U nj − λ F¯ j +1/2 − F¯ j −1/2 + t Q j , (36) j where the parameter λ is defined by λ ≡ t/ x and the numerical flux, F¯ j +1/2 , is evaluated from
6 � n� � n � 1� 1 k k β R F U j + F U j +1 − , F¯ j +1/2 = 2 λ k=1 j +1/2 j +1/2
(37)
(38)
where
� � � � βjk+1/2 = Ψ k νjk+1/2 + γjk+1/2 αjk+1/2 − gjk + gjk+1 . The various parameters in the above expression are � � (39) νjk+1/2 = λa k U j +1/2 , �� �� k gi+1 − gik αjk+1/2 , αjk+1/2 �= 0, k (40) γj +1/2 = 0, αjk+1/2 = 0, � � � � � �� ��� � gik = sgn g˜jk+1/2 max 0, min �g˜jk+1/2 �, g˜jk−1/2 sgn g˜jk+1/2 , (41) � � � � �2 � g˜jk+1/2 = 12 Ψ k νjk+1/2 − νjk+1/2 αjk+1/2 , � 2 ⎫ x /4ξ + ξ, |x| < 2ξ, ⎪ ⎪ Ψ (x) = |x|, |x| > 2ξ, ⎬ � (42) 0.1, (∂a k /∂U)Rk �= 0, ⎪ ⎪ ⎭ ξ= 0, (∂a k /∂U)Rk = 0. The eigenvalues, ak , of the Jacobian matrix A(U) = ∂ F/∂U were found symbolically to be, (43) a1 = uˆ g − cˆ g ; a2 = uˆ g ; a1 = uˆ g + cˆ g ; where uˆ g and cˆ g are defined, subsequently, in equation (45). The corresponding right eigenvectors, Rk , were found to be ⎡ ⎡ ⎡ ⎤ ⎤ ⎤ 1 1 1 R1 = ⎣ uˆ g − cˆg ⎦, R2 = ⎣ uˆ g ⎦, R3 = ⎣ uˆ g + cˆg ⎦. (44) 1 2 ˆ g + uˆ g cˆg Hˆ g − uˆ g cˆg H ˆ u 2 g The mean value Jacobian A(U L , UR ) can be expressed in the form (Roe 1981), � � � � ⎫ ug ρ¯1/2 Hg ρ¯1/2 g g ⎪ ˆ , H j +1/2 = ,⎬ uˆ j +1/2 = ρ¯1/2 ρ¯1/2 g g (45) ⎪ � � � ⎭ 1/2 . cˆj +1/2 = (γ − 1) Hˆ j +1/2 + 12 uˆ 2g where �b denotes the arithmetic average of the property b, e.g. �b = 12 (bj + bj +1 ). The parameters αjk+1/2 were obtained by solving the following linear equations U j +1 − U j =
6 � k=1
αjk+1/2 Rkj +1/2 .
168
D. Levi-Hevroni, A. Levy, G. Ben-Dor and S. Sorek
The solution resulted in:
⎫ ¯ − C 1 ; α3 = 12 (C1 + C2 ),⎪ α1 = 12 (C1 − C2 ); α2 = 12 [ρ] ⎪ ⎪ ⎪ ⎪ ⎪ � 1 ⎬ 2 C1 = 2 (γ − 1) [E] + uˆ g [¯ ρ ] − ug [m] , cˆ g ⎪ ⎪ ⎪ ⎪ 1 ⎪ ⎪ ¯ C2 = {[m] − uˆ g [ρ]}, ⎭ cˆ g
(46)
where [b] ≡ bi+1 − bi , and bˆ is the average of the property b inside the interval [xi+1 − xi ]. 3.2. The Lagrangian scheme for solving the balance equations of the solid phase The scheme for solving the balance equations of the solid phase was based on a Lagrangian approach (see Hint et al. 1974; Chan 1975), together with a re-mapping of the solution to the grid of the gaseous phase, in order to calculate the exchange of momentum and energy between the gaseous and the solid phases through the source terms. The conservation of momentum of the solid phase, in mass coordinate, is: ! X(m,t) ! X(m,t) (47) ρ¯s dV = ρ¯s A dXs . ms = X(0,t)
X(0,t)
The conservation of mass for the solid phase is: � � D 1 ∂ms = 0. Dt ρ¯s ∂Xs
(48)
Using the mass coordinate, defined in equation (47), the momentum equation of the solid phase is: ∂S� ∂pv 1 1 Dus ∂(τs − Ps ) − (1 − φT ∗ ) − pc + F˜gs θg ρg ugs ugs + F˜�s θ� ρ� u�s u�s . = Dt ∂ms ∂ms ∂ms ρ¯s ρ¯s (49) The deviator component, τ was calculated from: � � Dτx ∂us 4 ∂us = 2G ˙εx − 13 ˙εx = − = − 43 Gρ¯s . Dt 3 ∂X ∂ms
(50)
The constitutive equation for the flexible porous material (e.g. foam, which in this study means a highly porous medium, porosity > 0.7) was taken from Zaretsky & Ben-Dor (1996). � � � � �n � η η 1 ¯ −B , (51) Ps = 3 E s ηmax − ln 1 − ηmax ηmax where, ρ¯s0 ρ¯s0 , ηmax = 1 − = 1 − (1 − φ) = φ. (52) ρs ρ¯s The macroscopic Young modulus of the foam as given by Gibson & Ashby (1988) is: ¯ s = (1 − φ)2 Es , (53) E where Es is the Young’s modulus of the solid material of which the skeleton of the foam is made. η =1−
169
Interaction of planar shock waves with multiphase porous materials Based on equation (31), the velocity of the solid phase was calculated by, � � tv = un−1/2 − τjn+1/2 − τjn−1/2 + Psjn +1/2 − Psjn −1/2 + qjn+1/2 − qjn−1/2 un+1/2 sj sj
m � � � �
t
t v v n n n − pvj −(1 − φT ∗ )nj pvj S�jn +1/2 − S�jn −1/2 +1/2 − pvj −1/2
m
m � n � n � �
tv ˜ n
tv ˜ n n � � F gs θgj +1/2 ρgj F �s θ�j +1/2 ρ�jn +1/2 �un�sj �uns�j , + n +1/2 ugsj usgj + n ρ¯sj +1/2 ρ¯sj +1/2
(54)
where the deviator component is: n+1 τxj+1/2
=
n τxj+1/2
−
4 Gρ¯n+1 j +1/2 3
n+1/2 un+1/2 sj +1 − usj −1 . mj +1/2
The numerical viscosity in this scheme is given by, � � � n+1 ¯n+1 qjn+1 +1/2 = ρ j +1/2 L aLD − bcsj +1/2 min(0, D), n+1/2 D ≡ un+1/2 sj +1 − usj −1 ,
(55)
(56)
where a and b are the quadric and linear coefficients of the numerical viscosity, and L is a characteristic length. The displacement of the solid phase can be obtained by integrating the velocity, i.e. . Rsjn+1 = Rsjn + tv un+1/2 sj
(57)
3.3. The Lagrangian scheme for solving the balance equations of the liquid phase The numerical scheme that was used to solve the balance equations of the liquid phase was similar to the above scheme used for the solid phase. It should be pointed out here that the difference between the balance equations of the solid phase (equations (30)– (31)) and the liquid phase (equations (32) and (33)) is the deviator stress which was neglected in the momentum equation of the liquid phase. Based on equation (33), the velocity of the liquid phase was calculated by, � � tv = un−1/2 − P�jn +1/2 − P�jn −1/2 + q�jn +1/2 − q�jn −1/2 un+1/2 �j �j
m � n � n � �
t
tv ˜ n v n F g� θgj +1/2 ρgj +1/2 �ug�j �ug�j − n F˜�s θ�jn +1/2 ρ�jn +1/2 �un�sj �uns�j . + n ρ�j +1/2 ρ�j +1/2 3.4. Solution procedure A splitting technique was used to solve the multiphase governing equations of the gaseous, the liquid and the solid phases, which are coupled through the source terms. First, the balance equations of the gaseous phase were solved with the source terms as evaluated using the flow properties at the previous time step. Then, using the same source terms, the balance equations of the liquid and the solid phase were solved. In order to evaluate the next time step, both the fluid and the solid flow field properties were re-meshed into their original mesh, which is compatible with the grid of the gaseous phase. In these compatible meshes the new source terms were evaluated and the solution procedure repeated until the end of the simulation.
170
D. Levi-Hevroni, A. Levy, G. Ben-Dor and S. Sorek Case
Porosity
Relative water content
Relative air content
I II
0.98 0.98
0.10 0.20
0.88 0.78
Table 1. Initial air/water content of the two simulated cases.
4. Results and discussion 4.1. Head-on collision of a planar shock wave with an elastic porous medium saturated with a liquid – a multiphase solution In the following, we first describe the case of a planar shock wave propagating in air and colliding head-on with flexible foam whose pores are uniformly filled with air and water. The developed flow field was obtained by solving the previously mentioned one-dimensional governing equations of the multiphase model, i.e. equations (21) to (29). The numerical solution is based on an Eulerian scheme for the gaseous phase (air) outside and inside the flexible foam and Lagrangian schemes for the solid phase (the foam) and the liquid phases (water) that partially occupies the pores. This approach enables us to describe the back and forth bouncing waves inside the foam and to follow with high resolution the front edge of the foam and the front edge of the water inside it. When investigating experimentally the above phenomenon, there are two major technical obstacles: (i) It is very difficult (perhaps impossible) to have a flexible porous medium whose pores are uniformly saturated with water and air. Introducing water into a porous medium, whose pores are filled with air, and generating a situation in which the water is uniformly distributed inside the pores, and holding this situation stable until an experiment is conducted is a very difficult task, if even possible. (ii) It is very difficult, if even possible, to measure, separately, the properties of the gaseous and the liquid phases inside the porous medium. As a result of these two technical obstacles, to the best of our knowledge, experimental results with which the predictions of our numerical simulations could be compared are unavailable. Consequently, in the following presentation, qualitative results of our simulation will be presented. The results will demonstrate the capability of our simulation to describe the response of an elastic solid phase (flexible foam) saturated with two fluid phases (water and air) to a head-on impact by a planar shock wave. Two representative cases that differ in their water content will be described. The initial conditions regarding the air/water content of these two cases are given in table 1. In both cases a planar incident shock wave propagates, with a velocity equivalent to a Mach number equal to 1.4, in atmospheric air (100 kPa and 300 K) before it collides head-on with the front edge of the flexible polyurethane foam. The properties of the 120 mm long foam were: material density 1300 kg m−3 ; porosity 0.98; Poison ratio 0.45; and Young’s modulus 45 MPa. The geometrical coefficients associated with the medium, namely; the tortuosity factor and the Forchheimer coefficient were assumed to be 0.78 and 500 m−1 , respectively. The foam pores are filled with air and water that are uniformly distributed in the foam pores. While the microscopic density of the water is assumed to be constant, their macroscopic density changes as a result of
Interaction of planar shock waves with multiphase porous materials
171
the change in their relative content in the pores as the porous medium is deformed (i.e. the foam is compressed and the water flows through the pores). Since, as just mentioned, experimental results, with which our simulation results could be compared, are not available, we did not attempt to determine accurately the Forchheimer coefficients for the liquid (water) and the gaseous (air) phases. Alternatively, we adopted the Forchheimer coefficients from Levi-Hevroni et al. (2002) and assigned it both to the water and the air. Some results of the resulting flow fields for cases I and II are presented in figures 1 to 9 and figures 10 to 15, respectively. In the following, the results for each of these two cases will be evaluated separately. Case I: 10 % water and 88 % air content Following the head-on collision of the incident shock wave with the front edge of the foam that is located at x = 0, a shock wave is reflected upstream (see figure 1a) and three waves, one in the gaseous phase, one in the liquid phase and a compaction wave in the solid phase are transmitted downstream into the foam towards the endwall that is located at x = 120 mm. Figures 1, 2 and 3 present the pressure distributions in the gaseous phase and the liquid phase and the effective stress distribution in the solid phase, respectively. The solid and the dashed lines emanating from x = 0 are the trajectories of the front edges of the solid foam and water phase, respectively (see subsequent discussion regarding these fronts). An inspection of these figures indicates that the transmitted wave in the gaseous phase, which reaches the endwall at about 0.62 ms, moves at a velocity of about 195 m s−1 . It is seen to attenuate very quickly to become a very weak wave (see further discussion when figure 4 will be presented). The two other waves, in the liquid and the solid phases, move at almost the same velocity (about 41 m s−1 ) and we cannot distinguish between them. It should be noted here that when running a hypothetical case of a gas (air) having a density of 1 kg m−3 , a liquid having a density of 500 kg m−3 (all the other properties were identical to those of water) and a solid having a density of 2500 kg m−3 (all the other properties were identical to those of foam used in the present study) the three waves were clearly observed. The velocities of the waves in the water and the solid phases were about 40 m s−1 and 56 m s−1 , respectively. Hence, it is possible that owing to the close densities of the water (1000 kg m−3 ) and the foam (1300 kg m−3 ), which were used in the present study, the velocities of these two waves were too close and as a result they could not be distinguished from each other. The fronts of the two waves are seen to reach the endwall at about 3 ms. As a matter of fact these two waves combine to become the compaction wave. The front of the compaction wave is clearly seen in the pressure distribution of the gaseous phase (figure 1), although it is seen to affect the gas pressure only slightly. As will be shown subsequently, the compaction wave is not a sharp narrow wave, but is a band of compressive waves that form a sharp front, which is clearly seen in all the figures. This band of compressive waves is a result of the motion of the foam and the water downstream (see subsequent discussion of figure 10). The transmitted wave in the gaseous phase is clearly seen in figure 4 where the distribution of the gas velocity is shown. The strength of the wave is seen to become smaller as the wave propagates towards the endwall. The wave is so weak that it has, in fact, no influence on the pressure distributions of the liquid and the solid phases (see figures 2 and 3). Upon its collision with the endwall, it reflects upstream and collides head-on with the compaction wave at about x = 50 mm. The reflected wave, which is also very weak, cannot be seen in the pressure distributions of the
172
D. Levi-Hevroni, A. Levy, G. Ben-Dor and S. Sorek
Time (ms)
(a)
P (kPa) 8 7
450
6
400
5
350
4
300
3
250
2
200
1
150
0 –500
100 –400
–300
–200 –100 Length (mm)
0
100 P (kPa)
(b) 8
450
Time (ms)
7 6
400
5
350
4
300
3
250
2
200
1
150 100
0 0
20
40
60 80 Length (mm)
100
120
Figure 1. Pressure distribution of the gaseous phase (air) (a) in the entire flow field, and (b) inside the foam (porosity = 98 %, air content = 88 %, water content = 10 %).
three phases (figures 1 to 3). However, it is seen to impose a slight attenuation of the front edge of the solid (foam) and the liquid phases as it collides head-on with them and reflects back (downstream) as an expansive disturbance (see the change in the trajectories of these fronts in the ranges 10 6 x 6 25 mm and 0.8 6 t 6 1.8 ms. The compaction wave is, in fact, as mentioned above a band of compressive waves with a sharp head and a sharp tail. For convenience, the head and the tail of this
Interaction of planar shock waves with multiphase porous materials
173
PY (kPa)
8
1000 7 900 6
800 700
Time (ms)
5
600 4 500 3
400 300
2
200 1
100 0
0 0
20
40
60 Length (mm)
100
80
Figure 2. Pressure distribution of the liquid phase (water) inside the foam (porosity = 98 %, air content = 88 %, water content = 10 %). σeff (kPa) 8 1000 7 ch3
900
6
800 ct2
Time (ms)
5
700
rh1
600 ct1
4
500
ch2 3
400 300
2
200
ch1 1
100 0
0 0
20
40
60 Length (mm)
80
100
Figure 3. Effective stress distribution of the solid phase (polyurethane) inside the foam (porosity = 98 %, air content = 88 %, water content = 10 %).
compression wave are shown in figure 3 as ch1 and ct1 , respectively. This compression wave reflects head-on from the endwall. The head and tail of the reflected compression are marked, in figure 3 as ch2 and ct2 , respectively. Owing to the impedances when the
174
D. Levi-Hevroni, A. Levy, G. Ben-Dor and S. Sorek ug (m s–1)
8 7
150
6
Time (ms)
5
100
4 50
3 2
0 1 0 0
20
40
60 Length (mm)
80
100
Figure 4. Velocity distribution of the gaseous phase (air) inside the foam (porosity = 98 %, air content = 88 %, water content = 10 %).
reflected compressive disturbance collides with the front edge of the water, it reflects back (downstream) as an rarefaction wave. The head of this rarefaction wave is marked in figure 3 as rh1 . Note that a complex interaction takes place between these reflected compression and rarefaction waves. The trajectories of the front edges of the foam and the water are clear evidence of the compression/rarefaction interaction process. Upon the collision of the transmitted compaction (compression) wave with the solid endwall, which has higher impedance, it is reflected upstream as a reflected compaction (compression) wave that moves towards the front edges of the water and the foam. Figures 1 to 4 indicate that the transmitted compaction (compression) wave induces a downstream movement of both the foam and the water. The front edge of the water that partially (10 %) occupies the pores of the foam is seen to move, at the early stages of the interaction (up to about 2 ms), faster than the front edge of the foam. During these first 2 ms of motion, the wave in the gaseous phase collides head-on with these fronts and slows them down (see the reversal of curvature of these fronts). As a result a water-free zone is evolved. About 2 ms after the interaction started, the water and the foam front edges are seen to move with similar velocities for a time period of about 2 ms during which the width of the water-free zone remains close to constant (about 15 mm). About 4 ms after the interaction started, the head of the reflected compaction (compression) wave collides head-on with the front edges of, first, the water (that precedes the foam) and then the foam. Since the compaction (compression) wave moves in a medium whose impedance is higher than that behind the front edges of the water and the foam, the collision of the compaction (compression) wave with these two fronts, results in two rarefaction waves that converge to a single rarefaction wave that moves downstream towards
Interaction of planar shock waves with multiphase porous materials
175
the endwall. These rarefaction waves reverse the direction of propagation of the two fronts. When the rarefaction wave collides head-on with the endwall, whose impedance is higher, it reflects upstream as a reflected rarefaction wave. When the reflected rarefaction wave collides with the front edge of the water and the foam, behind which the impedances are smaller, it is reflected downstream as a compaction (compression) wave that reverses the direction of propagation of the front edges of the water and the foam once again, and causes a second compression process that is seen to reach the endwall 7.5 ms after the interaction started. The head of this compaction (compression) wave is marked in figure 3 as ch3 . As a result of these back and forth bouncing compression and expansion waves, the pressure at the endwall is seen first to increase during the time interval 0–4.5 ms, then to decrease during the time 4.5–7.5 ms, after which it is seen to increase again (see figures 2 and 3). The maximum deformation of the flexible foam is about 50 % (60/120). This value is much smaller than the 80 % that was obtained by Levi-Hevroni et al. (2002) when a similar case, but without water, was investigated. Not surprisingly, the addition of water, which is highly incompressible, to the foam reduces the compressibility of the entire system. It is important to note that since the water pressure depends on the equation of state that is used for the water inside the porous medium (see equation (27)), the description shown in figure 2 is only qualitative. A more accurate description could be obtained by using a better equation of state. The macroscopic density distribution of the gaseous phase (ρ¯ = θg ρg ) in the entire flow field (−500 mm 6 x 6 120 mm) and inside the foam 0 6 x 6 120 mm is shown in figures 5(a) and 5(b), respectively. Beside the back and forth bouncing compression and expansion waves, the figure reveals the existence of three interfaces (contact regions) that are marked as 1, 2 and 3 in figure 5(a). These three interfaces divide the flow field into four flow zones (see subsequent discussion). The microscopic density distribution of the gaseous phase (ρg ) that was obtained from ρg = ρ¯ /θg is shown in figure 6. The dashed lines marked a to e describe the paths of gas particles which were originally at five different locations. (i) Particle path a represents a gas particle which was originally 8 mm ahead of the foam. As can be seen, the gas particle penetrates into the water-free zone of the foam before emerging from the foam and merging into interface 1. (ii) Particle path b represents a gas particle which was originally located at the foam front. As can be seen, the gas particle penetrated into the wet part of the foam. Following its interaction with the reflected waves, it reversed its direction of propagation, emerged out first into the water-free zone and then from the foam. When the foam reversed its direction of propagation the gas particle re-entered the water-free zone of the foam before emerging once again from the foam. This particle path is part of the interface 2. (iii) Particle paths c and d represent two gas particles which were originally located at 43 and 46 mm, respectively, inside the foam. They are seen to propagate closely together until they reach the region where the water front reversed its direction of propagation. At that point, the two paths split. While particle path c emerged out of the wet zone into the water-free zone where it converged with particle path b, particle path d reversed its direction of propagation and further penetrated into the wet zone. (iv) Particle path e represents a gas particle which was originally located 75 mm from the front edge. This gas particle remained inside the wet zone throughout the entire interaction process.
176
D. Levi-Hevroni, A. Levy, G. Ben-Dor and S. Sorek (a)
θg ρg (kg m–3)
8
3.0
7
Interfaces 2 and 3 left 2.8
Time (ms)
6
2.6 Interface 3 right Interface 3 left
2.4
Split of interface 3
2.2
5 4
2.0 Interface 1
3
1.8 1.6
2
Interface 2 1.4
1
1.2
0 –500
1.0 –400
–300
–200
–100
0
100 θg ρg (kg m–3)
(b) 8
3.0
7
2.8 6
2.6 2.4
Time (ms)
5 Split of interface 3
2.2
4 2.0 3
1.8 1.6
2
1.4 1
1.2 1.0
0 0
20
40
60 Length (mm)
80
100
Figure 5. Macroscopic density distribution of the gaseous phase (air) (a) in the entire flow field, and (b) inside the foam (porosity = 98 %, air content = 88 %, water content = 10 %).
Particle paths a to d divide the entire flow field into four flow zones that are marked as A to D. (i) Zone A represents gas, which was originally outside the foam, then entered it, but never encountered water. (ii) Zone B represents gas, which was originally outside the foam, penetrated into the foam and the wet zone, emerged out and penetrated the foam once again before finally emerging out of it.
Interaction of planar shock waves with multiphase porous materials
177
ρg (kg m–3)
8 7 C
D
3
6
Time (ms)
Interface 3 right
Interface 3 left
5
2.5 Split of interface 3 d
4 A
a
e
c
B
2
3 b
2
C 1.5
Interface 3
1 0 0
20
40 60 Length (mm)
80
100
Figure 6. Microscopic density distribution of the gaseous phase (air) inside the foam (porosity = 98 %, air content = 88 %, water content = 10 %).
(iii) Zone C represents gas that was originally inside the foam and first penetrated deep into the wet zone before emerging out of the wet zone into the water-free zone and then out of the foam. (iv) Zone D represents gas that was originally inside the foam and that never left the wet zone. Note that particle paths c and d describe in fact the location of interface 3, i.e. the contact region between zones C and D. This interface splits into two branches (3-left and 3-right) at about x = 70 mm where the two particle paths separate (figure 6). Particle path c is seen to converge with particle path b and as a result the left-hand branch of the split interface merges with interface 2, while the right-hand branch of the split interface reverses its direction of propagation and further penetrates into the wet zone, as is indicated by particle path d. Note that only one interface was obtained in the water-free flexible foam case, which was investigated by Levi-Hevroni et al. (2002). Its origin was similar to that of the second interface in the present study, i.e. an interface between the gas that was originally outside the foam and the gas that was originally inside the foam and was pushed out of it. Unlike the situation shown in figures 5(a) and 5(b), where the front edge of the foam is seen to overtake the gas that was pushed out of the foam, in the water-free case (see Levi-Hevroni et al. 2002) the front edge of the foam did not interact with the interface. The distribution of the gaseous phase relative content (θg ) inside the foam is shown in figure 7. As mentioned earlier, the gaseous phase relative content is calculated from θg = 1 − θ� − θs , where θ� and θs are the relative contents of the liquid and the solid phases, respectively. Unlike figures 1 and 5, the compaction wave and the waves that result from it owing to its collision with the endwall and the front edge of the foam are clearly seen.
178
D. Levi-Hevroni, A. Levy, G. Ben-Dor and S. Sorek θg
8 7
0.95
6
0.90
Time (ms)
5 0.85 4 0.80 3 0.75
2
0.70
1 0
0
20
40
60 Length (mm)
80
100
Figure 7. Relative content distribution of the gaseous phase (air) inside the foam (porosity = 98 %, air content = 88 %, water content = 10 %). θY ρY (kg m–3)
8 7
250 6 200 Time (ms)
5 4
150
3 100 2 50 1 0
0
20
40
60 Length (mm)
80
100
Figure 8. Macroscopic density distribution of the liquid phase (water) inside the foam (porosity = 98 %, air content = 88 %, water content = 10 %).
The liquid macroscopic density distribution that is shown in figure 8 complements the previous description regarding the gaseous phase. In regions where the water is compressed, the relative content of the gaseous phase decreases, and when the water
Interaction of planar shock waves with multiphase porous materials
179
θs ρs (kg m–3) 8 7
60
6
50
Time (ms)
5 40 4 30 3 20
2
10
1 0
0
20
40
60 Length (mm)
80
100
0
Figure 9. Macroscopic density distribution of the solid phase (polyurethane) inside the foam (porosity = 98 %, air content = 88 %, water content = 10 %).
is decompressed the gaseous phase re-occupies the volume of the pores. The various waves that travel back and forth inside the foam are again seen very clearly in this figure. The foam (solid phase) density distribution, shown in figure 9, is qualitatively similar to the results that were obtained by Levi-Hevroni et al. (2002) who investigated a similar case, but without water. The reason for the similarity is the relatively small amount of water in the presently investigated case. One difference between the present case and the case investigated by Levi-Hevroni et al. (2002) is the maximum deformation of foam, which is smaller, in the present case, because the water that partially fills the pores. Case II: 20 % water and 78 % air content The water relative content in this case was doubled to 20 %, as compared to the case I. Since the foam (solid phase) was identical to that in case I, doubling the water content resulted in the air content being reduced from 88 % to 78 %. The trajectories of the front edges of the foam and the water can be seen in figure 10 in the (x, t)-plane of the pressure distribution in the gaseous phase. The trajectories differ remarkably from those of case I (see e.g. figure 1). Not surprisingly, the larger water content inside the pores of the foam reduces the capability of the foam to be compressed. The maximum deformation reached by the foam is about 17 % as opposed to about 50 % in case I. Recall that an 80 % deformation was obtained by Levi-Hevroni et al. (2002) when a similar case, but without water, was investigated. Similarly, while the water front was compressed about 65 % in case I, where the relative content of the water was smaller and that of the gas larger, it was compressed about 50 % in the present case. Furthermore, unlike case I, where 2 ms after the interaction started, the foam and the water front edges reached a similar velocity and
180
D. Levi-Hevroni, A. Levy, G. Ben-Dor and S. Sorek (a)
P (kPa) 8 650 7
600 550
6
Time (ms)
500 5
450 400
4
350 3
300 250
2
200 1
150
0 –500
–400
–300
–200
0
–100
100 P (kPa)
(b) 8
650 7
600 550
6
500 Time (ms)
5
Reflected compression
450 400
4
350 3 300 2
250 200
1 150 0 0
20
40
60 Length (mm)
80
100
Figure 10. Pressure distribution of the gaseous phase (air) (a) in the entire flow field, and (b) inside the foam (porosity = 98 %, air content = 78 %, water content = 20 %).
the width of the water-free zone remained almost constant for a time period of about 2 ms (see figure 1), now the water front edge is seen to move faster than the foam front edge for about 7 ms, during which the width of the water-free zone increases. After about 7 ms, the two fronts are seen to stop. The width of the water-free zone at this stage is about 30 mm. Unfortunately, the calculation was carried out only for an additional time of 1 ms, during which the location of the two fronts seems to be nearly fixed. In addition, unlike the previous case where a decompression stage was
Interaction of planar shock waves with multiphase porous materials
181
clearly seen, there is no evidence for the existence of rarefaction waves in the present case, at least not until about 8 ms after the interaction started. Similarly to case I, an attenuation of these two fronts, slightly over t = 3 ms, takes place as a result of the head-on collision of the wave that was reflected from the endwall in the gaseous phase. The gaseous pressure distribution in the entire flow field, i.e. outside and inside the foam (−500 mm 6 x 6 120 mm), is shown in figure 10(a) in the (x, t)-plane. The foam front edge was located initially at x = 0 and its rear edge is at x = 120 mm. The incident shock wave is seen to collide head-on with the front edge of the foam. As a consequence, a shock wave is reflected upstream and a compaction (compression) wave (recall that it probably consists of two waves, one in the liquid phase and one in the solid phase) is transmitted into the foam and propagates downstream towards the endwall. Unlike case I where the velocity of the compaction wave was close to being constant and equal to about 41 m s−1 now the compaction wave is seen to experience a very strong attenuation. Its velocity reduces from about 40 m s−1 at the beginning of the interaction to about 23 m s−1 at the time when it reaches the endwall. This strong attenuation is probably a direct result of the larger water content. As a result of this attenuation, the head of the reflected compaction wave is less pronounced in this case than in case I (compare figures 10b and 1a). When describing case I, it was mentioned that the compaction wave is not a sharp wave, but a band of compressive waves. This can be seen in figure 10 where three clear converging compressive waves are marked. These compressive waves are seen to converge toward the point where the front edges of the foam and the water are stopped. These fronts are, in fact, stopped by the rarefaction wave that will be formed as a result of the head-on collision of the compression wave with these fronts. As expected, the pressure inside the foam is seen first to increase owing to the back and forth motion of the incident and reflected compaction (compression) waves, then the pressure is slightly decreased owing to the back and forth motion of the incident and reflected rarefaction waves, before it rises again owing to a new cycle of back and forth moving compaction (compression) waves. An enlargement of the flow field inside the foam is shown in figure 10(b). This figure reveals that there is a numerical noise in the vicinity of the front edge of the water. Between the front edges of the foam and the water, i.e. in the water-free zone, the relative content of the gaseous phase is 98 %. Immediately downstream of the front edge of the water, i.e. in the domain inside which there is water, there is a sudden drop in the relative content of the gaseous phase to values smaller than 78 % (recall that 78 % is the pre-shocked relative content of the gaseous phase, table 1). This step decrease in the relative content of the gaseous phase is, most probably, the cause for the numerical noise. Because in case I the step decrease in the relative content of the gaseous phase was much smaller (from 98 % to a value smaller than 88 %), the numerical noise was hardly noticeable there. The numerical noise could have been eliminated by smearing the jump over a few cells, as in the case of artificial viscosity. However, this will disperse the water front edge in the gas phase and might influence its movement and the interaction between the phases. Since we are dealing with a qualitative description of the flow field we did not explore this possibility. The macroscopic density distribution of the gaseous phase (¯ ρ = θg ρg ) in the entire flow field (−500 mm 6 x 6 120 mm) and inside the foam 0 6 x 6 120 mm is shown in figures 11(a) and 11(b), respectively. It is again seen (figure 11b) that the gaseous phase density field is not continuous. This is a direct result of the back and forth movement of the water phase inside the foam, which compresses and decompresses the
182
D. Levi-Hevroni, A. Levy, G. Ben-Dor and S. Sorek (a)
θg ρg (kg m–3)
8 7
3.0
6
Time (ms)
2.5 5 4
2.0
3 1.5 2 1
1.0
0 –500
–400
–300
–200
–100
0
100 θg ρg (kg m–3)
(b) 8 7
3.0
6 2.5 Time (ms)
5 4
2.0
3 1.5 2 1
1.0
0 0
20
40
60 Length (mm)
80
100
Figure 11. Macroscopic density distribution of the gaseous phase (air) (a) in the entire flow field and (b) inside the foam (porosity = 98 %, air content = 78 %, water content = 20 %).
gas occupying the pores. Unlike the previous case in which the gas that was originally inside the foam was pushed out of it, and the first interface, which separates the gases that were originally outside and inside the foam, was located upstream of the front edge of the foam (see figure 5b), here the interface is seen to be located inside the foam in the water-free zone (see figure 11b). Recall that in the water-free flexible foam case, which was investigated by Levi-Hevroni et al. (2002), the interface between the gas that was originally outside the foam, the gas that was originally inside the foam and
Interaction of planar shock waves with multiphase porous materials
183
θY ρY (kg m–3)
8
400
7
350 6 300 Time (ms)
5 250 4 200 3 150 2
100
1 0
50
0
20
40
60 Length (mm)
80
100
Figure 12. Macroscopic density distribution of the liquid phase (water) inside the foam (porosity = 98 %, air content = 78 %, water content = 20 %).
was pushed out of the foam, propagated much further upstream. The second interface, which was mentioned when case I was presented, is also noticeable. However, unlike case I where it was seen to split as a result of and after the interaction with the reflected compaction wave, such a split is not seen in the figure. This could be either because the interaction with the reflected compaction wave starts at about t = 7 ms while the computation ends about 1 ms later and as result the split which occurs later is not seen, or because of the lower intensity of the interaction that results from the weaker reflected compaction (compression) wave. The liquid macroscopic density distribution is shown in figure 12. The relative content of the liquid phase (water) is seen to reach values of about 50 %, which implies that the relative content of the gaseous phase (air) is about 48 %. Hence, across the front edge of the water, the relative content of the gaseous phase drops sharply from 98 % (at the water-free zone) to 48 %. This sharp drop introduces the numerical noise into the calculations. The foam (solid phase) macroscopic density distribution is shown in figure 13. Since, owing to the relatively high content of the liquid phase the deformation of the foam is relatively small, there are relatively small changes in the macroscopic density of the foam. However, it seems to be higher at the water-free zone. This is due to the higher compressibility of the pores with the air than the pores with the water–air mixture. The water pressure and the effective stress distributions are shown in figures 14 and 15. The description here is only qualitative since we do not have the proper equation of state for the water inside the porous medium. In general, we can see the compression wave propagating upstream towards the endwall, and then pressure and stress releases by waves reflected at the front edge of the liquid phase.
184
D. Levi-Hevroni, A. Levy, G. Ben-Dor and S. Sorek θs ρs (kg m–3) 8 30
Time (ms)
7 6
25
5
20
4 15 3 10 2 5
1 0
0 0
20
40
60 Length (mm)
80
100
Figure 13. Macroscopic density distribution of the solid phase (polyurethane) inside the foam (porosity = 98 %, air content = 78 %, water content = 20 %). ρY (kPa)
8
400 7 350 6 300
Time (ms)
5 250 4 200 3
150
2
100
1
50
0
0
20
40
60 Length (mm)
80
100
Figure 14. Pressure distribution of the liquid phase (water) inside the foam (porosity = 98 %, air content = 78 %, water content = 20 %).
5. Summary and conclusions The three-dimensional governing equations of the flow field which is developed when an elasto-plastic flexible open-cell porous medium, capable of undergoing extremely
Interaction of planar shock waves with multiphase porous materials
185
σeff (kPa) 8
450
7
400 350
6
300 Time (ms)
5 250 4 200 3 150 2
100
1 0
50
0
20
40
60 Length (mm)
80
100
0
Figure 15. Effective stress distribution of the solid phase (polyurethane) inside the foam (porosity = 98 %, air content = 78 %, water content = 20 %).
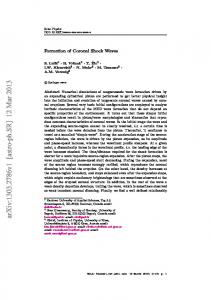
large deformations, whose pores are uniformly filled with liquid and gas, is struck head-on by a planar shock wave, were developed using a multiphase approach. The one-dimensional version of these equations was solved numerically using an ALE based numerical code. Air and water were used as the gaseous and the liquid phases, respectively. Two cases, which differ only by the initial relative contents of the liquid and the gaseous phases, were solved. In the first case, the water initial relative content was 10 % (and that of the gas 88 %) while in the second one it was 20 % (and that of the gas 78 %). Based on the results presented by Levi-Hevroni et al. (2002) who studied the situation of a water-free porous medium and the two cases investigated in the course of the present study, water relative contents of 10 % and 20 %, it is clear that the foam becomes less compressible as the water content inside it increases. In the water-free case, the maximum deformation of the polyurethane foam was about 80 %, but it reduced to about 50 % when the relative water content was increased to 10 % and to about 17 % when the relative water content was increased to 20 %. This can be seen in figure 16 where the three trajectories are shown. Points A in this figure mark the location at which the reflected wave, in the gaseous phase, collided head-on with the foam front edge, and points B mark the location where the head of the reflected compaction wave collided head-on with the foam front edge. While the first collision slowed down the interface, the second one reversed its direction of propagation (note that in the water-free case, point A cannot be detected since the foam front edge is moving very fast and the slight slow-down is unnoticeable. The numerical results revealed that the gaseous phase flow field depends directly on the liquid phase flow field. When the liquid phase is compressed, the gaseous phase expands into the pores that are evacuated by the liquid.
186
D. Levi-Hevroni, A. Levy, G. Ben-Dor and S. Sorek 8 B 7
Endwall
6
Time (ms)
5 B 4
θY = 0 %
10 %
20 % A
3 2 B 1 0
A
0
20
40
60 Length (mm)
80
100
120
Figure 16. Trajectories of the front edges of the foam for the two cases that were investigated in this study (water contents of 10 % and 20 %) and the water-free case that was investigated by Levi-Hevroni et al. (2002).
The macroscopic compressibility of the gaseous phase was composed of the microscopic compressibility of the gas and from the change in the relative content of the gaseous phase inside the pores. In general, the solution of the governing equations resulted in macroscopic properties, which are the average of the microscopic properties inside the representative elementary volume. The microscopic densities of the gaseous phase could be derived, indirectly, by dividing the calculated macroscopic density by the gaseous phase relative content. With the aid of this quantity, it was possible to isolate the influence of the changes in the relative content of the gaseous phase, which resulted from the motion of the liquid phase, from the changes in the microscopic density of the gas. Reducing the relative content of the gaseous phase in the medium as a result of the motion of the liquid resulted in a decrease in the macroscopic density of the gaseous phase. However, the microscopic density of the gaseous phase increased because the same mass of gas occupied a smaller volume of the pores. The numerical results clearly illustrate the capability of the developed numerical code to describe in detail the very complex flow field that is imposed when a planar shock wave collides head-on with a porous medium whose pores are filled with gaseous and liquid phases. In order to obtain a more accurate description of the flow field, we must revise the equation of state of the water phase (perhaps use the Tait’s equation of state) and design an experiment by which some of the parameters that were used in the simulation, such as the Forchheimer constants of the liquid and the gaseous phases, could be measured. The numerical-simulation results also imply that investigating situations in which the relative content of the liquid phase is larger than 20 % could be redundant, since beyond this value the polyurethane foam loses its flexibility and, as a result, the
Interaction of planar shock waves with multiphase porous materials
187
foam will hardly deform and, in fact, it will probably behave like a liquid-saturate closed-cell porous material. Finally, it should be noted once again that the present study complements our earlier study in which we solved, using an ALE based numerical code, the one-dimensional governing equations of the flow field, which is developed when an elasto-plastic opencell flexible porous medium, capable of undergoing extremely large deformations, whose pores are saturated with gas only, is struck head-on by a planar shock wave.
REFERENCES Baer, M. R. 1988 Numerical studies of dynamic compaction of inert and energetic granular materials. ASME E: Trans. J. Appl. Mech. 55, 36–43. Baer, M. R. & Nunziato, J. W. 1986 A two-phase mixture theory for the deflagration to detonation transition (DDT) in reactive granular materials. Intl J. Multiphase Flow 12, 861–889. Bear, J. & Bachmat, Y. 1990 Introduction to Modeling of Transport Phenomena in Porous Media. Kluwer. Bear, J. & Sorek, S. 1990 Evolution of governing mass and momentum balances following an abrupt pressure impact in porous medium. Transport Porous Media 5, 169–185. Bear, J., Sorek, S., Ben-Dor, G. & Mazor, G. 1992 Displacement waves in saturated thermoelastic porous media. I. Basic equations. Fluid Dyn. Res. 9, 155–164. Biot, M. A. 1956 Theory of propagation of elastic waves in fluid-saturated porous solid. J. Acoust. Soc. Am. 28, 168–191. Chan, R. K. C. 1975 A generalized arbitrary Lagrangian–Eulerian method for incompressible flows with sharp interfaces. J. Comput. Phys. 17, 311–331. Corapcioglu, M. Y. 1991 Wave propagation in porous media – A review. In Transport Processes in Porous Media (ed. J. Bear & M. Y. Corapcioglu), pp. 373–469. Kluwer. Degrande, G. & de Roeck, G. 1992 FFT-based spectral analysis methodology for one-dimensional wave propagation in poroelastic media. Transport Porous Media 9, 85–97. Gibson, L. J. & Ashby, M. F. 1988 Cellular Solids – Structure and Properties. Pergamon. van der Grinten, J. G. M., Smith, M. A., van der Kogel, H. & van Dongen, M. E. H. 1988 Shock induced wave propagation in and reflection from porous column partially saturated with water. In Shock Tube and Waves (ed. H. Gronig), pp. 357–362. VCH Verlagsgesellschaft mbH, Weinheim, Germany. Harten, A. 1983 High resolution schemes for hyperbolic conservation laws. J. Comput. Phys. 49, 357–393. Hint, C. W., Amsden, A. A. & Cook, J. L. 1974 An arbitrary Lagrangian–Eulerian coupling method for all flow speeds. J. Comput. Phys. 14, 227–253. Levi-Hevroni, D. 2000 Non linear wave propagation in multi phase porous media. PhD thesis, Dept Mech. Engng Faculty Engng Sci., Ben-Gurion University Negev, Beer-Sheva, Israel (in Hebrew). Levi-Hevroni, D., Levy, A., Ben-Dor, G. & Sorek, S. 2002 Numerical investigation of the propagation of planar shock waves in saturated flexible porous materials: development of the computer code and comparison with experimental results. J. Fluid Mech. 462, 285–306. Levy, A., Sorek, S., Ben-Dor, G. & Bear, J. 1995 Evolution of the balance equations in saturated thermoelastic porous media following abrupt simultaneous changes in pressure and temperature. Transport Porous Media 21, 241–268. Levy, A., Ben-Dor, G. & Sorek, S. 1996 Numerical investigation of the propagation of shock waves in rigid porous materials: development of the computer code and comparison with experimental results. J. Fluid Mech. 324, 163–179. Nigmatulin, R. I. & Gubaidulin, A. A. 1992 Linear waves in saturated porous media. Transport Porous Media 9, 135–142. Nikolaevskij, V. M. 1990 Mechanics of Porous and Fractured Media. World Scientifc. Roe, P. L. 1981 Approximate Riemann solvers, parameter vectors and difference schemes. J. Comput. Phys. 43, 357–372.
188
D. Levi-Hevroni, A. Levy, G. Ben-Dor and S. Sorek
Smeulders, D. M. J., de La Rosette, S. P. M. & van Dongen, M. E. H. 1992 Waves in partially saturated porous media. Transport Porous Media 9, 25–37. Sorek, S., Bear, J., Ben-Dor, G. & Mazor, G. 1992 Shock waves in saturated thermoelastic porous media. Transport Porous Media 9, 3–13. Terzaghi, K. 1925 Erdbauechanic auf Bodenphysikalische Grundlage. Franz Deuticke, Leipzing, Germany. Zaretsky, E. & Ben-Dor, G. 1996 Thermodynamic law of corresponding shock states in flexible polymeric foams. Trans. ASME J. Engng Mat. Technol. 118, 493–502.