The Journal of Rheumatology The Lectin Pathway of Complement Activation in Patients with Systemic Lupus Erythematosus Anne Troldborg, Steffen Thiel, Marten Trendelenburg, Justa Friebus-Kardash, Josephine Nehring, Rudi Steffensen, Søren Werner Karlskov Hansen, Magdalena Janina Laska, Bent Deleuran, Jens Christian Jensenius, Anne Voss and Kristian Stengaard-Pedersen DOI: 10.3899/jrheum.171033 http://www.jrheum.org/content/early/2018/06/11/jrheum.171033 1. Sign up for TOCs and other alerts http://www.jrheum.org/alerts 2. Information on Subscriptions http://jrheum.com/faq 3. Information on permissions/orders of reprints http://jrheum.com/reprints_permissions The Journal of Rheumatology is a monthly international serial edited by Earl D. Silverman featuring research articles on clinical subjects from scientists working in rheumatology and related fields.
Downloaded from www.jrheum.org on June 18, 2018 - Published by The Journal of Rheumatology
The Lectin Pathway of Complement Activation in Patients with Systemic Lupus Erythematosus
Anne Troldborg, Steffen Thiel, Marten Trendelenburg, Justa Friebus-Kardash, Josephine Nehring, Rudi Steffensen, Søren Werner Karlskov Hansen, Magdalena Janina Laska, Bent Deleuran, Jens Christian Jensenius, Anne Voss, and Kristian Stengaard-Pedersen ABSTRACT. Objective. The pathogenesis of systemic lupus erythematosus (SLE) involves complement activation. Activation of complement through the classical pathway (CP) is well established. However, complement activation through pattern recognition not only happens through the CP, but also through the lectin pathway (LP). We investigated the hypothesis that the LP is activated in SLE and involved in the pathogenesis of the disease. Methods. Using immunoassays developed in-house, we measured concentrations of LP proteins in a cohort of 372 patients with SLE and 170 controls. We estimated complement activation measuring total C3, and investigated whether LP protein concentrations were associated with complement activation and disease activity. Protein changes and disease activity over time were assessed in a cohort of 52 patients with SLE followed with repeated samples over a 5-year period. Results. Concentrations of LP proteins in SLE were altered compared with controls. The differences observed in LP proteins associated with complement activation were reflected by a decrease in total C3. The pattern recognition molecules (M-ficolin, CL-L1, and CL-K1), the serine protease (MASP-3), and the associated protein (MAp19) displayed a negative correlation with disease activity. Changes in MASP-2 concentrations over time correlated significantly with increased disease activity. Association between active proteinuria and serum concentration was observed for MASP-3 and MAp19. Conclusion. In patients with SLE, we measured specific changes in LP proteins that are associated with complement activation and disease activity, indicating that the LP is activated in patients with SLE. These novel findings substantiate the involvement of the LP in SLE. (J Rheumatol First Release June 15 2018; doi:10.3899/jrheum.171033) Key Indexing Terms: SYSTEMIC LUPUS ERYTHEMATOSUS COMPLEMENT ACTIVATION
From the Department of Rheumatology, Aarhus University Hospital; Institute of Clinical Medicine, and Department of Biomedicine, Aarhus University, Aarhus; Department of Clinical Immunology, Aalborg University Hospital, Aalborg; Department of Cancer and Inflammation Research, University of Southern Denmark; Department of Rheumatology, Odense University Hospital, Odense, Denmark; Division of Internal Medicine and Department of Biomedicine, University Hospital Basel, University of Basel, Basel, Switzerland. Supported by the Danish Rheumatism Association (grant number R122-A3031), and Aase and Ejnar Danielsens Foundation. A. Troldborg, MD, PhD, Department of Rheumatology, Aarhus University Hospital, and Institute of Clinical Medicine, Aarhus University; S. Thiel, PhD, Professor, Department of Biomedicine, Aarhus University; M. Trendelenburg, PhD, Professor, Division of Internal Medicine and Department of Biomedicine, University Hospital Basel, University of Basel; J. Friebus-Kardash, MD, Division of Internal Medicine and Department of Biomedicine, University Hospital Basel, University of Basel; J. Nehring, MD, Division of Internal Medicine and Department of Biomedicine, University Hospital Basel, University of Basel; R. Steffensen, PhD, Department of Clinical Immunology, Aalborg University Hospital; S.W. Hansen, PhD, Associate Professor, Department of Cancer and Inflammation Research, University of Southern Denmark; M.J. Laska, PhD, Associate Professor, Institute of Clinical Medicine, Aarhus University, and Division of Internal Medicine and Department of Biomedicine, University Hospital Basel, University of Basel; B. Deleuran, PhD, Professor, Department of Rheumatology, Aarhus University
COMPLEMENT SYSTEM
LECTIN PATHWAY INNATE IMMUNITY
Hospital, and Department of Biomedicine, Aarhus University; J.C. Jensenius, PhD, Professor, Department of Biomedicine, Aarhus University; A. Voss, MD, PhD, Department of Rheumatology, Odense University Hospital; K. Stengaard-Pedersen, PhD, Professor, Department of Rheumatology, Aarhus University Hospital, and Institute of Clinical Medicine, Aarhus University. Address correspondence to Dr. A. Troldborg, Department of Rheumatology Center for Cancer and Inflammation, Aarhus University Hospital, Noerrebrogade 44, Building 3, Aarhus, Denmark. E-mail:
[email protected] Accepted for publication February 28, 2018.
Systemic lupus erythematosus (SLE) is a disabling and potentially deadly disease. Multiple cytokines, signaling pathways, and immune cells are dysregulated in SLE. The complement system is known to be a part of the pathogenesis of SLE1. Unwarranted activation of the system, tissue deposition of complement activation products, and deficiencies of early components of the complement system are associated with the disease2,3. Initiation of complement activation proceeds through 3 pathways: the classical (CP), the alternative (AP), and the lectin pathway (LP)4. Complement activation through the CP
Personal non-commercial use only. The Journal of Rheumatology Copyright © 2018. All rights reserved.
Troldborg, et al: Lectin pathway in SLE
Downloaded from www.jrheum.org on June 18, 2018 - Published by The Journal of Rheumatology
1
is triggered when the C1 complex binds to one of its ligands, i.e., antibodies or apoptotic cells5. Deficiency of the C1-complex (C1q, C1r, or C1s) is strongly associated with the development of SLE6. On the other hand, this deficiency may not in itself precipitate the disease, because there are about 20% of C1q-deficient people who do not develop any SLE-related symptoms7. A similar picture is seen for C4 and C2. Deficiencies of both C4 or C2 are associated with SLE8, but there is a requirement for the presence of other disease-modifying genes or environmental factors to initiate the potential autoimmune consequences of the deficiencies9. Similar to CP activation, LP activation proceeds through pattern recognition10. The pattern recognition molecules (PRM) are associated with serine proteases (SP), which are activated upon binding of the PRM to their ligands11. Five different PRM can activate the complement system through the LP: Mannan binding lectin (MBL), M-ficolin (ficolin-1), L-ficolin (ficolin-2), H-ficolin (ficolin-3), and CL-LK10. The SP are called MBL-associated serine proteases 1, 2, and 3 (MASP-1, MASP-2, and MASP-3). In addition, the 2 proteins MAp44 (MAp1) and MAp19 (MAp2) are associated with the PRM10. Activation of all 3 complement pathways leads to the cleavage and activation of C34. Only a few studies have addressed the LP proteins in relation to complement activation and disease activity in SLE. In a pilot study of 58 patients with SLE, we demonstrated that plasma concentrations of several of the proteins of the LP are altered compared with healthy individuals12,13. A metaanalysis on mutations leading to MBL deficiency showed an increased risk of the disease in deficient individuals14. High H-ficolin concentrations were observed in patients with SLE15,16 and low M-ficolin concentrations16. Conflicting results regarding L-ficolin have been published in 3 studies12,16,17. Excessive production of autoantibodies is characteristic for SLE18, and antibodies toward complement proteins have also been described19,20. In some cases, this leads to an acquired deficiency state, with symptoms similar to what is seen in the genetic deficiencies3. Antibodies against H-ficolin were recently described in association with SLE nephritis21. The paradox of deficiency and hyperactivation of the complement system in patients with SLE has left both clinicians and scientists perplexed. Nevertheless, the importance of the complement system in SLE was underlined in 2012 when hypocomplementemia was included in the classification criteria of the disease22. Measurement of low total C3 is widely used in the clinical setting as an indicator of disease activity and is part of the disease activity score SLEDAI (Systemic Lupus Erythematosus Disease Activity Index)23. The aim of the present study was to investigate whether LP proteins are associated with SLE diseases activity and manifestations by measuring the concentrations of the 11 LP proteins in patients with SLE and comparing these to the concentrations in healthy controls. Because activation of the 2
complement system leads to cleavage of C3, and low C3 is associated with disease activity in SLE, we used decreased total C3 as an indicator of complement activation and disease activity, and evaluated whether low C3 was associated with the observed differences in LP protein concentrations. Finally, we investigated whether LP protein concentrations changed over time with disease activity in samples taken consecutively from patients with SLE. MATERIALS AND METHODS
Study populations. Patients with SLE followed at the outpatient clinic of the Department of Rheumatology, Aarhus University Hospital (n = 169) were consecutively included from October 2015 to August 2016. Inclusion criteria were (1) age ≥ 18 and (2) fulfillment of the 1997 revised American College of Rheumatology classification criteria for SLE. Exclusion criteria were (1) incapacitation, (2) inabililty to understand Danish, (3) clinical and biochemical signs of infection, and (4) ongoing treatment for cancer or infection. All patients had blood drawn at inclusion for research purposes and standard laboratory analysis. Further, clinical data were recorded at the same time. Blood samples were collected in EDTA-plasma tubes (8 ml, Alere Inc. #367525) and serum tubes (10 ml, Alere Inc. #367896), centrifuged for 10 min at 2000 g, and serum/plasma immediately collected, aliquoted, and frozen at –80°C. Patients with SLE at the outpatient clinic of Odense University Hospital were included in a research biobank after written and oral consent in 2010 and 2011 (n = 203), as previously described24. Patients with SLE from Switzerland (n = 52) were all included at the University Hospital Basel, Switzerland, in the period 2011–2016 as part of the Swiss Systemic Lupus Erythematosus Cohort Study (SSCS)25. Inclusion of healthy controls (n = 170), from a cohort of healthy blood donors, for the study has been described elsewhere26. Assays for LP proteins. All assays measuring LP proteins were developed in-house and protocols have previously been published. Details of the assays for MBL27, CL-L128, CL-K129, M-ficolin30, H-ficolin31, MASP-126, MASP-332, MAp4432, MASP-233, and MAp1934 can be found in the respective references. Plasma concentration of L-ficolin was measured using a commercial ELISA (Hycult Biotech #HK336-02). Measurements of complement activation by quantifying C3 were performed using a time-resolved immunofluorometric assay (TRIFMA), also developed in-house. In brief, EDTA plasma samples were prediluted 1:4 in tris-buffered saline (TBS; 10 mM Tris, 145 mM NaCl, pH 7.4). Wells were coated with rabbit anti-human C3 (DAKO #Q0368, 1 µg/ml TBS), recognizing the C3c part of the protein thus measuring C3, C3(H2O), C3b, and iC3b. The test samples (EDTA plasma) were diluted to a total 750,000-fold in TBS/Tw, 5 mM EDTA. After overnight incubation at 4°C, the plates were developed with the same antibody but now biotinylated (1 µg/ml TBS/Tween). DNA preparation, PCR, and DNA sequencing. DNA from peripheral blood mononuclear cells from 3 patients with SLE were extracted using the Maxwell16 Blood DNA kit on the Maxwell16 Instrument (Promega). Samples 1 and 2 were from H-ficolin–deficient patients and sample 3 was from the mother of patient 1. A fragment of 366 bp of FCN3 exon 5, covering the frame shift mutation FCN3+1637delC (rs532781899)35 was amplified by PCR using primers 5ʹ-ggc caa gat cct ccc caca-3ʹ and 5ʹ-tct ggt ggg ttc tgg ctcc-3ʹ. PCR amplifications were carried out in 50-μl volumes containing ~50 ng genomic DNA, 0.5 mM of each primer, 1× PCR buffer II, 2.5 mM MgCl2, 0.2 mM dNTP, and 0.75 units of AmpliTaq DNA polymerase (Invitrogen Life Technologies). The PCR reactions were performed at 5m94°C, 35 cycles (30s94°C, 30s62°C, 30s72°C), 5m72°C. After cleanup by FlashGel Recovery System (Lonza Inc.), the fragment was sequenced in both directions using the ABI BigDye cycle sequencing
Personal non-commercial use only. The Journal of Rheumatology Copyright © 2018. All rights reserved.
The Journal of Rheumatology 2018; 45:doi:10.3899/jrheum.171033
Downloaded from www.jrheum.org on June 18, 2018 - Published by The Journal of Rheumatology
terminator kit, V 1.1 (Applied Biosystems). PCR amplifications were carried out in 20-μl volumes at 1m96°C, 25 cycles (10s96°C, 5s50°C, 4m60°C). The PCR products were purified with BigDye XTerminator purification (Applied Biosystems) and sequence analysis was performed on an ABI Prism 3500 Genetic Analyzer (Applied Biosystems). Alignment of resulting DNA sequence was carried out using CLC main workbench software.
Statistical analysis. Data on protein concentrations were assessed for approximation to normal distribution. Concentrations of CL-L1, CL-K1, and MAp19 were normally distributed. Thus, parametric tests were used when appropriate. Logarithmic transformation of the remaining protein concentrations, except for MBL, yielded approximation to normality, hence log-transformed values and parametric tests were used for analysis. MBL displayed extreme skewness regardless of transformation because of the large number of deficient individuals. Therefore, nonparametric tests were used. Comparing protein concentrations were done by regression analysis, t test, and Mann-Whitney U test. For correlation analysis, Pearson correlation coefficient and the nonparametric Spearman rank correlation were used. For the analysis of consecutive patient samples, we used a mixed model for repeated measurements with the exponential covariance structure for between-time variation (or residuals). We evaluated the relationship between protein concentration and disease activity score (SLEDAI). The relation was best described when protein concentrations were analyzed on the logarithm scale, thus results are presented after back-transforming into the original scale. Comparisons between SLEDAI scores are presented as ratios. Model assumptions were checked by visual assessment of the residuals and the fitted values. Exceptionally, log-transformed MBL was analyzed with the variance function that varies as the power of the fitted values (using R).
When considering adjustment for multiple testing, the Holm-Bonferroni method was used36. All statistical analyses were performed in Stata12 (StataCorp). Figures were made in GraphPad Prism version 6 (Graph Pad Software). P values < 0.05 were considered statistically significant.
Ethics. The project was performed according to the Helsinki Declaration. The Danish Data Protection Agency and the Central Denmark Region Committees on Health Research Ethics approved the study conducted in Aarhus (#1-10-72-214-13). The Southern Denmark Region Committees on Health Research Ethics approved the inclusion of patients in Odense (#2010 0015). The Ethical committee of Northwest and Central Switzerland approved the inclusion of the Swiss SLE population (EKNZ Ref. no. EK 262/06).
RESULTS Patient populations and controls. The Danish patient cohort (n = 372) represents a typical white SLE cohort with 88% female, an average age of 34.8 years at diagnosis, 33.9% having kidney affection, and 99% being antinuclear antibody–positive (Table 1). Among the Danish patients, 62% were treated with hydroxychloroquine (HCQ) and about half of the patients received a supplement of prednisolone. Controls were all white (100%), with an average age of 36 years (18–66) and a sex distribution of 12% male and 88% female. Danish patients were included at 2 sites and were
Table 1. SLE patient demographics. Values are % unless otherwise specified. Characteristics
No. patients Age at inclusion, yrs, mean (SD) Age at diagnosis, yrs, mean (SD) Female sex Ethnicity: white ACR criteria (cumulative) No. ACR criteria, mean (SD) Malar rash (ACR1) Discoid lupus (ACR2) Photosensitivity (ACR3) Oral/nasal ulcers (ACR4) Arthritis (ACR5) Serositis (ACR6) Nephritis (ACR7) CNS (ACR8) Hematological (ACR9) Immunological (ACR10) ANA (ACR11) Clinical and biochemical data at time of inclusion SLEDAI at inclusion, mean (SD) SLICC, mean (SD) Proteinurea > 0.5 g/day Antiphospholipid syndrome Treatment at time of inclusion Hydroxychloroquine treatment Prednisolone treatment Other immunosuppressives*
Danish
372 46.7 (14.6) 34.8 (14.5) 88 97 5.9 (1.5) 57.5 5.4 63.0 33.2 88.7 39.1 33.9 12.7 71.2 87.9 99.2
3.1 (3.07) 1.3 (2.34) 8.3 28.5 62.5 54.2 42.5
Swiss
52 42 (13) 32 (11) 84 90
5.4 (1.2) 50.0 4.8 23.8 26.2 90.5 23.8 59.5 9.5 71.4 88.1 92.9
4.5 (4.5) NA 11.9 NA 85.7 50.0 47.6
* Includes methotrexate, azathioprine, mycophenolate, rituximab, belimumab, cyclophosphamide, and tacrolimus. SLE: systemic lupus erythematosus; ACR: American College of Rheumatology; CNS: central nervous system; ANA: antinuclear antibody; SLEDAI: Systemic Lupus Erythematosus Disease Activity Index; SLICC: Systemic Lupus International Collaborating Clinics; NA: not applicable.
Personal non-commercial use only. The Journal of Rheumatology Copyright © 2018. All rights reserved.
Troldborg, et al: Lectin pathway in SLE
Downloaded from www.jrheum.org on June 18, 2018 - Published by The Journal of Rheumatology
3
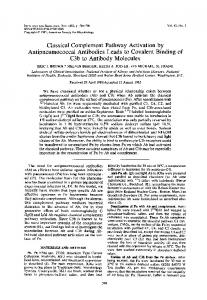
found comparable clinically and regarding LP proteins (Supplementary Table 1, available with the online version of this article). The patients from the Swiss SLE cohort study (SSCS) recruited in Basel/CH were generally similar to the Danish cohort except for having a higher number of patients with kidney affection (59.5% vs 33.9%) and a larger number of patients being treated with HCQ (85.7% vs 62.5%). The data reflect the typical heterogeneity of SLE cohorts. Concentrations of LP proteins are altered in patients with SLE compared to healthy controls. Higher concentrations of L-ficolin, H-ficolin, MASP-3, MAp44, and MASP-2 were found in patients with SLE (p < 0.001 for all proteins; Table 2). M-ficolin, CL-L1, CL-K1, and MAp19 concentrations were lower in patients (p = 0.003, < 0.001, < 0.001, and 0.001, respectively). No significant differences were observed between median concentration in serum of MASP-1 and MBL of patients with SLE compared to healthy controls. We observed no difference in number of MBL-deficient people between patients and controls based on serum measurements with deficiency set at 100 ng/ml (15% vs 13%, p = 0.44). Complement activation is associated with a changed LP protein profile in patients with SLE. Total C3 concentration generally falls with complement activation and C3 correlated with a modified SLEDAI (SLEDAI without points for hypocomplementemia). Thus, low C3 was used as a general marker of complement activation and high disease activity. Based on C3 measurements, patients were dichotomized into 2 groups (C3 cutoff of 0.90 mg/ml, the lower normal limit for C3 at the University Hospital of Aarhus based on an ethnic Danish healthy population and standardized against reference material BCR470/CRM470 from the Institute for Reference Materials and Measurements). The LP proteins in which a difference had been observed between patients and controls were assessed and compared. LP protein concentrations were generally lower in patients with lowest C3 levels,
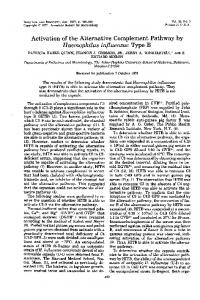
although not all statistically significant, particularly when adjusting for multiple testing (Figure 1). The most pronounced difference was observed for M-ficolin and MAp19 (both p < 0.001). Disease activity, disease manifestations, and activation of the LP. M-ficolin, CL-L1, CL-K1, MASP-3, and MAp19 showed a significant negative correlation with disease activity (SLEDAI; Figure 2A). The difference in serum (or plasma) concentrations when comparing LP proteins in patients who had never had kidney affection versus patients who at some point had kidney affection (Supplementary Figure 1, available with the online version of this article) revealed differences regarding CL-K1 (p = 0.023) and MASP-3 (p = 0.045). When adjusting for multiple testing, the results were not statistically significant. MASP-3 and CL-K1 concentrations were lower in patients with nephritis. When looking at patients with active proteinuria, MAp19 concentration displayed a significant difference, with higher concentrations in the patients with active proteinuria (p = 0.05; data not shown). C3 concentrations correlated with most of the LP proteins (Figure 2B). A particularly strong correlation was seen between M-ficolin and C3. M-ficolin also displayed a significant positive correlation to both C-reactive protein, leukocyte, and neutrophil count (Supplementary Figure 2, available with the online version of this article). Further, patients without organ damage [Systemic Lupus International Collaborating Clinics (SLICC) = 0] had lower concentrations of M-ficolin than patients with organ damage (SLICC > 0; p = 0.005). The serum concentration of M-ficolin, CL-L1, CL-K1, MASP-1, and MASP-3 in patients with positive anti-dsDNA was significantly lower than in patients negative for anti-dsDNA (p = 0.05, 0.01, 0.01, 0.002, and 0.03, respectively; data not shown). LP protein concentrations over time. A model based on
Table 2. Lectin pathway protein concentrations in serum of 372 patients with SLE and 170 healthy controls. Values are mg/ml (range) unless otherwise specified. Lectin Pathway Proteins
MBL M-ficolin L-ficolin* H-ficolin CL-L1 CL-K1 MASP-1 MASP-3 MAp44 MASP-2 MAp19
Patients with SLE, n = 372, Median Serum Concentration 1.634 (0–9.976) 2.387 (0.528–7.297) 3.125 (0.281–9.355) 44.05 (0.332–166.7) 0.466 (0.254–0.745) 0.469 (0.276–0.815) 10.73 (2.944–38.75) 7.287 (2.750–22.29) 2.436 (1.053–8.674) 0.545 (0.065–3.612) 0.366 (0.100–0.990)
Controls, n = 170, Median Serum Concentration 1.342 (0–10.080) 2.563 (1.063–7.627) 2.432 (0.982–4.307) 35.380 (7.469–96.11) 0.491 (0.348–0.743) 0.505 (0.203–0.727) 11.350 (3.512–21.66) 6.344 (1.702–14.16) 2.251 (1.185–4.532) 0.391 (0.051–1.592) 0.404 (0.139–0.859)
p
0.600 0.003 < 0.001 0.001 < 0.001 < 0.001 0.594 < 0.001 < 0.001 < 0.001 0.001
* L-ficolin concentrations were measured only in patients for whom EDTA plasma was available (n = 169). SLE: systemic lupus erythematosus; MBL: mannan binding lectin.
4
Personal non-commercial use only. The Journal of Rheumatology Copyright © 2018. All rights reserved.
The Journal of Rheumatology 2018; 45:doi:10.3899/jrheum.171033
Downloaded from www.jrheum.org on June 18, 2018 - Published by The Journal of Rheumatology
Figure 1. Difference in LP protein concentrations based on disease activity and complement activation. Panels demonstrate LP protein concentrations in patients with high versus low disease activity based on a C3 cutoff at 0.90 mg/ml. LP: lectin pathway.
repeated protein measurements, SLEDAI, and time was established to assess correlation of protein concentration with disease activity (SLEDAI). MASP-3 decreased with increasing SLEDAI (Figure 3), but only the increase in MASP-2 concentration with SLEDAI was significant. When comparing MASP-2 concentration at SLEDAI 0 and SLEDAI 6, MASP-2 concentration increased with 7.4% (95% CI 0.1–15.2%).
Treatment influence on protein concentrations. Overall, very little effect on LP protein concentrations was observed based on treatment (Supplementary Figure 3, available with the online version of this article). H-ficolin deficiency. Two patients with SLE (1 Swiss and 1 Danish) were found to be H-ficolin-deficient based on 3 independent measurements. The Swiss patient was found homozygous for the frameshift mutation leading to complete
Personal non-commercial use only. The Journal of Rheumatology Copyright © 2018. All rights reserved.
Troldborg, et al: Lectin pathway in SLE
Downloaded from www.jrheum.org on June 18, 2018 - Published by The Journal of Rheumatology
5
Figure 2. LP proteins and disease manifestations in SLE. A. Correlation between SLEDAI and the LP proteins. B. Associations between LP proteins and the central protein of complement activation, C3. * L-ficolin concentrations were measured only in patients for whom EDTA plasma was available (n = 169). LP: lectin pathway; SLEDAI: Systemic Lupus Erythematosus Disease Activity Index; MBL: mannan binding lectin.
Figure 3. SLEDAI correlation to LP protein concentrations based on a mixed model of repeated measurements taking SLEDAI, protein concentration, and time into consideration. Panels show LP protein concentrations in relation to SLEDAI based on consecutive samples from 52 Swiss patients with SLE. SLEDAI: Systemic Lupus Erythematosus Disease Activity Index; LP: lectin pathway; SLE: systemic lupus erythematosus. 6
Personal non-commercial use only. The Journal of Rheumatology Copyright © 2018. All rights reserved.
The Journal of Rheumatology 2018; 45:doi:10.3899/jrheum.171033
Downloaded from www.jrheum.org on June 18, 2018 - Published by The Journal of Rheumatology
H-ficolin deficiency (1637delC). The mother of the Swiss patient was also diagnosed with SLE and was found heterozygous, with a serum concentration about 50% below the median H-ficolin concentration for patients with SLE (18 µg/ml vs 44 µg/ml). The Danish H-ficolin-deficient patient did not carry 1637delC.
DISCUSSION We observed that concentrations in serum of LP proteins in a large primarily white cohort were different compared to healthy controls. We demonstrated that a decreased C3 level, implying complement activation and consumption of C3, could explain some of the differences observed in LP proteins between patients and controls. This indicates that the LP is activated in patients with SLE. Most LP proteins correlated with C3 concentrations and several also with SLEDAI. Finally, we found 2 H-ficolin-deficient patients with SLE, one of whom carried the frameshift mutation 1637delC. Several studies on smaller cohorts have implicated involvement of the LP in SLE, but varying results have made interpretations difficult. In our study, we have investigated all proteins of the LP collectively in a large SLE cohort. We found that differences in LP protein concentrations in the patients with SLE were associated with low C3, implying complement activation, i.e., consumption of C3, supporting the LP involvement in the pathogenic mechanism of SLE. The pathogenic involvement of the PRM of the LP in SLE is further supported by the demonstration of MBL and L-ficolin in kidney and skin biopsies from patients with SLE37,38. Lower concentrations of complement factors support a theory of consumption of the proteins in relation to surface activation, which would deplete the proteins from the circulation39. Indeed, most of the PRM of the LP have been described to bind apoptotic or nuclear material10. However, some proteins were generally found in higher concentrations in patients than in controls, a finding that at first glance does not support the theory of consumption. Thus, we found H-ficolin, L-ficolin, MASP-2, MASP-3, and MAp44 to be, on average, higher in patients with SLE. A high protein concentration may derive from compensatory mechanisms of upregulation of the LP PRM that bind to apoptotic cells and thus are cleared. H-ficolin concentrations were high in patients with SLE in 3 independent studies12,15,16. The suggestion that, on the one hand, a higher concentration may indicate increased production of PRM, and on the other hand, a total lack of a protein may mediate symptoms, concords well with what is observed in C1q deficiency. Possibly, it is the same in the rare cases of complete H-ficolin deficiency that have been described in the literature. The finding of another patient with H-ficolin deficiency with homozygosity for the FCN3+1637delC (rs532781899) variation, adding case number 7 to the world literature, adds to the complexity of complement deficiencies in SLE. So far, 3 out of 7 H-ficolin-deficient individuals have developed SLE. Only 1
H-ficolin-deficient person has been described without any disease at all40. Unlike the other PRM, the mutation leading to the H-ficolin-deficient state is the same in all reported cases41. Studies on L-ficolin in SLE have revealed conflicting results12,16,17. The first results17, however, were obtained using serum, which was later shown unsuitable for L-ficolin measurements42. In our present study, using plasma, we found elevated levels of L-ficolin in patients with SLE. Recently, Tanha, et al demonstrated increased risk of nephritis in patients with low L-ficolin levels43. We were not able to reproduce this finding in our present study. We found M-ficolin concentrations to be low in patients with SLE and especially in patients with active disease. This was also true when adjusting for neutrophil count. M-ficolin is primarily produced in leukocytes and is found in vacuoles in both monocytes and neutrophils44. Implications of excessive NETosis in SLE have been described45. NETosis is a phenomenon normally seen in relation to infections, and complement activation is involved in the stimulation of neutrophils46. Both MASP-2 and MASP-3 concentrations in the serum of patients were higher than in controls. MASP-2 is the effector enzyme of the LP that, after activation by MASP-1, initiates the cleavage of C4, leading to the formation of the C3 convertase of the LP11. The function of MASP-3 in relation to the LP is not clear. However, it has been noted that MASP-3 cleaves pro-factor D to factor D, thereby enabling the activation of the AP47,48. A priori, it is a disadvantage for a patient with SLE to have high concentrations of the SP, because this may increase the capacity for complement activation. In patients with nephritis, we observed lower concentrations of MASP-3 than in patients without nephritis, confirming our previous findings13, and the development over time in relation to SLEDAI also showed a decrease in concentration with higher disease activity. The correlation of MASP-3 to both SLEDAI and C3 suggests that lower MASP-3 concentration is due to consumption, which is in agreement with the AP amplification loop being active in patients with high disease activity, and perhaps particularly in patients with nephritis. MAp44 concentrations were observed higher and MAp19 lower in patients with SLE. Low concentrations of MAp19 were associated with active proteinuria. The literature suggests competitive binding of MASP, MAp44, and MAp19 to the PRM because they share the same binding motifs10. Competitive inhibition has been demonstrated in vitro49,50. However, the question remains whether inhibition is the main physiological function. The opposite findings in our present study regarding MAp44 and MAp19 certainly indicate that the functions of these 2 proteins are not necessarily the same. When assessing for protein development over time in relation to SLEDAI, the optimal cohort would have been with a greater variability in disease activity. It was also clear that
Personal non-commercial use only. The Journal of Rheumatology Copyright © 2018. All rights reserved.
Troldborg, et al: Lectin pathway in SLE
Downloaded from www.jrheum.org on June 18, 2018 - Published by The Journal of Rheumatology
7
concentrations were significantly dependent on time (Supplementary Figure 4, available with the online version of this article), even though no consistent correlation was seen between concentration and sampling year. It was not possible to determine the exact cause or direction of the influence of time on protein concentration, but it is possible that the handling of samples could have had an influence. Further, in our studies, we analyzed for several correlations between the data for each individual protein and between LP proteins and clinical manifestations. Thus, the potential pitfalls of multiple testing and Type 1 errors exist. Although there is no consensus on whether to adjust for multiple testing in an investigative study, it must be kept in mind when interpreting our results. In general, the LP protein concentrations vary extensively between individuals26, which we also found to be true in our SLE cohort. And although we observed significant concentration differences between patients and controls, correlation of several proteins to disease activity, and fluctuations over time associated with disease activity, the wide range for the LP proteins makes their use as biomarkers questionable at this point. We illustrate that concentrations in serum of the LP proteins are altered in patients with SLE compared to healthy individuals, and that a lowered C3 level, denoting complement activation and high disease activity, is associated with the differences observed. This could indicate that the LP is activated in patients with SLE. Finally, we demonstrate association of LP proteins to disease activity and organ damage. Our novel findings substantiate the involvement of the LP of the complement system in SLE. ACKNOWLEDGMENT
We are grateful to all patients participating in the project. We thank The Swiss Systemic Lupus Erythematosus Cohort Study (SSCS) for collaboration and for sharing its experience in establishing its extensive cohort prior to initiation of our project.
ONLINE SUPPLEMENT
Supplementary material accompanies the online version of this article.
REFERENCES
1. Elliott JA Jr, Mathieson DR. Complement in disseminated (systemic) lupus erythematosus. AMA Arch Derm Syphilol 1953;68:119-28. 2. Pickering MC, Botto M, Taylor PR, Lachmann PJ, Walport MJ. Systemic lupus erythematosus, complement deficiency, and apoptosis. Adv Immunol 2000;76:227-324. 3. Leffler J, Bengtsson AA, Blom AM. The complement system in systemic lupus erythematosus: an update. Ann Rheum Dis 2014;73:1601-6. 4. Merle NS, Church SE, Fremeaux-Bacchi V, Roumenina LT. Complement system part I - molecular mechanisms of activation and regulation. Front Immunol 2015;6:262. 5. Mortensen SA, Sander B, Jensen RK, Pedersen JS, Golas MM, Jensenius JC, et al. Structure and activation of C1, the complex initiating the classical pathway of the complement cascade. Proc Natl Acad Sci U S A 2017;114:986-91.
8
6. Mitchell DA, Pickering MC, Warren J, Fossati-Jimack L, Cortes-Hernandez J, Cook HT, et al. C1q deficiency and autoimmunity: the effects of genetic background on disease expression. J Immunol 2002;168:2538-43. 7. Stegert M, Bock M, Trendelenburg M. Clinical presentation of human C1q deficiency: how much of a lupus? Mol Immunol 2015;67:3-11. 8. Meyer O, Hauptmann G, Tappeiner G, Ochs HD, Mascart-Lemone F. Genetic deficiency of C4, C2 or C1q and lupus syndromes. Association with anti-Ro (SS-A) antibodies. Clin Exp Immunol 1985;62:678-84. 9. Walport MJ. Complement and systemic lupus erythematosus. Arthritis Res 2002;4 Suppl 3:S279-93. 10. Kjaer TR, Thiel S, Andersen GR. Toward a structure-based comprehension of the lectin pathway of complement. Mol Immunol 2013;56:222-31. 11. Kjaer TR, Le le TM, Pedersen JS, Sander B, Golas MM, Jensenius JC, et al. Structural insights into the initiating complex of the lectin pathway of complement activation. Structure 2015;23:342-51. 12. Troldborg A, Thiel S, Jensen L, Hansen S, Laska MJ, Deleuran B, et al. Collectin liver 1 and collectin kidney 1 and other complement-associated pattern recognition molecules in systemic lupus erythematosus. Clin Exp Immunol 2015;182:132-8. 13. Troldborg A, Thiel S, Laska MJ, Deleuran B, Jensenius JC, Stengaard-Pedersen K. Levels in plasma of the serine proteases and associated proteins of the lectin pathway are altered in patients with systemic lupus erythematosus. J Rheumatol 2015;42:948-51. 14. Lee YH, Lee HS, Choi SJ, Ji JD, Song GG. The association between the mannose-binding lectin codon 54 polymorphism and systemic lupus erythematosus: a meta-analysis update. Mol Biol Rep 2012;39:5569-74. 15. Andersen T, Munthe-Fog L, Garred P, Jacobsen S. Serum levels of ficolin-3 (Hakata antigen) in patients with systemic lupus erythematosus. J Rheumatol 2009;36:757-9. 16. Hein E, Nielsen LA, Nielsen CT, Munthe-Fog L, Skjoedt MO, Jacobsen S, et al. Ficolins and the lectin pathway of complement in patients with systemic lupus erythematosus. Mol Immunol 2015;63:209-14. 17. Watanabe H, Saito R, Asano T, Sato S, Iwadate H, Kobayashi H, et al. Serum L-ficolin levels in patients with systemic lupus erythematosus. Mod Rheumatol 2012;22:899-902. 18. Han S, Zhuang H, Shumyak S, Yang L, Reeves WH. Mechanisms of autoantibody production in systemic lupus erythematosus. Front Immunol 2015;6:228. 19. Dragon-Durey MA, Blanc C, Marinozzi MC, van Schaarenburg RA, Trouw LA. Autoantibodies against complement components and functional consequences. Mol Immunol 2013;56:213-21. 20. Bock M, Heijnen I, Trendelenburg M. Anti-C1q antibodies as a follow-up marker in SLE patients. PLoS One 2015;10:e0123572. 21. Plawecki M, Lheritier E, Clavarino G, Jourde-Chiche N, Ouili S, Paul S, et al. Association between the presence of autoantibodies targeting ficolin-3 and active nephritis in patients with systemic lupus erythematosus. PLoS One 2016;11:e0160879. 22. Petri M, Orbai AM, Alarcón GS, Gordon C, Merrill JT, Fortin PR, et al. Derivation and validation of the Systemic Lupus International Collaborating Clinics classification criteria for systemic lupus erythematosus. Arthritis Rheum 2012;64:2677-86. 23. Bombardier C, Gladman DD, Urowitz MB, Caron D, Chang CH. Derivation of the SLEDAI. A disease activity index for lupus patients. The Committee on Prognosis Studies in SLE. Arthritis Rheum 1992;35:630-40. 24. Voss A, Green A, Junker P. Systemic lupus erythematosus in Denmark: clinical and epidemiological characterization of a county-based cohort. Scand J Rheumatol 1998;27:98-105. 25. Ribi C, Trendelenburg M, Gayet-Ageron A, Cohen C, Dayer E,
Personal non-commercial use only. The Journal of Rheumatology Copyright © 2018. All rights reserved.
The Journal of Rheumatology 2018; 45:doi:10.3899/jrheum.171033
Downloaded from www.jrheum.org on June 18, 2018 - Published by The Journal of Rheumatology
26. 27. 28. 29. 30. 31. 32. 33. 34. 35. 36.
37. 38.
Eisenberger U, et al. The Swiss Systemic lupus erythematosus Cohort Study (SSCS) - cross-sectional analysis of clinical characteristics and treatments across different medical disciplines in Switzerland. Swiss Med Wkly 2014;144:w13990. Troldborg A, Hansen A, Hansen SW, Jensenius JC, Stengaard-Pedersen K, Thiel S. Lectin complement pathway proteins in healthy individuals. Clin Exp Immunol 2017; 188:138-47. Thiel S, Møller-Kristensen M, Jensen L, Jensenius JC. Assays for the functional activity of the mannan-binding lectin pathway of complement activation. Immunobiology 2002;205:446-54. Axelgaard E, Jensen L, Dyrlund TF, Nielsen HJ, Enghild JJ, Thiel S, et al. Investigations on collectin liver 1. J Biol Chem 2013;288:23407-20. Selman L, Henriksen ML, Brandt J, Palarasah Y, Waters A, Beales PL, et al. An enzyme-linked immunosorbent assay (ELISA) for quantification of human collectin 11 (CL-11, CL-K1). J Immunol Methods 2012;375:182-8. Wittenborn T, Thiel S, Jensen L, Nielsen HJ, Jensenius JC. Characteristics and biological variations of M-ficolin, a pattern recognition molecule, in plasma. J Innate Immun 2010;2:167-80. Krarup A, Sørensen UB, Matsushita M, Jensenius JC, Thiel S. Effect of capsulation of opportunistic pathogenic bacteria on binding of the pattern recognition molecules mannan-binding lectin, L-ficolin, and H-ficolin. Infect Immun 2005;73:1052-60. Degn SE, Jensen L, Gál P, Dobó J, Holmvad SH, Jensenius JC, et al. Biological variations of MASP-3 and MAp44, two splice products of the MASP1 gene involved in regulation of the complement system. J Immunol Methods 2010;361:37-50. Møller-Kristensen M, Jensenius JC, Jensen L, Thielens N, Rossi V, Arlaud G, et al. Levels of mannan-binding lectin-associated serine protease-2 in healthy individuals. J Immunol Methods 2003;282:159-67. Degn SE, Thiel S, Nielsen O, Hansen AG, Steffensen R, Jensenius JC. MAp19, the alternative splice product of the MASP2 gene. J Immunol Methods 2011;373:89-101. Munthe-Fog L, Hummelshøj T, Honoré C, Madsen HO, Permin H, Garred P. Immunodeficiency associated with FCN3 mutation and ficolin-3 deficiency. N Engl J Med 2009;360:2637-44. Holm S. A simple sequentially rejective multiple test procedure. Scand J Stat 1979;6:65-70. Wallim LR, Nisihara R, Skare T, Mocelin V, Messias-Reason IJ. Mannose binding lectin deposition in skin of lupus erythematosus patients: a case series. Human Immunology 2014;75:629-32. Nisihara RM, Magrini F, Mocelin V, Messias-Reason IJ. Deposition
39.
40. 41. 42. 43. 44. 45.
46.
47.
48.
49. 50.
of the lectin pathway of complement in renal biopsies of lupus nephritis patients. Hum Immunol 2013;74:907-10. Truedsson L, Bengtsson AA, Sturfelt G. Complement deficiencies and systemic lupus erythematosus. Autoimmunity 2007;40:560-6. Metzger ML, Michelfelder I, Goldacker S, Melkaoui K, Litzman J, Guzman D, et al. Low ficolin-2 levels in common variable immunodeficiency patients with bronchiectasis. Clin Exp Immunol 2015;179:256-64. Michalski M, Świerzko AS, Pągowska-Klimek I, Niemir ZI, Mazerant K, Domżalska-Popadiuk I, et al. Primary ficolin-3 deficiency—Is it associated with increased susceptibility to infections? Immunobiology 2015;220:711-3. Hein E, Bay JT, Munthe-Fog L, Garred P. Ficolin-2 reveals different analytical and biological properties dependent on different sample handling procedures. Mol Immunol 2013;56:406-12. Tanha N, Pilely K, Faurschou M, Garred P, Jacobsen S. Plasma ficolin levels and risk of nephritis in Danish patients with systemic lupus erythematosus. Clin Rheumatol 2017;36:335-41. Kjaer TR, Hansen AG, Sørensen UB, Nielsen O, Thiel S, Jensenius JC. Investigations on the pattern recognition molecule M-ficolin: quantitative aspects of bacterial binding and leukocyte association. J Leukoc Biol 2011;90:425-37. Yu Y, Su K. Neutrophil extracellular traps and systemic lupus erythematosus. J Clin Cell Immunol 2013;4:139. Gupta S, Kaplan MJ. The role of neutrophils and NETosis in autoimmune and renal diseases. Nat Rev Nephrol 2016;12:402-13. Dobó J, Szakács D, Oroszlán G, Kortvely E, Kiss B, Boros E, et al. MASP-3 is the exclusive pro-factor D activator in resting blood: the lectin and the alternative complement pathways are fundamentally linked. Sci Rep 2016;6:31877. Pihl R, Jensen L, Hansen AG, Thøgersen IB, Andres S, Dagnæs-Hansen F, et al. Analysis of factor D isoforms in Malpuech-Michels-Mingarelli-Carnevale patients highlights the role of MASP-3 as a maturase in the alternative pathway of complement. J Immunol 2017 Aug 9 (E-pub ahead of print). Nordmaj MA, Munthe-Fog L, Hein E, Skjoedt MO, Garred P. Genetically engineered fusion of MAP-1 and factor H domains 1-5 generates a potent dual upstream inhibitor of both the lectin and alternative complement pathways. FASEB J 2015;29:4945-55. Degn SE, Hansen AG, Steffensen R, Jacobsen C, Jensenius JC, Thiel S. MAp44, a human protein associated with pattern recognition molecules of the complement system and regulating the lectin pathway of complement activation. J Immunol 2009;183:7371-8.
Personal non-commercial use only. The Journal of Rheumatology Copyright © 2018. All rights reserved.
Troldborg, et al: Lectin pathway in SLE
Downloaded from www.jrheum.org on June 18, 2018 - Published by The Journal of Rheumatology
9