Jun 30, 2011 - Thailand, Tunisia, Turkey, Ukraine, Uruguay, Venezuela, and Vietnam. ...... List price is the price printed on the books, set by publishers. The list ...
Fundación Telefónica
Information and Communication Technology (ICT) is a dominant and pervasive part of modern life. We talk, Tweet, and text on smart phones; work, shop, and entertain ourselves on the Internet; and eagerly await the next big thing, whether it’s hardware or software, that will emerge from the innovative minds of engineers and designers around the world. ICT drives corporate growth, the global distribution of jobs, and the value of investments. Technology also spurs competition. There is no question that ICT, like steam power and electricity before it, is a fundamental force behind global change.
The Linked World:
How ICT is transforming societies, cultures and economies Executive Editor Bart van Ark
While The Linked World may not provide all the answers concerning the impact of ICT on our daily lives, we do believe that it will lead to better measurements, more extensive analyses, more knowledgeable recommendations for action, and, ultimately, to more effective policies that can best extract the amazing potential for human betterment that is embodied in technology.
The Linked World
This study identifies how recent developments in Information and Communication Technology have driven improvements in living standards and made changes in social and cultural developments around the world. It also identifies ways in which government policy, business strategy, and consumer behavior can encourage or constrain the realization of technology’s full potential.
Report
Fundación Telefónica
13
Fundación Telefónica
Fundación
TICyPRODUCT_ingles_i_x_001_230.indb 1
30/6/11 16:53:03
Published by Ariel and Fundación Telefónica, in collaboration with Editorial Planeta, who does not necessarily share the views expressed in it. All contents are the sole responsibility of their authors. © Fundación Telefónica, 2011 Gran Vía, 28 28013 Madrid (España) © Editorial Ariel, S.A., 2011 Avda. Diagonal, 662-664 08034 Barcelona (España) © �of the texts: The Conference Board 845 Third Avenue, New York, New York 10022 © of the cover: Getty Images Editorial coordination of Fundación Telefónica: Rosa María Sáinz Peña First printing: ??? ISBN: 978-84-08-10461-2 Legal Deposit: ...??? Printed: ??? Printed in Spain The paper used in this book is one hundred percent free of chlorine and it is a certified ecological paper.
All rights reserved. No part of this book may be reproduced or transmitted in any form by any means, electronic, mechanical, photocopying, recording, or otherwise, without prior witten permission of the publisher. For information on getting permission for reprints or excerpts contact CEDRO (The Spanish Centre of Reprographic Rights) at its website www. conciencialimpia.com or on the phone numbers 0034 91 702 19 70 / 93 272 04 47 Violation of these rights may constitute a criminal action against Intelectual Property (Section 270 of Spanish Criminal Code)
http://www.fundacion.telefonica.com/debateyconocimiento/publicaciones/index.htm More information about the project in: www.ictlinkedworld.com.
TICyPRODUCT_ingles_i_x_001_230.indb 2
30/6/11 16:53:03
The linked world: how ICT is transforming societies, cultures and economies
colección. Fundación Telefónica
TICyPRODUCT_ingles_i_x_001_230.indb 3
30/6/11 16:53:04
TICyPRODUCT_ingles_i_x_001_230.indb 4
30/6/11 16:53:05
Index Contributors.................................................................................................................................................................................................................................................................................................................................................................................................................................................�
VII
Foreword...............................................................................................................................................................................................................................................................................................................................................................................................................................................................�
IX
Part I. Introduction
�
1
�
7
1 Measuring the Contribution of ICT to Economic Growth.....................................................................................................................................................................................................................................� Bart van Ark, Abhay Gupta, Abdul Azeez Erumban
9
2 The Global Broadband Bonus: Broadband Internet’s Impact on Seven Countries...............................................................................................................................� Shane Greenstein, Ryan McDevitt
35
3 Who Captures the Benefits of ICT? The Case of Digital Books..................................................................................................................................................................................................................� Janet Hao, Randall Weiss
53
4 The Impact of ICT on the Geographic Distribution of Employment..........................................................................................................................................................................................� Vlad Manole, Randall Weiss
67
5 Measuring the Impact of ICT on Public-Sector Performance.......................................................................................................................................................................................................................� Robbin te Velde
79
6 Measuring the Impact of ICT on Health Care........................................................................................................................................................................................................................................................................................� Robbin te Velde, Jesse Bos, Reg Brennenraedts
89
. .................................................................................................................................................................................................................................................................................................................................................................................
Part II. The Impact of ICT on the Production of Goods and Services
..................................................................................................
Part III. The Impact of ICT on Society and Culture
� 115
...........................................................................................................................................................................................................
7 Paying Attention to Society and Culture...........................................................................................................................................................................................................................................................................................................� 117 Katherine Schinasi, Ivy Schultz 8 The Long Tail of Digital Exclusion: A Comparison Between the United Kingdom and Chile. ....................................................................................� 135 Ellen J. Helsper, Sergio Godoy-Etcheverry 9 Mobile Communication and Social Capital in the Republic of Korea and the United States: How Usage Patterns Predict Social, Civic, and Political Involvement...........................................................................................................................................................................................................................................� 163 Scott W. Campbell, Nojin Kwak, Richard Ling 10 Measuring the Impact of ICT on Education...............................................................................................................................................................................................................................................................................................� 183 Cor-Jan Jager, Jesse Bos, Robbin te Velde
Part IV. The Impact of Public and Regulatory Policy on ICT-Sector Performance
� 205
..........................
11 The Impact of Public and Regulatory Policy on ICT-Sector Performance.......................................................................................................................................................................� 207 Raul L. Katz
TICyPRODUCT_ingles_i_x_001_230.indb 5
30/6/11 16:53:05
TICyPRODUCT_ingles_i_x_001_230.indb 6
30/6/11 16:53:05
Contributors Editors Bart van Ark Bart van Ark is Senior Vice President and Chief Economist at The Conference Board. Randall Weiss Randall Weiss is Managing Director of Economic Research at The Conference Board. Katherine Schinasi Katherine Schinasi is a Senior Advisor to The Conference Board.
Contributors Jesse Bos Jesse Bos is a Researcher at Dialogic Innovation & Interaction. Reg Brennenreadts Reg Brennenreadts is a Senior Researcher at Dialogic Innovation & Interaction. Scott W. Campbell Scott W. Campbell is an Associate Professor of Communication Studies and Pohs Fellow of Telecommunications at the University of Michigan. Abdul Azeez Erumban Abdul Azeez Erumban is an Assistant Professor in the Department of Economics and Business at the University of Groningen in the Netherlands. Shane Greenstein Shane Greenstein is the Elinor and Wendell Hobbs Professor of Management and Strategy at the Kellogg School of Management, Northwestern University. Abhay Gupta Abhay Gupta is an Economic Analyst at MITACS research network in Vancouver, Canada, and was formerly an Economist at The Conference Board. Sergio Godoy-Etcheverry Sergio Godoy is Head of Research & Postgraduate Studies at Universidad Catolica de Chileís School of Communications. Janet Hao Janet Hao is an Economist at The Conference Board. Ellen Helsper Ellen Helsper is a Lecturer in the Media and Communications Department of the London School of Economics and Political Science.
TICyPRODUCT_ingles_i_x_001_230.indb 7
30/6/11 16:53:05
Cor-Jan Jager Cor-Jan Jager is a Researcher at Dialogic Innovation & Interaction. Raul L. Katz Raul L. Katz is Director of Business Strategy Research at the Columbia Institute for Tele Information and an Adjunct Professor in the Finance and Economics Division at Columbia Business School. Nojin Kwak Nojin Kwak is an Associate Professor of Communication Studies and Director for the Nam Center for Korean Studies at the University of Michigan. Richard Ling Richard Ling is a full Professor at the IT University of Copenhagen in Denmark, an Adjunct Research Scientist at the University of Michigan, and a Sociologist at the Telenor Research Institute in Norway. Vlad Manole Vlad Manole is an Assistant Professor of Economics at Rutgers University and was formerly a Senior Economist at The Conference Board. Ryan McDevitt Ryan McDevitt is an Assistant Professor of Economics and Strategy at the Simon Graduate School of Business, University of Rochester. Ivy Shultz Ivy Schultz is a Program Manager at Columbia University, where she works with the Center for Technology, Innovation, and Community Engagement and the Institute for Tele Information. Robbin te Velde Robbin te Velde is Principal Researcher at Dialogic Innovation & Interaction.
TICyPRODUCT_ingles_i_x_001_230.indb 8
30/6/11 16:53:05
Foreword
I
nformation and communication technology (ICT) has decisively established itself as a general purpose technology–one that affects an entire economy. Over the past four decades, ICT has spurred dramatic changes, and these changes will continue for the foreseeable future. Harder to predict, though, is the exact nature of those changes, and how they will play out. There are increasing signs that ICT’s impact goes well beyond the economy. It is essentially transforming our society and the way human beings interact in social and cultural relationships, as well as in economic ones. This notion formed the basic motivation for embarking on this study, which the Telefonica Foundation agreed to underwrite in 2008. The purpose of The Linked World is to take stock of our knowledge on what the economic, social, and cultural impacts of ICT will be. How has it evolved, how much have we been able to quantify or to evaluate in a qualitative sense, and what does it mean for the challenges and opportunities ahead? This book is not a futuristic study, that pinpoints the main technological and innovative trends and tries to tell the reader what the next big thing will be. It is up to investors and entrepreneurs in the ICT industry to make their own market assessments and consumer demand and to identify their own business opportunities. Rather, the chapters in this book provide guidance to what businesses, governments, and other organizations can do to help drive the next wave of benefits that ICT will bring. The Linked World is the result of a two-year research project led by The Conference Board. It builds on previous work by The Conference Board on the impact of ICT on economic performance. With this book, our interest has widened to involve 21 researchers from around the world who have contributed their expertise, and for that we thank them. We have benefited greatly not only from their expertise in their respective fields, but also from their participation in our joint research meetings and their willingness to amend their contributions to strengthen the coherence of this study. We are grateful to the Telefonica Foundation for underwriting this study, and also for their helpful input at different stages of the project. We thank the Telefonica team, especially Beatriz Gutierrez Garcia, who has been the key liaison between Telefonica and The Conference Board team and whose input has contributed significantly to the project. Francisco Blanco Bermudez, Diego Molano Vega, Jose de la Pena, and Sonia Fernandez Espina also provided valuable insights. We benefited from the feedback and input of our Advisory Committee members, including Anand Anandalingam (University of Maryland), Lina Echeverri (Telefonica), and Martin Fleming (IBM Corporation). We thank Douglas Sease for his excellent writing and editing skills, in bringing the individual papers together for this publication. At The Conference Board, Marta Rodin and her colleagues did the final editing job for the chapters in this book. This project was a major team effort at The Conference Board, and we thank all of our colleagues who were involved at various stages. Katherine Schinasi has overseen most of the social and cultural works, and her insights have been invaluable during the course of the project. Finally, we are grateful to Randall Weiss, who has skillfully managed the project over the past two years and who oversaw and reviewed all of the work from conception to publication. Bart van Ark Senior Vice President and Chief Economist Jon Spector President and CEO
TICyPRODUCT_ingles_i_x_001_230.indb 9
30/6/11 16:53:06
TICyPRODUCT_ingles_i_x_001_230.indb 10
30/6/11 16:53:06
Part
I
Introduction
TICyPRODUCT_ingles_i_x_001_230.indb 1
30/6/11 16:53:06
Introduction 2
Introduction by Bart van Ark, Randall Weiss and Katherine Schinasi
Information and communications technology (ICT) is a dominant and pervasive part of modern life. We talk, tweet, and text on cell phones; work, shop, and entertain ourselves on the Internet; and eagerly await the next new thing, whether it be hardware or software, that will emerge from the innovative minds of engineers and designers around the world. Ten-year-old kids are conversant on such topics as bandwidth and the relative merits of 3G versus 4G. Technology drives corporate growth, the global distribution of jobs, and the value of investments. Technology also spurs competition. Telecom operators make large investments in competing infrastructure platforms, such as cable, telephone, and wireless, which enable the interactive connectivity that is at the heart of recent ICT. Tech giants like Apple, Microsoft, and Google compete to have dominant software platforms that build customer bases among business and consumer users. And companies across the spectrum of industries are trying to find ways to do business faster, cheaper, and better using technology. There is no question that ICT, like steam power and electricity before it, is a fundamental force for global change. Much of the attention paid to ICT is focused on the players and their products. Can Dell come up with a product to rival Apple’s iPad®? Will Amazon’s Kindle e-Reader and other dedicated reading devices survive as newer and more versatile tablet computers emerge? Much less attention is being paid to how ICT is shaping the way society is changing than how it is being shaped by society. That is the subject of this book. The Conference Board has brought together researchers from around the world to examine some of the myriad ways ICT affects economic growth and social and cultural development. The intent is to shed light on three broad questions: 1. How is ICT driving living standards, as measured by societal and cultural development and economic growth, in the world’s advanced and emerging economies? 2. How is the diffusion of ICT affecting the distribution of its benefits between and among various social, cultural, and economic entities? 3. How does government policy, business strategy and consumer behavior either encourage or constrain the realization of ICT’s full potential? Communication has been transformed by the digital revolution, with technological advances being driven by two major innovationsdigitalization and packet-switchingand enabled by communications networks whose infrastructure and control technology allowed these innovations to have widespread application. The ability to convert information from “real life” analog formats into electronically processable and transmittable digital formats, combined with the ability to break this information into small packets that can be routed around an “information highway” of unlimited size, has led to a quantum leap in the information that can be shared and the speed, volume, and interactivity of what humans can communicate among themselves. In the communications arena, the only prior technological development of such profound significance is the application of electricity to information, which, for the first time in human history and through the innovations of the telegraph and the telephone, allowed communication to be separated from the physical transportation of people or physical content. Getting a firm grasp on the impact of recent ICT over the past two decades has not been easy despite much effort. Compared to the development of both steam power and electricity, ICT’s growth and diffusion has happened with astounding speed, fueled by rapidly increasing computing power and even faster price declines for
TICyPRODUCT_ingles_i_x_001_230.indb 2
30/6/11 16:53:06
Introduction 3 that computing power. Consider that the cost for a steam engine to produce one horsepower in 1910 was oneeighth what it cost in 1760. In comparison, the cost of computer operations in 2000 was one billionth what it cost to obtain similar output in 1950. The cell phone was only invented in 1973, yet it is ubiquitous today with capabilities undreamed of just a decade ago. Under such rapidly changing circumstances, it is difficult to devise measurements that capture these dynamic changes and their intended and unintended consequences. The problem becomes more complicated because the world is still in the earliest stages of the digital revolution without full appreciation for ICT’s transformative power and the unpredictability of where it is all headed. Yet difficulty in obtaining precise and comprehensive measurements should not deter us from doing what we can to observe and analyze the transformative impact of ICT and distill what lessons we can. To maximize the insights to be gained from this project, we reached out globally–both in terms of our research team and our subject matter–to bring a broad base of experience to the research. A common thread throughout this research is the emphasis on a comparative analysis of the experience of various developed and emerging nations. Further, our choice of researchers from a variety of disciplines allows this subject to be examined from many angles. And the research methods are diverse as well. For the most part, the research relies on published measurements gathered by reputable organizations globally or regionally and on original data gathered specifically for this project. However, given the problematic nature of some of the data available to measure the impact of ICT, the statistical analysis is supplemented and expanded through case studies. This book is not intended to be a comprehensive study of this enormous subject. Rather, topics were chosen for the individual chapters to provide specific insights in order to begin to answer the broad questions presented. The book is divided into three parts. The Impact of ICT on the Production of Goods and Services, examines several aspects of ICT through the lens of economic analysis. The first two chapters provide an analysis of the telecom sector’s performance as a driver of economic growth in advanced and emerging economies and an examination of the value of broadband connections to the Internet. The next two chapters provide more details on the ways ICT boosts the economy. The first presents a case study on how an important media industrybook publishinghas been affected by ICT, ultimately benefiting consumers and producers of the product, and the second shows how ICT provides more flexibility to employers by distributing their employees over geographic regions. The final two chapters in Part I examine the impact of ICT on two services typically provided by governments: administrative services and health services. The following part, Toward Comprehensive Measurement of ICT’s Impact: Paying Attention to Society and Culture, takes a more sociological approach to questions about the role and influence of ICT in society and culture. The first chapter looks at issues raised by modern ICT, including the nature of social connectivity and the ownership of intellectual property and personal information. The other chapters in this part focus on the problems of digital exclusion, the use of mobile communications to build social capital, and the impact of ICT on education. The final part, The Impact of Policy, examines how public and regulatory policy affects ICT’s development and use, with a particular focus on the telecom industry. We do not expect this volume to answer all the questions about ICT’s impact on society and the global economy. But we do believe the research contained in this book will help blaze a trail for better measurements, more extensive analysis, more knowledgeable recommendations for action, and, ultimately, for more effective policies to realize the amazing potential for human betterment that is embodied in ICT. We see several themes emerging from the findings of this research. First, modern ICT applications contribute significantly to economic growth and innovation but spread only gradually across the economy and geographies. Recent economic expansion has significantly been driven by ICT diffusion, in both advanced and emerging countries. As broadband connections become more prevalent and their prices fall, households come to value this connectivity much more highly than what they pay for it. Some of the ways that growth is spurred include how
TICyPRODUCT_ingles_i_x_001_230.indb 3
30/6/11 16:53:06
Introduction 4 digital books can be produced at a lower cost than print books where the market is restructured so that companies not traditionally part of the publishing industry compete in the distribution of content. Thus, the price is lowered and the market expands, benefiting both consumers and producers. The provision of health care is enhanced by the Internet’s ability to provide specialized information directly to consumers. Use of modern ICT in schools and at home improves students’ attitudes about science and math, which leads to increased educational achievementan important driver of economic growth. Second, the benefits of ICT are not spread evenly, and there is no guarantee that the benefits will always outweigh the potentially negative effects. The rapid price decline mentioned earlier facilitated rapid diffusion of the new technology, probably at a pace faster than that at which new processes, methods, and organizational changes could most thoughtfully be developed to effectively harness its potential. Indeed, in advanced economies, we saw that ICT’s contribution to economic growth slowed somewhat in the 2000s as the “low-hanging fruit” of new technology already had been picked. Some of this slowdown may be temporary, as the complementarities of new hardware, new applications (emerging in part from parallel technological developments), and user education become better aligned. Modern ICT is sufficiently complex that a significant investment in time and attention is necessary to master it, and a full understanding of how all parts of society can accomplish this will not come quickly. For example, digital books existed for a long time before a complementary developmentAmazon’s Kindle eReaderallowed the new form of content to grow exponentially. Although computers with broadband connections can easily be placed in schools, the investment in hardware is nearly useless if teachers are not trained and motivated to use them as instructional tools. Putting government services online is not sufficient to generate efficiency if people are not equipped to use the technology. What once was known as the “digital divide” that separated the wealthy who had access to the Internet from the poor who did not is breaking down into multiple divides across age, gender, and social groupsincreasing the risks that some will be left behind and not experience the benefits of ICT. And there are always unintended consequences (e.g., children’s computer use at home may distract from academic achievement rather than promote it). Finally, the many unexplained differences across countries on the impacts of ICT suggest that there are many things we have yet to understand about the social and cultural barriers preventing its full utilization. Third, the interactive connectivity of modern ICT upends established social roles and normsthe analog to the “creative destruction” it causes in the marketplace. Economic historians have long noted the disruption that significant innovations cause to established market positions, and ICT certainly follows this pattern. Business models that were once profitable are being undercut by new challengers, whether it is the blogosphere challenging traditional news media outlets or brick-and-mortar retailers competing against the online sellers of everything from books to gourmet food. But what has taken us somewhat by surprise is how modern ICT has changed the ways people form communities and the ways established social roles and norms have been changed. It is no longer sufficient to know how much technology is being used; the more important question is how it is being used. It is in the social and cultural realm that the dynamic nature of mobile communications is best seen. The social networks that ICT has spawned through merely their virtual presence are taking on new roles as political forces, actually changing the predicted results of elections through massive mobilizations of partisans. Yet these connections actually complement face-to-face interaction, as groups more easily learn of their common interests. Physicians, once regarded as white-coated gods, are finding their exalted status challenged by patients mining the Internet for information about their illnesses and questioning their doctor’s diagnosis and treatment plan. And the easy flow of personal informationboth “private” information and the intellectual output that is the fruit of the creative processfacilitated by technology calls into question the nature of its ownership and protection. For example, the fear of hackers is one of the impediments to a broader use of computerized medical records, and the music industry is struggling to find its way forward in the digital age.
Introduction 5 Finally, government policy and business strategy play a critical role in how well or poorly ICT is used to improve living standards. The countries that have had the most success exploiting technology’s potential are those that have developed comprehensive plans for doing soplans that allow businesses, governments, educators, and other stakeholders in the innovation to align their interests. These plans need to create a competitive environment in which firms are incentivized to compete and which reap the societal benefits of common standards and parallel applications. These plans should also help create platforms where the different players can meet and cooperate to combine techniques and innovations to create new applications. Governments can systematically confront the diverse needs and preparation levels of their citizenry and go beyond merely regulating to create a user-friendly environment that integrates users’ needs and perspectives into policy planning. Such policies recognize that people in different places use ICT differently. To understand the impact of ICT, it is not enough to know how many devices are available or how often people use them. Leaders who set policy or business strategies, whether government or corporate, must also know how ICT is applied in specific settings, such as rural versus urban environments, and for specific purposes, such as health, education, and government services. In some emerging countries, the entry point for access to the Internet is a cell phone and not a personal computer. Getting policy and strategy right will require leaders with imagination, know ledge, and the courage to understand what to do and how to do it if they are to get ahead and stay ahead of the technology cycle. Hovering over every aspect of ICT is the exponential growth in traffic and demand for services and the implications that growth holds for investment, whether for government or private firms, in infrastructure and the pricing of services. Information and communications technology companies face the daunting prospect of having to spend billions of dollars to expand and improve their networks, even as consumers demand constantly lower prices. If prices fall too far, there will be no investment, but if prices do not meet consumers’ expectations there will be no demand. The trick will be to find the “sweet spot” that provides returns on the investment while keeping consumers happy. While the researchers participating in this project were held to the highest standards of academic research, the chapters in this volume are essentially distillations of their methods and conclusions. We feel that this will make the information more accessible to a broad audience of non-academics, including strategic thinkers in industry and policy. For those readers so inclined, the original papers from which these chapters were derived, with citations, methodological explanations, and appendixes, can be found on The Conference Board website (www. conferenceboard.org).
TICyPRODUCT_ingles_i_x_001_230.indb 5
30/6/11 16:53:07
Part
II
The Impact of ICT on the Production of Goods and Services 9
35
53
Chapter 1
Chapter 2
Chapter 3
67
79
89
Chapter 4
Chapter 5
Chapter 6
TICyPRODUCT_ingles_i_x_001_230.indb 7
30/6/11 16:53:08
TICyPRODUCT_ingles_i_x_001_230.indb 8
30/6/11 16:53:08
Chapter
1
Measuring the Contribution of ICT to Economic Growth
TICyPRODUCT_ingles_i_x_001_230.indb 9
30/6/11 16:53:08
Chapter
1
Measuring the Contribution of ICT to Economic Growth1 Bart van Ark (The Conference Board), Abhay Gupta (MITACS, Vancouver), Abdul Azeez Erumban (University of Groningen)
1.1 Introduction Information and communication technology (ICT) is an umbrella term that includes any communication device or application, including radio, television, cellular phones, computer and network hardware and software, satellite systems, and the like, as well as the various services and applications associated with them, such as videoconferencing and distance learning. In the past half century, ICT has gradually shown an increased impact on economic performance around the globe. Only 25 years ago, in 1987, Nobel laureate Robert Solow remarked, “You can see the computer age everywhere but in the productivity statistics”.2 Today, this skepticism has largely disappeared, as numerous studies have observed ICT’s increasing impact on economic growth. ICT is often considered a general purpose technology. Like electricity, it can be adapted to multiple applications. Its role in enhancing economic growth is present in both ICT-producing and -using sectors in the economy, with important implications for social and cultural performance, which are explored throughout this project. The impact of ICT on economic performance, broadly defined as the increase in living standards from the creation of additional economic output and its wide distribution across producers, consumers, and owners of wealth, can be analyzed from three perspectives–from the viewpoints of supply, demand, and distribution. This chapter primarily focuses on the supply side of ICT’s impact on economic growth, although it will refer at places to demand and distribution-related topics, such as the use-effects of ICT within the business sector and the distributional effects across countries. On the supply side, ICT has three main effects: 1. A production effect, in which the ICT-producing sector, including telecom equipment and services, experiences an acceleration in productivity growth as the industries produce output at a faster pace than they use resources. 2. An investment effect, in which the more intensive use of ICT improves the contribution of capital to output growth in using sectors, typically measured by increases in labor productivity across the economy. 3. A productivity effect, which results from an efficiency rise in the use of ICT, which goes beyond its direct capital deepening effect. In this case, the use of ICT also enhances multifactor productivity (MFP) growth, which is output measured over all inputs–not just labor, but also capital and intermediate inputs–across the economy. The impact of ICT on the supply-side analysis can be seen primarily through a decomposition of ICT’s effects on production. This chapter extends previous research on ICT’s contribution to economic growth in several ways. We address the contribution of ICT from the perspectives of the channels through which ICT affects economic growth, as described in Figure 1.1 (ICT production, investment and productivity), as well as the contributions in different sectors of the economy (producing and using industries), and the comparative growth performance
1 We are grateful to Ben Cheng for research assistance for this chapter. 2 Robert M. Solow, “We’d Better Watch Out”, New York Times Book Review, July 12, 1987, p. 36.
TICyPRODUCT_ingles_i_x_001_230.indb 10
30/6/11 16:53:08
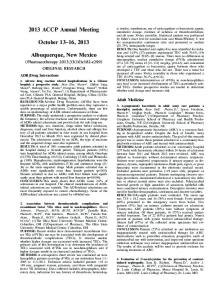
1. Measuring the Contribution of ICT to Economic Growth 11 Figure 1.1. DELINEATING INPUT CONTRIBUTION TO ECONOMIC GROWTH
Output Growth
Input Growth
Capital Input (K)
ICT Capital • Telecommunication Equip. • Computer Hardware • Computer Software Non-ICT capital
Intermediate Inputs
Energy (E) Materials (M) Services (S)
Labor Input (L)
Hours worked Labor Composition • Age • Gender • Skill
Multi Factor Productivity (MFP) Growth Note: Multifactor productivity (MFP) growth is output growth in excess of input growth.
across regions. Following a deeper analysis of how ICT impacts the economy (Sections 1.2 and 1.3), we make an aggregate comparison of the development in ICT and telecom investment across a large group of advanced economies and emerging economies (Sections 1.4 and 1.5). We then examine the relationship between ICT capital and productivity growth for 10 major economies in the world in greater detail (Sections 1.5–1.7). Next, we take an industry-level approach to focus on the output and productivity performance of ICT manufacturing and telecommunication services sectors for six major economies (the United States, the United Kingdom, Spain, European Union-15–which were the member states before the expansion of the EU in 2004–South Korea, and Brazil) (Sections 1.8 and 1.9). We also specifically analyze the role of telecommunication equipment and services as part of the combined contribution of all ICT to output growth in those economies (Section 1.10). Our most important conclusions can be summarized here. First, the overall growth of ICT investment and the contribution of ICT capital to output and productivity growth experienced its heyday during the late 1990s, when the tech boom led to a surge of investment. Second, after 2000, the direct contribution of ICT to economic growth through investment and productivity in ICT-producing industries slowed. However, underlying this slowdown are significant changes both in the composition of the ICT capital component, which showed an increasing share of telecommunication equipment, and a change in industry contribution to output and productivity related to ICT, specifically a larger contribution from telecom services relative to ICT manufacturing in several countries. Finally, a substantive shift in the global distribution of ICT growth is also found. While ICT and telecom investment levels and growth contributions are still much higher in advanced countries, emerging countries are rapidly catching up in terms of investment intensity and productivity performance. In advanced economies, which are already at the innovation frontier, new applications of ICT are having much smaller and more gradual effects on investment and productivity growth.
TICyPRODUCT_ingles_i_x_001_230.indb 11
30/6/11 16:53:09
The Impact of ICT on the Production of Goods and Services 12
1.2 The emergence of a general purpose technology Before going into the details of the empirical estimates, we need to specify some characteristics of ICT as a source of economic growth. While information transfer between human beings is as old as civilization, it has only been a few centuries since the advent of the printing press that information transfer has developed into a key economic activity. The arrival of telecommunication technology during the 19th century further strengthe ned the role of information and communication to the economy. But the basic invention of the microprocessor in 1971 has probably had bigger effects on the ICT industry and the economy as a whole than any other information- and communication-related activity in the past. Computing power has dramatically increased, with microchip performance growing at an exponential rate as reflected in Moore’s Law.3 That has hugely increased the speed by which information can be processed and distributed. The microprocessor has initiated a series of incremental innovations leading to the development of mainframe computers and subsequently to increasingly faster, cheaper, and more compact devices that are interlinked in networks, most notably the Internet. These innovations have led to both rapid and continuous productivity gains in ICT-producing sectors. They have brought to the market new hardware, software, and telecommunication products and services that are of higher quality and that deliver better performance. Furthermore, they have resulted in a huge decline in the price of ICT goods, providing investors an incentive to replace other forms of capital with ICT equipment.4 These productivity dynamics, in combination with a rapidly increasing demand for ICT products and services, have led to a rapid expansion of output in ICT-producing sectors, thereby directly resulting in a larger contribution from ICT production to economic growth. In recent years, the integration of telecommunication devices with broadband functions has given an additional boost to opportunities for investment and economic growth. Apart from the direct effect on the ICT-producing sector by boosting productivity and aggregate growth, ICT also supports faster growth in other sectors of the economy. First, because of declining prices, ICT capital has become an attractive production factor , leading to an expansion of ICT investment. Increased ICT use has stimulated labor productivity growth by means of faster “capital deepening” (which refers to an increase in the amount of productive capital per worker) across the economy, but especially in industries where high-tech capital traditionally played a marginal role, such as service industries, including retail trade, financial services, and business services. Second, increased ICT use has also helped to achieve higher MFP growth, which measures the growth of production over the combined contribution of all inputs, including labor, human skills, machinery, structures, and ICT. In this res pect, ICT creates an additional bonus or spillover effect for the economy as a whole. ICT, particularly the telecommunications part of it, incorporates network externalities. This means that more users of the technology create more benefits for the economy as a whole. This is not meant to imply that MFP growth comes without any additional effort from the investor or society as a whole. It requires the right institutional framework to provide an optimal mix of market-based and policy-induced incentives. It also needs a broader investment strategy beyond ICT in intangible capital, such as research and development, workforce skills, organizational capital, and marketing and branding. The investment and productivity effects are key to ICT becoming a general purpose technology (GPT) in the same way as steam and electricity did in the past. GPT has four main characteristics:5 1. a wide scope for improvement and elaboration; 2. applicability across a broad range of uses;
3 Moore’s law refers to the regularity that the number of transistors on an integrated circuit doubles approximately every two years. 4 Jorgenson (2005). 5 Lipsey et al. (1998).
TICyPRODUCT_ingles_i_x_001_230.indb 12
30/6/11 16:53:09
1. Measuring the Contribution of ICT to Economic Growth 13 3. potential for use in a wide variety of products and processes; and 4. strong complementarities with existing or potential new technologies. GPTs affects entire economies and social structures, but ICT diffusion has, more noticeably than any previous innovation, produced changes across the global economy. For example, in terms of the speed of diffusion, the ICT era is comparable to the age of electricity (i.e., a relatively rapid diffusion across the economy). 6 It has affected elements of production, distribution, and consumption in most of the developed world, and it is a force for change in the economic prospects of emerging economies.
1.3 Measuring the results of ICT at the macroeconomic level Despite the importance of the technology, it has not been easy to quantify the macroeconomic effects of ICT on growth. Perhaps this should not come as a complete surprise. While strong correlations between ICT investment and growth can be found at the firm level, they take place in an environment of rapid structural changes in which winners do not necessarily (or very quickly) outnumber losers when it comes to new technologies. The observed contribution of computerization is accompanied by relatively large and time-consuming investments in complementary inputs, such as organizational capital.7 There is a stronger productivity contribution from the net entry of firms–that is, the effects from the entry of new firms minus those from exiting old firms–in hightechnology industries compared with low-technology ones.8 In the spirit of Solow’s quip, referred to above, it can take a long time for such technologies to present sizeable positive effects at the macroeconomic level. But Solow’s comment was primarily meant to hint at measurement issues. New technologies often bring with them large statistical challenges. Apart from the fact that new products and services are only picked up in the statistics with a certain delay, the issue becomes especially challenging when rapid technological changes make it difficult to develop continuity in the time series of output and productivity growth. The measurement of ICT prices, which very rapidly fell due to large quality improvements in ICT products and services, has been especially challenging for statisticians. In addition, since many ICT goods and services have been used as investment in service industries, there has been the additional problem of adequately measuring the output of the industries that use the most ICT, such as retail, finance, and business services.9 Despite such measurement problems, more and better data on ICT investment and production has made it possible to construct a reasonably solid picture of the significant impact ICT has had on macroeconomic performance since the 1980s. The boosting effects of ICT on economic growth have been observed to be particularly strong in advanced economies, such as those in the OECD.10 ICT-producing sectors have witnessed very high rates of productivity growth, thus contributing significantly to aggregate productivity growth. There has also been evidence of acceleration in ICT investment across many intensive ICT-using industries, though at varying degrees among countries.11
6 van Ark and Smits (2007). 7 Brynjolfsson and Hitt (2003). 8 Bartelsman, Haltiwanger and Scarpetta (2009). 9 Inklaar, Timmer and van Ark (2008). 10 See, for example, Jorgenson and Vu (2005) and Inklaar et al. (2008). 11 Colecchia and Schreyer (2001); van Ark et al. (2002) and (2008).
TICyPRODUCT_ingles_i_x_001_230.indb 13
30/6/11 16:53:10
The Impact of ICT on the Production of Goods and Services 14 However, the jury is still out on how the use of ICT is leading to improvements in MFP across the economy. While there have been important productivity improvements in using sectors, such as the distribution, financial service, and business service industries, it has been difficult to attribute these gains directly to ICT investment. While firm-level studies often show reasonably solid relationships, there is only limited evidence of ICT investment having a direct impact on MFP growth at the industry level.12 Also, controlling measurements for such diverse factors as labor and product market regulations have not provided unambiguous results with regard to facilitating ICT’s impact on productivity.
1.4 The telecom industry’s role A deeper look into the role of different subsets of ICT (including computer hardware), such as telecom equipment and services, may provide more insight into how the effects of technology spread across the economy. Each subset has witnessed tremendous technological change. Computer hardware development has essentially been driven by rapid changes in semiconductor technology, captured by Moore’s law referred to above. The communications industry also benefitted from technological improvements in electronics, including developments in the analog/mixed signal and flash semiconductor devices used in wireless devices. Parallel to the rise of the Internet as a facilitator for the use of the personal computer, the evolution of rapidly increasing bandwidth in radio wave-based technology has been the key facilitator in the rise of telecommunications. Thus, the rapid technological change in telecom equipment manufacturing spread to the telecom service sector. A regularity, similar to Moore’s law, that can therefore be applied to the telecom industry is Metcalfe’s law, which states that the value of a network increases with the square of the number of users of the network. There are three ways to look at the impact of the telecommunication industry on the economy: prices, penetration, and performance. In the first instance, during the 1980s and 1990s, prices of computer hardware equipment typically fell faster than those for communication equipment. For example, the annual average price decline in personal computers in the United States was 16.4 percent from 1983–1995, which accelerated to a decline of 30.6 percent from 1995–2000. Prices of wireless systems (cellular, satellite, and other radio-wave systems), however, fell at 16.7 percent, and prices of cell phones at 15.7 percent from 1995–2000. Since 2000, price developments of IT hardware and communication equipment have been more similar. For example, from 2000–2007, prices of personal computers fell at 18.8 percent on average, whereas prices of cell phones declined at 15.1 percent. Penetration rates also rapidly caught up between IT and communication technology: in 1995, the number of computers in use by 100 households was 31.5, whereas mobile wireless connections were only 12.6 per 100 persons. By the 2000s, computer use had doubled, but wireless use had tripled. In 2008, the usage rates were about the same: 86.4 computers per 100 households versus 88.4 mobile wireless connections.13 The telecom sector has attracted a lot of policy attention during the past decade, as efforts were aimed at bringing higher quality and greater access to telecom services users (consumers and businesses) of all types. Many countries, including emerging economies such as India, have undertaken significant policy changes to strengthen ICT use through extensive privatization of traditional telecom industries and a greater openness of the telecom markets for new entries. Past evidence suggests that privatization and openness have a positive effect on growth of the telecom sector, particularly in low-income countries.14
12 Inklaar et al. (2008). 13 Corrado (2010). See this study for a more detailed analysis of prices, penetration, and productivity in the communication sector in the United States. The study relates these developments to Metcalfe’s network externalities, which have translated itself into higher capacity utilization and MFP growth. 14 El Khoury and Savvides (2006).
TICyPRODUCT_ingles_i_x_001_230.indb 14
30/6/11 16:53:10
1. Measuring the Contribution of ICT to Economic Growth 15 The remainder of this chapter therefore focuses on an international comparison of economic performance measures of IT and communications technology. How does the growth of investment in overall ICT capital compare to that of telecommunications alone? How much have these investments contributed to aggregate economic growth? And what are the productivity gains in ICT and telecom-producing and -using industries?
1.5 ICT and telecom investment and capital stock At the macroeconomic level, the effects of ICT are primarily identified through ICT investment. Figures 1.2 and 1.3 show the average annual growth rates in real investment rates (i.e., the growth in investment adjusted for price
Figure 1.2. �ICT INVESTMENT IN ADVANCED AND EMERGING ECONOMIES
Growth of total ICT investment
0.35 0.3 0.25 0.2 0.15 0.1 0.05 0
1989-1995
1995-2000 Advanced
2000-2007
Emerging
Global ICT investment Shares-2007
Emerging 41%
Advanced 59%
Note: Investment in ICT refers to telecommunication equipment, IT hardware and software. The growth rates refer to average annual growth rates for each sub-period, and represent averages for 26 advanced countries in North America, Europe and Asia-Pacific (including Japan, Korea, Taiwan, Singapore, Hong Kong, Australia, and New Zealand), and 41 countries representing emerging markets around the world, including developing Asia, Central and Eastern Europe, Latin America, and the Middle East. (For a full list, see Footnote 15.) Source: The Conference Board Total Economy Database, January 2011 (https://www.conference-board.org/data/economydatabase/).
TICyPRODUCT_ingles_i_x_001_230.indb 15
30/6/11 16:53:11
The Impact of ICT on the Production of Goods and Services 16 Figure 1.3. �TELECOMMUNICATION EQUIPMENT INVESTMENT IN ADVANCED AND EMERGING ECONOMIES
Growth of telecom investment
0.35 0.3 0.25 0.2 0.15 0.1 0.05 0
1989-1995
1995-2000 Advanced
2000-2007
Emerging
Global telecom investment Shares-2007
Emerging 55%
Advanced 45%
Note: The growth rates refer to average annual growth rates for each sub-period, and represent averages for 26 advanced countries in North America, Europe and AsiaPacific (including Japan, Korea, Taiwan, Singapore, Hong Kong, Australia and New Zealand), and 41 countries representing emerging markets around the world, including developing Asia, Central and Eastern Europe, Latin America and the Middle East. (For a full list, see Footnote 15.) Source: The Conference Board Total Economy Database, January 2011 (https://www.conference-board.org/data/economydatabase/).
changes) in all ICT (which includes telecommunication equipment, IT hardware and software) and telecommunication equipment separately, respectively. The charts compare the annual average growth rates for a group of 26 advanced economies and 41 emerging economies for three sub-periods 1989–1995, 1995–2000, and 2000– 2007.15 In addition, the charts also show the shares of advanced and emerging economies in telecom investment and in all ICT investment in 2007. The data are obtained from The Conference Board Total Economy Database,
15 Advanced countries include: Australia, Austria, Belgium, Canada, Denmark, Finland, France, Germany, Greece, Hong Kong, Ireland, Israel, Italy, Japan, Netherlands, New Zealand, Norway, Portugal, Singapore, South Korea, Spain, Sweden, Switzerland, Taiwan, the United Kingdom, and the United States. Emerging countries include: Argentina, Bangladesh, Bolivia, Brazil, Bulgaria, Cameroon, Chile, China, Colombia, Costa Rica, Czech Republic, Ecuador, Egypt, Hungary, India, Indonesia, Iran, Jamaica, Jordan, Kenya, Malaysia, Mexico, Morocco, Pakistan, Peru, Philippines, Poland, Romania, Russian Federation, Senegal, Slovak Republic, Slovenia, South Africa, Sri Lanka, Thailand, Tunisia, Turkey, Ukraine, Uruguay, Venezuela, and Vietnam.
TICyPRODUCT_ingles_i_x_001_230.indb 16
30/6/11 16:53:12
1. Measuring the Contribution of ICT to Economic Growth 17 which is based on countries’ national accounts statistics, complemented with the statistical databases of international organizations (such as the IMF World Economic Outlook, Eurostat, and the United Nations Statistical Office), and academic and private datasets (such as Jorgenson’s database at Harvard University, the Penn World Tables and WITSA). The data strikingly show that, in advanced economies, investment growth rates for both ICT and telecom equipment have slowed since 2000. In contrast, these growth rates have continued to rise and even accelerate for emerging economies. The growth gap in overall ICT investment between advanced and emerging economies since 2000 has risen to about 17 percentage points (25 percent average annual growth for emerging economies, compared to 8 percent in advanced economies), and in telecom equipment it has reached 14 percentage points (17 percent average annual growth for emerging economies, compared to only 3 percent for advanced economies). As a result, the emerging economies’ share in global ICT investment has more than tripled, from 13 percent in 1990 to 41 percent in 2007. In telecom, the investment share for emerging economies has grown to an astonishing 55 percent in 2007. Figures 1.4 and 1.5 show the long-term trend in investment growth rates for 10 major individual countries for ICT and telecommunication equipment, respectively.16 The time series represent trend lines, which smooth the annual changes in the growth rates that show significant volatility, year over year. Comparing Figures 1.4 and 1.5 shows that ICT investment as a whole has a higher growth trajectory than telecom investment alone. Throughout the period shown, and despite the overall slowdown since 1995, ICT investment growth rates were higher than in telecommunications alone. When looking at the individual countries, the overall slowdown in ICT and telecom investment in advanced economies since 2000, compared to the 1995–2000 growth rates, is confirmed for three of the five advanced economies, the United States, the United Kingdom, and Japan. Germany and Spain, however, showed a conti nued slight upward trend in ICT investment toward the end of the period. The investment slowdown in many of the advanced countries since 2000 probably reflects a correction to the tech boom of the late 1990s. Compared to the pre-boom period (pre-1995), only a few countries show slower growth in investment since 2000. These countries include Japan, South Korea, the United Kingdom, and the United States–all of which had already achieved a relatively high level of ICT and telecom penetration. The emerging economies show a clear acceleration in the investment trend for ICT and telecommunication. Growth rates for telecom investment are somewhat lower than for ICT across the board, but, in both cases, they have generally been higher for emerging economies than for advanced economies and have shown significant acceleration. In China, however, a slowdown in an already relatively high trend has been observed since the beginning of the 2000s. The growth trend in China has stabilized, but it is still high at around 30 percent for overall ICT investment and just below 15 percent for telecom equipment. To better understand the contribution of ICT and telecom investment to growth, we transformed investment figures into capital stock measures to compute their contribution to economic growth. We weighted the diffe rent types of capital stocks based on their compensation shares in GDP to get the aggregate service flows of capital in each country. We found that the share of ICT capital stock in total capital stock was around 13 percent for the United States in 2007, which is higher than the share in most other countries except the United Kingdom. Some advanced economies, particularly those with large service industries, such as Australia (not separately shown in the
16 Trend lines for another 10 major economies out of the total of 67 countries are shown in the underlying working paper.
TICyPRODUCT_ingles_i_x_001_230.indb 17
30/6/11 16:53:12
The Impact of ICT on the Production of Goods and Services 18 Figure 1.4. �TREND GROWTH OF ICT INVESTMENT, ANNUAL
Trend growth in ICT investment, advanced economies
0.35 0.3 0.25 0.2 0.15 0.1 0.05 0
1983
1988
1993
1998 Japan
Germany United States
United Kingdom
2003 Spain
Trend growth in ICT investment, emerging economies
0.35 0.3 0.25 0.2 0.15 0.1 0.05 0
1983
1988 Brazil China
1993
1998 India
Turkey
2003 Mexico
Note: The trend growth rates are computed using a Hodrick-Prescott filter. Source: The Conference Board Total Economy Database, January 2011 (https://www.conference-board.org/data/economydatabase/).
charts in this chapter), also showed a high share of ICT capital, while other advanced countries showed ICT capital shares of less than 10 percent. Large emerging economies such as Brazil and China showed ICT capital shares of about 6 percent in 2007, and India, given its large ICT service industry, still exhibits an ICT capital share of only 7.7 percent. Together, these results confirm that the growth potential for ICT investment in emerging economies is still substantial as they catch up in economic performance with advanced economies.
TICyPRODUCT_ingles_i_x_001_230.indb 18
30/6/11 16:53:13
1. Measuring the Contribution of ICT to Economic Growth 19 Figure 1.5. �TREND GROWTH OF TELECOM EQUIPMENT INVESTMENT
Trend growth in telecom investment, advanced economies
0.35 0.3 0.25 0.2 0.15 0.1 0.05 0 –0.05
1981
–0.1
1986
1991
Germany United States
1996
Japan
United Kingdom
2001
2006
Spain
Trend growth in telecom investment, emerging economies
0.35 0.3 0.25 0.2 0.15 0.1 0.05 0
1981
1986 Brazil China
1991
1996 India
Turkey
2001
2006
Mexico
Note: The trend growth rates are computed using a Hodrick-Prescott filter. Source: The Conference Board Total Economy Database, January 2011 (https://www.conference-board.org/data/economydatabase/).
In line with the slower growth rates of investment in telecom relative to overall ICT, the share of telecom capital has generally declined since 2000. However, the share of telecom in overall ICT investment has generally remained much higher in emerging economies than in advanced economies. Telecom equipment in advanced economies accounted for less than 50 percent of the ICT capital stock from 2000–2007, but is generally higher
TICyPRODUCT_ingles_i_x_001_230.indb 19
30/6/11 16:53:14
The Impact of ICT on the Production of Goods and Services 20 than 50 percent in emerging economies. While China showed a telecom equipment share of 50 percent in total ICT stock, that share was close to 70 percent in India and as high as 80 percent in Indonesia and Turkey. There are many factors influencing these differences in telecom equipment shares in ICT. In part, the greater emphasis on investment in computer hardware and computer services in advanced countries was driven by the very rapid price declines in computer hardware from which the latter benefited more extensively since the share of ICT in total investment was larger. As was shown, prices of ICT generally declined faster than those for telecommunications equipment, especially before 2000. More importantly, however, the immediate application of mobile telecom technology in emerging economies, where fixed telecom technology tended to be underdeveloped and expensive, has led emerging economies to leapfrog in this technology. Another explanation may be related to policy factors that have led advanced economies to take longer to liberalize traditional telecom markets and make the development of telecom netwoai
1. Measuring the Contribution of ICT to Economic Growth 21 Figure 1.6. �ICT CAPITAL PER WORKER, 2000 US$, PPP-CONVERTED
Trend growth in ICT capital per worker, advanced economies
16.000 14.000 12.000 10.000 8.000 6.000 4.000 2.000 0
1982
1984
1986
1988
1990
1992
1994
1996
1998
Japan
Germany United States
United Kingdom
2000
2002
2004
2006
2004
2006
Spain
Trend growth in ICT capital per worker, emerging economies
6.000 5.000 4.000 3.000 2.000 1.000 0
1982
1984
1986
1988 Brazil China
1990
1992
1994 India
Turkey
1996
1998
2000
2002
Mexico
Note: The levels are converted from national currency to US$ by purchasing power parities (PPP) for 2005. Source: The Conference Board Total Economy Database, January 2011 (https://www.conference-board.org/data/economydatabase/).
2. diminishing marginal returns, which means that the effect of capital per worker on output per worker is typically decreasing, once the optimum rate of accumulation has been passed, given the state of technology. These two factors may have offsetting effects as to the impact of ICT capital deepening on labor productivity growth:
TICyPRODUCT_ingles_i_x_001_230.indb 21
30/6/11 16:53:15
The Impact of ICT on the Production of Goods and Services 22 Figure 1.7. �TELECOMMUNICATION CAPITAL PER WORKER, 2000 US$, PPP-CONVERTED
Trend growth in telecom capital per worker, advanced economies
6.000 5.000 4.000 3.000 2.000 1.000 0
1982
1987
1992
1997
2002
Japan
Germany United States
United Kingdom
2007
Spain
Trend growth in telecom capital per worker, emerging economies
5.000 4.000 3.000 2.000 1.000 0
1982
1984
1986
1988 Brazil China
1990
1992
1994 India
Turkey
1996
1998
2000
2002
2004
2006
Mexico
Note: The levels are converted from national currency to US$ by purchasing power parities (PPP) for 2005. Source: The Conference Board Total Economy Database, January 2011 (https://www.conference-board.org/data/economydatabase/).
• Emerging and developing countries produce at levels that are well below the technology frontier, but also have lower ICT capital per worker, which makes the growth in ICT capital more effective in increasing the labor productivity. • Advanced economies have better production technologies, but their high ICT capital per worker may have caused diminishing returns, making the impact of growth in ICT capital per worker on labor productivity growth smaller. As a result of these two factors, emerging economies experience the positive effect of faster growth in capital per worker to dominate the negative effect of lower technology levels on labor productivity growth. In contrast, advanced economies see diminishing returns having more of an impact on labor productivity growth than the positive effects that come from their relatively high productivity levels.
TICyPRODUCT_ingles_i_x_001_230.indb 22
30/6/11 16:53:16
1. Measuring the Contribution of ICT to Economic Growth 23 Figure 1.8. �RELATIONSHIP BETWEEN GROWTH IN ICT CAPITAL PER WORKER AND LABOR PRODUCTIVITY GROWTH
United States, United Kingdom, Japan, Germany, Spain
Output per worker growth
2
1
0
–1
–2
0
0.5
1
1.5
2
ICT capital per worker growth Brazil, India, China, Mexico, Turkey
Output per worker growth
2
1
0
–1
–2
0
1
2
3
4
ICT capital per worker growth Note: The dots in the charts are annual observations for the countries in each chart for the period 1980–2008. The green line shows the linear regression of output per worker growth relative to “capital deepening” for the specified countries and years. Source: The Conference Board Total Economy Database, January 2011 (https://www.conference-board.org/data/economydatabase/).
The lack of a unique relationship between ICT accumulation and productivity growth is consistent with the view that technological progress may largely be exogenous, i.e., driven by factors beyond, and not directly driven by, investment in ICT capital itself–for example, organizational innovation, regulatory changes, etc. For emerging and developing countries, ICT-per-worker growth has a positive and significant impact on productivity growth.
TICyPRODUCT_ingles_i_x_001_230.indb 23
30/6/11 16:53:17
The Impact of ICT on the Production of Goods and Services 24 Since most of these developing countries operate well below the production possibility frontier, this impact on productivity growth indicates how they are able to play catch-up, a result of their increased ICT capital stock. Any technology transfer from advanced countries to developing countries therefore increases the global impact of ICT capital on productivity.17
1.8 The impact of the ICT and telecom sectors on output growth In the final sections of this chapter, we deepen our level of understanding of the impact of ICT on economic growth by adopting an industry-level perspective. We examine the growth performance of the ICT manufacturing industry, which includes the producers of telecom equipment, and of telecommunication services in terms of value-added growth and the contribution of those industries to aggregate labor productivity growth. The detailed analysis has been conducted for the United States, the EU-15, two specific EU member states (the United Kingdom and Spain), South Korea, and Brazil for the time period 1995 to 2007. The period has been further divided into two sub-periods, 1995 to 2000 and 2000 to 2007, with the aim of distinguishing between the period of rapid investment and slower investment in ICT. The results indicate impressive output and productivity performance in the ICT sector, especially in IT manufacturing and particularly during 1995–2000. However, since 2000, output and productivity growth in the ICT sector has generally slowed and the relative contribution of ICT to aggregate productivity growth has declined in most countries. The telecom services industries generally showed slower productivity growth rates, but their contributions to aggregate productivity growth have remained substantial. It should be noted that the productivity trends that emerge from the ICT and telecom sectors are congruent with the aggregate trends, including the overall productivity slowdown, which is accompanied by lower productivity growth rates in ICT and telecom sectors in absolute terms. But, in relative terms, telecom has contributed more to productivity growth during the early 2000s than it did in the pre-2000 period.
1.8.1 ICT manufacturing and telecom equipment We analyzed the most detailed measures of value-added and labor productivity for the IT equipment (“office, accounting, and computing machinery”) industry and the communication equipment industry (including radio and television receivers). The United States showed the highest output growth rates in both industries, closely followed by South Korea (Figure 1.9). Both are examples of countries with a decisive competitive advantage in the production of IT equipment, strongly driven by rapid technological change in a variety of basic components. Between 2000 and 2007, both countries suffered strongly from the dot-com crisis, but the long-term impact in the United States was primarily on the output growth of communication equipment, and in South Korea, the IT equipment industry was hurt most. The EU-15, as well as the two individual EU countries, Spain and the United Kingdom, showed much slower growth rates, especially during the 1995–2000 period. During this first sub-period, however, the growth of output in telecommunication equipment was faster than that of IT equipment, pointing to the different strengths in Europe when compared to the United States and South Korea.
17 Multifactor productivity (MFP) growth and level measures are obtained through a growth accounting methodology modified to measure the specific effects of ICT. See, for example, Colecchia and Schreyer (2001), van Ark and Timmer (2005), Jorgenson (2005) and Jorgenson and Vu (2005).
TICyPRODUCT_ingles_i_x_001_230.indb 24
30/6/11 16:53:17
1. Measuring the Contribution of ICT to Economic Growth 25 Figure 1.9. �GROWTH RATES OF VALUE ADDED FOR ICT PRODUCING INDUSTRIES ↑ 64.6%
30 ↑ 64.6% 30
1995-2000 1995-2000
25 25 20 20 15 15 10 10 5 5 0 0 –5 –5
United States United States
–10 –10
↑ 51.8%
30 ↑ 51.8% 30
EU-15 EU-15
IT equipment IT equipment Telecom services Telecom services
United Kingdom United Kingdom
Spain Spain
Communication equipment Communication equipment ICT producing sector ICT producing sector
Korea Korea
Brazil Brazil
ICT manufacturing ICT manufacturing
2000-2007 2000-2007
25 25 20 20 15 15 10 10 5 5 0 0 –5 –5 –10 –10
United States United States
EU-15 EU-15
IT equipment* IT equipment* Telecom services Telecom services
United Kingdom United Kingdom
Spain Spain
Communication equipment* Communication equipment* ICT producing sector ICT producing sector
Korea Korea
Brazil Brazil
ICT manufacturing ICT manufacturing
* IT equipment and communication equipment for the United States and the EU-15 refers to 2000–2005. Source: EU KLEMS Database, March 2008, November 2009, and March 2011 (www.euklems.net); for Brazil, de Vries (2011).
TICyPRODUCT_ingles_i_x_001_230.indb 25
30/6/11 16:53:18
The Impact of ICT on the Production of Goods and Services 26 In Brazil, the growth of output in the ICT and electronic equipment sector was below that of most countries, but somewhat faster than the growth rate in ICT manufacturing in Spain. The growth rate of ICT and electronic equipment in Brazil slowed down after 2000, which is somewhat in contrast to the overall increase in the investment trend in ICT in Brazil, suggesting a large role for ICT imports in Brazil. The permanent decline in the growth rate of output in ICT manufacturing is partly related to the correction for the ICT boom from 1995–2000 but might also reflect a shift in production of ICT goods from advanced countries to emerging Asian economies. For example, South Korea showed an impressive value-added growth rate during both periods, even though its growth rate of IT equipment collapsed during the second period.
1.8.2 Telecommunication services In the telecommunication (including postal) services sector, value-added growth has generally been faster than for ICT manufacturing, especially between 1995 and 2000. In the United States, the telecommunication services sector grew much slower than ICT manufacturing during both periods. However, value-added growth in U.S. telecom services has not declined as much as in the other countries since 2000. South Korea became the leader in telecom services growth during the 2000–2007 period. In the United Kingdom, the growth in telecom services from 1995–2000 was only below that of South Korea, but, like most countries since 2000, this growth fell off, dropping from more than 15 percent (1995–2000) to less than 4 percent (2000–2007). With few exceptions, we find that the magnitude of change in the value-added growth rate for the telecom services sector is larger than the magnitude of change in total economy growth rates, even though their direction is the same. Following the rapid adoption of broadband and mobile phone technology from 1995– 2000, the industry’s growth rate fell to lower yet still impressive levels in the early 2000s. As we will show below, productivity growth was considerably slower in telecom services than in ICT manufacturing. The telecom services sector has many characteristics of a typical services industry, which, despite the innovative nature of its services, requires a significant amount of labor input.
1.9 The productivity contribution of ICT at industry level Figure 1.10 shows the contribution of the ICT sector to aggregate growth in labor productivity. In the United States, almost one-quarter of aggregate labor productivity growth during 1995–2000 stemmed from the ICTmanufacturing sector. It declined to only 14 percent during 2000–2007. In contrast, the South Korean ICT manufacturing improved its contribution to total labor productivity growth from 24 percent to 32 percent of aggregate growth. The contribution of telecommunication (including postal) services to aggregate labor productivity increased significantly in the United States from 0.09 to 0.20 percentage points. Though in terms of relative magnitude the sector is quite small, telecom services contributed more than 10 percent of labor productivity growth in the aggregate economy during the second period. In contrast, in the United Kingdom, the contribution of post and telecom services to aggregate labor productivity growth declined from 0.43 to 0.12 (i.e., from 19 percent to 7 percent of the total labor productivity growth). Spain also experienced a decline in its contribution of telecom services, while this relative contribution did not decline in South Korea. Similarly, the decline in the relative contribution of telecom services in the EU-15 is not as intense as the decline in its absolute contribution in the second period. For Brazil, the absolute contribution of telecom services toward overall labor pro-
TICyPRODUCT_ingles_i_x_001_230.indb 26
30/6/11 16:53:19
1. Measuring the Contribution of ICT to Economic Growth 27 Figure 1.10. �CONTRIBUTION OF MAJOR ICT SECTORS TO AGGREGATE LABOR PRODUCTIVITY GROWTH
1995-2000
4.5
2000-2007*
4.0 3.5 3.0 2.5 2.0 1.5 1.0 0.5
il Br az
-15 EU
Ko re a
n ai
Un
ite
d
Ki
Sp
do ng
St d ite Un
m
s at e
il Br az
-15 EU
Ko re a
n ai Sp
m
do
Ki
ng
St
d
ite
Un
Un
ite
d
–0.5
at e
s
0
ICT manufacturing
Reallocation
Telecom services
Other sectors
Note: As a residual of the sectoral decomposition of labor productivity growth, we also obtain a labor reallocation factor, which indicates the resource movement from low-productivity to high-productivity sectors. Source: EU KLEMS Database, November 2009 (www.euklems.net); for Brazil, de Vries (2011).
ductivity growth has remained unchanged, but the absolute contribution of ICT manufacturing has declined.18 The ICT manufacturing sector also witnessed massive gains in MFP, which measures the growth of production over the combined contribution of all inputs, including labor, human skills, machinery, structures, and ICT capital. Figure 1.11 shows the contributions of the ICT sector to overall MFP growth. The MFP growth was especially strong in the ICT manufacturing sectors in the United States and South Korea from 1995–2000.19 Both the EU-15 and the United Kingdom also showed impressive MFP growth contributions during this period. The impressive MFP growth
18 As a residual of the sectoral decomposition of labor productivity growth, we also obtain a labor reallocation factor, which indicates the resource movement from low-productivity to high-productivity sectors. South Korea and the EU-15 had a large labor reallocation effect, indicating larger resource movement from low-productivity to high-productivity sectors. 19 Multifactor productivity growth and level measures are obtained through a growth accounting methodology modified to measure the specific effects of ICT. See, for example, Collechia and Schreyer (2001), van Ark and Timmer (2005), Jorgenson (2005) and Jorgenson and Vu (2005).
TICyPRODUCT_ingles_i_x_001_230.indb 27
30/6/11 16:53:19
The Impact of ICT on the Production of Goods and Services 28 Figure 1.11. �CONTRIBUTION OF MAJOR ICT SECTORS TO MFP GROWTH1
1995-2000
2.5
2000-2007*
2.0 1.5 1.0 0.5
Telecom services
il Br az
-15
n ai Sp
ite
d
Ki
EU
Ko re a
do ng
St d Un
ite
ICT manufacturing
m
s at e
il Br az
-15 EU
Ko re a n ai
Un
–1.0
Sp
Un ng ite do d m Ki
–0.5
St
Un
it at ed es
0
Other sectors
Source: EU KLEMS Database, November 2009 (www.euklems.net); for Brazil, de Vries (2011).
rates are associated with the rapid technological progress, related to Moore’s law, and the huge price declines that facilitated the diffusion of ICT equipment. However, MFP growth in ICT manufacturing declined in all countries during the second period, even though the United States and South Korea remained the productivity leaders. It should also be noted that the MFP growth slowdown in U.S. ICT manufacturing occurred even when total economy MFP growth improved. In all other countries, aggregate MFP growth either declined or remained more or less the same. Telecom services witnessed an improvement in MFP growth in the United States alone. All other countries experienced a slowdown yet, except for Spain, still showed positive MFP growth. South Korea had the highest MFP growth during the first period, followed by the EU-15 and the United Kingdom. In part, the high MFP growth in telecommunication services, which is one of the biggest investors in telecom equipment, resulted from the rapid price decline in advanced telecom equipment. However, it is difficult to make such a firm conclusion without a more meticulous analysis. Spain experienced negative MFP growth in telecom services during both sub-periods–it declined at -1.1 percent per year on average from 1995–2000 and at a slightly lower -0.4 percent from 2000–2007. While labor productivity growth was positive, the industry showed large increases in capital use: ICT capital per hour increased at 11.6 percent per year on average from 1995–2000 and at 5.5 percent from 2000–2007. Non-ICT capital per hour grew slightly less at 7.5 percent from 1995–2000, falling to 3.5 percent from 2000-2007. At the same time, however, telecom services in Spain did experience solid employment growth: total hours worked increased at 5.7 percent per year from 1995–2000 and 2.6 percent from 2000–2007.
TICyPRODUCT_ingles_i_x_001_230.indb 28
30/6/11 16:53:20
1. Measuring the Contribution of ICT to Economic Growth 29
1.10 ICT and telecom effects beyond ICT industries Finally, we look at the impact of a third channel through which ICT affects the economy, as identified in Section 1. This is the productivity effect, which results from an efficiency improvement in ICT use in the non-ICT producing sectors. It is where the broadest growth effects from ICT emerge, as its use is widespread across the economy. Figures 1.12 and 1.13 show two examples of economy-wide contributions of ICT capital use for the United States and the EU-15, respectively, distinguishing between manufacturing sectors (excluding ICT manufacturing), market services (excluding telecom services), and other sectors (including mining, construction and agriculture). The analysis shows that the contribution of ICT investment to output growth was highest from 1995– 2000 and was generally greater in services than in manufacturing. Since 2000, we have seen a slowdown in the contributions of all factors, from labor input (number of hours and labor composition) to output growth in the United States. Only MFP growth in the market services sector showed acceleration, but was partly offset by the negative MFP change in the “other sectors” category, on which mining and construction weighed particularly strongly (Figure 1.12). The dynamics of growth in Europe were generally weaker, with a much smaller role for ICT capital as a driver of growth and very slow MFP growth (Figure 1.13). When we examine the contribution of ICT capital and MFP to output growth by more detailed industries, we find that the largest contribution of ICT investment to growth accrued in the postal and telecom services sector, which is not surprising given the fact that this is the most intensive user of ICT equipment. Other sectors that had fairly large ICT and telecom contributions include: • • • • •
the transport and storage and trade sectors in the United States; hotels and restaurants, public administration, and other services in the United Kingdom; the transport and storage and petroleum sectors in Spain; electrical and optical equipment, financial intermediation, and transport equipment in South Korea; and the finance, real estate and trade sectors in the EU-15.
Similarly, the highest MFP growth is observed in ICT manufacturing and postal and telecom services. While the former includes telecom manufacturing, the latter is an ICT equipment-using sector. These results raise a number of new questions about the mechanisms by which the use of telecommunication equipment and ICT capital, in general, raise productivity growth in using industries, related to the distribution of productivity gains between producers, consumers, and factors of production.
1.11 Conclusions, challenges, and next steps This study examined the impact of ICT, especially of telecom investment and production, on the economic growth performance of advanced and emerging economies. The results indicate a rapid surge in ICT and telecom investments during the period 1995–2000. The trends generally slowed post-2000, following the dot-com crisis, with growth in ICT and telecom investment in advanced economies continuing, although at a slower pace. Meanwhile, emerging economies accelerated their investment growth in ICT, indicating the overall global shift in ICT activity from advanced to emerging economies. However, the rapid trends in emerging economies still largely represent a catch-up effect. Advanced economies remain at the innovation frontier of information and communication technology and, therefore, are of crucial importance for the industry’s further development and its impact on output and productivity growth. The results indicate impressive productivity performance in the ICT sector relative to the total economy and the total manufacturing sector. In particular, labor productivity growth and MFP growth in ICT manufacturing was
TICyPRODUCT_ingles_i_x_001_230.indb 29
30/6/11 16:53:21
The Impact of ICT on the Production of Goods and Services 30 Figure 1.12. C � ONTRIBUTION OF LABOR AND CAPITAL INPUTS AND MFP TO VALUE-ADDED GROWTH IN MAJOR NON-ICT SECTORS, UNITED STATES
United States, 1995-2000
Manufacturing, excluding ICT manufacturing
Market services, excluding telecom
Other sectors, including mining, construction, agriculture –1.0
0
1.0
2.0
3.0
4.0
5.0
6.0
United States, 2000-2007
–3.0
–2.0 Telecom capital
Other ICT capital
–1.0
0
1.0 Non-ICT capital Labor
2.0
3.0
4.0
MFP growth
Note: Major sectors include manufacturing, excluding electrical and optical equipment (which encompasses ICT manufacutring); market services, excluding postal and telecommunication services; and other sectors, including mining, construction, agriculture and public utlities. The contributions of inputs are weighted by the share in income in the major sector. Source: EU KLEMS Database, November 2009 (www.euklems.net).
TICyPRODUCT_ingles_i_x_001_230.indb 30
30/6/11 16:53:21
1. Measuring the Contribution of ICT to Economic Growth 31 Figure 1.13. C � ONTRIBUTION OF LABOR AND CAPITAL INPUTS AND MFP TO VALUE-ADDED GROWTH IN MAJOR NON-ICTSECTORS, 10 ECONOMIES OF THE EU-15*
EU-10*, 1995-2000
Manufacturing, excluding ICT manufacturing
Market services, excluding telecom
Other sectors, including mining, construction, agriculture –1.0
0
1.0
2.0
3.0
4.0
5.0
6.0
EU-10*, 2000-2007
–3.0
–2.0 ICT capital
–1.0
0 Non-ICT capital
1.0
2.0 Labor
3.0
4.0
MFP growth
* The 10 EU economies include: Austria, Belgium Denmark, Finland, France, Germany, Italy, the Netherlands, Spain, and the United Kingdom. Note: Major sectors include manufacturing, excluding electrical and optical equipment (which encompasses ICT manufacutring); market services, excluding postal and telecommunication services; and other sectors, including mining, construction, agriculture and public utlities. The contributions of inputs are weighted by the share in income in the major sector. For the EU-10 average, no split was possible between telecommunication equipment and other ICT capital. Source: EU KLEMS Database, November 2009 (www.euklems.net).
The Impact of ICT on the Production of Goods and Services 32 quite high, particularly during the 1995–2000 sub-period, and especially in countries like the United States and South Korea, which had comparative advantages in these sectors. However, productivity growth in these ICT industries began to slow in the post-2000 period, which is mostly in line with the total manufacturing and total economy trends. However, the ICT sector continues to witness relatively higher productivity growth compared to the total economy and total manufacturing. The contribution of telecom services to the output and productivity growth in the aggregate economy has also slowed, but has not shown similar a decline as has ICT manufacturing. The observed productivity slowdown in the ICT-manufacturing sector might be due to saturation of innovation in that sector. Such saturation is less visible in the telecom services industry. However, the slower growth rates and the larger variation among countries raise important questions about the future potential for output and productivity growth in the telecom services industry. We find some evidence of solid MFP growth in non-telecom sectors, especially in ICT-using service industries. MFP growth in these industries may be related to possible positive effects from investments in IT and telecom equipment. This aspect, however, requires more rigorous analysis on how ICT impacts MFP growth, including an analysis of the impact of policy regulations on MFP growth.20 Lower entry barriers promote MFP growth in telecom services by increasing competition. Chapter 11 contains a detailed analysis of how regulatory policy affects telecom sector performance. There is also some past evidence that cross-country differences in ICT diffusion, not just ICT production, can be more widely explained by regulatory policies or the cultural atmosphere.21 The diffusion of technology by means of increased investment is a precondition for obtaining the benefits in terms of productivity gains. The diffusion of telecom might be affected by industry composition and labor market regulations, as they could be important determinants of demand for telecom equipment and telecom services. An important gap in the current analysis of ICT on economic growth is that most studies of output and productivity effects at industry level are still mainly concerned with advanced countries. The analysis here suggests that advanced economies are likely to have shown significantly larger ICT diffusion compared to many developing and emerging countries. It is important to consider the industry effects from ICT on emerging Asian economies, like India and China, and on Latin American countries, in addition to Brazil, as these countries will be among the largest users of information technology in the coming years. The main bottleneck to the extension of the analysis to developing countries will be the availability of relevant data at the industry level. A number of sources may be exploited, including the World Bank’s and OECD’s ICT data, which provide some indicators on ICT penetration (such as telephone mainlines, Internet usage, etc.). The ongoing extension of growth accounts to Asia and Latin America are also potential sources for new data and analysis. Finally, the analysis in this chapter is largely supply-side and needs to be complemented by an analysis of demandside and distribution channels. The investments in equipment, software, and technology are made only because businesses and governments expect that they will help satisfy demands for better and cheaper goods and services. A broader study of the role of the demand side in economic growth patterns would require additional information on demand decompositions from consumers, businesses, and foreign buyers, relative price movements of ICT and non-ICT products and services, and the distribution of labor and capital compensation in ICT industries relative to the aggregate economy. This analysis will greatly contribute to making the connection to the study of social and cultural aspects of ICT, since it will help identify the beneficiaries of the new technologies and therefore assesses the potential for gaining social and cultural value that adds to the improvement of living standards.
20 See, for example, Timmer, Inklaar and van Ark (2008). 21 In addition to El Khoury and Savvides (2006), see for example Gust and Marquez (2004), and Erumban and de Jong (2006).
TICyPRODUCT_ingles_i_x_001_230.indb 32
30/6/11 16:53:22
1. Measuring the Contribution of ICT to Economic Growth 33 The next five chapters in this book give us insights into the mechanisms that drive investment and innovation and thus generate additional economic output. Chapter 2 studies the expansion of broadband services, a faster and more reliable way of connecting to the Internet than its predecessor, dial-up connectivity. Broadband has been made possible by substantial investments in equipment and in innovative software by the telecom industry, and its diffusion has been spurred by substantial price declines after its introduction. Chapter 3 shows how digital books and convenient appliances to read them have lowered the costs, and thus the prices, of delivering content to consumers, which is estimated to expand the market significantly. And both these chapters show that, in addition to revenue (the measure emphasized in this chapter), these innovations generate substantial consumer surplus, a benefit often not considered in assessing economic growth. Chapter 4 shows that ICT creates flexibility in the location of employment, allowing firms to take advantage of cost-saving changes that were not previously possible. Finally, Chapters 5 and 6 discuss how ICT can impact two important services largely delivered by governments: administrative services and health care.
Bibliography van Ark, B., Inklaar, R. and R.H. McGuckin (2002). “Changing Gear”: Productivity, ICT and Services: Europe and
the United States, Research Memorandum, GD-60, Groningen Growth and Development Centre, December.
van Ark, B., O’Mahony, M. and M.P. Timmer (2008). The productivity gap between Europe and the United States:
Trends and causes, Journal of Economic Perspectives, 22(1), 25–44.
van Ark, B. and J.P. Smits (2007). “Technology regimes and productivity growth in Europe and the United States.
A comparative and historical perspective”, in B. Eichengreen, Landesmann, M. and D. Stiefel, eds., The European Economy in an American Mirror, Routledge Studies in the World Economy, 41–61. van Ark, B., Inklaar, R. and M.P. Timmer (2008). Market services productivity across Europe and the US, Economic Policy, 25(33), 139–194. Bartelsman, E., Haltiwanger, J. and S. Scarpetta (2009). “Measuring and Analyzing Cross-Country Differences in Firm Dynamics”, Producer dynamics: new evidence from micro data, University of Chicago Press. Bresnahan, T.F., Brynjolfsson, E. and L.M. Hitt (2002). “Information Technology, Workplace Organization, and the Demand for Skilled Labor: Firm-Level Evidence”, The Quarterly Journal of Economics, 117(1), 339–376. Brynjolfsson, E. and L.M. Hitt (2003). Computing productivity: Firm-level evidence, Review of Economics and Statistics, 85(4), 793–808. Colecchia, A. and P. Schreyer (2001). “The impact of information communications technology on output growth”, STI Working Paper 2001/7, OECD, Paris. Corrado, C.A. (2010). “Communication Capital, Metcalfe’s Law, and U.S. Productivity Growth”, The Conference Board, mimeo. El Khourya, A.C. and A. Savvides (2006). Openness in services trade and economic growth, Economics Letters, 92(2), 277–283. Erumban A.A. and S. de Jong (2006). Cross country differences in ICT adoption: a consequence of culture? Journal of World Business, 41(4), 302–314. Gust, C. and J. Marquez (2004). International comparisons of productivity growth: The role of information technology and regulatory practices, Labour Economics, 11(1), 33–58. Hodrick, R., and E.P. Prescott (1997). “Postwar Business Cycles: An Empirical Investigation”, Journal of Money, Credit, and Banking, 29, 1–16. Jorgenson, D.W. and K. Vu (2005). Information technology and the world economy, Scandinavian Journal of Economics, 107(4), 631–650. Jorgenson, D.W. (2005). Accounting for growth in the Information Age, Handbook of Economic Growth, Elsevier, 743–815. Lipsey, R.G., Bekar, C. and K. Carlaw (1998). The Consequences of Changes in GPTs, in Helpman, E., ed. General Purpose Technologies and Economic Growth. Cambridge, MA: The MIT Press, 193–218.
TICyPRODUCT_ingles_i_x_001_230.indb 33
30/6/11 16:53:23
The Impact of ICT on the Production of Goods and Services 34 Timmer, M.P. and B. van Ark (2005). “IT in the European Union: A driver of productivity divergence?” Oxford Economic Papers, 57(4), 693–716. Tressel, T. (2008). Does technological diffusion explain Australia’s productivity performance? IMF working paper WP/08/4. de Vries, G.J. (2010). Economic Growth and Productivity in Brazil: an Industry Perspective. forthcoming GGDC Research memorandum.
TICyPRODUCT_ingles_i_x_001_230.indb 34
30/6/11 16:53:23
Chapter
2
The Global Broadband Bonus: Broadband Internet’s Impact on Seven Countries
TICyPRODUCT_ingles_i_x_001_230.indb 35
30/6/11 16:53:23
2
Chapter The Global Broadband Bonus: Broadband Internet’s Impact on Seven Countries Shane Greenstein (Northwestern University), Ryan McDevitt (University of Rochester)
2.1 Introduction During the first decade of this century, many householol
ing
%
%
$
o
d
rou
hout the
al u te %P oP
o
lo s
itched theiI
oadband€
he
u
ode of 4cXess
p$
2. The Global Broadband Bonus: Broadband Internet’s Impact on Seven Countries 37
2.2 The diffusion of the Internet To familiarize readers with this technology and market, we provide a picture of deployment, adoption, and revenue generation for broadband.3 This experience provides a benchmark for further analysis. The data tell a story of technology diffusion and upgrade. The diffusion of dial-up coincided with the initial use of the Internet in most households. The diffusion of broadband came a few years later and, for households in several dozen developed economies, involved an upgrade in bandwidth. During the 2003 to 2009 period, broadband service was delivered to households primarily in two forms of wireline service: cable or telephone lines. Countries differed significantly in the extent to which these different delivery channels played a role. At the end of the period, there was growing use of third and fourth delivery channels– fiber optics to the home and access through mobile modes. Some cable firms built out their facilities to deliver these services in the late 1990s, and many, especially telephone companies, waited until the early to mid-2000s. Cable modem service involved a gradual upgrade to cable plants in many locales, depending on the generation of the cable system. Broadband delivery through telephone lines involved upgrades to telephone switches and lines to make it feasible to deliver a service called digital subscriber line (DSL). Both choices typically support higher bandwidth to the household than from it–called asymmetric digital subscriber line (ADSL). Broadband has several appealing features that users experience in heterogeneous ways. In comparison to dialup service, broadband provides households with faster Internet access and access to better online applications. Broadband may also allow users to avoid a separate phone line for supporting dial-up. Additionally, broadband services are “always on”, which users perceive as a more convenient service. It is also generally faster in use. Maximum rates of 14.4K (kilobytes per second) and 28.8K were predominant in the mid 1990s for dial-up modems. The typical bandwidth in the late 1990s was 43K to 51K, with a maximum of 56K. DSL and cable achieved much higher maximum bandwidths, typically up to 750K to 3M (megabytes per second), depending on user choices and vendor configuration. Even higher bandwidth became available to some households late in this period. Many factors shape the quality of a user’s experience, such as the capacity/bandwidth of lines, the number of users in the neighborhood in a cable system, the geographic location of a system in the national grid, the frequency of use of sites with geographically dispersed servers, and the time of day at which the household performs most activities. Generalizations are hard to make beyond the obvious: broadband gives the user a better experience than dial-up access. Non-wireline services were also available during that period, primarily via satellite. These services tended to be expensive and limited, so they were not popular with most households; however, they were popular with households lacking wireline broadband. Another channel for delivering data in mobile format involved limited use of cell phone infrastructure combined with a card for laptop computers or a specialized personal digital assistant (PDA) device, such as BlackBerry®. These were used primarily to support email and texting and other low-bandwidth applications. Near the very end of our sampling period, a new set of mobile broadband services began to gain market traction with households, primarily in the form of smartphones. Though smartphones had been available in a variety of
3 For the U.S. experience, see Greenstein and McDevitt, 2009. Much of the experience for the developed and developing world economies is tracked in OECD Broadband Portal (ww.oecd.org/sti/ict/broadband).
TICyPRODUCT_ingles_i_x_001_230.indb 37
30/6/11 16:53:24
The Impact of ICT on the Production of Goods and Services 38 models for many years, it is commonly acknowledged that the category began to take off after the introduction of the Apple iPhone® in 2007. Recent reports suggest the Apple iPhone and new designs from BlackBerry dominate this product category for the time being. In the United States, broadband was available in only a few locations during the 1990s and early 2000s, but it became more widely accessible over time. User demands for high-bandwidth Internet applications (such as music downloading) increased as households became familiar with them. Firms also rolled out new services as more users acquired broadband (e.g., Web 2.0 applications), which then generated even more adoption. This is consistent with Figure 2.1, which provides a summary of the U.S. government’s efforts to collect data about the adoption of the Internet. The first survey questions about broadband use appear in 2000 and show a growth in adoption, peaking at close to 20% of households in 2003, when these surveys were discontinued for some time. Recent data about household use, collected by the Pew Internet and American Life Project, show that the diffusion continued in the anticipated direction. Adoption reached over 47% of households by 2006. The survey resumed in 2007 and the anticipated trajectory continued, with 50.8% of households having broadband in October 2007 and 63.5% in October 2009. Prior to 2002, the diffusion of broadband Internet access was very much supply-driven in the sense that supplyside issues were the main determinants of Internet availability and, hence, adoption. Most households simply switched from dial-up to broadband if they could, and they found the higher bandwidth worth the extra expense. Cable and telecom operators needed to retrofit existing plants, which constrained availability in many places. During those years, the spread of broadband service was much slower and less evenly distributed than dial-up service. Highly populated areas were more profitable due to economies of scale and lower last-mile expenses. As supply-side building has removed these constraints, demand-related factorssuch as price, bandwidth, and reliabilityhave played a more significant role in determining the margins between adopters and non-adopters. By 2006, supply-side issues began to fade, with only the most low-density parts of the country lacking suppliers.
Figure 2.1. �PERCENT OF HOUSEHOLDS WITH COMPUTERS AND INTERNET CONNECTIONS, SELECTED YEARS, 1997–2009*
80% 68.7%
70%
61.8%
60%
51%
50% 40% 30% 20% 10% 0%
56.2%
63.5%
50.8%
41.5%
36.6% 18.6%
54.6%
50.3%
42.1%
61.7%
26.2%
19.9% 4.4%
9.1%
October 1997 December 1998 August 2000 September 2001 October 2003 October 2007 October 2009 Computer
Internet
Broadband Internet
Note: 2001, 2003, 2007, and 2009 Census-based weights and earlier years use 1990 Census-based weights. Source: National Telecommunications Information Administration, 2010.
TICyPRODUCT_ingles_i_x_001_230.indb 38
30/6/11 16:53:25
2. The Global Broadband Bonus: Broadband Internet’s Impact on Seven Countries 39 Figure 2.2. �OECD BROADBAND SUBSCRIBERS PER 100 INHABITANTS, BY TECHNOLOGY, JUNE 2009
40% 35% 30% 25%
OECD average
20% 15% 10% 5%
Ne
th
er De land nm s a Sw Nor rk itz wa er y la n Ko d r Ice ea l Lu Sw and xe ed m e bo n Fi urg n Ca land Ge nad rm a Un an ite d Fra y Ki n ng ce Un B do ite elg m d ium S Au tat st es ra Ne li w Jap a Ze an al Au and s Ire tria la n Sp d Cz ai ec h I n Re ta pu ly Po bli rt c u Gr gal Sl e ov Hu ec ak n e Re gar pu y b Po lic la Tu nd r M key ex ico
0%
Fibre/LAN
Cable
Other
DSL
Figure 2.3. �BROADBAND PENETRATION, G7 COUNTRIES
35% 30% 25% 20% 15% 10%
France
Germany Source: OECD.
TICyPRODUCT_ingles_i_x_001_230.indb 39
4 05 -Q 2 20 05 -Q 4 20 06 -Q 2 20 06 -Q 4 20 07 -Q 2 20 07 -Q 4 20 08 -Q 2 20 08 -Q 4 20 09 -Q 2 20 09 -Q 4
-Q
20
04
Q2
20
20
04 -
Q4
2
20
03 -
03 -Q
Q4
20
02 -
Q2
20
02 -
20
20 01
-Q
0%
4
5%
Canada
United Kingdom
United States Japan
OECD Italy
The Impact of ICT on the Production of Goods and Services 40 A similar wave of investment occurred in many developed countries during the first decade of the new millennium. Figure 2.2 shows the subscribers per 100 inhabitants in many countries in June 2009. There is a range of adoption levels across different economies. While these numbers must be interpreted with caution, a few facts stand out. A couple dozen countries in the Organisation for Economic Co-operation and Development (OECD) have substantial adoption of broadband, and many do not. This is not surprising since countries vary in economic wealth, and GDP per capita and broadband per capita have a simple correlation of 0.67. Figure 2.3 shows the growth of subscribers per 100 inhabitants in the G7–Canada, the United States, the United Kingdom, Germany, France, Italy, and Japan–as well as the entire OECD. Though countries differ in the level of broadband use (partly due to household size and other factors), the similarities between them are more apparent. Adoption of broadband grew in all countries. To gain further insight into these general trends in this study we examine several countries in detail. Tables 2.1 and 2.2 present broadband and dial-up adoption for the seven countries covered in this study–the United States, Canada, the United Kingdom, Spain, China, Mexico, and Brazil. The broadband data in Table 2.1 come from Point Topic Ltd, a private consultancy. (For a more detailed discussion of our choice in data source, see Section 4 “Data and challenges”.) Table 2.2 provides OECD’s estimates of household dial-up adoption by year. One fact immediately emerges from the descriptive statistics in the tables, which shapes all the results below. The scale of adoption in both the United States and China far outweighs the scale of adoption in any other
Tabla 2.1. �Overall Broadband Adoption (In Thousands)
Nation
2003
2004
2005
2006
2007
2008
2009
CAGR
634
1,442
2,671
4,278
5,691
7,509
9,480
47.2%
3,706
4,829
5,809
6,982
8,001
8,860
9,528
14.4%
China
–
11,385
20,367
30,033
41,778
54,322
68,964
35.0%
Mexico
234
429
1,060
1,945
3,106
4,774
7,836
65.1%
Spain
1,401
2,524
3,444
5,469
7,322
8,296
9,023
30.5%
United Kingdom
960
3,734
7,203
10,983
13,968
16,282
17,641
51.6%
16,042
28,770
37,676
47,489
58,791
67,536
77,334
25.2%
Brazil Canada
United States Source: Poin Topic.
Tabla 2.2. �Overall Dialup Adoption (In Thousands)
Nation
2003
2004
2005
2006
2007
2008
2009
CAGR
Canada
2,846
2,381
1,876
1,437
1,088
824
624
–19.5%
Mexico
2,016
2,134
1,960
1,719
1,288
965
723
–13.6%
Spain
2,559
1,852
1,199
841
536
342
218
–29.7%
United Kingdom
10,607
9,374
6,417
4,318
2,671
1,652
1,022
–28.4%
United States
67,880
55,000
44,493
35,994
29,118
23,556
19,056
–16.6%
Source: Poin Topic.
TICyPRODUCT_ingles_i_x_001_230.indb 40
30/6/11 16:53:27
2. The Global Broadband Bonus: Broadband Internet’s Impact on Seven Countries 41 country. That occurs for two rather obvious reasons: the United States and China have much larger populations, and the general level of economic development is a major determinant of adoption.
2.3 Motivation and method The economic determinants behind the growth of broadband are straightforward: Dial-up became available first and diffused to households as a means to deliver the Internet. Broadband emerged later as a higher-quality, more expensive alternative, albeit limited in its availability. Then, over time, broadband became more reliable and more widely available, which led many households to upgrade their Internet service. There are two common approaches to measuring gains from the new good. First, what is the increase in revenue (GDP) above and beyond what would have been generated had dial-up continued? Second, what is the increase in consumer surplus beyond what would have occurred had dial-up continued? When addressing these questions, traditional approaches are not concerned about which vendor or user gains or loses. Our approach will be the same, and we will only compute an aggregate measure. We focus on revenue instead of producer surplus because we are hampered by the lack of precise information about the unit cost of provision, which is necessary for an estimate of producer surplus at each point in time. Instead, we examine the difference in vendor revenue between actual history and a hypothetical scenario without broadband, absent multiplier and general equilibrium effects–that is, we estimate how much GDP increased in the Internet access market as a result of the deployment of broadband. To measure consumer surplus ideally, we should measure the difference in “areas under the demand curves” between the actual demand for broadband and what consumer surplus would have demanded had dial-up continued and not been replaced by broadband. This is challenging to do for many reasons, but one is primary: we cannot observe what the dial-up market would have looked like had broadband not diffused. Instead of measuring two demand curves, we get close to our ideal measure by looking at estimates of user willingness to pay for the upgrade to broadband. For estimates of consumer surplus in the U.S. market, our earlier research employed a set of estimates developed from Savage and Waldman (2004), who conducted an extensive survey of dial-up and broadband users in 2002. This study had advantages because it surveyed both users and nonusers. The authors also used this survey to directly estimate “willingness to pay” measures for attributes of dial-up and broadband service, which facilitates some simple accounting of the value of broadband in comparison to dial-up for existing dial-up users. While sufficient for U.S. data, this approach has three drawbacks for a cross-country comparison. First, it is very data-intensive, requiring yearly data on both broadband and dial-up use. Second, it does not fully account for heterogeneity in household willingness to pay; it averages out such differences. Finally, to our knowledge, there are a limited number of similar estimates for demand in the United States or, for that matter, other countries. While the limited evidence suggests many similarities across countries in demand, the evidence is not large and does not come from the countries of interest. Our strategy is illustrated in Figure 2.4. Our data provide information about the deployment and use of broadband in the same country over multiple years. That facilitates a comparison over time. In most countries, nominal broadband prices remain virtually unchanged one year to the next, in spite of inflation. Hence, as household incomes keep pace with inflation, the real price of broadband and the fraction of a household budget devoted to it falls.
TICyPRODUCT_ingles_i_x_001_230.indb 41
30/6/11 16:53:27
The Impact of ICT on the Production of Goods and Services 42 Figure 2.4. �GAINS IN CONSUMER SURPLUS BETWEEN 2003 AND 2009 FROM DECLINE IN PRICE
p 2003 CS 2009 Revenue Q
This forms the basis for a feasible measurement strategy within a country. In Figure 2.4, we illustrate the difference between 2003 and 2009. As the real price falls, the demand for broadband rises. Over time, the fall in price “traces” out the demand curve. With this approach, it also is possible to trace the change in consumer surplus in a country. This approach is quite simple, an advantage for cross-country comparisons. It can also apply to any country in which the underlying premises of the model remain valid. More concretely, this model assumes that a stable set of factors determine demand, and that these same factors do not shift the demand over time, which is reasonable over short periods of time. We also do not expect large year-to-year increases and decreases in broadband demand. Fortunately, our preliminary examination of data for the United States, Canada, the United Kingdom, China, Brazil, Spain, and Mexico did not find large yearto-year increases or decreases in adoption, which suggests that the data are consistent with these assumptions. Nonetheless, we are wary that the countries with fast growth in incomes, such as Brazil and China, might depart from these assumptions if we tried to extend the study a few more years, so we remain alert for other issues. This method has another characteristic, and we consider it to be another advantage: it will result in a conservative estimate. It ignores the gains to adoption for all early adopters, for example, because it does not measure the “upper part of the triangle”–namely, it does not measure the surplus generated from households that adopted prior to 2003. This approach has two drawbacks, however. First, it requires the same data each year. As we will demonstrate below, not all countries have data about broadband that satisfy such a requirement, particularly earlier in the decade. Most of the available data also do not adjust for the quality of broadband, which most observers presume has improved over time. Second, and somewhat technically, this method measures surplus arising only from movement along a demand curve and not any shifts in demand. It acts as if all increases in volume come from price declines and nothing else. That means the method underestimates surplus that arises from a demand shift linked to, for example, an increase in GDP per capita or a fall in the price of complementary goods, such as personal computers. This feature is related to our previous remark about the framework working best in countries where incomes are not growing rapidly.
TICyPRODUCT_ingles_i_x_001_230.indb 42
30/6/11 16:53:28
2. The Global Broadband Bonus: Broadband Internet’s Impact on Seven Countries 43 Why use this framework in spite of its drawbacks? The drawbacks raise valid concerns since both factors–data constraints and rapid income growth–shape demand in rapidly growing countries, such as China and Brazil. Our answer is a practical one: income effects can be hard to measure. In addition, none of the leading research to date gives sufficient clues about a pragmatic approach to apply to a variety of countries. In addition, we are comfortable with a conservative approach (in an accounting sense) because it lets us make comparisons. There is more consumer surplus being generated than we measure, but at least we can make the comparison. This approach is also conservative in a different sense. It does not stress “indirect” benefits from broadband, a topic commonly discussed in policy debates. More concretely, though the diffusion of broadband clearly helps firms in the same country whose revenue depends on electronic commerce and advertising-supported online media, it is unclear how large such “spillovers” are. Also, increased broadband use may generate educational or civic benefits that defy economic measurement. While the size of indirect benefits could differ substantially across countries, there is no practical way to measure their size in a way that allows for meaningful comparison. That circumscribes our interpretation. We measure the economic factors considered by parties involved in a transaction–anything that shapes the perceived or anticipated costs of using dial-up, the willingness to pay for an upgrade to broadband, and/or the decision not to return to dial-up .
or su%pliers, theXe factors incl de
ness or tohouceholbs, pay for an upgrade the folloping factors shape the anticipated val e of broadband sqr
ice a d, hencp, the willino
The Impact of ICT on the Production of Goods and Services 44 information about the seven countries of interest and many more. In general, the company’s data about adoption and revenue in the United States do not substantially differ from our prior estimates for the same country. Table 2.1 shows the estimates from Point Topic for household broadband adoption for the seven countries of interest–United States, Canada, the United Kingdom, Spain, Mexico, China, and Brazil. We use Point Topic’s data for the first quarter of each year to provide a conservative analysis of the annual rate of adoption. It is conservative because adoption is growing in many countries, so a number from later quarters will be higher. Our definition of broadband Internet is also technologically conservative, as it includes DSL and cable but excludes other formats, such as mobile, primarily due to lack of consistent data for all countries. Note the key strength and limitation of Point Topic’s data. These data are a consistent source for most countries in most years. Definitions remain consistent, and so do reporting standards, which permit meaningful comparisons over time. However, Point Topic does not have complete observations for every country for every year. It only has data for the United States and Canada back to 1999, and for every country except China back to 2002. China’s data begin in 2004. To achieve consistency across countries, we begin our analysis in 2003 with the exception of China, for which we begin in 2004. Finally, we present estimates for revenue for each country for each year. Table 2.3 shows total revenue for each of the countries in terms of its local currency. It uses Point Topic’s estimate of broadband users and a price index from the major provider(s) in each country, expressed in 2009 real terms and in the local currency of the country of origin (e.g., Canadian dollars for Canada, Mexican pesos for Mexico, etc).4 Figure 2.5 shows year over year (YoY) growth rates in revenue for each country. These growth rates follow a standard pattern for a diffusing technology. During the earliest moments of diffusion, the growth rates for revenue are very high, reflecting the low base from which they start. Over time, however, growth rates approach zero, a symptom of market maturity and potential saturation. Four countries–the United States, Canada, Spain, and perhaps the United Kingdom by the end of the sample–show signs of reaching maturity in this sense. Three countries–Brazil, China, and Mexico–show the fewest symptoms of maturity. These revenue levels are important to stress because access fees generated most of the revenue during the first decade of the commercial Internet. The typical household spent more than three-quarters of its time online at Tabla 2.3. �Broadband Revenue estimate (In Thousands of 2009 Local Currency, Real Terms)
Nation
2003
2004
2005
2006
2007
2008
2009
CAGR
Brazil
1,294,154
2,581,327
4,446,171
6,677,188
8,660,612
11,959,924
11,969,980
37.4%
Canada
1,717,952
2,352,523
2,860,999
2,931,341
3,082,933
2,970,079
3,112,854
8.9%
20,472,775
35,181,958
50,961,697
69,843,624
102,868,641 105,899,025
31.5%
China
–
Mexico
1,193,741
2,055,538
4,744,069
8,380,884
12,820,374
19,811,401
29,461,214
58.1%
Spain
775,689
1,317,567
1,686,770
2,095,704
2,864,485
2,410,174
2,484,086
18.1%
237,527
971,708
1,733,031
2,588,178
3,196,210
3,357,633
3,373,604
46.1%
10,287,743
17,630,773
20,114,146
20,081,002
23,728,754
27,214,363
28,446,051
15.6%
United Kingdom United States Source: Point Topic.
4 Price indices for each country come from the CIA World Factbook.
TICyPRODUCT_ingles_i_x_001_230.indb 44
30/6/11 16:53:29
2. The Global Broadband Bonus: Broadband Internet’s Impact on Seven Countries 45 Figure 2.5. �REVENUE GROWTH RATE YoY
350.0% 309.1%
300.0% 250.0% 200.0% 150.0%
130.8% 99.5%
100.0% 50.0%
71.4%
72.2% 69.9%
36.9% 14.1%
0.0% –50,0%
72.2%
2004
78.3% 28.0% 21.6%
2005 Brazil Mexico
76.7%
71.8% 44.9%
50.2% 49.3%
24.2% 2.5% –0.2%
2006 United States Canada
Year
53.0%
37.1% 36.7% 29.7% 23.5% 18.2% 5.2%
54.5% 47.3% 38.1% 14.7% 5.1% –3.7% –15.9%
48.7% 4.8% 4.5% 3.1% 2.9% 0.5% 0.1%
2007
2008
Spain China
United Kingdom
2009
free or advertising-supported sites, devoting most of its Internet budget to access fees, not separate subscription fees for each service online.5 Although subscription-based services and advertising services started growing rapidly after 2003, the amount spent on access fees each year far exceeds advertising revenue. Advertising revenue is now growing at a more rapid pace than access fees, and it may exceed access revenue soon, but not as of this writing.
2.5 The broadband bonus in seven countries Our primary goal is to compute something equivalent to the estimate of the broadband bonus found in our earlier work–that is, we estimate consumer surplus and net gain in producer revenue (broadband revenue minus lost dial-up revenue), expressed in a single currency for comparability. These estimates are in Tables 2.7A and B, and we will discuss them at the end of this section. However, to be able to appreciate the construction and robustness of these results, we present the several intermediate steps that were taken in order to reach those final tables. Table 2.4 presents the first step to the main results. This table computes an estimate for consumer surplus in the local currency indexed to 2009 prices. It is constructed with Point Topic’s price estimates and accounts for users’ willingness to pay by assumption. As stated earlier, a decline in real prices generates consumer surplus.
5 See, for example, Goldfarb, 2004.
TICyPRODUCT_ingles_i_x_001_230.indb 45
30/6/11 16:53:30
The Impact of ICT on the Production of Goods and Services 46 Tabla 2.4. �Broadband Consumer Surplus Estimate (In Thousands of 2009 Local Currency, Real Terms)
Nation
2003
Brazil Canada China
2004
2005
76,476
242,336
424,660
112,211
97,764
201,681
–
806,324
–
2006
2007
2008
906,125
732,581
625,539
865,814
1,260,235
1,329,846
42.4%
1,428,402
2,181,531
–
19,363,619
88.8%
711,644
2009 3,365,402
CAGR 71.7%
Mexico
36,419
87,825
193,137
375,601
651,181
770,741
2,602,165
84.0%
Spain
16,203
50,210
138,113
525,808
563,560
1,392,932
1,509,804
91.1%
United Kingdom
53,702
56,982
130,308
165,953
241,067
555,307
798,209
47.0%
342,406
336,281
2,314,854
6,258,536
7,212,023
7,357,369
10,106,207
62.2%
United States Source: Point Topic.
Such declines are common in all these economies from the combination of general price inflation with flat or no growth in nominal prices for broadband. Surplus grows over time in all the estimates, but the data source shapes the level reached at any point in time. For example, Table 2.4, using Point Topic data, puts the estimates for surplus without correcting for dial-up revenue at $6.2 billion and $10.1 billion for the United States in 2006 and 2009, respectively. It is informative to compare across countries using the same methodology and data source, recognizing that each estimate is denominated in local currency, which prevents comparisons among countries. All countries are growing. This is not a surprise. When revenue and adoption grow, so does consumer surplus. The scale of growth is also not surprising, since it largely depends on the change in price levels and change in revenue. One additional comparison provides confidence in this step. Despite differences in approach and method to accommodate differences in the sources of data, the estimates for the United States in Table 2.4 are qualitatively similar to the estimates in our earlier work for the overlapping years, with some (unsurprising) differences in the timing of growth. Table 2.4 puts the total consumer surplus in 2006 at $6.2 billion, while we had estimated it to be between $8.3 billion and $10.5 billion. The estimates for Table 2.4 are generally lower than our prior estimates, which is largely due to the different methods for estimating changes in prices. Figure 2.6 converts these estimates into growth rates for each country. The figure illustrates one feature of this approach. It results in comparatively “unsmooth” changes in the size of consumer surplus from one year to the next, which the figure portrays as a substantial growth rate followed by non-growth. Such “lack of smoothness” is plausible in adjacent years in a country, but this periodicity appears to be more than we would expect. This feature suggests not placing too much emphasis on any particular estimate in any specific year. Accordingly, we focus on general trends. The next step adjusts the estimates for the replacement of dial-up by broadband, presuming that dial-up would have been available had broadband never diffused. Table 2.5 provides estimates of cannibalized dial-up revenue, using OECD’s figures for dial-up use and an estimate of the price of dial-up service, also from OECD. When available, the price survey from 2000 is used and remaining years are estimated to be the proportional rate for DSL price changes. This method is used because price estimates for dial-up in more recent years are not available from OECD. Since OECD does not provide dial-up use in China and Brazil, Tables 2.6A and B and Tables 2.7A and B present adjusted estimates for the five countries for which dial-up information is available, as well as unadjusted estimates that include China and Brazil. In this way, the reader can see what matters and what does not.
TICyPRODUCT_ingles_i_x_001_230.indb 46
30/6/11 16:53:30
2. The Global Broadband Bonus: Broadband Internet’s Impact on Seven Countries 47 Figure 2.6. �CONSUMER SURPLUS CHANGE YoY
700.0% 590.4%
600.0% 500.0% 400.0%
359.4%
300.0%
280.7% 216.9%
200.0%
209.9%
0.0%
128.7%
141.1%
100.0%
6.1% –2.1% –12.9%
–100.0%
237.6%
210.2%
2003
175.1% 119.9% 106.3% 75.2%
2004 Brazil Mexico
147.2%
170,4% 94.5% 77.1% 67.6% 27.4%
73.4% 52.7% 45.3% 38.4% 15.2% 27.3% 7.2%
2005
2006
United States Canada
Year
Spain China
130.4% 45.6% 18.4% 2.0% –19.2%
2007
43.7% 37.4% 8.4% 5.5%
2008
United Kingdom
Tabla 2.5. �Cannibalized dialup revenue Estimate (In Thousands of 2009 Local Currency, Real Terms)
Nation Canada Mexico Spain United Kingdom United States
2003
2004
2005
2007
2008
2009
451,899
790,475
780,721
928,274
903,895
958,658
29.9%
–
612,341
1,401,123
2,761,753
3,668,897
4,209,230
47.0%
264,253
644,978
972,280
926,805
947,695
636,503
631,292
13.2%
64,901
226,617
586,675
842,786
1,022,474
1,024,043
1,007,115
48.0%
2,328,896
5,936,192
8,240,000
6,138,964
6,814,296
8,137,521
9,485,053
22.2%
153,245 –
2006
CAGR
Source: Point Topic.
The estimates for cannibalized revenue in Table 2.5 vary in size across countries. It is not surprising that the United States has the largest amount of cannibalization because its dial-up industry was quite large before broadband began to deploy. Once again, these are denominated in local revenue, so it is not possible to directly compare the size of the estimates across countries. Table 2.6A derives a broadband bonus. It adds gross broadband revenue to consumer surplus and subtracts cannibalized dial-up revenue. The table uses Point Topic data and estimates, including local currencies indexed to 2009, and supplements them with OECD data for five countries. The size of the net gains follows directly from the prior tables, reflecting the scale of the components that went into them.
TICyPRODUCT_ingles_i_x_001_230.indb 47
30/6/11 16:53:32
The Impact of ICT on the Production of Goods and Services 48 Tabla 2.6A. B � roadband Bonus Estimate with Cannibalized Dialup (In Thousands of 2009 Local Currency, Real Terms)
Nation
2003
Canada
1,676,918
2,018,388
2,272,205
2,776,159
3,020,473
3,326,419
3,484,041
11.0%
Mexico
1,230,160
2,143,362
4,324,865
7,355,362
10,709,802
16,913,244
27,854,148
56.2%
Spain
527,639
722,799
852,602
1,694,708
2,480,349
3,166,603
3,362,599
30.3%
United Kingdom
226,328
802,072
1,276,664
1,911,345
2,414,804
2,888,897
3,164,698
45.8%
8,301,253
12,029,862
14,188,959
20,200,574
24,126,482
26,434,212
29,067,205
19.6%
United States
2004
2005
2006
2007
2008
2009
CAGR
Source: Point Topic.
Tabla 2.6B. B � roadband Bonus Estimate without Cannibalized Dialup (In Thousands of 2009 Local Currency, Real Terms)
Nation
2003
2004
2005
2006
2007
2008
2009
CAGR
Brazil
1,370,630
2,823,663
4,870,831
7,388,832
9,566,737
12,629,505
15,335,382
41.2%
Canada
1,830,163
2,450,287
3,062,680
3,556,880
3,948,747
4,230,314
4,442,700
13.5%
35,988,282 52,390,099
72,025,155
102,868,641 125,262,644
35.2%
China Mexico
– 1,230,160
20,472,775 2,143,362
4,937,206
7,756,485
13,471,555
20,582,142
32,063,378
59.3%
Spain
791,892
1,367,777
1,824,882
2,621,513
3,428,045
3,803,106
3,993,890
26.0%
United Kingdom
291,229
1,028,690
1,863,339
2,754,131
3,437,278
3,912,940
4,171,813
46.3%
10,630,149
17,966,054
22,429,000
26,339,538
30,940,777
34,571,732
38,552,257
20.2%
United States Source: Point Topic.
As a step toward comparing the importance of cannibalization across countries, Table 2.6B goes as far as possible without using the OECD data on dial-up. That permits us to compare all seven countries. The table adds net revenue to consumer surplus and does not subtract dial-up revenue. These are overestimates of the true broadband bonus because they do not account for what dial-up would have provided. Why make such an overestimate? It puts all countries on a similar footing, though not a similar currency. That is an intermediate step toward comparing the size of the Brazilian and Chinese experience to the other five, once we put all seven in the same real currency. Tables 2.7A and B correspond to Tables 2.6A and B but express figures in U.S. dollars, indexed to 2009. This allows for comparability across countries. Table 2.7A shows that the U.S. bonus exceeds that of Canada, Mexico, Spain, and the United Kingdom. The differences are parallel to differences in the scale of the broadband economies in each country. Table 2.7B includes China and Brazil, as well as the other countries, but does not subtract cannibalization of dialup, which follows directly from Table 2.6B. All these comparisons must be interpreted cautiously because they do not reflect the subtraction of lost dial-up revenue, but they are suggestive nonetheless. In both estimates, the size of the broadband bonus in China is large, just under half the size for the United States (before correcting for cannibalized dial-up). The size for Brazil is also quite large, though the tables do not pro-
TICyPRODUCT_ingles_i_x_001_230.indb 48
30/6/11 16:53:32
2. The Global Broadband Bonus: Broadband Internet’s Impact on Seven Countries 49 Tabla 2.7A. B � roadband Bonus Estimate with Cannibalized Dialup in U.S.D. (In Thousands of 2009 USD, Real Terms)
Nation
2003
2004
2005
2006
2007
2008
Canada
1,087,919
1,557,639
1,855,164
2,399,031
2,567,774
3,293,810
2,844,580
14.7%
Mexico
115,812
196,279
383,989
697,720
977,528
1,550,820
2,006,205
50.3%
Spain
561,318
914,936
1,121,845
2,066,717
3,221,233
4,656,769
4,424,472
34.3%
365,045
1,458,313
2,408,800
3,353,237
4,734,910
5,664,504
4,586,519
43.6%
8,301,253
12,029,862
14,188,959
20,200,574
24,126,482
26,434,212
29,067,205
19.6%
United Kingdom United States
2009
CAGR
Source: Point Topic.
Tabla 2.7B. B � roadband Bonus Estimate without Cannibalized Dialup in U.S.D. (In Thousands of 2009 USD, Real Terms)
Nation
2003
2004
2005
2006
Brazil
390,160
965,685
1,865,147
3,344,271
4,697,636
7,598,028
7,029,742
51.1%
Canada
1,187,338
1,890,946
2,500,556
3,073,695
3,356,922
4,188,844
3,627,286
17.3%
2,472,557
4,346,411
6,491,958
9,245,848
14,208,376
18,313,252
39.6%
196,279
438,356
830,628
1,229,605
1,887,231
2,309,376
53.3%
China
–
Mexico
115,812
2007
2008
2009
CAGR
Spain
842,438
1,731,363
2,401,161
3,196,967
4,452,006
5,592,804
5,255,119
29.9%
United Kingdom
469,724
1,870,345
3,515,734
4,831,808
6,739,761
7,672,431
6,046,106
44.1%
10,630,149
17,966,054
22,429,000
26,339,538
30,940,777
34,571,732
38,552,257
20.2%
United States Source: Point Topic.
vide a robust sense of this scale. According to the Point Topic data, the size exceeds the magnitudes for the United Kingdom and Spain. The size and scale of adoption is the biggest determinant of the size of the estimates for the broadband bonus. For example, consider all seven countries, even those for which there is no data on dial-up cannibalization. The correlation in 2009 between the number of adopters and the size of the bonus without cannibalization is 0.91. This suggests that many countries have gone through similar changes, similar to the changes found in the United States in this time period, and these changes are proportionate to the size and extent of diffusion within their countries. Table 2.8 presents another approach to understanding the scale of the estimates, once again continuing with estimates that do not subtract dial-up revenue. It computes the fraction of the broadband bonus stemming from consumer surplus. The calculations for 2009 are the most informative because they show the results after diffusion has progressed furthest–and, correspondingly, the distortion from lack of dial-up data is at its lowest. In most of the countries, a large part of the bonus from diffusion goes to consumers, appearing nowhere in standard GDP statistics. In Brazil, Canada, Spain, and the United States, these percentages exceed 20%, and in both China and the United Kingdom, they exceed 15%. Only Mexico shows a smaller percentage, which may be due to the early point of broadband diffusion in that country.
TICyPRODUCT_ingles_i_x_001_230.indb 49
30/6/11 16:53:33
The Impact of ICT on the Production of Goods and Services 50 Tabla 2.8. �The Proportion of Broadband Bonus Stemming from Consumer Surplus (In 2009 USD Real Terms)
Nation
2003
2004
2005
2006
2007
2008
2009
Brazil
5,58%
8,58%
8,72%
9,63%
9,47%
5,77%
21.95%
Canada
6,13%
China
3,99%
6,59%
17,59%
21,93%
29,79%
29.93%
0,00%
2,24%
2,73%
3,03%
0,00%
15.46%
Mexico
2,96%
4,10%
3.91%
4,29%
4,83%
3,74%
8.12%
Spain
2,05%
3,67%
7,57%
20,06%
16,44%
36,63%
37.80%
18,44%
5,54%
6,99%
6,03%
7,01%
14,19%
19.13%
3,22%
1,87%
10,32%
23,76%
23,31%
21,28%
26.21%
United Kingdom United States Source: Point Topic.
Table 2.8 reinforces a key point: countries with greater adoption of broadband provide their consumers with a greater benefit. Ignoring consumer surplus leads to missing a large part of the benefit of broadband to consumers.
2.6 Conclusions and future developments This research was motivated by a seemingly simple questions addressed in our earlier research.6 What consumer surplus and revenue growth was affiliated with broadband’s diffusion in seven countries, the United States, Canada, the United Kingdom, Spain, Mexico, Brazil, and China? We chose these seven countries because they vary in their circumstances, and their economies represent typical experiences in high-income and middleincome countries around the world. These two questions drew our interest because this type of economic gain from new technology is not otherwise readily visible. In general, the findings support the view that motivated our investigation at the outset. The scale of the broadband bonus for countries is comparable to the size of the broadband economies in those countries. Countries with large Internet economies, such as the United States and China, are receiving large economic bonuses from investment in broadband. Countries with smaller Internet economies, such as Canada, the United Kingdom, and Spain, receive bonuses that are small but that are proportionate to their scale of Internet use. The results for Brazil and Mexico are intriguing. In comparison with other countries, both had a later start and more recent acceleration in broadband investment. Greater potential exists in Mexico, but, as yet, that potential has not been realized. Brazil’s Internet economy appears to be growing rapidly now, which suggests a considerable broadband bonus will be generated in the near future. More broadly, we have focused attention on the gains from the diffusion of a single technology across several countries. This is clearly part of a broader worldwide trend. We conjecture that a detailed analysis of other developing countries would yield similar findings. There is nothing about our approach that is unique to broadband. A similar approach could be used for any widely diffused access technology. Thus, we look forward to parallel research, reborn with another technology and product.
6 Greenstein and McDevitt, 2009.
TICyPRODUCT_ingles_i_x_001_230.indb 50
30/6/11 16:53:33
2. The Global Broadband Bonus: Broadband Internet’s Impact on Seven Countries 51 In a few years time, we may be able to trace the gains from the deployment of mobile broadband access. We say “a few years time” because this topic comprises two markets, mobile broadband on a small screen and on a large screen. Until the latter part of the decade, demand for smartphones was primarily about demand for a phone on a PDA (e.g., Palm, BlackBerry), namely, a small screen. To some extent it was also about enabling laptop mobility, especially in business applications, i.e., a big screen. It is widely recognized that supply and household demand changed after the introduction of the iPhone in mid-2007. We will need another few years or so to see how this technology creates value in a wide set of countries and collect data about the experience. It will be tempting to perform measurements similar to those found in this paper. It might even be possible. It is very clear that 3G use has begun to grow around the world. Counting devices with 3G capability as of the 4 th quarter of 2009, Canada has 2.7 million, China has 9.4 million, Brazil 8.9 million, Mexico 3.9 million, Spain 21.9 million, the United Kingdom 30.7 million, and the United States 122.6 million.7 Most of this growth occurred in the last two years. Big-screen use is considerably lower, and, as noted, much of it is for business use, which takes it outside the consumer surplus framework of this paper. At this time, however, several issues make it difficult to infer much from a few years’ experience. First, the product category has taken considerable time to reach a stable market structure, and no observer today would call it stable enough to define a clear price for a standardized service (which can be compared over time). While Apple and BlackBerry clearly lead as of this writing, Palm, Microsoft, Nokia, and Google have come up with competitive responses, and those firms and others will continue their attempts. Such experimentation will continue as long as the executives in those firms believe demand growth will continue, which makes it difficult to be able to define the key features needed for measurement–price and quantity. Second, it is quite difficult to characterize the earliest experiences in this market as the movement down a demand curve, as our present framework interprets all such movements. Such a framework applies most readily to a setting that has clearly moved beyond its early adopters, the set of intrepid users with an enthusiasm for technology. Though the market for smartphones has reached that point in the United States and the United Kingdom, and probably in Spain and Canada, it is not clear the market has reached that point in every country. Once again, it appears it will soon, at which point measurement will be more clearly defined. Third, as of this writing, it is not clear whether the majority of users treat their smartphones as substitutes to their home broadband use. Smartphones provide additional mobility, and that might be a valuable trait in and of itself, independently of the value of broadband. If smartphones are simply additional services due to their mobility, then the exercise in this paper could be applied, and the results could be interpreted as the “value of mobile broadband”. If the additional services are, however, partial substitutes, then estimation would need to incorporate how much wireline broadband smartphones have replaced, looking for the net gain in using smartphones above and beyond using broadband lines. Without such an adjustment, any estimate would overestimate the gains to smartphones. One last issue is particularly vexing for measuring smartphone use, namely, the vague boundaries between home and business use. Notions of consumer surplus will not apply well if a sizeable set of buyers are business users. With wireline broadband, this is less of an issue because the destination of the location for Internet access largely identifies its buyer (home or business). Smartphones, however, sell both to the home and business markets, and any estimate of consumer surplus would need to have clear information about the bright line between these customers. These issues should not deter further measurement. Rather, it suggests the discussion remains far from closed. Because mobile broadband is leapfrogging fixed broadband in certain emerging economies, mobile broadband
7 Wireless Intelligence, as of February 2010.
TICyPRODUCT_ingles_i_x_001_230.indb 51
30/6/11 16:53:34
The Impact of ICT on the Production of Goods and Services 52 may be the first broadband experience for many people. It is not clear whether mobile broadband substitutes or complements fixed broadband, and the extent of substitutability could vary substantially by country, according to each country’s stage of infrastructure development. We foresee numerous challenges extending these results to the next generation of mobile broadband. That should motivate further interest in the topics covered in this article, and in approaches related to them. We look forward to such efforts.
Bibliography Atkinson, R.D., Correa, D.K. and J.A. Hedlund, 2008. Explaining International Broadband Leadership, May 1 (www. itif.org/index.php?id=142). Brussels Round Table, 2006. Restoring European economic and social progress: unleashing the potential of ICT, Annexes to Main Report, Indepen, Diespeker Wharf, 38 Graham Street, London, UK, N1 8JX. Cardona, M., Schwarz, A., Yurtoglu, B.B. and C. Zulehner, 2008. “Demand Estimation and Market Definition for Broadband Internet Services.” Mimeo. University of Vienna. Crandall, R., 2005. “Broadband Communications”, in Handbook of Telecommunications Economics, Cave, M., Majumdar, S. and I. Vogelsang, eds. Amsterdam, The Netherlands; Elsevier. 156–187. Crandall, R.W., Sidak, J.G. and H.J. Singer, 2002. “The Empirical Case Against Asymmetric Regulation of Broadband Internet Access.” Berkeley Law and Technology Journal 17 (1): 953–987. Goldfarb, A., 2004. “Concentration in Advertising-Supported Online Markets: An Empirical Approach.” Economics of Innovation and New Technology 13(6): 581–594. Greenstein, S., and R. McDevitt, 2009. “The Broadband Bonus: Accounting for Broadband’s Impact on U.S. GDP”, National Bureau of Economic Research Working Paper 14758 (www.nber.org). NTIA (National Telecommunications and Information Administration), 2010. “Digital Nation: 21st Century America’s Progress Toward Universal Broadband Internet Access” (www.ntia.doc.gov/reports.html). —, 1995. “Falling Through the Net: A Survey of the ‘Have Nots’ in Rural and Urban America.” Accessed March 17, 2006 (www.ntia.doc.gov/reports.html). Pereira, P. and T. Ribeiro, 2006. “The Impact on Broadband Access to the Internet of the Dual Ownership of Telephone and Cable Networks.” Mimeo. Rappaport, P., Taylor, L. and D. Kridel, 2003. “Willingness to Pay and the Demand for Broadband Services, in (Ed), Allan L. Shampine, Down to the Wire, Nova Science Publishers Inc.; Hauppauge, NJ. Rosston, G., 2009. “The Rise and Fall of Third-Party High Speed Access.” Information and Economic Policy, 21(1), 21–33. Rosston, G., Savage, S.J. and D. Waldman, 2010. “Household Demand for Broadband Internet Service”, SIEPR Discussion Paper 09-008, Stanford University (siepr.stanford.edu/publicationsprofile/2109). Savage, S. J. and D. Waldman, 2004. “United States Demand for Internet Access.” Review of Network Economics 3(3): 228–247. Wallsten, S., 2009. “Understanding International Broadband Comparisons 2009 Update”, Technology Policy Institute Working Paper (ssrn.com/abstract=1434570).
TICyPRODUCT_ingles_i_x_001_230.indb 52
30/6/11 16:53:34
Chapter
3
Who Captures the Benefits of ICT? The Case of Digital Books
TICyPRODUCT_ingles_i_x_001_230.indb 53
30/6/11 16:53:34
Chapter
3
Who Captures the Benefits of ICT? The Case of Digital Books Janet Hao (The Conference Board), Randall Weiss (The Conference Board)
3.1 Introduction The development of digital technology and the expansion of broadband are driving the most disruptive changes the book publishing and retailing industries have undergone in their 500-year history, and the pace of change is accelerating. Brick-and-mortar bookstores long dominated the retailing of books until Amazon.com, BarnesandNoble.com, and other Internet retailers entered the scene in the 1990s. In 2003, Internet retailers accounted for 12.7 percent of new book sales and 67 percent of used books. The next transformative wave is washing over the industry now in the form of digital books, or eBooks, and specialized devices known as eBook readers, or eReaders, to store and read digital books. An eBook is a book offered for sale in a digital format. From 2002 to 2009, the sale of digital books in the United States grew by an annual average of 71 percent, from $7.3 million to $313 million (Figure 3.1). In contrast, sales of mass-market paperbacks, the product we deem most comparable to the eBook, fell by 2.2 percent annually, from $1.2 billion to $1 billion, during the same period.
3.2 Division of benefits from innovation Digital books provide an excellent opportunity to examine who benefits from a new technology. First, new information and communication technologies (ICT) create gains to be divided among customers, writers, publishing houses, and retailers. These gains stem from a reduction in the production costs of books (printing, binding, and other direct costs) of about 27 percent.1 Second, ICT allows new business models to evolve and changes the market power of the different players. The distribution of market power determines how players divide the benefits. From the perspective of an individual firm, understanding such factors is critical to remaining competitive. A firm that does not exploit new technologies to cut costs, reach a larger consumer base, and improve productive efficiency risks losing its market share and falling behind its competitors. From the perspective of a social planner or policymaker, such an evaluation is important in gauging the potential economic and political constraints on these new technologies in the future. Teece (1986) reviews many cases in which the creators of technological innovations reaped little benefit from their innovations.2 He concludes that three elements determine who benefits: “appropriate regime”, “complementary assets”, and the “dominant design paradigm”. Appropriate regime is the business and legal environment that determines how difficult it is for a firm to protect its innovation in the form of a patent or a trade secret. Complementary assets determine how benefits are divided along the supply chain. Suppliers of generic
1 HM Publishing Corp., 2005. 2 For example, Electrical Musical Industries (EMI) created the EM1 CAT scanner, the greatest breakthrough of radiology since the discovery of X-rays. EMI lost market share of the CAT scanner within six years and dropped out of that business two years later.
TICyPRODUCT_ingles_i_x_001_230.indb 54
30/6/11 16:53:35
3. Who Captures the Benefits of ICT? The Case of Digital Books 55 Figure 3.1. �Sales of digital books in the United States
350
313
300
$million
250 200 150
113
100 50 0
7
20
30
2002
2003
2004
44
54
2005
2006
67
2007
2008
2009
Source: Association of American Publishers.
assets usually gain less than suppliers of specialized assets. A dominant design paradigm emerges when an innovation is mature and competition shifts from product design to price. Using the analytical structure of Teece (1986), authors Dedrick, Kraemer and Linden (2010) examine two new products released in 2005, the Apple iPod® and the HP Compaq nc6230 notebook. They use “teardown” reports to examine the composition of each product, and use company financial statements to estimate the profit gained from each composition. The authors argue that Apple captured a large share of the value of the iPod, while HP captured a small share of the value of the nc6230 notebook. In contrast to HP, Apple marketed its iPod before a dominant design paradigm emerged for digital music, controlled content delivery (iTunes Music Store®) and brand-specific accessories (external devices using iPod’s “dock” connector), and internally developed the highly specialized software of iPod and iTunes®.
3.3 Media industry transformation The impact of technology on media industries is not restricted to the book publishing industry; newspaper and magazine publishers, as well as the movie and music industries, are undergoing a massive transformation that is upsetting the processes those industries had used for decades. Traditionally, the creation, production, and delivery of content in these industries included most or all of the following steps: 1. 2. 3. 4. 5. 6.
Content creation by an author or artist. Selection and editing of author or artist output. Bundling of individual pieces into a suitable format, whether book, newspaper, or album. Printing or producing the product. Advertising and marketing. Delivery to the consumer.
Each industry had its unique path from content creation to final sale. The newspaper and magazine industries typically dominated every step of their own process–from reporting and writing to the delivery of the finished
TICyPRODUCT_ingles_i_x_001_230.indb 55
30/6/11 16:53:36
The Impact of ICT on the Production of Goods and Services 56 product. In the music and book publishing industries, writers and performers who created content were typically distinct from publishers that selected and edited the content, bundled it into the proper format, and produced the product, which was then sent to independent retailers for sale to consumers. Digital technology and broadband have already reduced costs and created new marketplace pressures at every step of this process In the first phase of technology’s impact, online retailing substantially reduced the value created in steps 5 and 6, although it also created new opportunities for retailers to control the format of content delivery (e.g., digital books that can only be read on a dedicated device). As broadband became more prevalent, content creators could skip steps 2 and 3 entirely and apply step 4 by themselves at little cost, thus putting pressure on the companies that traditionally performed steps 2 and 3. For example, in the music industry, online delivery of individual tracks eliminated production companies’ benefits from step 3 (bundling tracks into albums), leaving the value of their other functions (recruiting and selecting talent, production, distribution, and marketing) subject to increasing competition. For magazine and newspaper publishers, book publishers, and music producers, the ability of individual bloggers, authors, and musicians to deliver content directly to consu mers leads to a direct marketplace measure of the value they create by recruiting, selecting, training, and editing talent. Indeed, because of vastly increased access and lowered costs, much of the content available online is created by users themselves. Furthermore, media industries continue to struggle with technology’s impact on revenues from advertisers and end users. But the opportunities and challenges that will be created for the book publishing industry are only just beginning to emerge. It may take as much as a decade for the book industry’s new paradigm to become fully formed, but there is little doubt that the changes created by the digitization of books will be profound. The most immediate battle–one in which not all the eventual combatants have yet entered the fray–centers on which platforms publishers and readers will choose to consume digital books. Amazon and its dedicated Kindle eBook reader launched the eReader revolution, but now Amazon faces mounting competition from other dedicated eReaders, including one from Sony. Sony represents the leading edge of companies traditionally not involved in marketing and delivering content, such as hardware manufacturers and some of the world’s largest telecommunications companies, that are attempting to gain a strong foothold in this market. But the greatest challenge will come from much more versatile tablet computers, with Apple’s phenomenally successful iPad® leading the charge. Unlike Kindle and some other eReaders, which lock readers into purchasing eBooks only from specific sources, such as Amazon, tablet computers permit purchases from a variety of sources. One unanswered question is whether closed platforms that require publishers to produce books in different electronic formats can survive against open platforms. Content, too, will change radically as eBooks become more sophisticated software products. Interactivity will become a big part of the appeal of eBooks, especially those with tie-ins to movies, television programming, or computer games that allow bundling of content in both digital and physical products. The textbook market, a somewhat specialized and lucrative niche within the overall book publishing industry, may well find that its customer base of techno-savvy high school and college students enables textbooks to make the transition from hardcover or paperback editions to fully digitized editions more quickly than general fiction and nonfiction. Whatever the eventual outcome, it is clear that the once-staid book publishing industry, long accustomed to genteel competition among its members, will be battling an array of new and powerful competitors seeking a share of what is likely to become a more robust and vibrant market. In this chapter, we use two perspectives to analyze how different parties divide the benefit of digital books in the U.S. market. The first is a benchmark estimate of the outcome of a hypothetical long-term situation in which digital books replace all paperback books. It measures the size of the pie to be divided among producers and consumers. We treat digital books in the same way as any new technology that lowers the costs of paperback books, and assume that digital books do not change the market power, as a group, of the players involved in sup-
TICyPRODUCT_ingles_i_x_001_230.indb 56
30/6/11 16:53:36
3. Who Captures the Benefits of ICT? The Case of Digital Books 57 plying books to consumers. Under these assumptions, we estimate that digital books will increase consumer surplus by 16.6 percent of current book revenues and will increase producer surplus by 13.4 percent of current book revenues. Using current market size as a benchmark, for the $9.16 billion market of paperback trade and mass-market books, digital books will increase consumer surplus by $1.52 billion and will increase producer surplus by $1.19 billion. The second perspective does not provide a quantitative estimate. Rather, it provides a snapshot of what the market is at the moment and provides insights into how the market may develop as digital books continue to become more popular. We estimate that publishers have currently benefited as much as 13 percent of the list prices of print books. On average, Amazon has profited equally from digital books and paperback print books and, in addition, has made $73 to $213 from each Kindle digital reader. Although consumers pay less for digital books than print books, they have to pay a high, albeit declining, price for digital readers. We argue that the division of benefit will change if and when Amazon or other Internet retailers establish the dominant design paradigm of digital books.
3.4 Overview of the book publishing and retailing industry The major players in the book industry are writers, publishers, wholesalers, retailers, and consumers. The book industry has a hollow structure, with a large number of small players and a small number of large players. A small number of writers account for a large portion of book sales. In 1994, for example, over 70 percent of total fiction sales were accounted for by just five authors: John Grisham, Tom Clancy, Danielle Steel, Michael Crichton, and Stephen King.3 Writers are generally represented by literary agents, who use their contacts and knowledge of the industry to increase the chances an author will find a publisher, albeit for a fee of around 15 percent of the author’s royalties. The publishing industry has a large number of small publishing houses, a small number of large publishing houses, and relatively few midsize publishing houses. Of roughly 2,600 publishers, 50 receive 80 percent of industry revenue, according to Hoover’s industrial profile.4 Larger companies enjoy greater economies of scale and advantages in bidding for authors and new manuscripts. Retailers range from small independent book stores to big box chain retailers like Barnes & Noble and online retailers epitomized by Amazon.com. In the 1970s, big bookstores provided systematic book discounts that took a toll on the number of small independent bookstores and forced the remaining small stores to improve service or to specialize in niche subjects. Beginning in the 1990s, online retailers posed a new competitive threat to both small and large bookstores. The biggest online book retailer in the world is Amazon.com, currently offering consumers more than 17 million different titles and versions of books, including hard cover, paperback, textbooks, and used books. Technology has profoundly changed the book industry at every level, from authors to publishers to retailers and consumers. For authors, technology reduces the traditional role of publishing houses. Traditionally, authors relied on publishing houses to publish their books. With new technology, authors can now publish their books in digital form through companies like Smashwords Inc. and receive significantly higher royalties than traditional publishing houses, although authors do not enjoy the distribution network of a large publishing house. In Mex-
3 Greco, 2005. 4 Source: Hoover’s website (www.hoovers.com/industry/book-publishing/1462-1.html).
TICyPRODUCT_ingles_i_x_001_230.indb 57
30/6/11 16:53:36
The Impact of ICT on the Production of Goods and Services 58 ico, La Tortilleria Editorial acts as a cooperative for authors, with a database, software, and a website that allow members to print and sell their own books. For publishing houses, the digital revolution lowered printing costs, improved information flow, and decreased the number of unsold books. The old printing process used photolithography, incurred large fixed costs associated with each print run, and was inefficient for short print runs. Indeed, rather than set up for a short run of a book that was estimated to have a relatively small audience, a publisher would print a large run and simply destroy the unsold books. The computerization of printing lowered the fixed costs and made the short print runs more efficient, resulting in fewer unsold books. The advent of digital books has pushed these trends even further. For retailers, the implementation of computer checkout systems and sophisticated enterprise software permitted real-time information on the quantity of the books sold and the geographical distribution of sales, as well as background information on customers. Online retailers provide customers with recommendation lists, book reviews, and images of book pages. Customers can easily find the books they want and learn about other books they may like.
3.5 Research method and data We do not consider digital books as new goods, but rather a new way to convey the same content. We assume that digital books are perfect substitutes for paperback books. That assumption is conservative and will probably underestimate how much digital books increase consumer and producer surplus. For example, digital books create new sales of print books by increasing the visibility of the print versions. Moreover, lower prices and the increasing quality of eReaders like Kindle and iPad may make reading books more convenient for consumers and, thus, increase total demand for books. We use data on paperback books to estimate the relationship between cost reduction and price reduction and between price reduction and sales expansion. Unfortunately, Amazon releases no information on sales of Kindle digital books, which, for now, are the predominant type of digital books. We base our analysis on price and sales data on books in The New York Times® weekly bestsellers list. The basic data are the August 2009 Amazon.com prices and sales rank for 981 bestsellers, according to The New York Times. The specific titles include all that appeared on the bestseller lists from June 1, 2008, to August 16, 2009. We focus on paperback bestsellers, as they are priced most comparably with digital books, and examine a wide array of data, including: • • • • • • • •
the number of pages of a paperback; its Amazon sales rank; author; publisher; list price; Amazon’s selling price; the selling price of a Kindle book; and the selling price on Amazon.com of a used book.
List price is the price printed on the books, set by publishers. The list price of a paperback averages $11.59, with a minimum of $4.99 and a maximum of $30.00 (Table 3.1). The Amazon retail price of a paperback book averages $9.54, with a minimum of $4.86 and a maximum of $25.95. The price of a Kindle book averages $7.87, with a minimum of $2.87 and a maximum of $9.99. Retail price is on average 82 percent of list price, Kindle price is on
TICyPRODUCT_ingles_i_x_001_230.indb 58
30/6/11 16:53:36
3. Who Captures the Benefits of ICT? The Case of Digital Books 59 average 68 percent of list price, and used price is on average 22 percent of list price. In our sample, books average 398 pages. The shortest book has 96 pages, and the longest book has 1,104 pages. Averaging the sales rank of each author’s book in our sample, we find that 26 percent of authors rank in the top 10,000 for sales, and we define those authors as “famous authors” for the purpose of regression analysis.
3.6 Benchmark estimate of consumer and producer surplus Consumer surplus is the difference between price and willingness to pay. Producer surplus is the difference between price and costs. We do not estimate total consumer or producer surplus generated by books. Instead, we estimate the extent to which digital books will change surplus. We assume that the value of convenience is exactly equal to the cost of the digital reader, so the difference between the digital and paperback prices accurately measures how much the new technology benefits consumers. We treat digital books in the same way as any new technology that lowers production costs. Since digital books lower production costs, prices drop and sales increase. Consumer surplus increases because prices drop and sales increase. Similarly, producer surplus increases because costs drop and sales increase. To estimate the increase in consumer and producer surplus, we need data on existing sales, change in costs, change in price, and change in quantity. We estimate change in price using a cross-section regression of price against costs, and we estimate change in sales using a regression of the number of books sold against price. A typical breakdown of the costs of producing a book is shown in Table 3.1. Price changes because digital books reduce production costs, as shown in Figures 3.1A and B. Part of the cost reduction passes through as price reduction. We use our data to estimate the share of cost reduction that will pass through as price reduction. We look at the supply side (authors, publishers, and retailers) as a whole, and model the relationship between costs and retail prices. The costs include those related to authors (royalties), publishers (editing, printing, binding, marketing, managing, and other costs), and to retailers (shipping, storing, and other costs). We approximate relative costs using relative list prices. The Bookseller Association showed that publishers sell books to retailers at around 45 percent of list prices and usually make a profit of 5 percent of list prices. List price is also a function of the bargaining power of publishers and authors. Some publishers bargain better than others
Tabla 3.1. �Summary statistics
Max.
Mean price as % of list price
Variable
Mean
Std. Dev.
Min
List price
11.59
4.22
4.99
30.00
n.a.
New paperback price
9.54
2.20
4.86
25.95
82%
Kindle book price
7.87
1.79
2.87
9.99
68%
Number of pages
398
137
96
1,104
n.a.
Sales rank
83,053
172,727
8
2,133,468
n.a.
Author’s avg. sales rank F R-squared = 80.3079 Adj R-squared = 80.2745 Root MSE = 82.2591
MS
Coef.
Std. Err.
t
P>|t|
–1.468644 –3.49e-06 .0087334 –.037539 1.823524
.6708716 .0000205 .0020984 .0152102 1.034692
–2.19 –0.17 4.16 –2.47 1.76
0.031 0.865 0.000 0.016 0.082
[95% Conf. Interval] –2.802981 –.0000442 .0045597 –.0677914 –.2344377
–.1343077 .0000373 .0129071 –.0072865 3.881485
Note: The model was estimated for an unbalanced panel of 32 countries between 2005 and 2008, which allowed the use of pooled data. The main data source was the OECD broadband portal, which supplies information of Fiber to the Home (FTTH) connections as a percentage of the total broadband connections since 2006; it was complemented with IDATE data. The source of local loop unbundling (LLU) data, defined as a dummy variable indicating whether such a policy was in place, was the OECD and the ITU regulatory database for the years 2005 to 2009. The source of GDP per capita (GDP) was the IMF (2005–2008), while the source for population density (DENSIDAD) was the OECD and WDI.
According to the model results, unbundling local loops is negatively related, at a significant level, to the penetration of fiber to the home. Consistent with other research findings, platform-based competition acts as a stimulus for investment in forward-looking technologies. Furthermore, as might be evxpected, population density is positively linked to fiber deployment. Higher density raises the rate of return on capital investment because it
5 The platform-based competition model is based on competition between vertically integrated operators that manage their own network infrastructures and have sufficient standalone capacity for investment and innovation. The classic example of interplatform competition is the cable TV operator that supplies services such as audiovisual content distribution, broadband access, and telephone services in direct competition with a telecommunications operator that supplies the same services. Interplatform competition stands in contrast to service-based competition, defined as the model in which industry players without infrastructure deliver services to the market by leasing capacity from an incumbent network operator at a regulated wholesale price. By gaining access to the dominant operator’s infrastructure at a regulated wholesale price or through sharing agreements, new entrants can enter the market and set themselves up as viable competitors.
TICyPRODUCT_ingles_i_x_001_230.indb 217
30/6/11 16:54:50
The Impact of Public and Regulatory Policy on ICT Sector Performance 218 allows a larger number of customers to connect to the newly deployed network. Finally, the pricing of broadband services is negatively related to fiber deployment. If pricing is an indicator of competitive intensity, the lower the retail prices of broadband, the less incentive there is to deploy FTTH because, at lower average revenue per user, the net present value of the fiber project diminishes.6 The following case studies from Korea, Japan, and Sweden validate the findings of the statistical analysis. They reveal that while the three countries have loop unbundling regimes, it was only when competition between infrastructure players developed that the incentive for deploying broadband and fiber in the loop was stronger. Korea Broadband was initially developed in Korea through platform-based competition rather than through the unbundling of access (service-based competition). Broadband service was introduced in Korea in 1998 when Thrunet, a cable TV operator, launched its service. Subsequently, other operators (Dreamline, SKT, and Onse) entered the market by leasing infrastructure from other cable TV operators. In 1999, Hanaro, an alternative carrier that was competing with Korea Telecom for local telephony services, entered the broadband market through ADSL and cable modem platforms. This led Korea Telecom to replace its original ISDN platform with ADSL. In 2002, after platform competition had developed and at the same time that the privatization of Korea Telecom was concluded, the government introduced legislation aimed at unbundling the local loop to lower the costs for new entrants. This led to the entry of numerous competitors, which triggered hypercompetition that led to price wars and product commoditization. These competitive dynamics led three of the top four market share leaders to face financial and operating shortfalls. In 2003, Thrunet and Onse filed for bankruptcy, while Hanaro was actively searching for alternative investment sources. At this time, the government intervened actively in the process, which resulted in the consolidation of players into a small number of vertically integrated operators. Japan Regulators in Japan have defined rules for a service-based competition model that could serve as a framework to develop broadband. In 2000, new competition policies regarding collocation and unbundling rules were implemented to open up bottlenecked facilities to other competitive carriers. Based on this decision, competitive providers to NTT, the incumbent, were able to gain access at a low cost to copper lines to the customer premises and metropolitan fiber connections between the incumbent’s central offices. The net result of this policy was the growth of the unbundling industry and the drop of NTT’s share of the retail ADSL market to 38 percent by March 2007. Nevertheless, the impact of unbundling on broadband deployment was primarily limited to ADSL service over copper lines. In 2001, the Japanese telecommunications market entered a major consolidation phase. This led to horizontal integration via convergence of transmission platforms around IP-based networks, combined with vertical integration across the four layers of the competition model.7 This process of consolidation led to the emergence of strong vertically integrated providers, which triggered platform-based competition around fiber infrastructure. K-Opti.com (a subsidiary of the Kansai Electric Power Company), STNet (a subsidiary of the Shikoku Electric Power Company), and many large cable TV operators started deploying and operating fiber-based facilities in direct competition with NTT. As a result, facilities-based competition in fiber-enabled broadband is currently prevalent in all large metropolitan areas.8
6 This finding runs counter to the conclusions of the study by the Berkman Center for Internet and Society, Next Generation Connectivity: A Review of Broadband Internet Transitions and Policy from Around the World (October, 2009), though it is consistent with the comments made by Robert W. Crandall, Everett M. Ehrlich, and Jeffrey A. Eisenach, Declaration Regarding the Berkman Center Study (NBP Public Notice 13), November 16, 2009. 7 Among the transactions, this process comprised acquisitions by the KDDI group (Yozan, Powered.com, 3 Tu-ka companies, and the Tokyo Electric Power Company’s FTTH business) and by Softbank (Vodafone and Japan Telecom, as well as Cable & Wireless IDC group). 8 This is facilitated by such exogenous factors as population density and the fact that the aerial deployment of fiber on the last mile is permitted in Japan, which substantially reduces the cost of the overbuilt infrastructure.
TICyPRODUCT_ingles_i_x_001_230.indb 218
30/6/11 16:54:51
11. The Impact of Public and Regulatory Policy on ICT-Sector Performance 219 Sweden, Platform-based competition has been driving innovation and investments in broadband in Sweden. Initially, the combination of an open-access model on a copper network (ULL) with cable competition drove broadband penetration. This resulted in dynamic efficiencies from more broadband application and services, which created, in turn, a continuous increase in broadband capacity. In this context, fiber to the home became the natural next step, whereby continuous investment remains critical for a platform-based competition scenario. Beyond municipalities and alternative carriers, fiber deployment by the incumbent was triggered by competitive activity. Until recently, TeliaSonera, the incumbent, had not tackled a major fiber roll-out, with the exception of scattered collaborative municipal projects. The carrier originally introduced ADSL2+ capable of delivering up to 24Mbps. Increasing demand for even higher speeds, especially for HDTV, and Telenor/municipalities fiber investment drove TeliaSonera to begin deploying the new platform. In sum, both the statistical analysis and the case studies indicate that platform-based competition remains the most powerful incentive to stimulate the deployment of an advanced broadband infrastructure.
11.6 Moderate Consolidation and Product Innovation In a separate inquiry, we attempt to identify the characteristics of an industry structure and competition model that maximizes product innovation. While competition is needed to lead carriers to search for advantages through product differentiation, there appears to be a level of competitive intensity beyond which the incentives to invest and deploy advanced products diminishes. To test this hypothesis, we built a model to explain the rate of adoption of mobile Internet. Mobile Internet was chosen because it represents the next frontier of product innovation in the ICT sector. Mobile Internet includes several supporting platforms–from wireless broadband (3G, HSPA, LTE) to innovative devices (Blackberry, iPhones) to a range of applications/stores offered by providers like Apple, Nokia, Microsoft, and other providers. According to this model, the rate of adoption of mobile Internet (measured by the percentage of mobile industry revenues derived from these services) is a function of market structure (i.e., the degree of market consolidation and competitive intensity), a range of regulatory policies (from institutional variables such as the degree of regulatory independence to regulations such as number portability), and a set of control variables, including GDP per capita, size of target market, and level of urbanization.9 We hypothesize that: 1. In competitive markets, consolidation increases incentives for innovation. According to the research literature in industries other than telecommunications, high levels of competition could promote a greater focus on measures aimed at yielding operating efficiencies and reducing costs.10 On the other hand, lower levels of competition as a result of strategic alliances or consolidations could reduce the risk of innovation initiatives. 2. Certain sector and nonsector specific policies and regulations affect incentives to innovate: • Policies oriented toward reducing customer switching costs (e.g., number portability) will stimulate innovation in order to preserve loyalty and reduce churn.
9 The model is estimated from panel data on 42 countries between 2002 and 2008. The source of the dependent variable (percent of revenues derived from mobile data), used as a proxy for level of innovation in a given market, is the Merrill Lynch Mobile Matrix. The Herfindahl-Hirschman Index was calculated using the market share contained in the same database. The main source for the regulatory data was the ITU Regulatory Database. Regarding the control variables, the per capita GDP source is the IMF, the Index of Economic Freedom is derived from the annual report provided by the Heritage Foundation, and the urban population index and the population between 15 and 64 were gathered from WDI databases. 10 Nicholls-Nixon & Woo, 2003; Rothaermel & Deeds, 2004; and Shan, Walker, & Kogut, 1994.
TICyPRODUCT_ingles_i_x_001_230.indb 219
30/6/11 16:54:51
The Impact of Public and Regulatory Policy on ICT Sector Performance 220 • A regulator perceived as not being sufficiently independent from the government will reduce the incentive to innovate because a successful differentiation strategy could lead to asymmetric pressures (e.g., the renegotiation of licenses, artificially set price caps). • Sector restrictions to FDI (trade, corruption control, etc.) could result in limited willingness to innovate. 3. These policy variables notwithstanding, companies will invest in markets with a higher demand profile, which, therefore, is a control variable. To test the first hypothesis, a piecewise specification was introduced for the Herfindahl-Hirschman Index, a commonly accepted measure of market concentration that is calculated by squaring the market share of each firm competing in the market and then summing the resulting numbers. The statistical specification uses a logarithmic function to render this model linear. The dependent variable (REVDATA) is the percentage of revenues derived from mobile broadband. Market share is measured using the HHI for the mobile industry with a piecewise specification to allow for the effects to vary by the level of the index. LHHI1 indicates markets where the HHI is under 0.3600, and LHHI2 indicates markets where the concentration level is equal to or greater than 0.3600. Four policy and regulatory variables are included: IDMC: indicator of regulatory independence in a given country MNP: dummy variable indicating the existence of mobile number portability NMPY: years since mobile number portability has been enacted OWNCAP: indicator of foreign ownership restrictions in wireless service provider Four socio-demographic variables are included: GDP: GDP per capita (measured in US$ PPP) EF: index of economic freedom URBAN: urbanization index POP: percentage population between 15 and 64 years of age
Figure 11.8. �PANEL DATA ESTIMATION–FIXED EFFECTS
Revdatait
Coef.
Std. Err.
P>|t|
LHHI1it LHHI2it MNPit NMPYit LDGPit LEDlit LUrbanit LPOPit IDMCit Cons
0.4957 1.4812 0.1216 0.0575 1.4016 –0.4188 3.3711 7.1762 0.0510 –58.8322
0.2999 0.4821 0.0675 0.0170 0.3206 0.6240 1.4740 3.6486 0.0407 14.5801
0.0990* 0.0020*** 0.0730* 0.0010** 0.0000*** 0.5030 0.2030** 0.0500* 0.2130 0.0000***
Sample 282 Periods 7 Observations 43 R^2 0.6274 F-test 23.2 (0.0000) Heterocedasti 110,000 (0.0000) Wald X^2 (43)
*10 percent significance level. **5 percent significance level. ***1 percent significance level.
TICyPRODUCT_ingles_i_x_001_230.indb 220
30/6/11 16:54:51
11. The Impact of Public and Regulatory Policy on ICT-Sector Performance 221 The model analysis led to several conclusions: • Market concentration is directly linked to innovation Consolidation provides operators with a higher certainty of potential returns on investments in wireless data development.11 • Mobile number portability and years of policy since enactment are directly linked to innovation Portabili ty does not necessarily lead to churn, but the threat of churn provides, as was hypothesized, an incentive for operators to innovate in products in order to build loyalty. • Regulatory independence and innovation are not significantly linked In the mobile industry, the market is driving innovation and the degree of regulatory independence is not an important variable in explaining new product development. • All socio-demographic variables are directly and significantly linked to innovation Market potential is a critical variable driving innovation. Innovation in wireless Internet appears to be driven by two public policy factors. First, a moderate amount of competition is required to stimulate innovation. Policy initiatives aimed at fragmenting the structure of supply beyond an optimal level will have a negative influence on the degree to which operators will innovate in products and services. Aggressive spectrum allocation aimed at multiplying the number of players, small spectrum caps preventing market concentration, and MVNO licensing might have a negative impact on innovation since higher than optimal competition acts as a deterrent from product differentiation. Second, the threat of growing churn embodied in number portability that lowers customer switching costs acts as an incentive to innovate in order to enhance loyalty. In a market that has been significantly liberalized around the world, regulatory independence appears to play no role in fostering innovation. The optimal level for deployment of wireless broadband is driven by a certain amount of market concentration and a moderate level of competitive intensity. The higher the market concentration is, the larger the incentive to innovate. This could be associated with both the certainty of obtaining a return to the introduction of a new product (wireless data products) and the ability to capture a larger share of demand. The Mexican experience confirms these findings from a negative standpoint. Very gradual market liberalization and a hesitancy to open markets had significantly negative effects on sector performance. The privatization of Telmex in 1980 had benefits in terms of accelerating the deployment of fixed-line telephony, particularly in its ability to reach high numbers of those at the lower levels of the socio-demographic pyramid. However, the incumbent was capable of establishing a significant number of barriers to entry in local telephony through either sector-specific policies (interconnection rates, license restrictions) or policies outside the sector (limits to foreign ownership). These were reinforced by a legal system that guaranteed the capability of delaying any government attempts to liberalize the market. These barriers had a negative effect on wireline service deployment. The proof of the important positive contribution of competition toward sector performance lays both in the broadband and wireless sectors. The activity of cable TV operators in the former and wireless competitors in the latter have resulted in a more dynamic market, leading to higher static and dynamic efficiencies.12
11 To test the existence of an inverted-U relationship between innovation and market concentration, a model with a quadratic HHI term was also estimated (e.g., B1 HHI + B2 HHI2). According to this theory, B1 should be positive, while B2 should be negative to prove the existence of a quadratic relationship and that the optimum point of the quadratic shape is a maximum. The results show that the signs of the coefficients behaved according to the theory, but they were not significant. This situation could be the result of a lack of information on product innovation in countries with an HHI greater than 0.6. 12 Recent regulatory moves taken by Mexican authorities confirm the will to push sector dynamics to become more competitive. The Secretaria de Comunicaciones y Transportes (SCT) launched an auction for three concession licenses to operate dark fiber belonging to the state electricity company. This auction is aimed at boosting competition against Telmex’s wireline business. In addition, the antitrust authority has concluded that Telmex has a dominant position in call termination on fixed lines, while AMX has a dominant position in the wireless market. It remains to be seen whether these moves will result in stimulating competition.
TICyPRODUCT_ingles_i_x_001_230.indb 221
30/6/11 16:54:52
The Impact of Public and Regulatory Policy on ICT Sector Performance 222
11.7 From a Regulatory Policy to an Industrial Policy Countries that have succeeded in building a high-performance ICT sector have transitioned from developing policies on a sector-by-sector basis (telecommunications, software, science and technology, computing) to an integrated comprehensive model. An integrated approach to ICT policy development recognizes the interconnected domains of ICT (infrastructure, demand, production, and adoption) and sectors (telecommunications, applications, and devices). This integrated approach translates initially into the formulation of a vision of the future of ICT for the country, which is then defined to guide the multiyear planning effort. For example, each of the multiple ICT plans formulated in Korea have been guided by an overarching visionary objective such as “reach world-class ICT performance levels by 2010” (the 1996–2000 First National Informatization Promotion Plan), “build a knowledge-based society” (Cyber Korea 21), “development of broadband leadership” (Broadband IT Korea Vision 2007), and “broadband convergence and ubiquitous networks” (u-Korea Master Plan). In 2006, the Japanese government developed u-Japan, an overarching strategic policy that was guided by three targets for 2010: • The elimination of non-broadband served areas, meaning that broadband service should be available to 100 percent of the population. The policy also sought to make high-speed broadband available to 90 percent of the population. • Eighty percent of the population should value ICT as a tool to address social needs. • Eighty percent of the population should be ICT literate in order to feel at ease accessing the Internet and computer technologies. In 2000, the Swedish government enacted in the Information Society for All bill, establishing that broadband should be considered a universally accessible utility. This bill led to the development of the Broadband Support Program (2001–2007), which focused funding on the deployment of broadband in rural and isolated areas and building a national backbone. In 2007, the telecommunications regulator issued a broadband strategy with the objective of achieving universal service. In Estonia, the first integrated effort to create an information society was defined in 1998, when its parliament adopted the Principles of Estonian Information Policy. This bill was further refined by the Principles of Estonian Information Policy 2004–2006 (elaborated and approved in 2004). The Estonian Information Society Strategy 2013 (approved in 2006) stated that, by 2013, 75 percent of Estonian residents will be using the Internet, while household Internet penetration will amount to 70 percent. In addition to formulating an overarching vision, a move from a regulatory policy to a comprehensive industrial policy recognizes that the development of a telecom sector and the creation of export-oriented IT services and software industries have to be linked. In Korea, policy makers determined that meeting demand on the domestic front and leveraging the industrial power of big conglomerates could allow the country to build an export base in electronics, IT, and communications. Initially, however, objectives were articulated about meeting internal demand for an upgraded telecommunications infrastructure and entering the electronics arena. According to this approach to ICT-sector development, incubation of an export-oriented industry is linked to funding adoption of its products in the domestic market. A key policy objective of all Korean master plans has been the articulation of industrial policies such as R&D promotion, the development and diffusion of industry standards, the training of ICT resources, the promotion of e-Government applications, and the provision of seed capital for infrastructure deployment. The Development Fund benefits from private-sector contributions through spectrum licensing fees, a percentage of revenues from
TICyPRODUCT_ingles_i_x_001_230.indb 222
30/6/11 16:54:52
11. The Impact of Public and Regulatory Policy on ICT-Sector Performance 223 operators, and interest-earning loans. As such, one of the fund’s primary objectives is to reinvest ICT-sector profits in the sector itself. Over time, the guiding principle for the formulation of policies evolved toward “building the information society”. Based on the overarching goal of developing an advanced information society, Korea formulated several successive master plans that included both supply- and demand-side policies. Finally, Korea’s policies for broadband development have always focused on the development of an applications and services sector that both benefited from and acted as a stimulus of infrastructure usage. As a result, the development of broadband acted as a stimulus for the creation of a content industry. Among the newly created industries, Korea has an $8.3 billion online gaming sector and a $3.4 billion domestic content industry, as a well as a homegrown Internet search sector. The Ministry of Information and Communication in Japan had a similar objective of promoting the development of an equipment manufacturing industry when it set up the ICT International Competitiveness Enhancement Program in 2007. The program was aimed at promoting Japanese products and developing world markets through the collaboration of industry, academia, and the government. This program has been actively endorsed by the ICT manufacturing sector. In addition, the development of ICT strategies has been constantly supported by many large domestic high-technology companies, including Canon, Mitsubishi, Nintendo, Panasonic, Sony, and Toshiba. In Estonia, the government sponsored the creation of Competence Centre in Electronics-, Info- and Communication Technologies (ELIKO) in 2004, which was formed by Tallinn University of Technology and private companies to develop a domestic technology cluster. Finally, by consolidating the Ministry of Electronics Industry (MEI) into the new Ministry of Industry and Information Technologies (MIIT), Chinese policy makers have aimed at cultivating state-owned champions in the telecom equipment space–ZTE and Huawei primarily–that now enjoy more than a 60 percent market share versus foreign vendors.
11.8 The Importance of Government Planning for the ICT Sector Using the integrated vision as an overarching target development goal, multi-year government planning is another critical driver of ICT-sector performance. In Korea, the initial push for long-term ICT planning started in 1982, when the government designated telecommunications a priority area. A key policy objective for all Korean master plans has been the articulation of industrial policies such as R&D promotion and the provision of seed capital for infrastructure deployment. The first national ICT-focused plan was formulated in 1987 for an eightyear period. Starting in 1995, the government began preparing five-year plans. A significant feature of the Korean ICT government-sponsored planning process is its holistic nature.13 Master plans are contextualized as tools for facilitating the transition into an advanced information society. These efforts imply that planning dimensions include not only network infrastructure, but that they also address services, applications, and demand promotion policies. This last point represents a critical difference with the ICT-sector development processes in other advanced economies. Planning efforts in other nations tend to be heavily focused on network deployment and, while they recognize the positive spillovers that networks can play on other sectors, they leave promotional efforts in these related components of the ICT ecosystem to market forces (a process that could be labeled as “build it and they will come”). Contrary to this philosophy, Korean policy makers tend, through their planning tools, to address all of the components of the ICT ecosystem in an interconnected fashion, generating incentives in the areas of applications and services to follow through the buildup of networks.
13 Kim, Dongcheol, “Korean Experience of Overcoming Economic Crisis through ICT Development”,UNESCAP, 2010.
TICyPRODUCT_ingles_i_x_001_230.indb 223
30/6/11 16:54:52
The Impact of Public and Regulatory Policy on ICT Sector Performance 224 Like Korea, Japan has a sector-wide planning tradition. In parallel with the NTT privatization and sector liberalization process, the Japanese government developed ICT strategies aimed at developing a telecommunications and IT industry. The initial push for strategic planning in the ICT sector started in 2001, when the government developed the first e-Japan Strategy. The strategy planning process allowed for the formulation of annual priority policy programs focused on the implementation of objectives such as the universalization of broadband. National planning efforts such as these need to be complemented by detailed blueprints for their implementation. These roadmaps are helpful for generating the appropriate frameworks for introducing changes in the regulatory arena. In particular, the clear definition of a sector blueprint guiding sector development, privatization, and liberalization appears to be critical. For example, the Brazilian experience is quite conclusive about the value of conducting a reform of the telecommunications sector, whereby privatization and liberalization are handled simultaneously, with both processes being driven by a blueprint of market structure. While some features of the Brazilian process were not accounted for in the original intent–sector consolidation and the construction of a “national champion”–most of the design elements contained in the law have been achieved. Wireless telephony has achieved near universal penetration, prices have fallen dramatically, and innovation dynamics have worked well in filling the gap left by fixed broadband. Similarly, the Estonian experience is a clear example of a successful quantum leap in ICT-sector performance, combining infrastructure development through platform-based competition and demand gap programs. In addition, the deployment of initiatives in both areas was supported by the formulation of an overarching strategy aimed at building an information society. The Mexican telecommunications liberalization experience proves the importance of having a blueprint guiding regulatory changes. In theory, Mexico’s local telephony service and wireless services have been open to competition since the privatization of the incumbent in 1990. In practical terms, however, the government allowed the privatized company to maintain a de facto monopoly by postponing the establishment of clear rules that would guarantee new entrants a fair environment to compete in and by delaying decisions on the concession of licenses or when auctioning frequency spectra. This situation led to significant delays in the development of a vibrant ICT sector. However, ICT national planning and blueprint development are only the beginning of a process that needs to be underpinned by good management practices as well. The case studies of countries that have excelled in this domain highlight three important practices. Decoupling planning from political changes As noted earlier, ICT planning is framed within a national vision of the target sector. This vision is the result of a consensus built among policy makers, the private sector, and civil society, and it should be supported by major political parties. As an example, ICT planning in Korea is not a political tool subject to the vagaries of the political electoral cycle. It is the embodiment of state policies that capture a strategic vision, which in itself represents a consensus of all societal forces in the country. Similarly, in China, institutional centralization was reinforced with government-sponsored planning, although this may have been facilitated by the specificities of the country’s political system. In Brazil, despite the changes in governments, a consistency in the development of sector objectives has prevailed and is expected to be maintained in the future. Disciplined monitoring and follow-up of fulfillment of objectives on an annual basis In Korea, each plan is assessed in terms of its results at the end of the planning horizon, and the results of the assessment are then fed into the formulation of the next iteration. In China, senior leadership performance reviews are tangibly tied to achieving detailed annual planning targets specifying network capacity expansion, coverage, penetration, and quality standards.
TICyPRODUCT_ingles_i_x_001_230.indb 224
30/6/11 16:54:53
11. The Impact of Public and Regulatory Policy on ICT-Sector Performance 225 Ownership by the executive branch of government Complementing multi-year planning and disciplined follow-up, leadership in the promotion and oversight of ICT policy at the highest levels of government appears to be linked to high performance. In Korea, it is a common practice to not only name an “ICT Czar”, but also to guarantee that this official has access to the country’s president on a regular basis. This places the responsibility for steering the development of the sector squarely in the hands of the president. In Brazil, the National Broadband Plan is being developed by the Secretariat for Strategic Affairs of the Presidency of the Republic and the Casa Civil and will be directly approved by the president. In China, strong leadership at the top has been a key feature in that country’s ICT-sector development. All senior management personnel decisions are controlled explicitly by the Communist Party in order to ensure compliance with ministerial (Central Party) directives. The telecommunications policy agenda was formulated and driven primarily by ex-MIIT (formerly of the “Ministry of Post and Telecommunications - MPT”) Minister Wu Jichuan during his ministerial tenure from 1993 to 1998. He was arguably one of China’s most powerful civil government ministers ever. The MIIT reports to the State Council and is a member of the State Informatization Leading Group (SILG). The SILG approves and modifies the regulatory framework and any future directions for the telecommunications industry. In particular, the role of the SILG has been quite prominent in Internet regulation, focusing on controlling web content. In some cases, governments extend their sector intervention beyond multi-year plans by actively shaping the industry structure. At several points during the development of the ICT sector in Korea, the government intervened in the market “in a focused and strategic way” that shaped industry structures through the creation of national champions, fostering export-led industries, or making efforts to address sector sustainability. The Korean government often negotiated with the giant conglomerates their participation in the telecommunications sector. For example, in the last tranche of privatization of Korea Telecom, the government agreed to permit SK Telecom to acquire 11.3 percent of shares, while LG acquired 2.3 percent. Similarly, the government has also encountered the consolidation of wireless players and broadband service providers at times of financial crisis. The Brazilian government, in response to concerns about the whole sector falling into the hands of foreign owners, has engineered the creation of a national champion over the past two years, by promoting the merger of two of the three major regional carriers: Brasil Telecom and Oi. This required the modification of the original Telecommunications Law. In October 2008, the Brazilian regulator Anatel agreed to approve changes to regulations ending a prohibition that specified that the controlling shareholders of Brazilian telephone companies could not own a phone carrier in another region of the country. Telemar was now able to create a telephone company serving two-thirds of Brazil’s fixed lines and almost a fifth of its mobile phones. Under the proposed acquisition, Brazil’s state-owned development bank BNDES together with three pension funds from state-controlled companies would own 49.8 percent of the new carrier. The Japanese experience represents an example of a fine-tuned combination of top-down sector planning with a set of incentives to stimulate facilities-based competition. While not explicit, the government has been constantly adapting the regulatory framework to the gradual consolidation of broadband and mobile sectors. One should not underestimate the importance of policy implementation. As is the case with business strategy, good policies need to be implemented appropriately in order to become effective. Good policy implementation practices include two primary areas: active involvement of the private sector throughout the policy development process and constant monitoring of the unexpected effects policies might have. While policy domain is essentially a governmental prerogative, success in ICT-sector performance is dependent on private-sector participation (e.g., level of investment in infrastructure, new product development, etc.). Countries that have excelled in the implementation of ICT policies have the capability of creating formal and informal
TICyPRODUCT_ingles_i_x_001_230.indb 225
30/6/11 16:54:53
The Impact of Public and Regulatory Policy on ICT Sector Performance 226 channels of communication with the private sector that allow players to provide feedback, generate recommendations, and suggest modifications. Korea and Sweden both have consultation and dialogue processes that contribute to policy fine-tuning. Given the systemic nature of ICT policies, their impact can go beyond the domains for which they are designed. The statistical analysis of the impact policy has on investment indicates that initiatives such as local loop unbundling, while allowing for a temporary stimulation of broadband development, have a chilling effect on forward-looking investments in infrastructure. Thus, a good management practice for policy implementation requires that all measures be evaluated and constantly monitored in terms of their holistic effects.
11.9 Demand-side Policies as a Way to Address Digital Inclusion In addition to deploying policies to stimulate infrastructure development aimed at achieving wide service coverage of key technologies, leading information societies also implement several demand-side policies focused on promoting ICT adoption. Recent on regarding the development of information societies has identified a significant demand gap, which is defined as the population served by information technology (principally broadband) but that does not purchase service.14 In the United States, for example, the demand gap amounts to 31 percent of households, in Germany it is 40 percent and in Australia 20 percent. However, the demand gap is significantly lower in two of our country case studies: in Korea it is 7 percent while in Sweden it is 11 percent. (See Chapter 9 for a discussion of the high use of ICT by Korea’s elderly population.) A reduction in the demand gap is associated with the implementation of a series of policies aimed at lowering digital exclusion. Governments of countries with high-performance ICT sectors tend to introduce tax incentives designed to ease the purchase of equipment. For example, the Swedish government has decreed that 50 percent of the costs of broadband deployment are deductible up to a maximum of 5,000 SEK for businesses and residential taxpayers who sign up for broadband services. Similarly, in Japan, firms investing in ICT solely for their own use have the option of either a 10 percent corporate tax credit or a special depreciation allowance equivalent to 50 percent of the acquisition cost. By actively developing eGovernment services (electronic submission of tax returns, an e-procurement service for small and medium enterprises selling goods and services to the government, platforms for telecommuting, and platforms that allow the interaction between the government and enterprises for e-business transactions), the Korean and Estonian governments have provided additional incentives for consumers and small businesses to join the information society. This initiative is generally complemented with digital literacy programs that offer subsidies for the purchase of PCs and for online educational programs targeted to the elderly and disabled, such as the programs implemented in Korea. In the case of small businesses, the Japanese government encourages small and medium enterprises to voluntarily install new IT platforms by providing training, by compiling and disseminating best practices, and by supporting collaboration among local communities. One area of demand-side policies that has gained attention is the need to support ICT adoption and assimilation among small and medium enterprises (SMEs). These enterprises represent the center of gravity of most economies in terms of employment generation and, in many emerging countries, make important contributions
14 John Horrigan, “Home broadband adoption 2009”, Pew Internet and American Life Project, 2009; “Access and Inclusion Statement”, OFCOM, 2009; and “Inhibidores de uso de las TIC en la sociedad española”, ENTER. 2007.
TICyPRODUCT_ingles_i_x_001_230.indb 226
30/6/11 16:54:53
The Impact of Public and Regulatory Policy on ICT Sector Performance 228 adopted such systems, the benefits have not yet made a difference on the population’s overall health or its mortality rates or on the amount of total health care spending. The most noticed impact of ICT in the health arena is the change in doctor-patient relationships–patients are now armed with knowledge that allows them to challenge their doctors’ conclusions and discuss treatment alternatives. This knowledge also allows patients to, in effect, provide themselves with care and adds to the total resources available to deal with medical conditions. (See Chapter 7 for other ways in which ICT has been applied to delivering health services.) The policy implications of these findings emphasize the need for careful micro-level research into the impact of specific technology initiatives, since the effects may be hard to find by simply measuring aggregate population indicators. For eGovernment, the most important demand-side factors promoting Internet-enabled services appear to be the same factors that promote general Internet use–access to Internet services and the knowledge and hardware necessary to gather information and implement transactions. In this respect, the prevalence of eCommerce and eGovernment services go hand-in-hand. Strong government support of general ICT provision to the population appears to be a critical factor. Finally, the systematic impact of ICT in the educational arena appears to largely be felt in students’ attitudes toward science and math. Intensive use of computers at home appears to conflict with educational performance, however, since such use is often for entertainment that reduces the time spent on schoolwork. So far, the use of entirely new learning models centered on student-computer interaction without the benefit of classroom instruction do not generally appear to be effective. Maximizing the benefits of ICT in education will depend on continued research and experimentation to find the most useful and scalable ways in which it can improve the learning process.
11.11 Conclusions This chapter has shown how important public policy is to the development of a high-performance ICT sector. It has also shown that policies and practices will differ across countries, depending on the type of political system: as an example, China’s political context has an influence on its ICT policy domain. Nevertheless, it is important to emphasize that regardless of the specificities of the political system, best practices are surprisingly common across nations. 1. Government policy plays a critical role in enhancing performance of the ICT sector. Statistical analysis relating the performance of the ICT sector to a standard set of policies indicates that public policy and sector performance are intricately linked. The performance of the ICT sector in terms of ICT adoption, quality, product innovation, and consumer benefit measured in terms of lower prices is statistically linked to the adoption of pro-competitive policies, is guaranteed by regulatory independence, and is guided by an overarching vision for the ICT sector. Furthermore, when controlling for economic development, if a country adopts managed competition policies that are guaranteed by an autonomous regulator and generates a target vision for the ICT sector, it will result in a vibrant sector that benefit the country and its population. 2. Among the policies studied, the development of appropriate competition models for the telecommunications sector is a critical driver of sector performance. Healthy competition is required not only to yield price reductions in services, but also to stimulate innovation and investment. Sustainable competition models result in industry structures that exhibit a moderate amount of consolidation of the telecommunications sector, which, in turn, tends to stimulate innovation by creating greater certainty of returns. Statistical analysis indicates that platform-based competition in broadband is positively linked to a higher likelihood of investment in fiber optics in the local loop. Similarly, encouraging mobile number portability through the reduction of customer switching costs increases the likelihood of product innovation, which results in a greater launch of mobile data applications. These findings have been confirmed by examples that show how
TICyPRODUCT_ingles_i_x_001_230.indb 228
30/6/11 16:54:54
11. The Impact of Public and Regulatory Policy on ICT-Sector Performance 229
3.
4.
5.
6.
platform-based competition is the primary driver of broadband development in Japan, Korea, and Sweden. Sustainable competition embodies the presence of two or three vertically integrated players with sufficient innovation and investment capacity since limited competition resulting from a highly concentrated industry structure acts as an obstacle for the development of broadband. (See the discussion of Mexico.) Telecommunications policies need to be integrated within an overall vision and blueprint of the target ICT sector, including all other elements of the ecosystem (software applications, content development, and computing). The case studies of China, Korea, Estonia, and Japan indicate that telecommunications policy is generally inserted into a comprehensive framework linking the telecom sector to IT services. This overarching framework should be captured in a vision and a blueprint of what the goal of sector development is. The countries studied view infrastructure development (e.g., telecommunications) as inextricably linked to content and applications. The development of a vision and a blueprint helps achieve clarity and certainty in the definition of a regulatory framework and set of policies. Estonia is a country in which vision, blueprint, and regulatory certainty are interrelated. On the negative side, the lack of vision and policy uncertainty in Mexico has had a negative effect on the development of its ICT sector. Infrastructure-oriented policies need to be combined with an emphasis on demand-side policies to stimulate ICT adoption. As the country examples indicate, the significant portion of the population excluded from digital technology represents not a lack of reach but socio-economic and cultural limitations. The case studies of Sweden, Estonia, and Korea (all of which have high rates of technology adoption) set the paradigm in terms of implementing demand-side policies focused on enhancing digital literacy, subsidizing access to the disenfranchised, and developing applications that promote adoption. In addition to specific policies, active and continuous government planning is a critical tool for performance improvement. Statistical analysis finds that most of the countries that achieve superior performance in their ICT sectors exhibit an adherence to the development of high-level planning combined with detailed multi-year sector programs. Top ICT-sector performance is statistically linked to this practice. This finding was confirmed in a number of countries (Sweden, Korea, Japan, and Estonia), though the experiences of some other countries indicated that planning alone is not sufficient to improve sector performance. The case studies of Korea and China indicate that the likelihood of planning success increases with solid management practices, including disciplined follow-up and appropriate channels of communication between the public and private sectors. Policies and government planning need to be complemented with leadership and ownership from the executive branch. While they are countries with widely divergent political cultures, the experiences of Korea, China, Sweden, and Brazil point out the importance of assigning the development and monitoring responsibility of the digital agenda to the highest levels of the executive branch. This results in the ability to steer all branches of the government and the administration in a coherent direction, as well as enhances the possibility of enforcing the fulfillment of the vision.
Bibliography Barrios, S., & Schaechter A. (2009). “Gauging by numbers: A first attempt to measure the quality of public finances in the EU.” Economic Papers, 382. August 2009. European Commission. Brussels. Bauer, J., Kim, J. & Wildman, S. (2004). Effects of national policy on the diffusion of broadband in OECD countries. Paper prepared for presentation at the UFL-LBS workshop “The Future of Broadband: Wired and Wireless”. Gainesville, FL, February 24-25, 2004. Boyle, G., Howell, B., & Zhang, W. (2008). Catching Up in Broadband Regressions: Does Local Loop Unbundling Really Lead to Material Increases in OECD Broadband Uptake? NZ Institute for the Study of Competition and Regulation. Cava-Ferreruela, I., Alabau-Munoz, A. (2006). “Broadband policy assessment: A cross-national empirical analysis” Telecommunications Policy 30:445–463.
The Impact of Public and Regulatory Policy on ICT Sector Performance 230 Distaso, W., Lupi, P., & Manenti, F. (2006). “Platform competition and broadband uptake: Theory and empirical evidence from the European Union” Information Economics and Policy 18:87–106. Garcia-Murillo, M. (2005). “International Broadband Deployment: The Impact of Unbundling” Communications & Strategies, No 57 1st quarter. Grzybowski, L. (2005). “Regulation of Mobile Telephony across the European Union: An Empirical Analysis” Journal of Regulatory Economics; 28:147–167. Grzybowski, L. (2008). “The impact of regulation on the retail prices in fixed-line telephony across the European Union.” Telecommunications Policy 32:131–144 Gutierrez, L. (2003). “The Effect of Endogenous Regulation on Telecommunications Expansion and Efficiency in Latin America.” Journal of Regulatory Economics, 23:3257–3286. Katz, R. (2009). El papel de las TIC en el desarrollo. Barcelona: Ariel. Li, W., & Xu, L. (2004). “The impact of privatization and competition in the telecommunications sector around the world.” Journal of Law and Economics, 47, 395–430. Lim, K., & Chen, Z. (2009). Measuring the Barriers to Trade and Investment in Telecommunications Presentation at the 7th Annual International Industrial Organization Conference. Boston, MA, April 3-5, 2009. Maiorano, F., & Stern, J. (2007). Institutions and Telecommunications Infrastructure in Low and Middle-Income Countries: The Case of Mobile Telephony AEI-Brookings Joint Center for Regulatory Studies. May 2007. Nicoletti, G., Scarpetta, S., & Boylaud, O. (2000). Summary Indicators of Product Market Regulation with an Extension to Employment Protection Legislation. OECD Economics Department Working Paper 226(99)18, Dec 23, 1999. Wallsten, S. (2001). “An Econometric Analysis of Telecom Competition Privatization Competition Privatization and Regulation in Africa and Latin America” The Journal of Industrial Economics, XLIX, March 2001. Wallsten, S. (2006). Broadband and Unbundling Regulations in OECD Countries AEI-Brookings Joint Center for Regulatory Studies. Working Paper 06-16 June. Warren, T. (2000). “The identification of impediments to trade and investment in telecommunication services” Impediments to trade in services – Measurement and policy implications. Routledge, Studies in the Growth Economies of Asia. Chapter 5, pp 71–84. Waverman, L., Meschi, M., Reillier, B. & Dasgupta, K. (2007) Access Regulation and Infrastructure Investment in the Telecommunication Sector: An Empirical Investigation. LECG Ltda. Woolbridge, J.M., (2002), “Econometric Analysis of Cross Section and Panel Data”, The MIT Press, Cambridge, M.A. Zenhäusern, P., Telser, H., Vaterlaus, S. & Mahler, P. (2007). Regulatory density index in telecommunications with particular consideration of investment incentives. Olten, Switzerland: Plaut Economics.