USA. Paper Number 9%S9-W-24. ABSTRACT. It has been shown that the design of the Hybrid III dummy's hip joint ... chest accelerations of some front barrier crashes. In order to analyze ... estimated on the basis of pendulum test results. Below ... For all conditions, two or three loading severities were ..... ______ ______ 1.
THE LOAD PATH FROM UPPER LEGS TO CHEST IN THE HYBRID EXPERIMENTS AND SIMULATIONS
III DUMMY:
R. Happee, A.R. Kant TN0 Crash-SafetyResearchCentre The Netherlands E. Abramoski, J. Feustel Ford Motor Company, MI USA PaperNumber 9%S9-W-24 designed. Several evaluations showed that this modification reduced the signs of hip lock (Abramoski et al., 1994;Abramoski et al., 1995; SAE 950660; Nusholtz et al., 1995; Klinich et al., 1995; Kanno et al., 1996). Well validated mathematical models of the Hybrid III dummy failed to reproduce these peaks in the thoracic spine acceleration.Furthermore the lumbar spine loads were not accurately predicted. Apparently the load path from upper legs to chest was not well captured. In order to clarify the mechanics of this load path the following series of experimentswas performed. 1) Dynamic tests on the isolated lumbar spine 2) Dynamic hip flexion tests 3) Dynamic tests on a partial dummy including hip joints, upper torso, neck and head Thesetests have beenused to improve an existing model of the dummy. With this improved Hybrid III model, full scaletests have been analyzed in order to further clarify the role of different dummy componentsin the load path from legs to spine. Major variations in resistance were found betweendifferent lumbar spines, and it was found that hip friction is generally not set as prescribed.To evaluate these sources of variability on injury numbers a sensitivity analysis was performed on realistic applications of the Hybrid III dummy.
ABSTRACT It has been shown that the design of the Hybrid III dummy’s hip joint can cause abnormally high spikes in the chest accelerations.These spikes are generatedwhen the pelvis rotation is suddenly stoppedby the bottoming out of the hip joint. This creates large lumbar shear and tension forces which act to resist forward movement of the dummy’s chest. This problem has partly been resolved by the introduction of “modified femurs”. However, even with modified femurs, high peaks have still been observed in chest accelerationsof some front barrier crashes. In order to analyze the load path from upper legs to chest, dynamic experiments have been performed on the hip joint (with modified femurs and with standardfemurs), on the isolated lumbar spine and on a partial dummy consisting of upper legs, torso, neck and head. These tests have been used to significantly improve an existing model of the dummy. In the hip joint, a considerable rate-dependency was found and the adjustment of hip friction was found to be an important factor. For different lumbar spines from the same manufacturer, major differences in responsewere found. These differences between dummy parts are a concern for reproducibility of full dummy tests. A sensitivity analysis showed that such dummy related factors lead to variations in the order of 2-870 for peak chest acceleration and chest deflection, but lead to much larger variations in lumbar loads.
LUMBAR SPINE TESTING & MODELLING In a previous test programme the relations between rotations (bending & torsion) and displacements (compression& elongation and shear), and moments and forces were determined in a quasi-static manner (MADYMO, 1994). Damping coefficients were then estimated on the basis of pendulum test results. Below more extensive dynamic tests on the lumbar spine are described.
INTRODUCTION Uncharacteristic high thoracic spine accelerations have been noted by several vehicle manufacturers when driver and passengerair bag restraints were used in combination with the unbelted 50’ percentile Hybrid III dummy. These peaks were shown to be causedby bottoming out of the hip joint. This problem is mostly referred to as “hip lock” or hip joint interference. As this responseof the dummy was not considered biofidelic, modified femurs have been
2098
Lumbar spine bending and shear
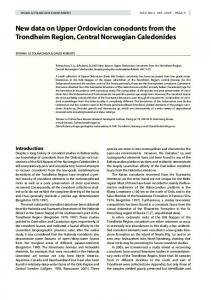
performance (the spine geometry is also defined but because it is made out of polyacrylate it does not completely return to its initial geometry after it has been deformed). Each test configuration was done two times resulting in a total number of 36 tests. The results show that the spine stiffness can vary significantly, even among certified lumbar spines. A strong relationship was found between the lumbar spine durometer and the bending stiffness as is evident by looking at Figure 1. The higher the durometerof the lumbar spine, the higher the measured loads and the lower the spine box rotation. There was no relationship evident between the spine cable tension and the spine stiffness. It should also be mentioned that the measurementsof the spine durometer were done by a person familiar with taking this measurement from First Technology Safety Systems.The same lumbar spines were remeasuredby the same person 3 months later and were found to be within +/- 1 durometer from the original measurement. But when other people measured the durometer, they got significantly different values (by as much as 6). This indicates that specifying a durometer specification may not be appropriate since it appearsto be very user dependent.This is primarily due to the lumbar spine not having a flat surface from which the durometer could be measured.
Dynamic lumbar spine tests were performed where the lumbar spine was rigidly connected to a sled. A sled acceleration with the appropriatepulse shape was induced with a Monterey setup. On the lumbar spine a Hybrid III spine box was attached including a spine load cell. Ribs and neck bracket were removed. The spine box yields an inertial loading to the lumbar spine. By attaching one or more load massesto the spine box this inertial loading was manipulated.Three loading assemblieswere used: . shear assembly; an assembly with a CG below the spine box was designed such that mainly shear was induced in the lumbar spine. * bending assembly; a mass was attached on top of the spine box which resulted in strong bending and limited shearin the lumbar spine. . torsion assembly; a mass was attached lateral (to the right) of the spine box such that a combination of torsion, bending and shear was induced in the lumbar spine. For all conditions, two or three loading severities were applied with one lumbar spine which further will be referred to as specimen1. The shearand bending tests with the highest loading severities have been repeated with anotherlumbar spine (specimen2).
Lumbar spine axial compression ReDeatabiIitv and remwducibility - For repeated tests with specimen 1 only minor differences were observed. Film results showed a good repeatability for displacementsand rotations. The responseof specimen 2 differed notably from specimen 1. Furthermore the repeated tests with specimen 2 showed rather large differences. Both for the shear and the bending condition, specimen 2 gave reduced spine deformations as compared to specimen 1. These results indicate that the reproducibility of different spines is poor. Repeatability is good for specimen 1 with which all test conditions were studied and repeatability is not good for specimen2. Given the differences found it seemed worthwhile to test more specimens. Additional tests on three lumbar spines were conducted using the most severeloading conditions of the bending and sheartest configurations. Test specimenswere chosento have spinesat the low, mid and high rangeof the part specification tolerance of 75 to 85 durometer. The spines tested had measureddurometersof 77, 81, and 84. As part of this study the spine cable tension was also varied +/- 15% from the nominal specification of 12 in-lbs. Since there is no performance specification for the Hybrid III dummy lumbar spine, these two variables essentially are the only controlled parameters that could affect its
The response of the lumbar spine in axial loading is particularly relevant for aircraft seat testing. Therefore dynamic tests were performed for axial compression.These were performed with a Zwick-Rel dynamic testing machine at various loading rates.
2099
0
ii I30.01 75.0
l 76.0
, 77.0
) 7B.O
.
) 70.0
e
*al,&
Legend t&n*. =
10.2
0
eabl.
tana.-
12
a
tablm
tmna.
13.8
, 80.4 Durometsr
, 81 .O
=
, bZ.0
In--lb* In--lb* In-lba
, 83.0
.
, E4.0
8: .O
F igure 1: Spinebox rotation vs. spinedurometerfrom the lumbar spinebendingtests. cablesseparatelyas a Kelvin element.As statedabovethe resultsfor specimen2 differed strongly from specimen1. The m o d e l was optimized for specimen 1. F inally the m o d e l was optimized also for specimen 2. This optimization had the following results. The bending resistanceof specimen2 was found to be 1.4 times that of specimen 1. The shear resistancewas estimated to be practically the samefor both specimens.This confirms that specimen2 has a much higher resistancein bending as comparedto specimen1.
Lumbar spine m o d e lling The dynamiclumbar spinetestsdescribedabovehavebeen used to improve the existing lumbar spine m o d e l (MADYMO, 1994).The m o d e l was optimized, such that the differences between the simulations and the experimentalresults were m inimized. Some parts of the optimization were performed manually. The most complicated parts of the optimization were performed automatically (MADYMO, 1997). The automated optimizationhasthe following advantages: . several parameterscan be optimized together; the program deals with the interaction between the parametersandfinds an optimal set of parameters, . different signalsfrom onetest, andevenfrom different testscan be combinedinto oneobjectivefunction In several steps the m o d e l was optimized. The existing m o d e l was based on extensive quasi-static tests and a lim ited set of dynamic experiments.Therefore it was expectedthat m a inly the d a m p ingparametersof the m o d e l shouldbe adapted.Someinformationon the rate dependent behaviourof the Hybrid III lumbar spine can be found in Begemanet al. (1994). Here it was concludedthat the shear resistance of the lumbar spine is strongly rate dependent.These effects were already apparentat the appliedmaximum loadingratesof 50 m m /s whereasshear ratesup to 2.8 m /s were found in the componenttests now usedfor m o d e lling.In the existing m o d e lthe spine cables were m o d e lledas a very high joint stiffnessfor elongation. An improved prediction was obtainedby m o d e lling the
HIP JOINT TESTING AND MODELLING Dynamic componenttests have beenperformedon the hip joint. The goal of theseexperimentswas to determinethe dynamic resistanceof the hip joint. The m o d ified femurs are designedto prevent the occurrenceof interferencein the hip joints. Hip lock occurs when the dummy’s upper femur bottoms out and makesmetal to metal contact with the pelvis bone.A distinction is m a d ebetween“hard” hip lock and “cushionedhip lock” (Klinich et al., 1995).Hard hip lock can occur in the standardfemur and cushionedhip lock can occur in the m o d ified femurs. Two pelvis/femur assemblieshave been tested. The first assembly is a standard50” percentiIe Hybrid III pelvis with standard femurs.The secondassemblyis a new pelvis with m o d ified femurs.Thesetwo assembliesare respectivelyabbreviated as “standardfemurs”and “m o d ified femurs”. The pelvis was held “rigidly” at the lumbar spine attachmentwith the upper legs directed upwardsand the
2100
updated using test data of the modified femurs. Moderate loading of standard femurs was also simulated with the new hip model. From these simulations it was concluded that the new model provides a reasonableprediction for moderateloading of standardfemurs.
lower legs removed.Both legs were tested at the sametime in order to study differences in behaviour between the left and the right hip. It is known that the left and right hips behave differently because the pelvis is not left/right symmetric (Klinich et al., 1995; Abramoski et al., 1994). The modified femurs were tested at two loading severities and at different loading rates. The highest severity tested induced “cushioned hip lock”. The low severity tests were also repeatedwith standardfemurs and did not result in hip lock. Accelerations in x, y and z directions were recorded at the sled, the pelvis and the knees. The hip flexion angles were calculated from string pot measurement.The flexion angles calculated from the string pots were verified using high speedvideo. It was concluded that the string pots were able to foIlow the dynamics of the knees accurately.
DYNAMIC TESTS ON HIP JOINTS, TORSO, NECK AND HEAD Tests with a partial dummy have been executed to study the behaviour of the combined hip/lumbar spine section of the dummy. In such tests, lumbar spine deformation is not only resisted by the lumbar spine itself but also by contact interactions of the rib cage, the abdomen and the lower torso (Heinz, 1993). In all tests the arms were removed. Head and neck were included in these experiments. In all forward loading tests, the lower legs were removed and the knees were mounted on the sled. The pelvis was supported by a rigid horizontal plane. The knee-slider, and knee rotation mechanism were included in the tests. So, the dummy could move forward slightly, and rotate freely around the knee axis. In the rearward loading tests, the upper legs were replaced by rigid supports, and the pelvis was also supportedat the back. Four forward loading tests, were performed with a belt restraining the upper torso. The belt was attached to the base of the neck. The belt was chosen such that it approximates the restraining effect of an airbag. Before performing the experiments, several simulations were run to select the appropriate belt characteristics. This belt limits the rotation of the torso, but the films show that even with this belt, the ribs came close to the upper legs. Two experiments were also performed without the abdomen.The abdomenreducesthe recorded lumbar spine bendingtorques (MY) by around 10%. This is logical since there is load sharing between lumbar spine and contacts; part of the total bending torque is generated by the abdomen.In other signals smaller effects were found. Even in the lumbar My the differences observed are not very large. However, also when the abdomen is removed, contact interactions still occur between ribs, jacket, pelvis and legs. The experimentsdo not show directly how large this influence is. Only tests with the abdomenpresent have been usedbelow for model validation and improvement.
Hip friction Calibration proceduresdescribe that “Limb joints are set at 1 G, barely restraining the weight of the limb when it is extended horizontally” (CFR part 572 subpart E). Calculations assuming a horizontal upper and lower leg were performed. Thus the static hip joint friction was estimatedto be about 56.1 Nm. However, in our experience a friction much below 56.1 Nm is often applied in real dummies. Simulations of various full dummy tests indicated a hip friction in the order of 12.8 Nm which was further adoptedfor the model. This will be treated further in the discussion. Friction has been implemented for the hip joints with the COULOMB FRICTION model. Both a constant friction and an additional load dependentfriction were specified. Hip stiffness and damping Hip flexion requirementswere specified by the SAE Large Male and Small Female Dummy Task Group (SAE 950660).Calibration specification tests were carried out for the modified femurs which were used in the dynamic hip flexion tests. It was found that the left femur did meet the specifications and that the right femur was right on the limit of 46 degreesat 340 Nm. The torque-angle result for the left leg calibration was applied in the model. Additional damping was implemented as being dependent on the rotation angle. The dynamic component tests were used to optimize the model. Optimization methods were used to systematically determineparametersproviding a best fit for several output variables of different experiments. The hip joint model was optimized using test data of the left joint. It was found that the model based on the left hip is sufficiently accurate for the right hip. The hip model was
Optimization of the model The experiments were used to optimize a model representing contacts between ribs, jacket, abdomen and pelvis. These contacts will further be mentioned as “abdomencontacts”. A notableeffect of thesecontacts was
2101
found for tests with large forward bending of the torso. With these contacts present in the model an improved prediction was obtainedof the lumbar spine loads. Upper and lower spine bending torques were reduced up to 35%. These contacts also affected chest kinematics and accelerations.
The following variations of the Hybrid III model were analysed: 1. sc~frer hip lock was simulatedby applying a hip flexion stiffness basedon modified femurs but with a reduced stiffness beyond 340 Nm. Instead of the highly nonlinear bottoming out function now a linear stiffness was taken. It should be noted that this model also matchesthe calibration specsfor 340 Nm. 2. hip friction of 56.1 Nm: the friction of 12.8 Nm from the standarddatabasewas increasedto 56.1 Nm. 3. double lumbar resistance:the resistanceof the lumbar spine model was doubled to simulate a variation comparable to the maximal expected component variations. 4. no spine cable: the KELVIN element representingthe spine cable was removed from the model. This variation was performed mainly to assessthe effect of the spine cable on lumbar tensile forces. 5. rib-pelvis contacts removed: this variation was performed to assessthe contribution of the contact interactionsbetweenribs, abdomenand pelvis.
FULL DUMMY TESTS Several tests with the complete dummy were analyzed to validate the complete dummy model, and to analyze the load path from legs to femurs. A relatively simple sled test with a rigid seat and with separateshoulder and lap belt has been used for validation. Test and simulation are described as an example in the MADYMO database manual (MADYMO, 1997). Results obtained with the new model results were almost identical to those presented in the manuals for the existing model. The actual tests were performed with standard femurs. However, the updated model based on modified femurs was applied. For this condition, only minor hip rotations were observed. This illustrates that for these conditions, the updated model is also suitable to simulate tests with standardfemurs. Barrier tests with a driver airbag, unbelted were simulated. Kinematics are shown in Fig. 2 and phasing of important experimental signals is given in Fig. 3. Around 40 ms knee bolster contact induces axial femur loads and pelvis acceleration (Fig 3, upper). Around 70 ms maximal lumbar forces and chest accelerationsare observed (Fig 3, middle). Validation results are shown in Fig. 4. SENSITIVITY ANALYSIS Above concernswere raised about factors in the Hybrid III dummy which will negatively affect the reproducibility and repeatibility of tests. A sensitivity analysis was performed to quantify these effects (Table 1). This analysis was performedfor the following configurations driver airbag unbelted: this t&t with validation results is describedabove. depowereddriver airbag: The driver airbag unbelted model was modified to simulate the recently adopted AAMA proposal for FMVSS 208. This includes changing the barrier crash pulse to a half sine (17.2g125ms) pulse and using a less forceful inflatable restraint. aircrafr drop test 30 deg nose down 16 m/s. This test was performed in accordance with ME-S-58095 and the body was effectively restrained by a five-point hamassbelt.
Figure 2. Kinematics of model driver airbag unbelted at 40 ms.
2102
Table 1. Sensitivity analysis; each block represents a loading condition. For each condition first results are given for the experiment and for the improved dummy model. Then the relative effect of several model variations is given with respict to the standard model. Effects below 1% are omitted (-)
model variation
2103
DISCUSSION Dynamic tests have been performed on lumbar spines, on hip joints with standardand modified femurs and on partial dummies. These tests have been used to improve an existing model. In the hip joint, a considerable rate-dependency was found. For component tests below hip lock level, limited differences were observedbetween the old and the new femurs. This is in agreement with full dummy evaluationsdescribedin the literature (Klinich et al., 1995; Nusholtz et al., 1995). The current specification for hip resistance surely reduces variability induced by the condition of the dummy (SAE950660). Some variation may still be found above the calibration level. Table 1 indicates that such a variation could affect chest G’s in the order of 6% for conditions with cushioned hip lock. The standardcalibration requirement for hip friction results in a value of about 56.1 Nm. Only 12.8 Nm was implemented in the model since in our experiencea friction much below 56.1 Nm is c&en appfied in real dummies. The sensitivity analysis indicated a considerable influence of hip friction on the dummy response.Given the influence of hip friction it is recommendedthat this variable is well controlled in experiments. This would improve reproducibility of tests and would facilitate modelling. Major differences in response were found for different lumbar spines. These were shown to relate to durometertesting (see Fig. 1). However lumbar durometer measurements are found to be very user dependent. Alternatively a dynamic bending calibration could be specified for the lumbar spine. This would help in reducing test variability. In component tests and in the sensitivity analysis only minor effects of the spine cable were found. Tests and simulations on the partial dummy showed significant effects of contacts between ribs, abdomen and pelvis. These contacts add to the bending resistanceof the lumbar spine, and thereby affect the lumbar spine loads. The sensitivity analysis showed that this effect was particuIarly relevant in the aircraft test. CONCLUSIONS
deflection, but lead to much larger variations in lumbar loads. REFEEtENCES Abramoski, E., Warmann, K., Feustel, J., Nilkar, S. and Nagrant, N.J. (1994). High chesr accelerations in the Hybrid III dummy due to inteeerence in the hip joint. 38th Stapp Car Crash Conference, Fort Lauderdale, Florida, November 1994, SAE-942224. Abramoski E., Warman K., Feustel J., Wilson P., Wagner B., Nilkar S. (1995). An evaluation of the SAE Recommended design changes to the Hybrid III dummy hip joint. SAE-950665. Begeman P.C., Visarius H., Nolte L.P., Prasad P. (1994). Viscoelastic shearresponsesof the cadaverand Hybrid III lumbar spine. STAPP Conference,1994, SAE paper 942205. Berge S., Planath-SkogsmoI. (1995). Interaction of the Hybrid III femur and pelvis - a mechanical analysis. SAE 950664. Heinz M. (1993). Some aspectsof the lumbar spinejoint of the 50* percentile Hybrid KU - dummy database. MADYMO UsersMeeting 1993. Klinich, K., Beebe, M.S. and Backaitis, S.H. (1995). Evaluation of a proposed Hybrid III hip modification. SAE-952730. Kanno Y., Masuda M., Matsuoaka F., (1996). Evaluations of the recommended new parts for the Hybrid III dummy - neck shield and hip joint. SAE-960450. MADYMO (1994). MADYMO version 5.1, Database manual 3D, Chapter 2: The 50th percentile sitting Hybrid III dummy. MADYMO (1997). MADYMO version 5.3, Madyrnizer manual. Nusholtz, G., et al. (1995). Analysis of the pelvis-chest interactions in Hybrid III. Society of Automotive Engineers,1995,SAE-950663. SAE-950660. Large male, small female, and 6-year-old dummies task group (1995). Hip flexion requirements for adult dummies. Society of Automotive Engineers, 1995,SAE-950660.
Testing on hips, lumbar spines and partial dummies provided insight in the load path from legs to upper torso and was used to improve an existing model of the dummy. Major variations in bending resistance were observed for the lumbar spine, and concerns were raised about the adjustmentof hip friction. The sensitivity analysis showed that such dummy related factors lead to variations in the order of 2-S% for peak chest acceleration and chest
2104
Figure 3. Experimentalsignalsof test driver airbagunbelted Pelvis X-acceleration a- _ - -AM! femur Fz *Right femur Fz , I
4wo.o .-----*-----.--___i---____-----c----~---2000.0
_----
i _____ j ____ -~-_______--__r_-___ / 1 i
-----,- --:y/+:;\ -2000.0
c
i ___________ I j ____________ i 1
______ /----__r _____ I--- ----,flc
1 ?,b
/
(scaled ’ 15)
!
;
:
R”/
!
-
-4000.0
-6000.0
--____
I-----.-----~-------
___-'
r - - - - -
- - - - _ ,-----
------,------
-10000.0 0
20
40
60
80
100
Time (msec) 6000.0 0 ..~.~~+Ichasl X-acceleration 0 - - - U Lumbar Fx [N] *+ - -0Lumbar Fz (N]
4ooo,o
(scaled * 10)
-..-L---.---~.------.---------~ I
-1
2 .g 2 a, 8 s P Tii ::
-0 5 z zg IL
-2000.0
-4000.0
-6000.0
-6000.0
----‘‘..%% ;; ,I,I ,;.,;.‘‘. . -.--.-----------i-------t-------.-_.________ ---j____ --+ ____.___-__ i,L __._______; __-------&*.,:‘‘. .tt --,+__,_ j--L,“ ‘--._______; __----\\ “,. “,. I,I, ,‘,‘ ;i ;i // ‘‘ :: \>l,,; \>l,,; -‘ -----T---------------‘ -----T---------------‘ ~.~-----.-------~------~.~-----.-------~-------- -- -- .. ____.. ____________ -‘ 20 40 80 80 100 100
TimeFsec)
200.0 ___-
_____ --------~---------------~-----------.---,--------_;___-___ -------;-------
9909
___/______.
UF_DUMMY_LUMEAR_SPlNE_LOAD_ i ____
---i
__--_--. __--_--
J
I
I __,__
P z P
--_-
_________
r __-----.
I I ________,_-___-__-______
33
r----‘---------
: I -I-------
.-------;-..-----
-100.0
I -----------------------c---------------
-200.0
.
20
-------r-‘-‘--~
80
.40
Time 5$wx) (msec) Time
2105
loo
Figure 4. Validationresultsof test driver airbagunbelted
-400.0 -500.0 ___-_____A_.-_------600.0
\ ---------i----.-.----------:
-700.0
i /
!/ WV--\' '
______.._________
I----------c--------! 50
-600.0 0
i __-.--
----.
_________I_______--100
150
Time (msec)
2000.0
0.0 _
-2000.0
\\ .a ,----
----------1---.---------
I I Lf'- _...___
+--
___..---.
'>
---------1_-______--------6000.0
-
/
___.____.-_--_____-____________i___
/ --~'---------.----..---:----------' 'II: \ f i __..__.__-_____.i..---_-..-(
--------+ __.__
-10000.0
_._____
',
-40w.o
-6000.0
I j--
. . .._.---.~~~~--~-~~-~~-~~------~~-.~-----~.~-~---------~
0
50
100
150
Time (msec) 200.0 ..- ______ F
1w.o
__-__
1_____---------------~----, I
model expenmenr
t __-_-_--_______________________I________-
_ _ _
_ _ A
2
--.,I-,
_______ 1
_ _ -y-- _ _ _ _ -. _--_____-_ ‘L-4
_________~______ I
-700.0
I
.---------;------------------------------800.0
_ _ _ _ _ _ _ _ _ -; _ _ _ _ - - - - - -, I
0
50
100
Time (msec)
2106


![Two Legs, Four Legs, Six Legs, More! - National Aquarium [PDF]](https://m.moam.info/img/260x300/two-legs-four-legs-six-legs-more-national-aquarium_64b37f23098a9e6a318b45ee.jpg)