This article was downloaded by: [Paula Schwanenflugel] On: 19 March 2014, At: 11:46 Publisher: Routledge Informa Ltd Registered in England and Wales Registered Number: 1072954 Registered office: Mortimer House, 37-41 Mortimer Street, London W1T 3JH, UK
Reading & Writing Quarterly: Overcoming Learning Difficulties Publication details, including instructions for authors and subscription information: http://www.tandfonline.com/loi/urwl20
The Longitudinal Relationship Between Reading Fluency and Reading Comprehension Skills in Second-Grade Children a
b
Stephanie A. Lai , Rebekah George Benjamin , Paula J. a
Schwanenflugel & Melanie R. Kuhn a
c
University of Georgia , Athens , Georgia , USA
b
Massachusetts College of Liberal Arts , North Adams , Massachusetts , USA c
Boston University , Boston , Massachusetts , USA Published online: 10 Mar 2014.
To cite this article: Stephanie A. Lai , Rebekah George Benjamin , Paula J. Schwanenflugel & Melanie R. Kuhn (2014) The Longitudinal Relationship Between Reading Fluency and Reading Comprehension Skills in Second-Grade Children, Reading & Writing Quarterly: Overcoming Learning Difficulties, 30:2, 116-138, DOI: 10.1080/10573569.2013.789785 To link to this article: http://dx.doi.org/10.1080/10573569.2013.789785
PLEASE SCROLL DOWN FOR ARTICLE Taylor & Francis makes every effort to ensure the accuracy of all the information (the “Content”) contained in the publications on our platform. However, Taylor & Francis, our agents, and our licensors make no representations or warranties whatsoever as to the accuracy, completeness, or suitability for any purpose of the Content. Any opinions and views expressed in this publication are the opinions and views of the authors, and are not the views of or endorsed by Taylor & Francis. The accuracy of the Content should not be relied upon and should be independently verified with primary sources of information. Taylor and Francis shall not be liable for any losses, actions, claims, proceedings, demands, costs, expenses, damages, and other liabilities whatsoever or howsoever caused arising directly or indirectly in connection with, in relation to or arising out of the use of the Content. This article may be used for research, teaching, and private study purposes. Any substantial or systematic reproduction, redistribution, reselling, loan, sub-licensing, systematic supply, or distribution in any form to anyone is expressly forbidden. Terms &
Downloaded by [Paula Schwanenflugel] at 11:46 19 March 2014
Conditions of access and use can be found at http://www.tandfonline.com/page/termsand-conditions
Reading & Writing Quarterly, 30: 116–138, 2014 Copyright © Taylor & Francis Group, LLC ISSN: 1057-3569 print/1521-0963 online DOI: 10.1080/10573569.2013.789785
The Longitudinal Relationship Between Reading Fluency and Reading Comprehension Skills in Second-Grade Children
Downloaded by [Paula Schwanenflugel] at 11:46 19 March 2014
STEPHANIE A. LAI University of Georgia, Athens, Georgia, USA
REBEKAH GEORGE BENJAMIN Massachusetts College of Liberal Arts, North Adams, Massachusetts, USA
PAULA J. SCHWANENFLUGEL University of Georgia, Athens, Georgia, USA
MELANIE R. KUHN Boston University, Boston, Massachusetts, USA
Fluent readers can read connected text with accuracy, automaticity, and prosody. Without practice, automaticity cannot develop in reading, and readers must focus their attention on decoding, limiting their ability to simultaneously comprehend. Researchers have traditionally assumed that fluency and comprehension have a unidirectional relationship whereby fluency affects comprehension. However, a recent study by Klauda and Guthrie suggests that the relationship between fluency and comprehension may be reciprocal over time; that is, comprehension may also predict fluency. In the present study we examine this reciprocal relationship using structural equation modeling. We test various models that measure the relationship between fluency and comprehension over 3 time points spanning an academic year. The results indicate that compared to the traditional model in which fluency predicts concurrent comprehension, models
The authors thank Dr. Deborah Bandalos for commenting on an earlier version of this article. Address correspondence to Stephanie A. Lai, Department of Educational Psychology, University of Georgia, 110 Carlton Street, Athens, GA 30602, USA. E-mail:
[email protected] 116
Fluency and Comprehension
117
Downloaded by [Paula Schwanenflugel] at 11:46 19 March 2014
exhibiting a reciprocal relationship do not fit the data better. We discuss the implications of these results.
Reading fluency’s contribution to reading comprehension is well established (e.g., Klauda & Guthrie, 2008; Kuhn & Stahl, 2003; Schwanenflugel et al., 2006), but questions about the directionality of this relationship remain unanswered. Oral reading fluency is commonly used as a predictor of comprehension in young readers, as fluent readers are likely to have more cognitive resources for understanding text (LaBerge & Samuels, 1974; Miller & Schwanenflugel, 2006). Empirical research often reports moderate to high positive correlations between fluency and comprehension (e.g., Fuchs, Fuchs, Hosp, & Jenkins, 2001; Klauda & Guthrie, 2008; Schwanenflugel et al., 2006). The relationship between fluency and comprehension is so strong that fluency is often referred to as the bridge between decoding and comprehension (Pikulski & Chard, 2005). Put this way, it implies that fluency’s role in comprehension is unidirectional—Fluency supports comprehension, and without it readers will struggle to comprehend what they read. Researchers have recently suggested that there might be a reciprocal relationship between fluency and comprehension (Klauda & Guthrie, 2008). Our goal here is to examine the directionality of the relationship between fluency and reading comprehension. We test the longitudinal relationship between fluency and comprehension by modeling the interaction between the two over time.
COMPONENTS OF READING FLUENCY Kuhn, Schwanenflugel, and Meisinger (2010) claimed that fluency is made up of multiple components: decoding, sight-word reading, connected text reading, and appropriate prosody. These components do not necessarily develop separately, but together they are necessary for good fluency.
Decoding Phonemic decoding (or simply decoding) refers to skills underlying the ability to translate groups of letters into sounds and is important to fluency and later reading ability (Ehri, 1995; Hudson, Pullen, Lane, & Torgesen, 2009). Chall (1996) described decoding ability as a necessary prerequisite to fluent reading. McKenna and Stahl (2009) placed decoding along with sightword reading as prerequisites for developing fluency. The simple view of reading (Gough & Tunmer, 1986) describes decoding as fundamental to reading comprehension.
118
S. A. Lai et al.
Sight-Word Reading Automatic sight-word reading is necessary for reading texts in a fluid manner (Ehri, 1995; Kuhn et al., 2010). Skill in sight-word reading is sometimes used as a proxy for reading fluency (e.g., Hagan-Burke, Burke, & Crowder, 2006; Miller & Schwanenflugel, 2008; Speece & Ritchey, 2005; Torgesen, Rashotte, & Alexander, 2001). Sight-word reading is included as a fundamental element of skilled reading in many theories of reading development (e.g., Ehri, 1995; Hudson et al., 2009; Perfetti, 1988; Samuels, 1994; Stanovich, 1991).
Downloaded by [Paula Schwanenflugel] at 11:46 19 March 2014
Connected Text Reading The ability to read connected text quickly and accurately is sometimes called context reading skill, and it lies at the heart of reading fluency ( Jenkins, Fuchs, van den Broek, Espin, & Deno, 2003). Context reading can benefit from the semantic activation provided by the reading of ongoing text ( Jenkins et al., 2003; Katzir et al., 2006). Rate and accuracy in reading connected text make up two of the three components used to define fluent oral reading (Kuhn et al., 2010; National Institute of Child Health and Human Development, 2000).
Prosody Another main component of fluent reading is appropriate expression. Fluent readers tend to read with appropriate pitch variation, pause structure, and stress (e.g., Benjamin & Schwanenflugel, 2010; Clay & Imlach, 1971; Daane, Campbell, Grigg, Goodman, & Oranje, 2005; Miller & Schwanenflugel, 2006, 2008; Schwanenflugel, Hamilton, Kuhn, Wisenbaker, & Stahl, 2004). Some measures of reading prosody focus on acoustic measures of oral reading, such as pitch contour, pausing, and stress displayed while reading (e.g., Benjamin & Schwanenflugel, 2010; Dowhower, 1987; Koriat, Greenberg, & Kreiner, 2002; Miller & Schwanenflugel, 2006, 2008; Ravid & Mashraki, 2007; Schwanenflugel et al., 2004; Whalley & Hansen, 2006). Others use rating scales that incorporate prosody as an aspect of the fluency rating system (e.g., Daane et al., 2005; Zutell & Rasinski, 1991).
FLUENCY AND READING COMPREHENSION Reading comprehension is a complex construct and is conventionally viewed as the end goal of reading. Furthermore, readers who have developed skills in the various components of fluency are better able to construct meaning from a text than are disfluent readers (Kuhn et al., 2010). When reading, readers must attend to two broad, interdependent tasks: They must
Downloaded by [Paula Schwanenflugel] at 11:46 19 March 2014
Fluency and Comprehension
119
determine the words in the text and the meaning that the text is trying to convey. Because these tasks are accomplished simultaneously, readers must constantly divide their attention between the two, and a lack of automaticity at a lower level of processing (e.g., letter level or word level) can impede the rate of higher level processing (e.g., sentence level or text level; Logan, 1997; Rumelhart, 1994; Samuels, 1994). As lower level processes become automatic with practice, higher level processes are less disrupted (see Logan, 1997, for a review). Until readers are able to decode words automatically, they cannot attend to two nonautomatic tasks simultaneously, so comprehension suffers (Logan, 1997; Rumelhart, 1994; Samuels, 1994). Kuhn et al. (2010) also described a complementary perspective on fluency’s relationship with comprehension, focusing on the impact of prosody. When children can read a text with appropriate rate and accuracy, they also incorporate proper phrasing and expression (Benjamin & Schwanenflugel, 2010; Clay & Imlach, 1971; Miller & Schwanenflugel, 2006, 2008). Prosody may serve as a naturally occurring scaffold for comprehension (Cutler, Dahan, & van Donselaar, 1997; Frazier, Carlson, & Clifton, 2006). That is, it may serve as a tool for chunking speech in working memory, allowing the listener to recall larger segments of speech than might otherwise be possible (Frazier et al., 2006; Swets, Desmet, Hambrick, & Ferreira, 2007). This prosodic scaffolding might help readers comprehend texts when rate and accuracy alone are insufficient (Benjamin & Schwanenflugel, 2010). Fluency, then, is currently defined as a construct which combines accuracy, automaticity, and oral reading prosody, which, taken together, facilitate the reader’s construction of meaning. It is demonstrated during oral reading through ease of word recognition, appropriate pacing, phrasing, and intonation. It is a factor in both oral and silent reading that can limit or support comprehension. (Kuhn et al., 2010, p. 240)
Most recent research supports the long-held belief that children’s fluency can predict both concurrent as well as future comprehension skills (e.g., Klauda & Guthrie, 2008; Roehrig, Petscher, Nettles, Hudson, & Torgesen, 2008; Valencia et al., 2010). Using only a measure of words correct per minute (WCPM), Miller and Schwanenflugel (2008) significantly predicted concurrent comprehension in third graders using a standardized reading comprehension test. Furthermore, simple measures of sight-word reading fluency in first and second grade significantly predicted students’ future comprehension scores later in third grade. Roehrig et al. (2008) found that a basic fluency assessment conducted earlier in the year predicted third-grade pass rates on a state-mandated spring reading comprehension assessment. Finally, Klauda and Guthrie (2008) found that word reading speed, phrasing, and expression accounted for substantial variance in concurrent reading
120
S. A. Lai et al.
comprehension scores among fifth graders. When predicting changes in comprehension scores 12 weeks later, Klauda and Guthrie’s Time Point 1 fluency measure (called syntactic processing) significantly predicted Time Point 2 comprehension when Time Point 1 comprehension was controlled. However, although this relationship was significant (p < .05), the R2 value of fluency’s unique contribution was only .004. Fluency, then, can serve as a powerful concurrent predictor of comprehension, but the longitudinal relationship between fluency and comprehension is not as fully established.
Downloaded by [Paula Schwanenflugel] at 11:46 19 March 2014
RECIPROCAL RELATIONSHIP BETWEEN FLUENCY AND COMPREHENSION Klauda and Guthrie (2008) suggested that the relationship between fluency and comprehension may be reciprocal over time—improvements in comprehension may, in turn, assist in the development of fluent reading. Interactive theories of reading (Rumelhart, 1994; Stanovich, 1991) posit that not only can increased familiarity with letters and words speed the recognition process and assist in comprehension, but various higher level processes (e.g., syntactic or semantic) can affect feature perception and word recognition (Rumelhart, 1994). The more background knowledge a reader has in various contexts, the more quickly he or she may be able to form and choose correct hypotheses about word identification and sentence structure. In addition, semantic priming effects exist when individuals are asked to recognize words semantically similar to the contexts that precede them (e.g., Stanovich, 1991). Increased skill in comprehension, then, may impact all features of fluency: prosody, accuracy, and decoding speed. Klauda and Guthrie (2008) examined the reciprocal relationship between fluency and comprehension in fifth-grade students over a 12-week period. Like others, they found that fluency predicted growth in reading comprehension across time points. They also found that comprehension, as measured at the start of their study, predicted growth in fluency after the 12-week time period. The effect size was very small, however (∆R2 = .006), so further work needs to be done to determine whether the effect grows over a longer period of time. Also, the measure of reading fluency that was used in the study was nontraditional—a measure of reading requiring the verification of a series of sentences read silently while being timed. Although silent reading is common among fifth graders, oral reading fluency is still a focus in the primary grades. Thus, the measure used by Klauda and Guthrie is removed from the measures of oral reading rate or WCPM typically used to measure oral reading fluency in younger children. Jenkins et al. (2003) examined the possible concurrent reciprocal relationship between fluency and comprehension in fourth graders. Overall they found that WCPM measured from reading connected text was a better predictor of
Fluency and Comprehension
121
Downloaded by [Paula Schwanenflugel] at 11:46 19 March 2014
comprehension than fluency measured from reading words on a list. They also looked at whether comprehension would be a good predictor of connected text WCPM once word list fluency was accounted for. Although they found that comprehension served as a better predictor of connected text WCPM than listreading speed (defined as the number of words read correctly per minute in a list), they found that list-reading time (defined as the average number of seconds taken to correctly read a word in a list) served as a better predictor of connected text reading time (the average number of seconds taken to read a word correctly in context) than comprehension. The results, then, depended upon the scale with which they measured fluency, so their findings were inconclusive. The inconclusive nature of both the Jenkins et al. and Klauda and Guthrie (2008) findings provided the impetus for the current study.
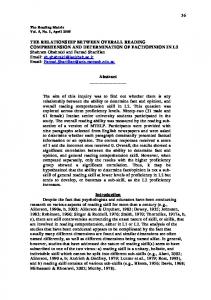
THE CURRENT STUDY Second grade is a key year for the development of reading fluency. In this study, second-grade children were assessed on four components of reading fluency (decoding skills, sight-word reading skills, context reading skills, and reading prosody) as well as reading comprehension at three time points (fall, winter, and spring). The models that were tested can be seen in Figure 1.
Traditional View Research has overwhelmingly supported the relationship fluency has with reading comprehension. The unidirectional relationship of fluency on comprehension is well researched and universally understood to be concurrent, at minimum. Included are direct paths from fluency at Time Point 1 to fluency at Time Point 2, comprehension at Time Point 1 to comprehension at Time Point 2, and so on. We call said model the traditional model because, in each case, the effect of fluency skill at any time point flows in one direction: from fluency to comprehension. We show these hypothesized relationships in Model 1 (see Figure 1). This serves as the base model from which the other hypothesized effects are evaluated.
Reciprocal View(s) Reciprocity between fluency and comprehension has considerably less evidence than the traditional model depicted previously. This model has to claim that comprehension skills can impact reading fluency beyond the impact of reading fluency on comprehension skills. In one version of this model, longitudinal reciprocal paths between fluency and comprehension are placed between adjacent time points (see hypothesized Model 2). Alternatively, it is possible that the influence of comprehension on fluency skill may have
S. A. Lai et al.
Downloaded by [Paula Schwanenflugel] at 11:46 19 March 2014
122
FIGURE 1 Theoretical models. (a) Model 1, the traditional base model. (b) Model 2, the basic reciprocal effects model. (c) Model 3, the lagged reciprocal effects model. NAEP = National Assessment of Educational Progress Oral Reading Fluency Scale; PD = Phonemic Decoding Efficiency subtest; SW = Sight Word Efficiency subtest; GORT = Gray Oral Reading Test–Fourth Edition; WIAT = Wechsler Individual Achievement Test; Comp = comprehension.
a longer lag (see hypothesized Model 3). Several researchers have shown that fluency can predict children’s reading comprehension skills at fairly long lags (i.e., across an entire school year or longer; e.g., Roehrig et al., 2008). To test
Fluency and Comprehension
123
this idea of a long-term lagged reciprocal effect, we tested a model in which scores on assessments of reading fluency and comprehension skill given in the first month of school were related reciprocally to assessments given at the end of the school year. All models were identical in their measurement component; that is, the only difference between models involved path placements between fluency and comprehension.
METHODS
Downloaded by [Paula Schwanenflugel] at 11:46 19 March 2014
Participants and Procedures Participants were 154 second graders (50% boys, 50% girls; mean age = 7 years, 6 months, SD = 4 months; range = 6 years, 6 months, to 8 years, 9 months; 60% African American, 29% Euro-American, 7% Hispanic American, and 4% other) who were part of a larger multisite longitudinal study on the development of reading fluency (Schwanenflugel et al., 2009). Of the children, 25% were receiving some remedial education services, but none were receiving English as a second language services. From the original sample of 154 students, 3 students were eliminated because of missing values on the assessments at one time point (2% attrition); therefore, 151 students remained for our analyses. According to Kline (2005), this can be considered a medium sample size, although model complexity must also be considered.
Measures Assessments included measures of word reading efficiency, oral reading fluency, and reading comprehension chosen for their fidelity to the construct being measured and their published psychometric quality. Children were assessed within the first month of the school year, again approximately 4 months later, and then within a month of the end of the school year. Assessments were counterbalanced so that half of the participants received the sight-word and reading fluency assessments first and the others the reading comprehension assessment first. Testers were trained to achieve 100% agreement with an EdS school psychologist during the first week of testing. WORD READING EFFICIENCY The Test of Word Reading Efficiency measures the ability to pronounce printed words accurately and fluently (Torgesen, Wagner, & Rashotte, 1999). The Test of Word Reading Efficiency has two subtests: Sight Word Efficiency and Phonemic Decoding Efficiency. The Sight Word Efficiency subtest assesses the number of printed words accurately identified in 45 s. The Phonemic Decoding Efficiency subtest assesses the number of pronounceable printed nonwords accurately decoded in 45 s. The total score combines the standard scores of the individual subtests. Reliabilities range from .83 to .96. The validity evidence with other related reading measures exceeds .80.
124
S. A. Lai et al.
ORAL READING FLUENCY—RATE AND ACCURACY The Gray Oral Reading Test–Fourth Edition (GORT–4; Wiederholt & Bryant, 2001) was used to measure children’s oral reading of connected text. The GORT–4 consists of a set of increasingly difficult texts that are read aloud until the child reaches the ceiling rule for stopping. Children’s total fluency scores are based on the number of miscues and time to read each passage. Internal consistency reliabilities are greater than .90 for children within the age ranges in this study. Validity evidence with other reading measures ranges from .39 to .89 (median r = .64).
Downloaded by [Paula Schwanenflugel] at 11:46 19 March 2014
ORAL READING FLUENCY—PROSODY The National Assessment of Educational Progress Oral Reading Fluency Scale was used as a measure of reading prosody. The scale measures reading fluency as evidenced through intonation, stress, pausing, adherence to the author’s syntax, and expressiveness. The rubric distinguishes four levels of fluency (see Daane et al., 2005). This rubric was found to be moderately reliable, with an intraclass correlation coefficient of .82 (Daane et al., 2005). To determine interrater reliability for this study, we obtained tester ratings for the audiofiles of 16 participants reading one passage of the GORT-4, and an intraclass correlation of .82 was obtained. READING COMPREHENSION The reading comprehension subtest of the Wechsler Individual Achievement Test (Psychological Corporation, 1992) consists of a series of passages that children can read silently or aloud. Children are asked a question about each passage which they answer aloud in their own words. They continue to read passages until they reach their ceiling. The number of questions answered correctly determines the score on the test. The manual reports high reliability coefficients, exceeding .85, and high validity with other individually administered achievement tests (.78 to .81).
RESULTS Data Analysis Strategy Structural equation models were analyzed using LISREL Version 8.71 ( Jöreskog & Sörbom, 2004a), with the covariance matrix generated using PRELIS Version 2.71 ( Jöreskog & Sörbom, 2004b). Descriptive statistics are presented in Table 1 for all raw scores and scaled scores at each time point. In addition, although the model results were based on analyses of a covariance matrix of raw scores, a correlation matrix of raw scores along with standard deviations is presented in Table 2. Examination of skewness
Fluency and Comprehension
125
TABLE 1 Descriptive Statistics for Measures at Time Points 1, 2, and 3 (N = 151) Variable
M
SD
Skewness
Kurtosis
Downloaded by [Paula Schwanenflugel] at 11:46 19 March 2014
Fall scores—Time Point 1 TOWRESW-F Raw score Scaled score TOWREPD-Fa Raw score Scaled score WIAT-Fb Raw score Scaled score GORT-Fc Raw score Scaled score NAEP-F Raw score TOWRESW-W Raw score Scaled score TOWREPD-Wa Raw score Scaled score WIAT-Wb Raw score Scaled score GORT-Wc Raw score Scaled score NAEP-W Raw score TOWRESW-S Raw score Scaled score TOWREPD-Sa Raw score Scaled score WIAT-Sb Raw score Scaled score GORT-Sc Raw score Scaled score NAEP-S Raw score
33.85 95.44
14.773 12.503
.318 .046
–0.490 –0.061
12.03 92.83
9.206 12.119
.847 .385
0.366 –0.325
11.11 97.95
5.748 13.616
.063 .141
–0.430 0.211
19.63 7.06
14.550 3.003
.647 .659
–0.033 0.172
.148
–1.176
1.77 1.372 Winter scores—Time Point 2 43.74 97.18
13.681 13.435
–.070 –.072
–0.644 –0.329
16.07 93.93
9.926 12.523
.520 .195
–0.422 –0.509
13.98 99.75
5.460 13.661
–.090 .420
0.356 0.666
26.32 7.98
16.366 3.318
.658 .544
–0.050 –0.135
.110
–0.782
1.91 1.202 Spring scores—Time Point 3 47.88 98.99
13.394 13.079
–.014 .034
–0.939 –0.713
19.05 96.25
10.33 12.219
.423 .121
–0.464 –0.419
15.86 102.49
4.810 12.447
.107 .513
0.457 1.381
32.24 8.36
13.605 2.947
.395 .192
–0.381 –0.387
2.31
0.988
–.240
–0.459
Note. TOWRESW = Test of Word Reading Efficiency Sight Word Efficiency subtest; TOWREPD = Test of Word Reading Efficiency Phonemic Decoding Efficiency subtest; WIAT = Wechsler Individual Achievement Test Reading Comprehension subtest; GORT = Gray Oral Reading Test; NAEP = National Assessment of Educational Progress Oral Reading Fluency Scale; F = fall administration; W = winter administration; S = spring administration. a Normative mean = 100, SD = 15. b Normative mean = 100, SD = 15. c Normative mean = 10, SD = 3.
126
S. A. Lai et al.
Downloaded by [Paula Schwanenflugel] at 11:46 19 March 2014
and kurtosis revealed no violations of univariate or multivariate normality (Chou & Bentler, 1995; Kline, 2005). Maximum likelihood estimation was used to test the models. Data were screened for outliers using DeCarlo’s macro. DeCarlo’s macro determines the significance of multivariate outliers and the distance. We examined the critical values of the Bonferroni procedure and compared them with Mahalanobis distance. Mahalanobis distance is a measure of how far an observation’s values on the variables are from the multivariate mean of all of the variables. Only one observation met the criteria for multivariate outliers at the .01 significance level. The outlier was not removed because the value was not very high and likely represented true sample variation.
Fit Indices The path coefficients of the observed variables (measures) were analyzed to identify whether they fit. All fluency measures at each time point significantly fit the latent structure proposed by theory (see Table 3). Stand-alone and incremental (comparing model to baseline model) goodness-of-fit indices are reported. The chi-square model fit assesses the size of the discrepancy between the sample covariance matrix and the covariance matrix implied by the hypothesized model. If the chi-square is nonsignificant, then the model may be a reasonable representation of the data (Kline, 2005). However, chi-square is overly sensitive to sample size and divergence from normality. Thus, we also report the root mean square error of approximation (RMSEA), which assesses the lack of fit in the population not due to sampling error (Kline, 2005). The RMSEA is sensitive to model misspecification but not distribution and sample size. Hu and Bentler (1998) considered values less than .06 as evidence of good fit. In addition, we report the standardized root-mean-square residual (SRMR), which measures the average of the residual elements and is considered advantageous given its sensitivity to model misspecification. Recommended values accepted as cutoff points for good fit include .09 (Hu & Bentler, 1998, 1999) and .10 (Kline, 2005). Several incremental indices are also reported. The comparative fit index (CFI) is sensitive to model misspecification but not distribution or sample size. We also report the nonnormed fit index (NNFI), which is also sensitive to misspecification and less sensitive to distribution and sample size. For both CFI and NNFI, Hu and Bentler (1998, 1999) recommended a cutoff value of .95. Furthermore, because Model 1 was nested within Models 2 and 3, a chi-square difference test was conducted. If the chi-square difference is significant, a model with additional parameters fits significantly better than a more parsimonious model. Table 4 presents the fit indices for the models, and Table 5 presents the standardized path coefficients, t values, and R2
127
1
2
3
5
6
7
8
9
10
11
12
13
5.748 .768** 1.372 .680** .646** 9.926 .812** .747** .782** 13.681 .810** .755** .802** .872** 16.366 .863** .748** .641** .800** .788** 5.460 .760** .743** .697** .794** .827** .761** 1.202 .682** .649** .884** .795** .802** .680** .684** 10.330 .804** .759** .790** .912** .845** .773** .768** .806** 13.394 .721** .740** .783** .841** .897** .751** .771** .798** .732** 13.605 .824** .676** .636** .768** .756** .844** .684** .673** .831** .721** .647** .623** .584** .691** .712** .643** .670** .622** .702** .682**
4
4.810 .590**
14
.988
15
Note. Listwise N = 151. Standard deviations are on the diagonal. TOWREPD = Test of Word Reading Efficiency Phonemic Decoding Efficiency subtest; TOWRESW = Test of Word Reading Efficiency Sight Word Efficiency subtest; GORT = Gray Oral Reading Test; WIAT = Wechsler Individual Achievement Test Reading Comprehension subtest; NAEP = National Assessment of Educational Progress Oral Reading Fluency Scale; F = fall administration; W = winter administration; S = spring administration. **Correlation is significant at the .01 level (2-tailed).
1. TOWREPD-F 9.206 2. TOWRESW-F .860** 14.773 3. GORT-F .813** .925** 14.550 4. WIAT-F .760** .881** .863** 5. NAEP-F .753** .880** .815** 6. TOWREPD-W .829** .782** .738** 7. TOWRESW-W .818** .900** .854** 8. GORT-W .809** .878** .886** 9. WIAT-W .727** .813** .808** 10. NAEP-W .694** .823** .784** 11. TOWREPD-S .833** .752** .719** 12. TOWRESW-S .799** .869** .838** 13. GORT-S .775** .809** .822** 14. WIAT-S .692** .775** .758** 15. NAEP-S .603** .637** .637**
Variable
TABLE 2 Correlation Matrix With Standard Deviations for Model of Fluency and Comprehension (N = 151)
Downloaded by [Paula Schwanenflugel] at 11:46 19 March 2014
128
S. A. Lai et al.
TABLE 3 Standardized Path Coefficients, t Values, and R2 for Measured Variables Path TOWREPD-F → Fluency 1 TOWRESW-F → Fluency 1 GORT-F → Fluency 1 NAEP-F → Fluency 1 TOWREPD-W → Fluency 2 TOWRESW-W → Fluency 2 GORT-W → Fluency 2 NAEP-W → Fluency 2 TOWREPD-S → Fluency 3 TOWRESW-S → Fluency 3 GORT-S → Fluency 3 NAEP-S → Fluency 3
Downloaded by [Paula Schwanenflugel] at 11:46 19 March 2014
t
R2
13.67 16.39 15.65 12.73 16.34 —a 23.08 17.32 16.32 —a 18.98 12.15
.77 .95 .90 .71 .71 .88 .89 .75 .73 .86 .82 .56
Path Coefficient 8.15 14.37 13.83 1.15 8.36 12.82 15.42 1.04 8.77 12.40 12.32 0.74
Note. Values significant at p > .05 are indicated in boldface. TOWREPD = Test of Word Reading Efficiency Phonemic Decoding Efficiency subtest; TOWRESW = Test of Word Reading Efficiency Sight Word Efficiency subtest; GORT = Gray Oral Reading Test; NAEP = National Assessment of Educational Progress Oral Reading Fluency Scale; F = fall administration; W = winter administration; S = spring administration. a No t test was done because factors were endogenous, so LISREL set these factor loadings to 1 automatically and then rescaled them after other parameters were estimated. Thus, the loading was not estimated; rather, it was set and rescaled.
values for each model. The R2 values were similar for all models; therefore, they are only discussed in the text for Model 1.
Model 1 Model 1 served as the traditional model (see Figure 2) to test existing research on the effects of fluency on comprehension at each of the three time points. OVERALL MODEL FIT The overall fit of the model was moderately good (see Table 4). The chisquare value was significant, χ2(71, N = 151) = 106.14, p = .004, but other indices indicated good fit: RMSEA = .053, SRMR = .019, CFI = 1.00, NNFI = .99.
TABLE 4 Fit Statistics for Baseline Model and Hypothesized Models Model 1 2 3
χ2
df
RMSEA
SRMR
CFI
NNFI
∆χ2
∆df
106.14 105.69 105.30
71 69 69
.053 .055 .055
.019 .02 .019
1.00 1.00 1.00
.99 .99 .99
.45 .84
2 2
Note. N = 151. The chi-square difference tests were between each model and Model 1. RMSEA = root mean square error of approximation; SRMR = standardized root-mean-square residual; CFI = comparative fit index; NNFI = nonnormed fit index.
Fluency and Comprehension
129
TABLE 5 Standardized Direct Path Coefficients, t Values, and R2 for Structural Models Model 1
Downloaded by [Paula Schwanenflugel] at 11:46 19 March 2014
All possible paths
PC
t
To Comprehension 1 from Fluency 1 0.95 14.31 To Comprehension 2 from Comprehension 1 0.47 2.67 Fluency 2 0.46 2.69 Fluency 1 —a —a To Comprehension 3 from Fluency 3 0.19 0.76 Comprehension 2 0.74 2.75 Comprehension 1 —a —a Fluency 2 —a —a a Fluency 1 — —a To Fluency 2 from Fluency 1 0.96 14.15 To Fluency 3 from Fluency 2 0.98 26.19 Fluency 1 —a —a a Comprehension 2 — —a Comprehension 1 —a —a
Model 2 R2
PC
t
0.95
14.31
0.49 0.44 —a
2.69 2.52 —a
0.13 0.72 —a 0.07 —a
0.34 1.81 —a 0.16 —a
0.95
14.15
0.94 —a 0.05 —a
12.98 —a 0.68 —a
.90
Model 3 R2
PC
t
.90
.82
.91 0.95 14.34
.82
.83
.82 0.44 0.48 —a
2.51 2.84 —a
.82
.91
.86 0.13 0.39 0.84 0.95 —a —a —a —a –0.04 –0.076
.91
.97
R2
.91 0.96 14.18
.96
.97 1.06 11.88 —a —a –0.08 –0.94
Note. Values significant at p > .05 are indicated in boldface. PC = path coefficient. a No direct path in the model.
VALUES OF DIRECT PATHS The standardized path coefficients are shown for paths that were statistically significant, and dashed lines indicate nonsignificant path values. Most, but
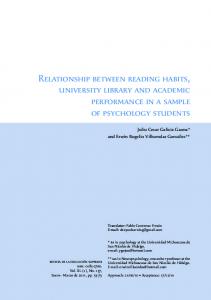
FIGURE 2 Structural equation model examination of Model 1, the traditional base model, predicting a concurrent unidirectional relationship between fluency and comprehension. Solid lines represent significant paths, dashed lines nonsignificant paths. NAEP = National Assessment of Educational Progress Oral Reading Fluency Scale; PD = Phonemic Decoding Efficiency subtest; SW = Sight Word Efficiency subtest; GORT = Gray Oral Reading Test–Fourth Edition; WIAT = Wechsler Individual Achievement Test; Comp = comprehension.
130
S. A. Lai et al.
not all, of the hypothesized direct paths were statistically significant in Model 1 (see Figure 2). As expected, Fluency 1 predicted performance at Fluency 2, and Fluency 2 predicted performance at Fluency 3. The same effect existed for comprehension at each time point. In addition, Fluency 1 and 2 significantly and positively predicted Comprehension 1 and 2, respectively. This was, however, not the case for Fluency 3 to Comprehension 3. The low values here may be due to the fact that much of the variance had already been explained at earlier time points.
Downloaded by [Paula Schwanenflugel] at 11:46 19 March 2014
R2 VALUES The R2 value represents the proportion of variance in a variable that is accounted for by the variables that load onto it (see Table 5). For example, Fluency 1 accounted for most of the variance in Fluency 2 (R2 = .91). Similarly, Fluency 1 (indirectly) and Fluency 2 accounted for nearly all of the variance in Fluency 3 (R2 = .97). This is to be expected because the same students were taking the same fluency measures; thus, a high score in the fall predicts a high score in the winter, and high scores at these time points predict a high score in the spring. In addition, when children were assessed in the fall, at Time Point 1, fluency accounted for nearly all of the variance in comprehension (R2 = .90). As children progressed through the school year, more predictive variables preceded the later time points. For example, Fluency 1 was the only variable that loaded onto Comprehension 1, but three variables loaded onto Comprehension 2: Comprehension 1, Fluency 2, and Fluency 1 (indirectly). In other words, with more preceding variables, the value of R2 was lower (R2 = .82) because more error variance was taken into account. Comprehension 3 was further predicted by all of the variables in the model; therefore, the error at each time was also being taken into account. Even so, a substantial amount of variance was explained (R2 = .83).
Model 2 Two models were analyzed to test Klauda and Guthrie’s (2008) hypothesis of a bidirectional relationship between fluency and comprehension at short lags. One of the models examined a bidirectional relationship from Fluency 1 to Comprehension 2 and Comprehension 1 to Fluency 2 (i.e., from the beginning of the year to approximately mid-year), and the other model examined the relationship from Fluency 2 to Comprehension 3 and Comprehension 2 to Fluency 3 (i.e., from approximately mid-year to the end of the school year). When the first of these was tested, a negative error variance occurred from Fluency 3 to Comprehension 3, likely due to collinearity. All of the variance that could be accounted for by these variables had been accounted for by the end of the second time point. This model was not further investigated. In addition, a model in which
Fluency and Comprehension
131
longitudinal reciprocal paths between fluency and comprehension were placed between adjacent time points was not analyzed; this model was overspecified. Therefore, only the model that included a bidirectional relationship between Fluency 2 to Comprehension 3 and Comprehension 2 to Fluency 3 was used to test Klauda and Guthrie’s hypothesis (see Figure 3).
Downloaded by [Paula Schwanenflugel] at 11:46 19 March 2014
OVERALL MODEL FIT Model 2 hypothesized a bidirectional relationship between fluency and comprehension and acted as a comparison model to the base model. Model 2 is shown in Figure 3, where standardized path coefficients are shown for paths that were statistically significant and dashed lines indicate nonsignificant path values. The overall fit of the model was good:
FIGURE 3 Structural equation model examination of Model 2 (the basic reciprocal effects model predicting a bidirectional relationship between fluency and comprehension; top panel) and Model 3 (the lagged reciprocal effects model; bottom panel). Solid lines represent significant paths, dashed lines nonsignificant paths. NAEP = National Assessment of Educational Progress Oral Reading Fluency Scale; PD = Phonemic Decoding Efficiency subtest; SW = Sight Word Efficiency subtest; GORT = Gray Oral Reading Test–Fourth Edition; WIAT = Wechsler Individual Achievement Test; Comp = comprehension.
132
S. A. Lai et al.
χ2(69, N = 151) = 105.69, p = .003; RMSEA = .055, SRMR = .02, CFI = 1.00, NNFI = .99. Model 2 fit equally as well as Model 1 (∆χ2 = .45) indicating that a bidirectional relationship between fluency and comprehension did not fit the data any better than the bottom-up model of a unidirectional relationship (see Table 4). Following the parsimony principle (Kline, 2005), Model 1 was preferred over Model 2.
Downloaded by [Paula Schwanenflugel] at 11:46 19 March 2014
VALUES OF DIRECT PATHS Five of the nine hypothesized direct paths were statistically significant in Model 2 (see Table 5). The paths from Fluency 3 to Comprehension 3 and Comprehension 2 to Comprehension 3 were not statistically significant, with much of the variance explained by the preceding time points of each variable. In testing Klauda and Guthrie’s (2008) hypothesis of a bidirectional relationship between fluency and comprehension, we found that the paths from Fluency 2 to Comprehension 3 and Comprehension 2 to Fluency 3 were not statistically significant. This provided further evidence that Model 2 did not fit the data better than the more parsimonious Model 1.
Model 3 A third model (see Figure 3) was tested in which we hypothesized possible long-term lagged effects (i.e., from Time 1 to Time 3) in the bidirectional relationship between fluency and comprehension. OVERALL MODEL FIT The overall fit of the model was good, χ2(69, N = 151) = 105.30, p = .003; RMSEA = .055, SRMR = .019, CFI = 1.00, NNFI = .99. The third model also fit equally well as Model 1 (∆χ2 = .84), indicating that a lagged effect of a bidirectional relationship between fluency and comprehension did not fit the data any better than the traditional model. VALUES OF DIRECT PATHS Similar to Model 2, the paths from Fluency 3 to Comprehension 3 and Comprehension 2 to Comprehension 3 were not statistically significant. In testing for lagged effects, we found that the paths from Fluency 1 to Comprehension 3 and Comprehension 1 to Fluency 3 were not statistically significant. In accordance with Model 2, a bidirectional relationship did not exist between fluency and comprehension. Taken together, these findings provided evidence for the unidirectional effect of fluency on comprehension predicted by the traditional model (Model 1).
Fluency and Comprehension
133
Downloaded by [Paula Schwanenflugel] at 11:46 19 March 2014
DISCUSSION The present study sought to determine the relationship between comprehension and fluency over time. Specifically, as suggested by Klauda and Guthrie (2008), we investigated the possibility of a reciprocal relationship between the two. We successfully tested three models: a traditional model, in which fluency concurrently predicted comprehension (Model 1); a model testing reciprocal relationships between adjacent time points (Model 2); and finally a model testing long-term lagged reciprocal effects between Time Points 1 and 3 (Model 3). The results indicated that a theoretical model that included a reciprocal relationship between fluency and comprehension (Model 2) did not explain the data better than the more traditional model describing a unidirectional relationship (Model 1). The predicted path from comprehension at Time Point 2 to fluency at Time Point 3 was not significant. Model 3, which examined the possibility of a long-lagged effect, also revealed nonsignificant paths. Again, the predicted path from comprehension at Time Point 1 to fluency at Time Point 3 was nonsignificant. In short, neither of our tests of Models 2 and 3 found evidence for reciprocity. One potential reason for the discrepancy between our findings and Klauda and Guthrie (2008) may be the differences in the measures of fluency used in each study. Klauda and Guthrie found that the bidirectional relationship only existed at the syntactic level—defined as “accuracy and speed in processing phrase and sentence units of text” (p. 314) and measured by the Woodcock–Johnson III Reading Fluency Test (a test that requires students to respond “yes” or “no” to each of 98 simple sentences as they read as many as possible in 3 min). This assessment, rather than assessing oral reading fluency, seems to assess students’ rapid reading, perhaps even skimming, and comprehension skills. In contrast, our study included assessments of the construct of oral reading fluency, including decoding skills, automatic sightword reading, and expression to examine the bidirectional relationship. It is possible that Klauda and Guthrie found a small reciprocal effect of comprehension on fluency due to the nature of the syntactic-level fluency assessment they used, which we feel is a less comprehensive and more idiosyncratic depiction of fluency than the one we used. To be fair, our treatment of reading comprehension may not have been as complex as it might have been. Perhaps if we had used a different measure of comprehension, we might have found the reciprocal relationship identified by Klauda and Guthrie (2008). Yet both our assessment and theirs involved answering passage questions. Theirs was a group test requiring silent reading (i.e., the Gates-MacGinitie Reading Test; MacGinitie, MacGinitie, Maria, & Dreyer, 2000), whereas ours was an individual assessment that allowed the child to choose the mode of passage reading. Both measures capture what many teachers consider a key indicator of reading comprehension (i.e.,
Downloaded by [Paula Schwanenflugel] at 11:46 19 March 2014
134
S. A. Lai et al.
answering questions about text; Richardson, Anders, Tidwell, & Lloyd, 1991), and both have validity evidence (Foegen, Espin, Allinder, & Markell, 2001; Smith & Smith, 1998). Klauda and Guthrie collected other evidence of skills related to comprehension, such as prior knowledge and inference ability, but did not use them in their analyses regarding reciprocity. Still, it would be important to replicate these findings by using a broader range of comprehension measures than the current study did. A third, potentially important, reason may be the differences in the absolute skill level of the samples. Klauda and Guthrie assessed fifth graders, who were most likely more sophisticated readers than the second graders we examined. Many studies seem to show that in the early grades much of the variance in comprehension can be accounted for by oral reading fluency (e.g., Fuchs et al., 2001; Kim, Petscher, Schatschneider, & Foorman, 2010; Valencia et al., 2010). Because reading fluency is emphasized in these grades, it seemed appropriate to look at second-grade students here. However, a reciprocal effect may only emerge once readers have reached a higher absolute skill level. Empirical studies examining the relationship between reading skills have often found moderate to high positive correlations between fluency and comprehension (e.g., Fuchs et al., 2001; Fuchs, Fuchs, & Maxwell, 1988; Klauda & Guthrie, 2008). The findings from the present study are consistent with automaticity theories (Logan, 1997; Samuels, 1994) but show little evidence of the reciprocal relationship predicted by interactive theories of reading (Rumelhart, 1994; Stanovich, 1984). In our models, fluency accounted for much of the variance in comprehension at a given time point, suggesting that, at least for this age group, fluency is still developing, and until decoding becomes automatic most of a reader’s focus is placed here rather than on detailed comprehension. Even young readers who are skilled in decoding can demonstrate good comprehension. In addition, interventions that focus on increasing fluency have been associated with significant gains in both fluency and comprehension (e.g., Markell & Deno, 1997; Neddenriep, Fritz, & Carrier, 2011; Spencer & Manis, 2010).
Implications for Practice and Research Fluency, particularly at young ages, is strongly associated with the capacity to read passages and answer questions about them. Incorporating reading fluency into classroom-based assessment is important in formulating educational decisions, such as “placing students in instructional text, monitoring students’ responsiveness to reading instruction, and identifying children for special intervention” (Fuchs et al., 2001, p. 251). To do this, it is necessary to have a strong focus on the assessment of oral reading fluency. Researchers should continue to examine the developmental relationship between fluency and comprehension. The typical developmental
Fluency and Comprehension
135
trajectory of oral reading fluency involves the greatest growth during the primary grades; therefore, a great overlap was expected between fluency and comprehension in the present second-grade sample. Because Klauda and Guthrie (2008) found only a small reciprocal effect in older students, it would be informative to examine a reciprocal relationship in older age groups in which comprehension demands may be more complex and involve different types of processes (e.g., analyzing narratives or processing expository texts, higher level comprehension).
Downloaded by [Paula Schwanenflugel] at 11:46 19 March 2014
REFERENCES Benjamin, R. G., & Schwanenflugel, P. J. (2010). Text complexity and oral reading prosody in young readers. Reading Research Quarterly, 45, 388–404. doi:10.1598/ RRQ.45.4.2 Chall, J. S. (1996). Stages of reading development (2nd ed.). Fort Worth, TX: Harcourt-Brace. Chou, C. P., & Bentler, P. M. (1995). Estimates and tests in structural equation modeling. In R. H. Hoyle (Ed.), Structural equation modeling: Concepts, issues, and applications (pp. 37–55). Thousand Oaks, CA: Sage. Clay, M. M., & Imlach, R. H. (1971). Juncture, pitch, and stress as reading behavior variables. Journal of Verbal Learning & Verbal Behavior, 10(2), 133–139. doi:10.1016/S0022-5371(71)80004-X Cutler, A., Dahan, D., & van Donselaar, W. (1997). Prosody in the comprehension of spoken language: A literature review. Language and Speech, 40, 141–201. doi:10.1177/002383099704000203 Daane, M. C., Campbell, J. R., Grigg, W. S., Goodman, M. J., & Oranje, A. (2005). Fourth-grade students reading aloud: NAEP 2002 special study of oral reading (NCES Publication No. 2006-469). Washington, DC: Government Printing Office. Dowhower, S. L. (1987). Effects of repeated reading on second-grade transitional readers’ fluency and comprehension. Reading Research Quarterly, 22, 389–406. doi:10.2307/747699 Ehri, L. (1995). Phases of development in learning to read words by sight. Journal of Research in Reading, 18, 116–125. doi:10.1111/j.1467-9817.1995.tb00077.x Foegen, A., Espin, C. A., Allinder, R. M., & Markell, M. A. (2001). Translating research into practice: Preservice teachers’ beliefs about curriculum-based measurement. Journal of Special Education, 34, 226–236. doi:10.1177/0022466901034 00405 Frazier, L., Carlson, K., & Clifton, C. (2006). Prosodic phrasing is central to language comprehension. Trends in Cognitive Sciences, 10, 244–249. doi:10.1016/j. tics.2006.04.002 Fuchs, L. S., Fuchs, D., Hosp, M., & Jenkins, J. R. (2001). Oral reading fluency as an indicator of reading competence: A theoretical, empirical, and historical analysis. Scientific Studies of Reading, 5, 239–256. doi:10.1207/S1532799XSSR0503_3 Fuchs, L. S., Fuchs, D., & Maxwell, L. (1988). The validity of informal measures of reading comprehension. Remedial and Special Education, 9, 20–28. doi:10.1177/ 074193258800900206
Downloaded by [Paula Schwanenflugel] at 11:46 19 March 2014
136
S. A. Lai et al.
Gough, P., & Tunmer, W. (1986). Decoding, reading, and reading disability. Remedial & Special Education, 7(1), 6–10. doi:10.1177/074193258600700104 Hagan-Burke, S., Burke, M., & Crowder, C. (2006). The convergent validity of the Dynamic Indicators of Basic Early Literacy Skills and the Test of Word Reading Efficiency for the beginning of first grade. Assessment for Effective Intervention, 31(4), 1–15. doi:10.1177/073724770603100401 Hu, L., & Bentler, P. M. (1998). Fit indices in covariance structure modeling: Sensitivity to underparameterized model misspecification. Psychological Methods, 3, 424–453. doi:10.1037/1082-989X.3.4.424 Hu, L., & Bentler, P. M. (1999). Cutoff criteria for fit indexes in covariance structure analysis: Conventional criteria versus new alternatives. Structural Equation Modeling, 6, 1–55. doi:10.1080/10705519909540118 Hudson, R., Pullen, P., Lane, H., & Torgesen, J. (2009). The complex nature of reading fluency: A multidimensional view. Reading & Writing Quarterly, 25(1), 4–32. doi:10.1080/10573560802491208 Jenkins, J. R., Fuchs, L. S., van den Broek, P., Espin, C., & Deno, S. L. (2003). Sources of individual differences in reading comprehension and reading fluency. Journal of Educational Psychology, 95, 719–729. doi:10.1037/0022-0663.95.4.719 Jöreskog, K. G., & Sörbom, D. (2004a). LISREL 8.71 for Windows [Computer software]. Lincolnwood, IL: Scientific Software International. Jöreskog, K. G., & Sörbom, D. (2004b). PRELIS 2.71 for Windows [Computer software]. Lincolnwood, IL: Scientific Software International. Katzir, T., Kim, Y., Wolf, M., O’Brien, B., Kennedy, B., Lovett, M., & Morris, R. (2006). Reading fluency: The whole is more than the parts. Annals of Dyslexia, 56(1), 51–82. doi:10.1007/s11881-006-0003-5 Kim, Y., Petscher, Y., Schatschneider, C., & Foorman, B. (2010). Does growth in oral reading fluency matter in predicting reading comprehension achievement? Journal of Educational Psychology, 102, 652–667. doi:10.1037/a0019643 Klauda, S. L., & Guthrie, J. T. (2008). Relationships of three components of reading fluency to reading comprehension. Journal of Educational Psychology, 100, 310–321. doi:10.1037/0022-0663.100.2.310 Kline, R. B. (2005). Principles and practice of structural equation modeling (2nd ed.). New York, NY: Guilford. Koriat, A., Greenberg, S. N., & Kreiner, H. (2002). The extraction of structure during reading: Evidence from reading prosody. Memory & Cognition, 30, 270–280. doi:10.3758/BF03195288 Kuhn, M. R., Schwanenflugel, P. J., & Meisinger, E. B. (2010). Aligning theory and assessment of reading fluency: Automaticity, prosody, and definitions of fluency. Reading Research Quarterly, 45, 230–251. doi:10.1598/RRQ.45.2.4 Kuhn, M. R., & Stahl, S. A. (2003). Fluency: A review of developmental and remedial practices. Journal of Educational Psychology, 95, 3–21. doi:10.1037/00220663.95.1.3 LaBerge, D., & Samuels, S. J. (1974). Toward a theory of automatic information processing in reading. Cognitive Psychology, 6, 293–323. doi:10.1016/0010-0285(74) 90015-2 Logan, G. D. (1997). Automaticity and reading: Perspectives from the instance theory of automatization. Reading & Writing Quarterly, 13, 123–146. doi:10.1080/ 1057356970130203
Downloaded by [Paula Schwanenflugel] at 11:46 19 March 2014
Fluency and Comprehension
137
MacGinitie, W. H., MacGinitie, R. K., Maria, K., & Dreyer, L. G. (2000). GatesMacGinitie reading tests: Manual for scoring and interpretation. Itasca, IL: Riverside. Markell, M. A., & Deno, S. L. (1997). Effects of increasing oral reading: Generalization across reading tasks. Journal of Special Education, 31, 233–250. doi:10.1177/ 002246699703100205 McKenna, M. C., & Stahl, K. (2009). Assessment for reading instruction (2nd ed.). New York, NY: Guilford. Miller, J., & Schwanenflugel, P. J. (2006). Prosody of syntactically complex sentences in the oral reading of young children. Journal of Educational Psychology, 98, 839–853. doi:10.1037/0022-0663.98.4.839 Miller, J., & Schwanenflugel, P. J. (2008). A longitudinal study of the development of reading prosody as a dimension of oral reading fluency in early elementary school children. Reading Research Quarterly, 43, 336–354. doi:10.1598/ RRQ.43.4.2 National Institute of Child Health and Human Development. (2000). Report of the National Reading Panel. Teaching children to read: An evidence-based assessment of the scientific research literature on reading and its implications for reading instruction: Reports of the subgroups (NIH Publication No. 00-4754). Washington, DC: U.S. Government Printing Office. Neddenriep, C. E., Fritz, A. M., & Carrier, M. E. (2011). Assessing for generalized improvements in reading comprehension by intervening to improve reading fluency. Psychology in the Schools, 48, 14–27. doi:10.1002/pits.20542 Perfetti, C. A. (1988). Verbal efficiency in reading ability. In M. Daneman, G. E. MacKinnon, & T. G. Waller (Eds.), Reading research: Advances in theory and practice (Vol. 6, pp. 109–143). New York, NY: Academic. Pikulski, J. J., & Chard, D. J. (2005). Fluency: Bridge between decoding and reading comprehension. Reading Teacher, 58, 510–519. doi:10.1598/RT.58.6.2 Psychological Corporation. (1992). Wechsler Individual Achievement Test. San Antonio, TX: Author. Ravid, D., & Mashraki, Y. E. (2007). Prosodic reading, reading comprehension and morphological skills in Hebrew-speaking fourth graders. Journal of Research in Reading, 30, 140–156. doi:10.1111/j.1467-9817.2007.00340.x Richardson, V., Anders, P., Tidwell, D., & Lloyd, C. (1991). The relationship between teachers’ beliefs and practices in reading comprehension instruction. American Educational Research Journal, 28, 559–586. doi:10.3102/00028312028003559 Roehrig, A., Petscher, Y., Nettles, S., Hudson, R., & Torgesen, J. (2008). Accuracy of the DIBELS oral reading fluency measure for predicting third grade reading comprehension outcomes. Journal of School Psychology, 46, 343–366. doi:10.1016/j.jsp.2007.06.006 Rumelhart, D. E. (1994). Toward an interactive model of reading. In R. B. Ruddell, M. Ruddell, & H. Singer (Eds.), Theoretical models and processes of reading (4th ed., pp. 864–894). Newark, DE: International Reading Association. Samuels, S. (1994). Toward a theory of automatic information processing in reading, revisited. In R. B. Ruddell, M. Ruddell, & H. Singer (Eds.), Theoretical models and processes of reading (4th ed., pp. 816–837). Newark, DE: International Reading Association.
Downloaded by [Paula Schwanenflugel] at 11:46 19 March 2014
138
S. A. Lai et al.
Schwanenflugel, P. J., Hamilton, A. M., Kuhn, M. R., Wisenbaker, J., & Stahl, S. A. (2004). Becoming a fluent reader: Reading skill and prosodic features in the oral reading of young readers. Journal of Educational Psychology, 96, 119–129. doi:10.1037/0022-0663.96.1.119 Schwanenflugel, P. J., Kuhn, M. R., Morris, R. D., Morrow, L. M., Meisinger, E. B., Woo, D. G., & Quirk, M. (2009). Insights into fluency instruction: Short- and long-term effects of two reading programs. Literacy Research and Instruction, 48, 318–336. doi:10.1080/19388070802422415 Schwanenflugel, P. J., Meisinger, E., Wisenbaker, J., Kuhn, M., Strauss, G., & Morris, R. (2006). Becoming a fluent and automatic reader in the early elementary school years. Reading Research Quarterly, 41, 496–522. doi:10.1598/RRQ.41.4.4 Smith, T. D., & Smith, B. L. (1998). Relationship between the Wide Range Achievement Test 3 and the Wechsler Individual Achievement Test. Psychological Reports, 83, 963–967. doi:10.2466/pr0.1998.83.3.963 Speece, D., & Ritchey, K. (2005). A longitudinal study of the development of oral reading fluency in young children at risk for reading failure. Journal of Learning Disabilities, 38, 387–399. doi:10.1177/00222194050380050201 Spencer, S. A., & Manis, F. R. (2010). The effect of a fluency intervention program on the fluency and comprehension outcomes of middle-school students with severe reading deficits. Learning Disabilities Research & Practice, 25, 76–86. doi:10.1111/j.1540-5826.2010.00305.x Stanovich, K. E. (1984). The interactive-compensatory model of reading: A confluence of developmental, experimental, and educational psychology. Remedial & Special Education, 5(3), 11–19. doi:10.1177/074193258400500306 Stanovich, K. (1991). Word recognition: Changing perspectives. In R. Barr, M. L. Kamil, P. Moesenthal, & P. D. Pearson (Eds.), Handbook of reading research (Vol. 2, pp. 418–452). White Plains, NY: Longman. Swets, B., Desmet, T., Hambrick, D., & Ferreira, F. (2007). The role of working memory in syntactic ambiguity resolution: A psychometric approach. Journal of Experimental Psychology: General, 136(1), 64–81. doi:10.1037/0096-3445.136. 1.64 Torgesen, J. K., Rashotte, C. A., & Alexander, A. W. (2001). Principles of fluency instruction in reading: Relationships with established empirical outcomes. In M. Wolf (Ed.), Dyslexia, fluency, and the brain (pp. 333–355). Timonium, MD: York Press. Torgesen, J. K., Wagner, R. K., & Rashotte, C. A. (1999). TOWRE: Test of Word Reading Efficiency. Austin, TX: PRO-ED. Valencia, S., Smith, A., Reece, A., Li, M., Wixson, K., & Newman, H. (2010). Oral reading fluency assessment: Issues of construct, criterion, and consequential validity. Reading Research Quarterly, 45, 270–291. doi:10.1598/RRQ.45.3.1 Whalley, K., & Hansen, J. (2006). The role of prosodic sensitivity in children’s reading development. Journal of Research in Reading, 29, 288–303. doi:10.1111/j.1467-9817.2006.00309.x Wiederholt, J. L., & Bryant, B. R. (2001). Gray Oral Reading Test (4th ed.). Austin, TX: PRO-ED. Zutell, J., & Rasinski, T. (1991). Training teachers to attend to their students’ oral reading fluency. Theory Into Practice, 30, 211–217. doi:10.1080/00405849109543502