Oct 8, 2012 - magnetograms corresponding to 42 different active regions. We find a ... magnetic energy in ARs is widely acknowledged for solar eruptions ...
The Astrophysical Journal Letters, 759:L4 (7pp), 2012 November 1 � C 2012.
doi:10.1088/2041-8205/759/1/L4
The American Astronomical Society. All rights reserved. Printed in the U.S.A.
THE MAGNETIC ENERGY–HELICITY DIAGRAM OF SOLAR ACTIVE REGIONS 1
Kostas Tziotziou1 , Manolis K. Georgoulis1,3 , and Nour-Eddine Raouafi2 Research Center for Astronomy and Applied Mathematics (RCAAM), Academy of Athens, 4 Soranou Efesiou Street, Athens, GR-11527, Greece 2 The Johns Hopkins University Applied Physics Laboratory (JHU/APL), 11100 Johns Hopkins Rd. Laurel, MD 20723-6099, USA Received 2012 July 5; accepted 2012 September 24; published 2012 October 8
ABSTRACT Using a recently proposed nonlinear force-free method designed for single-vector magnetograms of solar active regions, we calculate the instantaneous free magnetic energy and relative magnetic helicity budgets in 162 vector magnetograms corresponding to 42 different active regions. We find a statistically robust, monotonic correlation between the free magnetic energy and the relative magnetic helicity in the studied regions. This correlation implies that magnetic helicity, in addition to free magnetic energy, may be an essential ingredient for major solar eruptions. Eruptive active regions appear well segregated from non-eruptive ones in both free energy and relative helicity with major (at least M-class) flares occurring in active regions with free energy and relative helicity exceeding 4 × 1031 erg and 2 × 1042 Mx2 , respectively. The helicity threshold agrees well with estimates of the helicity contents of typical coronal mass ejections. Key words: Sun: chromosphere – Sun: corona – Sun: flares – Sun: photosphere – Sun: surface magnetism Online-only material: color figures
to either integrating in time the relative helicity injection rate (Berger & Field 1984) or evaluating the relative helicity formula (Finn & Antonsen 1985; Berger 1999) in a volume by means of a three-dimensional magnetic field extrapolation and a respective gauge-dependent expression for the vector potential. The helicity injection rate depends on the photospheric velocity field whose inference involves significant uncertainties (e.g., Welsch et al. 2007) while the “volume” helicity calculation depends on the model-dependent nonlinear force-free field extrapolation, also subject to uncertainties and ambiguities (e.g., Schrijver et al. 2006; Metcalf et al. 2008, and references therein). Recently, Georgoulis et al. (2012, hereafter GTR12) proposed a general force-free approach to self-consistently calculate the instantaneous magnetic free energy and relative helicity budgets from (photospheric or chromospheric) vector magnetograms of solar ARs. The method does not rely on any magnetic field extrapolation but it uses a magnetic connectivity matrix that may be inferred by extrapolations, among other methods. As in GTR12, we use in this work a simulated annealing method that converges to a unique connectivity matrix to calculate the free magnetic energy and relative magnetic helicity for a large sample of active-region vector magnetograms, seeking a statistically robust correlation between these physical parameters, if any. Section 2 briefly describes the method, its application and results are discussed in Section 3, and Section 4 summarizes our findings.
1. INTRODUCTION Active regions (ARs) are formed when considerable, localized magnetic flux emergence occurs into the solar atmosphere, with characteristic fluxes of the order of 1022 Mx (Schrijver & Harvey 1994). ARs are magnetic structures far from a ground, current-free (potential) energy state and, as such, they store large amounts of free magnetic energy. Over the last two decades, multiple reports highlight the simultaneous accumulation of large amounts of magnetic helicity in ARs (e.g., LaBonte et al. 2007; Smyrli et al. 2010). Magnetic helicity emerges via helical magnetic flux tubes or is being generated by solar differential rotation and peculiar photospheric motions and is a way to quantify the stress and distortion of the magnetic field compared to its potential-energy state. The free magnetic energy release is fragmented in ARs and fuels solar flares and/or coronal mass ejections (CMEs) that tend to relax the magnetic configuration. Contrary to magnetic energy, helicity cannot be efficiently removed by magnetic reconnection (Berger 1984). If it is not transferred to larger scales in the Sun via existing magnetic connections, it can only be expelled in the form of CMEs (Low 1994; DeVore 2000). As a result, an isolated, confined magnetic configuration with accumulated magnetic helicity cannot relax to a potential-field configuration. Although the importance of storage and release of free magnetic energy in ARs is widely acknowledged for solar eruptions (e.g., Schrijver 2009), the role of magnetic helicity is still under debate. Indeed, it has been demonstrated that helicity is not necessary for eruptions to occur (Phillips et al. 2005; Zuccarello et al. 2009). On the other hand, observational and modeling works have shown that ARs with large dominant leftor right-handed helicity give rise to more and/or major eruptions (e.g., Nindos & Andrews 2004; T¨or¨ok & Kliem 2005; LaBonte et al. 2007; Nindos 2009; Georgoulis et al. 2009). Instrumental to this debate is the lack of robust methods for calculating the (relative to a reference potential field) instantaneous magnetic helicity budget in ARs. Existing methods basically restrict 3
2. NONLINEAR FORCE-FREE MAGNETIC ENERGY AND HELICITY BUDGETS IN SOLAR ARs In GTR12 we combined the linear force-free technique of Georgoulis & LaBonte (2007) with the properties of the mutual helicity as discussed by Demoulin et al. (2006) to derive the instantaneous nonlinear force-free (NLFF) field energy and helicity budgets in an AR. In particular, a vector magnetogram of a given AR is translated into a collection of slender force-free flux tubes with known footpoints, flux contents, and variable force-free parameters. These flux tubes are defined after determining the magnetic connectivity
Marie Curie Fellow.
1
The Astrophysical Journal Letters, 759:L4 (7pp), 2012 November 1
Tziotziou, Georgoulis, & Raouafi
matrix in the AR’s magnetogram, which provides the flux contents committed to the connection between opposite-polarity flux partitions. The method of choice for calculating this matrix was introduced by Georgoulis & Rust (2007) and was revised by GTR12. It uses a simulated annealing method that globally (within the field of view) minimizes the connection lengths, at the same time guaranteeing that only opposite-polarity flux elements will be connected to each other. This approach emphasizes complex active regions with intense magnetic polarity inversion lines (PILs) in their lower boundaries. As explained in GTR12, the method gives unique results, contrary to modeldependent NLFF field extrapolations. For a collection of N slender flux tubes the free magnetic energy Ec is the sum of a self term Ecself , due to the internal twist and writhe of each flux tube, and a mutual term Ecmut , due to interactions between different flux tubes. GTR12 provide a lower limit of the free energy Ec for a given connectivity that (1) assumes no winding of a given flux tube around others, and (2) neglects contributions from potential flux tubes induced by the existing tubes in a space-filling, force-free magnetic configuration. This expression for Ec reads
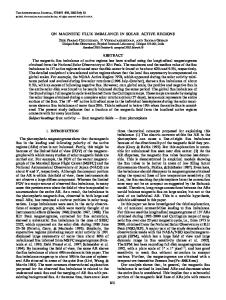
3. APPLICATION TO OBSERVED SOLAR ACTIVE REGION MAGNETIC FIELDS 3.1. Data Selection We have collected an extended sample of 162 photospheric and low chromospheric vector magnetograms obtained by the ground-based Imaging Vector Magnetograph (IVM; Mickey et al. 1996; LaBonte et al. 1999) of the University of Hawaii’s Mees Solar Observatory and by the space-based Spectropolarimeter (SP; see description in Lites et al. 2008) of the Solar Optical Telescope (SOT) on board Hinode. The IVM provides complete Stokes profiles of the Fe i 630.25 nm photospheric line (for earlier data) and of the Na i D 1 589.60 nm chromospheric line (Leka & Metcalf 2003), for data recorded after 2003, with a spatial sampling of 0.55 arcsec per pixel (full) or 1.1 arcsec per pixel (binned). The SP provides full Stokes profiles of the Fe i 630.25/630.15 nm lines with a maximum spatial sampling of 0.16 arcsec per pixel. IVM magnetogram edges were carefully cropped to remove instrumental border artifacts. To remove the intrinsic 180◦ azimuthal ambiguity in the vector magnetograms we applied the non-potential field calculation (NPFC) method of Georgoulis (2005), as revised in Metcalf et al. (2006). As typical uncertainties for the line-of-sight and transverse field components we used (δBl , δBtr ) = (50, 100) G, for IVM data, and (δBl , δBtr ) = (5, 50) G, for SOT/SP data. Our sample of 162 vector magnetograms corresponds to 42 different ARs, distinguished between “non-flaring” and “flaring” ones. The first category involves 18 ARs that have not hosted a higher than C-class flare, while the second involves 24 ARs with at least one M-class flare. Non-flaring ARs include NOAA ARs 8844, 9114, 9635, 9845, 10050, 10254, 10323, 10349, 10536, 10939, 10940, 10953, 10955, 10956, 10961, 10963, 10971, and 10978. Flaring ARs include NOAA ARs 8210, 9026, 9165, 9393, 9415, 9632, 9661, 9684, 9704, 9773, 10030, 10039, 10162, 10365, 10375, 10386, 10484, 10488, 10501, 10570, 10596, 10656, 10930, and 10960. For a few ARs we have time series of vector magnetograms spanning from a few hours of IVM data (e.g., NOAA ARs 8844, 9165) to a few days of SOT/SP data (e.g., NOAA ARs 10930, 10956). Moreover, our sample includes both short-lived emerging flux regions (i.e., NOAA AR 8844) and persistent, large and complex regions (e.g., NOAA ARs 10488, 10930). Figure 1 shows the central heliographic position of the selected 162 magnetograms. Locations cover a latitudinal area of ±25◦ and a meridional zone of −40◦ to +60◦ . Larger centralmeridian distances were avoided to avoid extreme projection effects. The calculations below involve the local, heliographic field components on the image plane of each magnetogram.
Ec = Ecself + Ecmut = Ad 2
N �
αl2 Φ2δ l +
l=1
N N 1 � � αl Larch lm Φl Φm . (1) 8π l=1 m=1,l�=m
In Equation (1), A and δ are known fitting constants, d is the pixel size of the magnetogram, and Φl and αl are the respective flux and force-free parameter of flux tube l. Larch lm is the mutual-helicity factor of two arch-like (not winding around each other) flux tubes. Inference of this factor was first discussed by Demoulin et al. (2006) and was later refined by GTR12. Refinement included the case of a “matching” photospheric footpoint in a pair of flux tubes. “Matching” footpoint means that the like-polarity footpoints of a given flux-tube pair are within the same magnetic partition; therefore, they are unresolved (considered to be coinciding) by the method. To calculate Larch lm one needs the relative footpoint locations of flux tubes l and m and an assessment of whether l is “above” m, or vice versa. For each of these cases one calculates a different Larch lm -value in cases of “matching” footpoint and intersecting footpoint segments for the flux-tube pair. By definition, these two values have opposite signs. In the case of non-intersecting segments, arch the two possible Larch lm -values collapse to a single value. Llm is always a real number with an absolute value lower than one. The selected Larch lm value is the one that assigns a positive increment to the overall free magnetic energy because of the flux-tube pair. For a pair (l, m) of flux tubes with force-free parameters arch αl and αm , respectively, this means (αl + αm )Larch lm > 0. Llm is assumed equal to zero if the respective energy increment can only be negative (this applies exclusively to the non-intersectingsegments case), which is not a physical solution. The respective relative magnetic helicity Hm for the collection of N slender flux tubes is also the sum of a self (Hmself ) and a mutual (Hmmut ) term. GTR12 derive
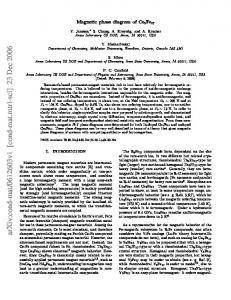
3.2. Magnetic Energy—Relative Magnetic Helicity Budgets and Their Relation Using Equations (1) and (2), we calculate the free magnetic energy and relative magnetic helicity budgets for the selected 162 vector magnetograms. The results suffice to construct the free-energy–relative-helicity diagram (hereafter EH diagram) of solar ARs, shown in Figure 2. Two main conclusions stem from this plot: first, there is a nearly monotonic dependence of direct proportionality between Ec and Hm ; flaring ARs tend to show both large free energies and large amplitudes of relative helicity. Second, flaring and non-flaring ARs appear well segregated; excesses of ∼4 × 1031 erg in free magnetic energy and of ∼2 × 1042 Mx2 in relative magnetic helicity tend to bring ARs into major flaring (or eruptive, in general) territory.
Hm = Hmself + Hmmut = 8π d 2 A
N � l=1
αl Φ2δ l +
N N � �
Larch lm Φl Φm .
(2)
l=1 m=1,l�=m
A detailed derivation of uncertainties for both Ec and Hm is also provided in GTR12. 2
The Astrophysical Journal Letters, 759:L4 (7pp), 2012 November 1
Tziotziou, Georgoulis, & Raouafi
Figure 1. Central heliographic positions for our 162 vector magnetograms. Blue diamonds correspond to non-flaring (up to C-class flaring) ARs while red squares and asterisks correspond to M- and X-class flaring ARs, respectively. (A color version of this figure is available in the online journal.)
Within this area, there is no appreciable segregation between M- and X-flaring ARs. Later in this section we discuss the (few) exceptions to the above general assessment. A similar diagram (not shown) between the free magnetic energy and the unsigned (total) magnetic flux shows significantly less segregation between flaring and non-flaring ARs than that of the EH diagram. The least-squares best fit between |Hm | and Ec reveals a scaling of the form log |Hm | ∝ 53.4 − 0.0524 (log Ec )0.653 exp
97.45 , log Ec
while, in general, a simpler logarithmic scaling of the form |Hm | ∝ 1.37 × 10¹⁴ Ec0.897
(4)
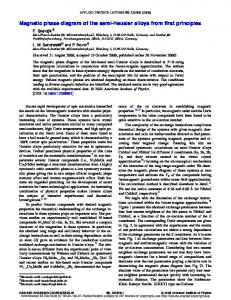
also works quite well. Both have a goodness of fit ∼0.7 with the Kolmogorov–Smirnov test giving also similar significance levels. Equation (3) implies that relative magnetic helicity builds up with faster fractional rates than magnetic free energy in the initial stages of active regions; however, this is not conclusively supported by the derived fit. Figure 3 shows the calculated uncertainties for the helicity magnitude of the studied 162 magnetograms, ordered by increasing free magnetic energy. The respective uncertainties for
(3) 3
The Astrophysical Journal Letters, 759:L4 (7pp), 2012 November 1
Tziotziou, Georgoulis, & Raouafi
Figure 2. Free-energy–relative-helicity diagram of solar ARs. Blue diamonds, red squares and red asterisks correspond to non-flaring, M- and X-class flaring ARs, respectively. Dashed lines indicate the estimated thresholds for relative magnetic helicity (∼2 × 1042 Mx2 ) and free magnetic energy (∼4 × 1031 erg) above which ARs seem to give major flares almost exclusively. These thresholds divide the diagram in four regions, labeled a, b, c, and d (see the text). The dotted and dash-dotted lines denote the least-squares best fit (Equation (3)) and the least-squares best logarithmic fit (Equation (4)), respectively. Some NOAA AR numbers are also indicated in Figure 3 and are discussed in the text. (A color version of this figure is available in the online journal.)
relatively small, free energy and a large relative helicity budget. A population in this region would be troublesome to interpret or would indicate a problematic numerical approach to calculate Ec and |Hm |. Fortunately, other than some typical scatter in the EH diagram, close to both thresholds, there is no population in Region d. We now discuss some notable exceptions to the physical interpretation of the EH diagram of Figure 2: first, four magnetograms of the flaring NOAA AR 9165 in Region d are within uncertainties from the energy threshold, and hence, they are not considered exceptions. In Region c there are seven magnetograms of non-flaring ARs (NOAA ARs 10963, 9845, 10953, 10978, 10536, 10323, and 10349, by increasing free magnetic energy) that clearly go well into major-flaring territory. Most of these ARs share a common feature: rather than hosting one or more major flares (they were apparently capable for this based on their free magnetic energy and helicity budgets) they released substantial free energy in lengthy series of C-class flares. For example, NOAA AR 10536 produced 34 C-class flares within two weeks (the highest being a C7.7 flare) while NOAA AR 10349 produced 36 C-class flares in 10 days. Two magnetograms (NOAA ARs 10978 and 10323) where recorded after a C-class flare. In Region b there are four magnetograms of X-flaring ARs (NOAA ARs 10030 and 10930) and one magnetogram of an M-flaring AR (NOAA AR 10960) that show deficits in
the free magnetic energy are not shown because they are quite smaller: below the free energy threshold the mean error is ∼22% while above it the mean error becomes ∼7%; hence, they do not affect significantly the EH diagram of Figure 2, especially its high-energy part. Uncertainties in the relative helicity are higher: below the relative helicity threshold the mean error is ∼50% while above it the mean error drops to ∼14%. As with free-energy uncertainties, the respective helicity uncertainties do not alter significantly the EH diagram of Figure 2. Point taken, there are some notable exceptions (see below). Before discussing exceptions, let us briefly discuss how the two thresholds in free energy and relative helicity divide the EH diagram of Figure 2. Regions a and c include populations of small Ec / small |Hm | and large Ec / large |Hm |, respectively and hold the vast majority of points in the diagram, thus reflecting the nearly monotonic free-energy—helicity dependence. Region b indicates ARs with a large free energy but with a small, or relatively small, relative helicity budget. Given that magnetic helicity is a signed quantity, a population in Region b might also include ARs with significant, but similar, amounts of both senses of helicity. Other than four magnetograms of X-flaring ARs and one magnetogram of an M-flaring AR (discussed below), there is no clear population in Region b. This is important evidence to the existence of a dominant sense of helicity in strongly helical ARs. Finally, Region d indicates ARs with small, or 4
The Astrophysical Journal Letters, 759:L4 (7pp), 2012 November 1
Tziotziou, Georgoulis, & Raouafi
Figure 3. Uncertainties for the difference between the relative helicity magnitudes and the inferred relative helicity threshold of 2 × 1042 Mx2 , ordered by increasing free magnetic energy. The dashed vertical line separates ARs below (left) and above (right) the respective free magnetic energy threshold. Symbols and marked NOAA AR numbers are the same with those of Figure 2. (A color version of this figure is available in the online journal.)
their relative helicity budgets. All X-flaring ARs (marked in Figure 3) show relatively high uncertainties in relative helicity, with fractional uncertainties in the range of 0.5–4.7, capable of placing them in Region c. Moreover, and related to the large uncertainties, we cannot rule out possible white-light contamination due to flaring in these regions: data for the magnetogram of NOAA AR 10030 were recorded right after two X and M-class flares while magnetograms of NOAA AR 10930 were recorded between swarms of B- and C-class flares. For the M-flaring NOAA AR 10960 we cannot exclude the possibility of similar helicity budgets of both senses. We cannot assume the same for previously discussed NOAA ARs 10030 and 10930 because they participate in the sample with time series of magnetograms that, excluding the ones in Region b, reside exclusively in Region c. Finally there is one magnetogram of an M-flaring (NOAA AR 10501) and two of X-flaring (NOAA ARs 10375 and 10386) ARs that fall short of the energy and helicity thresholds, residing into Region a. Significant errors (both in free magnetic energy and relative helicity) or contamination by white-light flare emission may also be responsible for this effect (the NOAA AR 10375 magnetogram was recorded during the declining phase of a C2.5 flare) but, moreover, it is known that intense, localized magnetic flux emergence can also force major eruptive flares (e.g., Nitta & Hudson 2001; Zhang & Wang 2002) before an AR manages to build a strong PIL and, consequently, large budgets of Ec and Hm . To test the validity of our free magnetic energies Ec , we compare them with the lowest possible free magnetic energy
EcWT that corresponds to a given amount of relative helicity for the NLFF field. This limiting value is the LFF free magnetic energy corresponding to this helicity, per the Woltjer–Taylor theorem (Woltjer 1958; Taylor 1974, 1986). As GTR12 have shown, EcWT is given by EcWT =
Hm2 . (8π d)2 AΦ2λ
(5)
All calculated free magnetic energies Ec must be larger than this value. As Figure 4 clearly demonstrates, this condition, within applicable errors, is always satisfied. 4. CONCLUSIONS We have applied a new NLFF field method to calculate the instantaneous free magnetic energy and relative magnetic helicity budgets of solar active regions. On a sample of 162 such magnetograms we report, for the first time, (1) a nearly monotonic relation of direct proportionality between the free magnetic energy and the relative magnetic helicity in ARs and (2) the existence of thresholds ∼4×1031 erg and ∼2×1042 Mx2 , for the free energy and the relative helicity, respectively, for ARs to host major, typically eruptive, flares. As magnetic helicity is a signed quantity, the monotonic dependence between it and the free energy implies that, in spite of simulations reporting that helicity is not necessary for solar eruptions (see the Introduction), real flaring/eruptive ARs show a significant budget and a dominant sense of magnetic helicity. This finding 5
The Astrophysical Journal Letters, 759:L4 (7pp), 2012 November 1
Tziotziou, Georgoulis, & Raouafi
Figure 4. Scatter plot for free magnetic energies Ec and their respective Woltjer–Taylor minima EcWT (Equation (5)). The dotted line denotes equality between the two energy estimates.
as international partners and operated in cooperation with ESA and NSC (Norway). This work was partially supported from NASA’s Guest Investigator grant NNX08AJ10G and from the EU’s Seventh Framework Programme under grant agreement No. PIRG07-GA-2010-268245.
appears to suggest an important role for magnetic helicity in solar eruptions. However, the details of this role are yet to be uncovered. An additional important finding refers to the inferred threshold values for Ec and |Hm |. While a threshold of 4 × 1031 erg in free energy suffices to justify at least one M-class flare (Hudson 2011), a threshold of 2 × 1042 Mx2 in relative helicity is in excellent agreement with estimated helicity budgets of typical CMEs (∼2 × 1042 Mx2 by DeVore (2000); (1.8–7) × 1042 Mx2 by Georgoulis et al. 2009). This may indicate that active-region CMEs occur only when source ARs can shed the required helicity budget for them, in line with theoretical CME interpretations as means of relieving the Sun from its excess helicity. The above results are a first step toward assessing and uncovering the possible combined role of free magnetic energy and relative magnetic helicity in solar eruptions. We do not envision or expect the use of these results for eruption forecasting purposes at this stage. However, these findings should instigate focused research on the detailed, quantitative role of magnetic helicity in solar eruptions that could even lead to the formulation of credible eruption initiation mechanisms. We intend to investigate such possible physical links in the future.
REFERENCES Berger, M. A. 1984, PhD thesis, Harvard Univ. Berger, M. A. 1999, Plasma Phys. Control. Fusion, 41, 167 Berger, M. A., & Field, G. B. 1984, J. Fluid Mech., 147, 133 Demoulin, P., Pariat, E., & Berger, M. A. 2006, Sol. Phys., 233, 3 DeVore, C. R. 2000, ApJ, 539, 944 Finn, J. M., & Antonsen, T. M., Jr. 1985, Comments Plasma Phys. Control. Fusion, 9, 111 Georgoulis, M. K. 2005, ApJ, 629, L69 Georgoulis, M. K., & LaBonte, B. J. 2007, ApJ, 671, 1034 Georgoulis, M. K., & Rust, D. M. 2007, ApJ, 661, L109 Georgoulis, M. K., Rust, D. M., Pevtsov, A. A., Bernasconi, P. N., & Kuzanyan, K. M. 2009, ApJ, 705, L48 Georgoulis, M. K., Tziotziou, K., & Raouafi, N.-E. 2012, ApJ, 759, 1 (GTR12) Hudson, H. S. 2011, Space Sci. Rev., 158, 5 LaBonte, B. J., Georgoulis, M. K., & Rust, D. M. 2007, ApJ, 671, 955 LaBonte, B. J., Mickey, D. L., & Leka, K. D. 1999, Sol. Phys., 189, 1 Leka, K. D., & Metcalf, T. R. 2003, Sol. Phys., 212, 361 Lites, B. W., Kubo, M., Socas-Navarro, H., et al. 2008, ApJ, 672, 1237 Low, B. C. 1994, Phys. Plasmas, 1, 1684 Metcalf, T. R., De Rosa, M. L., Schrijver, C. J., et al. 2008, Sol. Phys., 247, 269 Metcalf, T. R., Leka, K. D., Barnes, G., et al. 2006, Sol. Phys., 237, 267 Mickey, D. L., Canfield, R. C., LaBonte, B. J., et al. 1996, Sol. Phys., 168, 229 Nindos, A. 2009, in IAU Symp. 257, Universal Heliophysical Processes (Cambridge: Cambridge Univ. Press), 133 Nindos, A., & Andrews, M. D. 2004, ApJ, 616, L175 Nindos, A., Zhang, J., & Zhang, H. 2003, ApJ, 594, 1033 Nitta, N. V., & Hudson, H. S. 2001, Geophys. Res. Lett., 28, 3801 Phillips, A. D., MacNeice, P. J., & Antiochos, S. K. 2005, ApJ, 624, L129 Schrijver, C. J. 2009, Adv. Space Res., 43, 739
We gratefully acknowledge the Institute of Astronomy and Astrophysics, Space Applications and Remote Sensing of the National Observatory of Athens for the availability of their computing cluster facility. IVM Survey data are made possible through the staff of the University of Hawaii. Hinode is a Japanese mission developed and launched by ISAS/JAXA, with NAOJ as domestic partner and NASA and STFC (UK) 6
The Astrophysical Journal Letters, 759:L4 (7pp), 2012 November 1
Tziotziou, Georgoulis, & Raouafi
Schrijver, C. J., De Rosa, M. L., Metcalf, T. R., et al. 2006, Sol. Phys., 235, 161 Schrijver, C. J., & Harvey, K. L. 1994, Sol. Phys., 150, 1 Smyrli, A., Zuccarello, F., Romano, P., et al. 2010, A&A, 521, A56 Taylor, J. B. 1974, Phys. Rev. Lett., 33, 1139 Taylor, J. B. 1986, Rev. Mod. Phys., 58, 741
T¨or¨ok, T., & Kliem, B. 2005, ApJ, 630, L97 Welsch, B. T., Abbett, W. P., De Rosa, M. L., et al. 2007, ApJ, 670, 1434 Woltjer, L. 1958, Proc. Natl. Acad. Sci., 44, 489 Zhang, J., & Wang, J. 2002, ApJ, 566, L117 Zuccarello, F. P., Jacobs, C., Soenen, A., et al. 2009, A&A, 507, 441
7