Psychonomic Bulletin & Review
1998,5 (1), 119-123
The magnitude effect: Temporal discount rates and restaurant tips GRETCHEN B. CHAPMAN Rutgers University, New Brunswick, New Jersey
and JENNIFER R. WINQUIST University ofIllinois, Chicago, Illinois
Decision makers show a larger subjective temporal discount rate for small magnitudes than for large ones. That is, they demand a larger percent increase in value to compensate for a delay when they are waiting for a small amount of money than for a large amount. Prelec and Loewenstein (1991; see also Loewenstein & Prelec, 1992) proposed an increasing proportional sensitivity account ofthis magnitude effect. This account surmises that the magnitude effect stems from the utility function for money and is consequently not unique to intertemporal choice. One study tested this prediction by demonstrating the magnitude effect in two domains: intertemporal choice and tipping for restaurant meals, haircuts, and taxi rides. In intertemporal choice, subjects showed a larger discount rate for smaller monetary amounts. They also tipped a larger percentage on small bills than on large bills. Thus, both domains showed the magnitude effect; however, the size of the effect was not well correlated between domains. The study of intertemporal choice has uncovered a number ofdecision biases or anomalies (Loewenstein & Prelec, 1992; Loewenstein & Thaler, 1989). The extent to which future consequences are weighed relative to immediate outcomes can be quantified as the temporal discount rates, or the percent increase in value needed to compensate for a I-year delay. The literature on intertemporal decision biases has demonstrated that temporal discount rates vary from one situation to the next. One such bias is the magnitude effect (Benzion, Rapoport, & Yagil, 1989; Chapman, 1996; Chapman & Elstein, 1995; Kirby & Marakovic, 1996; Loewenstein & Prelec, 1992; Thaler, 1981). Discount rates are lower for large magnitude outcomes than for small magnitude outcomes. For example, Thaler reported that subjects were indifferent between $15 immediately and $60 in 1 year, representing a 300% annual discount rate, but they were also indifferent between $3,000 now and $4,000 in 1 year, representing a 33% annual discount rate.
Explanations for the Magnitude Effect Only two psychological mechanisms have been suggested as accounts for the magnitude effect. One explanation (Loewenstein & Thaler, 1989) is that decision makers place money into separate mental accounts. Large amounts of money are often slotted for investment and would not be spent immediately even if they were received This paper was presented at the 1996 meeting of the Psychonomic Society in Chicago. This research was supported by NSF Grant 9510954 to G.B.C. We thank Mei-ling Fu and Brian Novak for administering the experiment and three anonymous reviewers for helpful comments. Correspondence should be addressed to G. B. Chapman, Rutgers University, Department of Psychology, Busch Campus, New Brunswick, NJ 08903 (e-mail:
[email protected]).
right away. Thus, delaying large amounts of money only necessitates forgoing interest earnings. In contrast, small windfalls are often slotted for immediate consumption or splurges. Delaying these small amounts necessitates forgoing immediate consumption, which is more difficult. Thus, decision makers display higher discount rates for small amounts of money. This account is made less plausible by the fact that the magnitude effect has been demonstrated in domains other than money, specifically health (Chapman, 1996; Chapman & Elstein, 1995). It is implausible to assume that health can be placed into separate mental accounts for investment or immediate consumption. Instead, both small and large magnitude health outcomes must be "consumed" at the time at which they occur. Thus, demonstrations of the magnitude effect in the health domain make the mental accounts explanation less tenable. A second explanation for the magnitude effect (Loewenstein & Prelec, 1992; Prelec & Loewenstein, 1991) is that it is a result of the utility function for the outcomes being delayed (e.g., money). Specifically, the utility function for money is such that the ratio between $5 and $10 seems smaller than the ratio between $500 and $1,000. Consequently, someone may prefer $10 now to $15 in 1 year (the original $10 plus an additional $5), but also prefer $1 ,500 in 1 year to $1,000 now, even though both choices offer a 50% annual return. The 50% increase seems larger for the larger magnitudes. This increasing proportional sensitivity (IPS) property (Prelec & Loewenstein, 1991) can be expressed more formally: v(q) v(aq) -- 1 andx > q > 0, where v(q) is the value of some 119
Copyright 1998 Psychonomic Society. Inc.
120
CHAPMAN AND WINQUIST
monetary amount q (see Loewenstein & Prelec, 1992, Equation 18). It is important to note that IPS is not equivalent to a concave utility function. A concave utility function has decreasing marginal utility, which indicates that, for example, the difference between $10 and $15 seems larger than the difference between $1,000 and $1,005. That is, the same difference of $5 carries more psychological weight when it is the difference between two small amounts ofmoney. Decreasing marginal utility cannot account for the magnitude effect. Concave utility functions do not necessarily show the IPS property. For example, a power function, [v(x) = x b, X > 0, b < 1], captures the decreasing marginal utility property, but not IPS. With this function, the ratio between the utilities of $5 and $10 would be the same as the ratio between the utilities of $500 and $1,000.' A particular utility function could have IPS and decreasing marginal utility, only one of these properties, or neither. Unlike decreasing marginal utility, IPS is a property of utility functions that has not previously received much exploration. For example, Chapman (1996) found that accounting for subjects' monetary utility functions reduced but did not eliminate the magnitude effect in intertemporal choice. The utility functional form used in that study, however, did not have the IPS property. Because IPS is a property of the utility function for money, it is not tied to intertemporal choice. That is, Equation 1 makes no reference to a time delay. Thus, this account of the magnitude effect predicts that it will not be unique to intertemporal choice. The IPS account would be bolstered if the magnitude effect were apparent in nontemporal domains. Theoretically, the magnitude effect could appear whenever decision makers consider ratios or percentages.
those who show a small effect in one domain should do the same in the other. In this experiment, we presented subjects with both intertemporal choices and tipping decisions. In the tipping scenarios, subjects had to decide how large ofa tip to give a waitress, hair stylist, or taxi driver on the basis of the size of the bill. We presented subjects with two different intertemporal choice scenarios. In one scenario, subjects were told that they had won a lottery and could either receive a monetary prize immediately or a larger prize in 3 months. This lottery scenario involved gains, whereas the tipping scenarios might be construed as involving losses, because subjects were paying money. Consequently, we also used another intertemporal choice scenario involving speeding tickets. Subjects were told that they had to pay a speeding ticket fine and could either pay a particular amount now or a larger fine in 3 months. A magnitude effect would occur in the intertemporal choice scenarios if the discount rate (the percentage increase needed to compensate for the 3-month delay) decreased with the magnitude ofthe prize or fine. An analogous magnitude effect would occur in the tipping scenarios if the tip percentage decreased with the magnitude of the bill. A magnitude effect in the tipping scenarios could result if subjects gave a constant percentage tip, but rounded up to the next dollar. To discourage this rounding strategy, we instructed subjects that in the tipping scenarios they were paying by credit card or had the correct change for whatever they wanted to leave. In the speeding ticket scenario, we also specified that the subject had the correct change for any amount. We did not specify that a credit card could be used since that would add an additional delay to payment of the fine.
Restaurant Tipping We chose to examine the magnitude effect in an everyday domain where decision makers routinely compute percentages: tipping waiters or other service personnel. For example, imagine that when you eat out you customarily tip the waiter or waitress about 20%. Thus, if the bill is $25, you leave a $5 tip. One day you are treating a number of friends, and the dinner bill is quite large, $150. Do you tip your usual 20%, or would a 12% or 15% tip be sufficient? A 20% tip would be $30. Increasing proportional sensitivity indicates that the ratio between $30 and $150 seems larger than the ratio between $5 and $25. Ifso, then the $30 may seem excessive, and you may leave a smaller tip. If the IPS property is the mechanism underlying the magnitude effect in intertemporal choice, then an analogous magnitude effect should be apparent for tipping decisions. Furthermore, we might expect the utility function for money to vary across individuals. Some decision makers might show steeply increasing proportional sensitivity, while others might show very little IPS. Consequently, those who show a large magnitude effect for monetary intertemporal choices should also show a large magnitude effect in monetary tipping decisions, while
METHOD Subjects Study participants were 50 undergraduate students at the University of Illinois at Chicago who participated for course credit. Materials and Design The questionnaire consisted of two parts: intertemporal choice and tipping scenarios. There were three tipping scenarios: taxi ride, restau· rant dinner, and haircut. Each scenario presented a brief description of the situation and then asked subjects how large a tip they would give de· pending on the size ofthe bill. Four bill magnitudes were presented. For the taxi ride, these magnitudes were $5, $10, $20, and $40. For the hair· cut they were $7.50, $15, $30, and $60, and for the restaurant dinner they were $20, $40, $80, and $160. The magnitudes were presented in increasing order for halfthe subjects and in decreasing order for the reo maining subjects. Each tipping scenario also asked how much the subject had paid last time shelhe had had a dinner out, a haircut, or a taxi ride, and how much of a tip shelhe had given. In addition to the tipping scenarios, there were two intertemporal choice scenarios: winning a lottery and paying a speeding ticket. The lottery scenario explained that the subject had won a lottery and could receive a monetary prize immediately or a larger prize in 3 months. Ten immediate prize amounts were listed. These amounts were the same as the bill magnitudes used in the tipping scenarios. For each magnitude, subjects were asked to indicate how much money would have to be reo ceived in 3 months to be just as attractive as the immediate amount. The speeding ticket scenario was similar, but subjects were told that they must pay a fine now or a larger fine in 3 months. As with the tipping
MAGNITUDE EFFECT
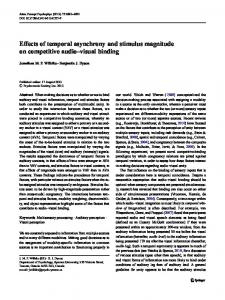
measures, and counterbalanced condition as a betweensubjects factor. The mean log discount rates were converted to geometric means for presentation on the left side of Figure 1. There was a main effect of sign [F(l ,43) = 31.69, MSe = 5,917.41, P < .0001], indicating that discount rates for the lottery (gain) scenario (geometric mean 2,189%) were higher than those for the speeding ticket (loss) scenario (geometric mean 426%). A similar sign effect has been demonstrated in other studies of intertemporal choice (Benzion et aI., 1989; Chapman, 1996; Loewenstein, 1988; MacKeigan, Larson, Draugalis, Bootman, & Bums, 1993; Shelley, 1993, 1994). Ofprimary interest, discount rates decreased with monetary magnitude, as indicated by a main effect of magnitude [F(9,387) = 14.44, MSe = 31.04,p < .0001] and a significant linear contrast [F(l,43) = 27.75, MSe = 412.50, P < .001]. There was no significant interaction between sign and magnitude [F(9,387) = 1.15, MSe = 0.79, n.s.; linear x sign interaction, F(I,43) = 1.45, MSe = 110.36, n.s.]; however, the logarithmic transformation may have obscured a difference in slopes between gains and losses.
scenarios, the order of the magnitudes (increasing or decreasing) was counterbalanced across subjects. In addition, the order of the scenarios was counterbalanced. Half the subjects saw the speeding ticket, lottery, taxi, haircut, and restaurant dinner scenarios in that order, while the remaining subjects saw them in the reverse order.
RESULTS Data from 3 subjects were eliminated; 1 did not answer any questions, and 2 had average annual discount rates in excess of 1 million percent. Thus, 47 subjects were included in the analyses. Missing data were replaced with item means.
Intertemporal Choice Scenarios Each intertemporal choice response was converted to an annual discount rate, or the percent increase in value needed to compensate for the delay, as follows: discount rate = (
resp~nse
j(l/dl -1,
(2)
magmtude
where response is the monetary amount provided by the subject (the delayed prize or fine judged equivalent to the immediate amount). Magnitude is the magnitude of the immediate prize or fine, and d, the delay in years, is 0.25 (3 months). Because the distributions of the discount rates were very skewed, natural logarithm transformations of the discount rates were used in all subsequent analyses. To determine whether discount rates decreased with magnitude in the intertemporal choice scenarios, a repeated measures analysis of variance (ANOYA) was performed using discount rate as the dependent variable, magnitude (10 levels) and sign (gain or loss) as repeated
Tipping Scenarios Tip percentages were computed as the tip amount divided by the amount of the bill. To determine whether the magnitude effect also occurred in the tipping scenarios, three repeated measures ANOYAs were performed, one for each of the three tipping scenarios. Magnitude of the bill was the independent variable and subjects' self-reports of their percentage tip the last time they had a dinner out, a haircut, or a taxi ride in real life were included as a covariate. The mean percentage tips shown on the right side of Figure 1 indicate that tip percentages deTipping
Intertemporal Choice
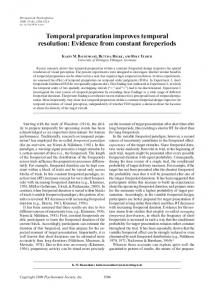
2.80,ps < .01], indicating a magnitude effect-that is, an inverse relation between magnitude and discount rate or tip percentage. Across the nine coefficients for each of 47 subjects, 65% were negative, II % were positive, and 24% were zero. We then examined the correlations among these nine regression coefficients. As seen in Table 1, most ofthe tipping scenario coefficients are correlated with one another (two of three correlations significant). Likewise, most of the speeding ticket discount rates are correlated with one another, as are the lottery ticket discount rates. The boldface numbers in Table 1 indicate the correlations between a tipping coefficient and a discount rate coefficient using identical magnitudes or between discount coefficients from two discounting scenarios (lottery and speeding ticket). One ofthree correlations between lottery and speeding ticket discount coefficients was significant. None of the six correlations between tipping and discount coefficients was significant. This pattern of results suggests that tips are related to one another and that discount rates are somewhat related to one another, but the two domains are not related to each other. An exploratory principal components analysis with a two-factor solution and varimax rotation revealed that the three tipping scenario regression coefficients loaded on one factor, while the discount rate coefficients loaded on another factor. Hence, the factor analysis supports the hypothesis that the gain and loss discount rates (lottery and speeding tickets) are closely related to one another and that the tipping scenarios are closely related to one another, but the two domains are not related.
Table 1 Pearson Correlations Among the Magnitude Effect Regression Coefficients for the Lottery, Speeding, and Tipping Ticket Scenarios Lottery Scenario Lottery Taxi Hair Dine Speeding Taxi Hair Dine Tipping Taxi Ha~
Taxi
Speeding
Tipping
Hair
Dine
Taxi
Hair
Dine
Taxi
Hair
Dine
.45*
.16 .72*
.34* .26 .16
.38* .28 .06
.08 .33* .26
-.12 -.03 .14
.04 -.01 .20
.07 .16 .27
.71 *
.26 .59*
.17 .16 .19
Al * .08 .05
.44* .33 .28
.53*
.21 A~
Dine Note-Correlations were computed among the coefficients of the size of the magnitude effect in each tipping scenario and coefficients for the equivalent monetary amounts in the intertemporal choice scenarios. Boldface numbers indicate the correlations between a tipping coefficient and a discount rate coefficient using identical magnitudes or between discount coefficients from two discounting scenarios (lottery and speeding ticket). *p < .05; N = 47.
MAGNITUDE EFFECT DISCUSSION We demonstrated the magnitude effect in both intertemporal choice and tipping decisions. Subjects exhibited a smaller temporal discount rate for large magnitude prizes or fines than they did for smaller magnitudes. They also specified a larger percentage tip for small restaurant, haircut, or taxi bills than they did for larger bills. An interesting topic for future research would be whether the magnitude effect occurs in real-world tipping decisions. For example, credit card slips from restaurant purchases could be examined for a correlation between tip percentage and bill size. In the present study, we asked subjects to recall how much they had spent on their last restaurant meal, taxi ride, and haircut, and how large of a tip they had given. For restaurant meals, there was a negative correlation between tip percentage and bill magnitude (Pearson r = - .35, p < .02, N = 47), indicating a magnitude effect. The correlations were negative but not significant, however, for the haircut (r = -. I 9, p > .2, N = 45) and taxi ride questions (r = -.25,p> .11, N = 41). The magnitude effect in both tipping and intertemporal choice can be explained by the IPS property. As monetary amounts are increased by a constant factor, equivalent ratios seem larger. Apart from the present study, the magnitude effect has not previously been examined in domains other than intertemporal choice (although see Prelec & Loewenstein, 1991, for a discussion of the relation between outcome magnitude and risk taking in an experiment by Markowitz, 1952).
Differences Between Intertemporal Choice and Tipping The fact that the magnitude effect occurs outside of intertemporal choice suggests that it is not a result of the influence of temporal delay on decision making, but is rather a function of the utility function for money, as predicted by Loewenstein and Prelec (1992; Prelec & Loewenstein, 1991). Although the present experiment revealed a magnitude effect in both intertemporal choice and tipping decisions, the size of the tipping magnitude effect was not correlated with the size of the discounting magnitude effect. This result could point to one of three conclusions. First, although IPS influences monetary decisions in both domains, a number of other factors do as well, and these factors differ between the two domains. Specifically, the lottery and speeding ticket scenarios involved intrapersonal tradeoffs that likely entail factors such as selfcontrol and impatience, which are not present in tipping decisions. In contrast, the tipping scenarios involve social, interpersonal tradeoffs that entail evaluation ofthe service and consideration offairness. These additional factors may introduce sufficient variance into the two domains that individual consistency in the size of the magnitude effect cannot be detected. A second account of the low correlation is that the magnitude effect may in fact have different explanations in the two domains. For example, the tipping magnitude effect may result from concerns about fairness. Decision makers may reason that a waitress in an inexpensive restaurant works just as hard as one in a fancy restaurant and that therefore both deserve the same absolute tip, regardless of bill size. This sentiment would result in a larger percentage tip for the inexpensive meal. (The plausibility of this account would be decreased if the size of the bill was the result of the amount of food ordered or number of people eating rather than the caliber of restaurant.) This fairness explanation is an alternative to IPS and does not apply to intertemporal choice. Future research is needed exploring the magnitude effect in additional domains other than intertemporal choice and tipping. If the effect occurs in multiple domains, it will be less tenable to construct separate explanations for each domain. A third possible conclusion based on the low correlation between domains is that the utility function for money differs across decision settings. Although the utility function exhibits IPS in multiple settings, its exact shape (e.g., the severity of the IPS) varies across both individuals and settings. That is, for a given individual, the utility function for money varies across settings. This possibility is consistent with other findings showing that preferences and decision processes vary across tasks and domains (e.g., Payne, Bettman, & Johnson, 1992).
123
Conclusion and Implications The magnitude effect occurs not only in intertemporal choice but also in other decision domains such as tipping. This result supports the conclusion that IPS is a property of the utility function for money and underlies the magnitude effect. These results suggest that the magnitude effect will occur in many monetary decisions. For example, consumers should be willing to pay a higher percentage sales tax on smaller purchases, a higher percentage shipping and handling charge on small orders, and a higher interest rate on small credit card charges. In addition, they should be more willing to invest at a low or moderate interest rate if they have a large principal to invest, and they should be more eager to use credit cards offering 1% back if they are making a large purchase. Managers and service personnel can take advantage ofthis magnitude effect by segregating or integrating outcomes appropriately. For example, waiters should gain a larger total tip by giving separate checks to each person at a table. Bankers should be able to charge a higher interest rate by offering multiple small loans (e.g., a car loan, a home improvement loan, and a college loan) rather than one consolidated loan.
REFERENCES BENZION, U., RAPOPORT, A., & YAGIL, J. (1989). Discount rates inferred from decisions: An experimental study. Management Science, 35, 270-284. CHAPMAN, G. B. (1996). Temporal discounting and utility for health and money. Journal ofExperimental Psychology: Learning, Memory, & Cognition, 22, 771-791. CHAPMAN, G. B., & ELSTEIN, A. S. (1995). Valuing the future: Temporal discounting of health and money. Medical Decision Making, 15, 373-386. KiRBY, K. N., & MARAKOVIC, N. N. (1996). Delay-discounting probabilistic rewards: Rates decrease as amounts increase. Psychonomic Bulletin & Review, 3,100-104. LOEWENSTEIN, G. (1988). Frames ofmind in intertemporal choice. Management Science, 34, 200-214. LOEWENSTEIN, G., & PRELEC, D. (1992). Anomalies in intertemporal choice: Evidence and interpretation. Quarterly Journal of Economics, 107, 573-597. LOEWENSTEIN, G., & THALER, R. H. (1989). Anomalies: Intertemporal choice. Journal ofEconomic Perspectives, 3, 181-193. MACKEIGAN, L. D., LARSON, L. N., DRAUGALIS, J. R., BOOTMAN, J. L., & BURNS, L. R. (1993). Time preference for health gains versus health losses. PharmacoEconomics, 3,374-386. MARKOWITZ, H. (1952). The utility of wealth. Journal ofPolitical Economy,60, 151-158. PAYNE, J. W., BETTMAN, J. R., & JOHNSON, E. J. (1992). Behavioral decision research: A constructive processing perspective. Annual Review ofPsychology, 43, 87-131. PRELEC, D., & LOEWENSTEIN, G. (1991). Decision making over time and under uncertainty: A common approach. Management Science, 37, 770-786. SHELLEY, M. K. (1993). Outcome signs, question frames, and discount rates. Management Science, 39,806-815. SHELLEY, M. K. (1994). Gain/loss asymmetry in risky intertemporal choice. Organizational Behavior & Human Decision Processes, 59, 124-159. THALER, R. H. (1981). Some empirical evidence on dynamic inconsistency. Economic Letters, 8, 201-207.
NOTE I. A utility function that does exhibit IPS is the negative exponential v(x) = I - e- X • With this function, the ratio between the utilities of$5 and $10 would be smaller than the ratio between the utilities of$500 and $1,000. (Manuscript received January 22, 1997; revision accepted for publication May 19, 1997.)