International Journal of Cartography
ISSN: 2372-9333 (Print) 2372-9341 (Online) Journal homepage: http://www.tandfonline.com/loi/tica20
The map as knowledge base Dalia E. Varanka & E. Lynn Usery To cite this article: Dalia E. Varanka & E. Lynn Usery (2018): The map as knowledge base, International Journal of Cartography, DOI: 10.1080/23729333.2017.1421004 To link to this article: https://doi.org/10.1080/23729333.2017.1421004
Published online: 20 May 2018.
Submit your article to this journal
Article views: 16
View related articles
View Crossmark data
Full Terms & Conditions of access and use can be found at http://www.tandfonline.com/action/journalInformation?journalCode=tica20
INTERNATIONAL JOURNAL OF CARTOGRAPHY, 2018 https://doi.org/10.1080/23729333.2017.1421004
The map as knowledge base Dalia E. Varanka
and E. Lynn Usery
U.S. Geological Survey, Rolla, MI, USA ABSTRACT
ARTICLE HISTORY
This paper examines the concept and implementation of a map as a knowledge base. A map as a knowledge base means that the visual map is not only the descriptive compilation of data and design principles, but also involves a compilation of semantic propositions and logical predicates that create a body of knowledge organized as a map. The digital product of a map as knowledge base can be interpreted by machines, as well as humans, and can provide access to the knowledge base through interfaces to select features and other information from the map. The design of maps as a knowledge base involves technical approaches and a system architecture to support a knowledge base. This paper clarifies how a map as a knowledge base differs from earlier map theory models by investigating the knowledgebased concepts of implementation through logical modelling, a knowledge repository, user interfaces for information access, and cartographic visualization. The paper ends with proof of concepts for two types of cartographic data query.
Received 19 April 2017 Accepted 20 December 2017 KEYWORDS
Cartography theory; map; knowledge base; geospatial semantics; semantic web
RÉSUMÉ
Ce papier étudie le concept et l’implémentation d’une carte en tant que base de connaissance. Une carte en tant que base de connaissance signifie que la carte visuelle n’est pas uniquement la compilation de données et de principes de conception mais qu’elle implique également une compilation de propositions sémantiques et de prédicats logiques qui constitue un corpus de connaissances organisées comme une carte. Le produit numérique d’une carte en tant que base de connaissance peut être interprété par des machines ainsi que par des humains et peut fournir un accès à la base de connaissance via des interfaces pour sélectionner des objets ou d’autres informations de la carte. La conception de cartes en tant que base de connaissance implique des approches techniques et une architecture système pour soutenir la base de connaissance. Ce papier clarifie la différenciation entre une carte en tant que base de connaissance, de celle issue de modèle antérieur sur la théorie cartographique en cherchant les concepts d’implémentation des bases de connaissance à travers une modélisation logique, un référentiel de connaissance, des interfaces utilisateur pour accéder à l’information et la visualisation cartographique. Le papier s’achève sur une démonstration sur deux types de requêtes cartographiques.
CONTACT Dalia E. Varanka
[email protected]
© This work was authored as part of the Contributor's official duties as an Employee of the United States Government and is therefore a work of the United States Government. In accordance with 17 U.S.C. 105, no copyright protection is available for such works under U.S. Law.
2
D. E. VARANKA AND E. L. USERY
1. Introduction The practice of cartography has historically adjusted to new technological developments and often these developments shape the theoretical foundation of cartography, providing new paradigms for spatial representation. With the advent of the World Wide Web (WWW) and the Semantic Web (SW), cartography is again at a technological development point that is impacting operational practices and conceptual and theoretical foundations. A map may be represented and implemented as a knowledge base (KB) system. A KB is a technical system that organizes knowledge propositions represented as logic, similar to declarative linguistic statements of fact, and supports reasoning as calculations on those logical propositions to create new ones. KB systems execute behavior that leads to inferences, which are the logical conclusions of the calculations on propositions. The SW, essentially a WWW KB, provides an ideal platform for developing and implementing a map as a KB. The SW is an extension of the WWW that provides a framework for data to be organized, processed, and used through machine reasoning. The focus of this paper is developing the map as a KB on the SW (Figure 1). The triplestore, including the ontology, provides the KB which can be shown as an interactive map in which each symbolized map element is represented as a selectable for feature access and query.
Figure 1. A graphic representation of the concept of a map as a knowledge base implemented on the SW. The triplestore is the KB, but may be shown as an interactive graphic. The KB supports both direct query and browsable graph searches.
INTERNATIONAL JOURNAL OF CARTOGRAPHY
3
KBs differ from databases in that the information in a database is often created and stored because it is organized within the constraints of a data model to be used to select information for specific tasks. A database may have a degree of intuitive knowledge order depending on the purposes for which it was created. Some calculations, primarily numerical, can be performed on databases, but the encoded information must be directly known for given tasks. A KB organizes information as a logical model for open-ended tasks, tasks that are not necessarily determined in advance. KBs are machine readable, support deductive reasoning, avoid semantic contradictions, and facilitate efficient processing. As a KB, the map differs from other paradigms of cartography in that the logical knowledge used to create the map, both the subject matter data and cartographic formalisms, can be digitally accessed, and new implications from the logical propositions and asserted data can be inferred as the map semantics. KBs incorporate the concept of expert systems which emulate the decision-making ability of a human expert. The development of cartographic expert systems appeared as early as the 1980s (Fisher & Mackaness, 1987; Mackaness, Fisher, & Wilkinson, 1986). Research on cartographic expert systems has focused on specific tasks, such as advice on the selection of an appropriate map projection (Jankowski & Nyerges, 1989) and the intelligent design of a map product (Smith, 2010; Tsou, 2003; Usery, Altheide, Deister, & Barr, 1988). These efforts focused on the expert knowledge required to create a map, rather than the map as the source of the knowledge. Where meaning in maps was addressed, research continued the long-standing semiotic/map language approach (Neytchev, 2008). A project called Knowledge Cartography aimed to organize KBs on the Internet as a map of concepts (Goczyła, Grabowska, Waloszek, & Zawadzki, 2005). This paper presents the thesis that by employing formal semantics for geographic entities and their representation as mappable features, and then using those semantics in the production and manipulation of a map, a greater range of information can be supported and accessed by machines and humans. This paper does not discuss broader social and cultural cartographic contexts employing informal or unarticulated semantics, as in studies of maps and power. In the following sections, formal geospatial semantics are presented in the context of map theory and semantic technology, and then this work is related to other studies of geospatial semantics. Formal semantics require system architecture for processing, so a discussion of a typical geospatial semantic system is included. The paper ends with case studies that implement such an approach, and provides conclusions of the study.
2. Background To clarify how map theory can be expressed through formal map semantics, major paradigms of cartography and the basics of semantic technology are summarized in this section. The relevance of related work in geospatial semantics demonstrates aspects of a cartographic KB that are discussed in greater detail in the sections that follow.
2.1. Map semantics The subject of map semantics, the specification of meanings conveyed by a map, has a broad theoretical foundation in the cartographic literature of the twentieth- and early
4
D. E. VARANKA AND E. L. USERY
twenty-first century. The semantics of cartography are focused on the design of multiple and variable representations of the subject matter appearing on the map and their interpretation assisted by text for map users. Map semantics include the study of a visual code used to present information, but the study of the way that signs create meaning is more properly map semiotics (MacEachren, 1995).
2.1.1. Semantics in the period of predominantly manual mapping. In twentieth-century manual map making, cartographers sought to connect graphic symbols to geographic meaning, primarily with reference to verbal language. Wright (1944) argued that map conventions are a map language, but text compensates for weaker assertions on the map. Map meaning is derived from the design of visual graphics (Imhof, 1977), but an interplay between spoken and graphic language exists at various states in cartographic design, execution, and interpretation (Ratajski, 1973). Meine (1977) used linguistic models to analyze graphic sign systems with the objective of identifying a cartographic alphabet. Problems of ‘cartographic language’ included the analysis of units and the establishment of syntax. Signs have infinite possibilities for their design, are continuous in the sense of their combinations, and have no meaning, but depend upon an agreed or conventional context for interpretation. Petchenik (1975) responded that context exists with spatial relations between elements. Head (1984) argued that the eye compensates for these challenges by fragmenting the image in scanning it. Eastman’s (1985) view was that variable symbolism is the basis for employing information syntax, though predominantly a function of geography (Schlichtmann, 1984). Though under geographical control, maps are still analogous to language at the level of a reader’s cognitive model for recognition. Maps also have understandable meaning or concept of syntax below the surface level signs. An example Eastman mentions is symbol size hierarchies. This would mean that a reading order of depth (from global to local) may have importance for capturing the underlying content organization of maps – the syntax. Cartographic language research led to increased research in map cognition because symbols are not purely data driven, as for example, a reader can identify words despite odd orientation. Map semantics were agreed to be interpreted by the user in practices involving maps, such as visually following a line in a certain direction or anticipating obstructions where graphically depicted. These interpretations are supported by contextual information or knowledge, such as a common, socially shared understanding of visual symbols, the geographic settings, or cognitive pattern recognition for data categorization. Such pragmatic types of semantics are refined through map-reading training and practice. Research eventually led to a wide agreement that map meaning resides in the cognition of the user. Studies of map semantics also recognized a larger cultural milieu is required and used as a context to provide meaning. Context is accommodated in semiotic theory and was applied to sign systems in cartography (Wood & Fels, 1986). Later cartographers turned to post-modern thinking, particularly literary criticism, for cartographic theory clarification. In some post-modern critiques of cartography, a model of maps-as-texts was advanced (Azócar Fernández & Buchroithner, 2014). The map-as-text model accepted semiotic principles involving semantics, but viewed maps as the product of extensive social and institutional influence and the technological change affecting map authorship. In part, this
INTERNATIONAL JOURNAL OF CARTOGRAPHY
5
movement continued analogies to map language through map/text interrelation studies that analyzed the way maps structure information as compared to the way prose structures information (Varanka, 1991). Empirical tests of learning acquisition through the study of maps and prose texts offered some specific results, which were mixed (Ramirez & Gilmartin, 1996). Some demonstrated that the combination increases learning retention (Gilmartin, 1982), but only weakly support knowledge inference, while others demonstrated that maps only weakly contribute to geographical learning through prose. Cartographic research that draws on natural language (informal) semantics leads to the conclusion that semantics operate in the mind of map users because technical expressions are too problematic. The conclusions of the analogue map research period with regard to the visual image persisted, or were expressed slightly differently, for digital cartography, excluding newly automated technical capabilities (Kimmerling, Buckley, Muehrcke, & Muehrcke, 2016; Slocum, McMaster, Kessler, & Howard, 2008). The cohesion of map semantic ideas from the predominantly analogue period, such as the relation of the graphic layout to the meaning or the importance of individual or cultural perspective attests to their effectiveness (Brewer, 2016; Krygier & Wood, 2011). However, newly introduced technical capabilities of digital cartography expand certain map semantics.
2.1.2. Semantics in digital mapping Geographic information systems (GIS) shifted the technical relation between data handling and cartography. Though data preparation can still require time-intensive effort, computers enabling more rapid modifications, enable a broader group of map-makers, and increased representational opportunities created more specific semantics, including temporal relations (Slocum et al., 2008). The result is that maps have a broader range of visual design semantics for certain user groups, but the way map semantics are conceptualized in theory or clarified for users has changed very little (Kraak & Ormeling, 2010). Entitybased and object-oriented feature data models, to which attributes are associated with the representation of individual features and included relationships to other features, created more immediate logical connections between GIS thematic content and representation, than databases created from early technical constraints, such as tabular rows organized by geospatial coordinate pairs (Choi & Usery, 2004; Usery, 2017). Initially, maps were manually digitized or scanned to create geospatial databases. Technologies for data collection have multiplied and vary in their semantic forms, such as mapping from social media or GPS-enabled mobile devices, but because the visualization of these data is likely to be a graphical map, the semantics of different data collection methods or quantitative methods for their processing are not discussed in this paper. The rise of Internet mapping created new possibilities for collaborations in cartographic media of multiple forms (Cartwright, Peterson, & Gartner, 2007; Peterson, 2002). Location and navigation functions were fairly simple for early pan-and-zoom tiled datasets in Web mapping, such as MapQuest. Complex semantics were not a priority at first in an effort for these products to be user-friendly and to build a broad customer base (Battersby, Finn, Usery, & Yamamoto, 2014). With time, most mapping in the cloud has occurred through the embedding of static images in Hyper Text Markup Language (HTML) documents or online basemap and overlay combinations leading to cybercartography (Peterson, 2014).
6
D. E. VARANKA AND E. L. USERY
Cybercartography provides a framework for compiling online information (Taylor, 2003). Cybercartography is presented as a new theoretical basis for mapping characterized by a multi-media user interface and a focus on user-provided data, among other implications of technical processes for greater inclusion (Taylor & Lauriault, 2014). Map mashups, characteristic of cyber cartography, are created by the user primarily through the application of links or tags. Though expanding the possible message elements of the map, the technology does not address potential ambiguities of the meaning of the map or the logical associations between map elements, except where annotated with natural language, because the applied links are relatively simple. Rejecting text, Eckert and Joerg (1908) recognized, over a hundred years ago, that map logic is an effective approach to the resolution of subjectivity/objectivity of representing geographical thought and scale within the constraints of map making and use. The idea of a map as an ontology of logical axioms is intuitively correct by virtue of the implicit concepts and rules inherent to cartography (Kavouras & Kokla, 2008). However, this perspective on maps ends with its graphic representation, as though the act of visual generalization limits semantic specification. As a KB, the focus is on the ontology of entities represented by the content of the map, and consists of the logical formalization of these representations in addition to cartographic principles. The content subject matter propositions, assertions judged by the knower to be true, are the clarification of map semantics. Knowledge needs to be better represented in maps, especially in an era of Big Data, when semi-automated geospatial semantic and ontology methods are being applied where manual, user-based data handling and interpretation are not possible or practical.
2.2. Semantics in a KB on the semantic web The core of a KB is an object model, often called an applied ontology in the artificial intelligence literature, with classes, subclasses, and instances which is also implemented in RDF on the SW (Brachman & Levesque, 2004). The broad field of semantic technology can involve various data models and standards, but at the core of these is the triple. Triples are composed of a subject, a property, and an object. For example, for the statement ‘The Mississippi River flows into the Gulf of Mexico,’ the subject is Mississippi River, the property (sometimes called a predicate), is flows into, and the object is the Gulf of Mexico (Figure 2). Triples are represented as a graph, with an edge between two nodes, similar to the arc/node data model of GIS. However, in the case of GIS data, the graph is composed of the data elements whereas for semantic technology the graph represents concepts in the form of set-based classes in addition to instance data.
Figure 2. A triple consists of subject, property, and object modeled as a linked graph in which the property is the link.
INTERNATIONAL JOURNAL OF CARTOGRAPHY
7
Figure 3. A federated graph formed by linking a geospatial feature to a geospatial data standard.
For implementation on the SW, and for machine interpretation of the triple, the subject is an International Resource Identifier (IRI) or blank node; a property is an IRI; and an object is an IRI, blank node, or literal (see Figure 3, for IRI examples). Classes are called asserted when they are named. Triple properties link the subject to an object class of allowable members, or to literals such as natural language annotations or numeric quantities. Such graph networks are sometimes called a ‘map’ in semantic data modeling. In this context, when used as a verb, ‘map’ can refer to the alignment or matching of graphs by their similar nodes, triples, or subgraphs. To be effective for machine processing, triples and semantic technology must specify semantic associations through the development of standardized vocabularies and complexes of associated terms. The WWW Consortium (W3C) has developed standards for triple data and ontology primarily using Resource Description Framework (RDF), which encodes triple resources (Cyganiak, Wood, & Lanthaler, 2014). RDF has various serializations, including extensions of XML (RDF/XML) and JavaScript Object Notation for Linking Data (JSON-LD) (Gandon & Schriber, 2014; Sorny, Longley, Kellogg,
8
D. E. VARANKA AND E. L. USERY
Lanthaler, & Lindstöm, 2014). Extensions of RDF, including RDF Schema (RDFS) and Web Ontology Language (OWL), present a vocabulary of logical axioms that control triple interactions (W3C OWL Working Group, 2012). SPARQL Protocol and RDF Query Language (SPARQL) is the W3C standard query language for RDF (Harris & Seaborne, 2013). IRIs are identifiers that relate back to the origin of the triple term by stating a base domain name, path name, and fragment name (Lewis, 2007). The IRI builds semantic specification in a machine-readable way. The specific vocabularies indicated by the IRI prefixes in the ontology describe a community of data topics and sources that enable easier data integration through the reuse of resources. Though different vocabularies have different base IRIs, a number of RDF vocabulary terms enable the linking of triple graphs, which supports automated processing using inference. Figure 3 illustrates the concept of a triple with asserted class names. The four classes at the top, in blue, form a federated graph that are linked by a mutual base IRI indicated by the geo:prefix. The properties rdfs:subclassOf and rdf:type link the geo federated graphs with a graph converted from The National Map database of the U.S. Geological Survey (USGS, 2017). The geospatial point coordinate, shown in cyan, is a literal, not a class. The term ‘graph’ refers to the compilation of triples in a file and to the network-type visualization that resembles concept maps but that accurately reflect the vocabulary symbology of the data, as a visualization medium for working with triples. Software-supported inference calculation is based primarily on the transitive relation, so that if an element a is related to element b, and b is related to c, then a is related to c, Inference and other reasoning rules use triple resources to derive new information that is automated and does not rely on human intelligence. Other reasoning approaches based on predicate calculus can be implemented over the triple graph as well. Applied ontology has been popularly defined as a formal specification of a conceptualization; the philosophy of ontology being the study of the concept (Gruber, 2009). Logic connects the ontology branch of philosophy with applied algorithm designs employing a set of axioms. Semantic technology encodes meaning in the rules governing the allowable combinations of categories (classes), relations (properties), and individual entities (instances). Applied ontology focuses on logical axioms supporting and restricting operations on the triple data. First-order Logic (FOL) is the commonly chosen symbol system for capturing knowledge statements (Hitzler, Krötzsch, & Rudolph, 2010). A subset of FOL axioms, Description Logic (DL), is used to support the RDF and OWL standard vocabularies that operate as logical axioms on two classes, properties, or instances (Pease, 2011). Common Logic is an International Standards Organization (ISO) standard to facilitate the exchange of logic-based languages in computer systems (ISO, 2007).
3. Ontology development approaches For a map KB, the content is organized as geospatial ontology. A common approach of ontology design begins with a set of natural language statements that are formalized though different representational stages: concept graphs; logical axioms; serialized with applied vocabularies; and visual expression. Elements of such a process are examined in this section.
INTERNATIONAL JOURNAL OF CARTOGRAPHY
9
3.1. Logic and language statements The body of the work is to define the terms involved and rules on the actions of the triple resources that the terms represent. This step may begin with natural language statements about the subject matter that are then structured into concept graphs. Concept graphs are node–edge–node depictions of concepts and relations between them where the nodes and edges are assigned class and property names to eventually serialize as triples. By converting the articulated knowledge from thought to language to a concept graph, a simpler structure is created to store basic tenants about the asserted information. Early in the design process, these concept graphs may be as informal as quick sketches, but may also be formal models with languages such as the Unified Modeling Language (UML). Upper ontology principles establish fundamental classes of entities in the world that can be used as a guide to avoid logical contradiction between more specific and complex subject domain classes. Such top-down design of the ontology framework is met with bottom-up approaches that build ontology from the qualities of existing data; this empirical approach determines the organization of instance data within the upper ontology by their properties as measured by the data collection technology (Gessler, Joslyn, & Verspoor, 2013). Adequate documentation of both approaches is essential for facilitating the reuse of the ontology. The concept graph includes a taxonomic hierarchy of subsumption – ‘Is A’ – relations that is important for various reasons. It clarifies the type of object that forms the general criteria for inclusion in the class; this alone answers a large number of queries regarding the semantics of a class. The hierarchy is also an inferencing structure. For example, if a class MacIntosh is a type of Apple and Apple is a type of Fruit, then MacIntosh is a type of Fruit. Although class hierarchy is a vital part of applied ontology, the reliance on asserted classes for entities often causes ontology designs to languish at this step of the process due to the lack of properties modeled across the hierarchical tree. If the class hierarchy is created using ontology design software, then the software has the logical axioms that are used to develop those and other ontology relations, but is limited to the application of standard vocabularies or algorithms. Non-standard vocabulary terms created by the designer can be matched as character strings, but are not supported by logic axioms. The challenge of ontology design is to represent non-taxonomic specifications in formal logic. Formal semantics are represented as logic. This way, the semantics of a statement can be organized as an algorithm for digital production where reliance on natural language terms is not possible. Logical predicates may also have informal (linguistic) definitions associated with them so that used together, informal and formal semantics formalize the axiom and easily clarify for users the axioms inherent in the ontology. An example of the relation between an OWL axiom and the associated informal definition of a sea or ocean from the Surface Water Ontology such as the Gulf of Mexico is shown in Listing 1. SeaOrOcean: the great body of salt water that covers much of the earth SubClassOf(swo:SeaOrOcean swo:Waterbody ObjectHasValue(swo:hasTemporality swo:Perennial))
10
D. E. VARANKA AND E. L. USERY
Listing 1. Formal definition of sea or ocean and the associated OWL axiom from the Surface Water Ontology (Cheatham, Varanka, & Arauz, 2017). Once property axioms are programed for the computer, triple data graphs can be flexibly manipulated for user purposes without contradicting logical propositions of the working KB. With a KB, the programing is embedded within the graph structure (Hebeler, Fisher, Blace, & Perez-Lopez, 2009).
3.2. Geospatial graph vocabulary Like a number of commonly used ontology vocabularies available for non-spatial data, geospatial ontology vocabularies are in research and implementation stages of development. Among these are the Basic Geo (WGS lat/long) vocabulary that provides a namespace for representing latitude and longitude coordinates and other related information about spatially located things (Brickley, 2003). However, the W3C standard of expressing coordinates as separate entries of geo:lat and geo:long causes difficulties in plotting data from SW sources. Conventionally, the order used for geographic coordinates expresses latitude first followed by longitude. However, because of mathematical representations of x,y coordinate systems with x first, many geographic representations use the order of longitude, followed by latitude. Add to these formatting complications the need to use either negative signs or W/S designators to denote Western and Southern Hemisphere coordinates, and a plethora of coordinate plotting errors occur from SW sources such as Geonames and DBpedia (Janowicz et al., 2016). Other spatial property vocabularies support more complex relations. Some spatial property functions for RDF are supported in Apache Jena, a Java framework for building and using triplestores with a SPARQL query engine (Jena, 2017). The libraries combine some topological relations, such as ‘within’ and ‘intersect’ with relative spatial relations, such as ‘nearby’ and the cardinal directions, north, south, east, and west. Apache Lucene offers a spatial search capability based on shapes, such as rectangle and circle (Lucene, 2017). GeoSPARQL is a vocabulary extension of SPARQL that can support quantitative and qualitative spatial reasoning over geospatial features (Perry & Herring, 2012). RDF properties enable feature topology queries between geospatial objects with associated Geography Markup Language or Well-Known Text (WKT) coordinate geometry literals. The standard includes functions for quantitative reasoning, such as distances, and a set of Rule Interchange Format core inferences for query transformations and interpretations. The standard is implemented in part in some widely available software. Though geospatial semantics are recognized as an essential aspect of the SW, further work is needed for the development of more robust geospatial vocabularies for triple resources. Vocabularies developed by practitioners, such as the NeoGeo Vocabulary, are an ongoing research effort of Geospatial Vocabulary Camps (Salas & Harth, 2011; VoCamp, 2017).
3.3. Advances in map semantics Formal map semantics are expressed through the logical and annotated relations of the digital geospatial data that operate through services for visualization. Solutions for
INTERNATIONAL JOURNAL OF CARTOGRAPHY
11
expressing map semantics include mapping coordinate points over a base map, hybrid GIS/RDF solutions, ontologies of certain aspects of map semantics, data mining or machine learning techniques, and visualization based on the Document Object Model (DOM) method, among others. Large linked databases such as Geonames.org or OpenStreetMap are often rendered against commonly available Internet base map layers, such as Google or Bing Maps, that allow the addition, editing, aggregation, and visualization of coordinate or vector data through JavaScript-based mapping Application Programing Interfaces (APIs) (De Dauw, 2016). The same result is possible by plotting geometry object coordinates resulting from SPARQL queries. Features selected for their specific attributes have coordinates that are plotted over a mapping product such as Leaflet or Open Layers. Geometry objects associated with selected features are linked to multiple properties. Software that converts data between RDF and GIS formats can complement each other in hybrid data solutions. A data graph can be converted for mapping in GIS or illustration software that typically has more advanced functionality. Geospatial semantics can facilitate data integration where barriers exist in GIS due to different data table model designs. A mediating ontology may be used to register selected GIS data and serve as a framework where all articulated ontologies for the datasets can be queried to produce an integrated map (Ludäscher, Lin, Brodaric, & Baru, 2003). Some ontologies address the process of mapping, or semantic aspects of maps and mapping, either with or without visualization. For example, Salayandia (2010) and Hahmann and Usery (2015) developed an ontology for contour lines, and Carral et al. (2013) developed one for map scale. Weigand, Grove, Wilson, and Kolas (2014) developed a visualization tool for GeoSPARQL queries. Gould and Mackaness (2016) applied geospatial ontology for map generalization using nested hierarchical tree structures based on spatial criteria such as location. Ontologies and inference can enable topological spatial processing without extensive computation of coordinate geometries through the use of labels and placenames resulting in an approach resembling cognitive way-finding (Vijayasankaran, 2015). Easily recognized natural language semantics based on keyword preprocessing can be applied for the statistical discovery of geospatial data (Li, Goodchild, & Raskin, 2012). The DOM approach combines Scalable Vector Graphics (SVG), an extension of XML, with HTML and Cascading Style Sheets (CSS) for visualization (Bostock, 2015; Bostock, Ogievetsky, & Heer, 2011; Dahlström et al., 2011; Takagi, 2015). Harwell (2004) used features described in SVG to link to related information to build ‘smart’ maps, but without IRIs. By adding IRIs, vector features are created in a similar way to RDF graphs. SVG formalizes the semantics of RDF with the geographic map content as images, vector lines, or text that can be linked. In one approach, the programing of visualization uses data directly from RDF and SPARQL as SVG (Zhang, Zhao, & Li, 2015). An API for converting RDF to SVG is available for RDF/XML, N-Triples, and N3 formats (GRIHO, 2016). Conversion of SVG elements representing features tagged with annotations to RDF was demonstrated for semantic feature extraction (Salameh, Tekli, & Chbeir, 2014). The conversion between KB to the graphic map is not linear; semantics are captured in a conversion from logic to natural language annotations and to a visual vocabulary, but the opportunity to revise map annotations allows a greater degree of user interaction. A DOM approach is demonstrated in the proof-of-concept application described in Section 4.2.1.2.
12
D. E. VARANKA AND E. L. USERY
3.4. Architecture Though RDF plays a growing role in the era of data-driven enterprise, it is still relatively uncommon in its application, so a brief explanation of basic semantic technology architecture follows. Some basic components of semantic technology architecture are: (1) a procedure for data conversion or reading data as RDF, (2) a triplestore that supports data management and reasoning, (3) semi-automated modules for data linking, and (4) a SPARQL endpoint. In addition to basic components, software for IRI schema design, data discovery, and middleware for geospatial geometry processing may be included. Ontology design software is useful for creating the ontology file containing the framework of class and property term vocabularies and other information about the ontology. For geospatial semantic systems, a mapping or more general visualization module is important. Some approaches to system components are described in this section. Since most semantic geospatial data are drawn from existing sources, data must either be converted or read on-the-fly using software that reads relational data as virtual RDF. The semantics that were embedded in the former data model may need to be manually improved for the logical organization of the ontology. RDF data may be maintained in a relational database via pre-established mappings (Arenas, Bertails, Prud’hommeaux, & Sequeda, 2012; Bizer & Cyganiak, 2017). A more complicated conversion process is required for managing geospatial features and converting their complex geometries to geometry objects. An IRI schema must be assigned to triple resources to form the basis of federated graph dereferencing (retrieving a representation of a resource or triple element identified by an IRI) and linking. Triple properties linking object classes both within the same federated graph and between different graphs are required to support the tasks expected of the data. These properties may take the form of custom vocabulary terms, such as those based on data standards within an individual organization, to broadly established vocabularies, such as those published by the W3C, OGC, and Dublin Core Metadata Initiative (DCMI, 2017). Classes from different graphs are related primarily by properties that establish the correct logical relationship between entities. Upon running a reasoner on the triplestore data, these logical relationships will be computed, and inference will result in new triples based on the transitive property and/or other reasoning rules. Triplestores, repositories for triple databases, support the storage and retrieval of data through a semantic query language. In addition to managing data, triplestores typically have a SPARQL endpoint, which is a specific WWW location for accessing a Web Service using the SPARQL protocol and data format; user interfaces; and reasoning software capabilities. Data exchanged through Internet services can be converted between RDF and compatible formats. Additional components support geospatial feature attribute aggregation by retrieving attributes from graphs of related geospatial features and properties, and organizing them according to ontology schemas. A mapping interface for linked geospatial data performs the traditional role of cartography as the visual-spatial integrator of features and spatial relations. Some allow categorical data selection and provide analytical tools (Vasquez-Gross et al., 2013). Map interfaces typically use two approaches for retrieving map semantics as linked data: through the construction of SPARQL queries and through the browsable graph (sometimes called
INTERNATIONAL JOURNAL OF CARTOGRAPHY
13
‘follow-your-nose’), where linked data triples are retrieved by selecting a resource from a previously retrieved triple. Development approaches involving vocabularies, semantic concepts, and visualization are essential stages of the map KB. An example of how these components combine to demonstrate the map KB subfield of cartography follows in the next section.
4. Implementation In this section, representative case studies are presented to suggest the empirical implementation of the theoretical concepts. Such technology, in turn, supports the theoretical grounding of a map as a KB. A key consideration is the users’ geographical information-seeking experiences that KBs are designed to support.
4.1. Objectives The objectives for map KB use cases described in Section 4.2.1. are as follow. (1) Every feature is a real-world entity. Geospatial features are the digital and graphic representations of the entity as raster or vector data. Map features are the visual representation of a geospatial feature together with visual style attributes, such as color, linework, or shading. (2) Each map feature has an IRI that is accessible as a part of the visual and digital resources of its implementation. (3) Each map feature links to other triples stored on or off the map, but that are accessible from the interface. (4) Each map feature can have a spatial relation property relative to another feature on the map; these include mereotopological relations, such as ‘is a part of’ or ‘has as a part,’ and prepositional spatial relations, such as ‘between’ or ‘along.’ (5) Each cartographic element, such as the scale, neatline, or direction arrow, has a function for describing its graphic symbolization and application. These objectives focus on the map representation in addition to, and building on, the semantic technology guidelines presented so far in this paper. These natural language statements could be formalized to create applied map ontology for any use case. Formalization is not presented here because map ontologies vary and are to be designed by the user community.
4.2. Technical design The semantic mapping architecture system implemented for this study is depicted in Figure 4. The scope of the system is to test limited demonstrations that would be appropriate to and eventually scaled to large databases covering the fully intended geographic extent, and include geospatial query support and map visualization. The process begins with Python-generated text files from the data conversion program that contain the RDF feature instances and properties among them. A command line Java application parses the RDF statements and populates a triplestore that supports basic
14
D. E. VARANKA AND E. L. USERY
Figure 4. Diagram of semantic system components for a cartographic knowledge base.
spatial queries such as bounding boxes and circles, inference on RDFS, OWL properties, and a SPARQL endpoint web service. The front end of the prototype is a user interface to query data, modify the ontology, and perform other tasks. The interface consists of an HTML web page along with JavaScript or an API to posts SPARQL queries to the triplestore. Once the triple store is populated with feature data and relationships, SPARQL queries can be issued and the results displayed in a web map. SPARQL uses XML HTTP Request and Response objects to post queries, and the results are obtained in JSON format.
4.2.1. Query and visualization Ontologies are validated using competency questions exploring data with which the user is unfamiliar; looking for data that fails to fit a particular pattern; examining additional data linked to what is known to be retrieved; exploring multiple patterns together as either/or statements; simplifying output; querying multiple graph data sources; and composing complex queries. To illustrate implementation and prototype results for the map as a KB as shown in Figure 1, an example implementation of the SPARQL query and browsable graph approaches are presented below. 4.2.1.1. SPARQL query approach with map results. SPARQL queries work by retrieving triple values that match individual subjects, properties, and/or objects of triples in the graph to variables in the query graph pattern. Values from the original dataset bind to variables in the query if they satisfy the graph pattern conditions. The found values are substituted in the pattern to generate new triple statements. SPARQL allows the triples to be queried one resource at a time, which results in more direct and selective data combination retrievals. SPARQL is a language with a rich range of possibilities that support many executable operations, such as Boolean operators, validity checking, data updates, or creating new graph datasets. Because SPARQL retrieves class sets and properties, and optionally, literals, groups of instances are retrieved all at once, instead of row-by-row in
INTERNATIONAL JOURNAL OF CARTOGRAPHY
15
tables. The returned results from the operation resemble knowledge statements that build a narrative rather than listing data values. To demonstrate the capability of the Map as KB system using SPARQL query, an example is provided to connect semantic databases of the USGS with those of the U.S. Environmental Protection Agency (EPA). Specifically, the query will locate EPA pollution sites within 5 km of the Pittsburg, Missouri Volunteer Fire Station from USGS topographic maps. In Listing 1, we first define prefixes for standard ontologies and vocabularies that will be used. Listing 1: URI prefixes of the query example PREFIX PREFIX PREFIX PREFIX PREFIX PREFIX
geo: geof: rdf: rdfs: units: dgtwc:
Next, issue the GeoSPARQL query with variables for the name (?name) and the coordinates (?wkt) of the pollution sites to be found and specify the constraints (Listing 2). Comments marked by # annotate each step of the procedure. Listing 2. Query example SELECT DISTINCT ?name ?wkt1 WHERE { # Identify the default data graph with which to start. The specified USGS data graph contains topographic features of different themes. GRAPH { # Match features from the class EPA DataEntry. This class contains instances of pollution sites with their names and geometries. ?feature rdf:type . #Retrieve the coordinates of those features ?feature geo:asWKT ?wkt1 . #Retrieve the names of those features ?feature dgtwc:primary_name ?name . # Get the WKT geometry of the firehouse of interest geo:hasGeometry ?geo . ?geo geo:asWKT ?fire_wkt . # Create a 5 km buffer around the firehouse BIND (geof:buffer(?fire_wkt, 5000, units:metre) AS ?fire_buff) # Restrict matches from the EPA data set to the firehouse buffer using GeoSPARQL FILTER(geof:sfContains(?fire_buff, ?wkt1)) } } The results of the query are shown below as text output (Table 1) with map results shown in Figure 5.
16
D. E. VARANKA AND E. L. USERY
Table 1. Feature names and their associated spatial coordinate geometries. Name Ash Grove Aggregates, Inc Dale & Shelly Whiteside MDNR, Div of State Parks Royal School
WKT Point (−93.304139, 37.823306) Point (−93.295654, 37.858091) Point (−93.300556, 37.833889) Point (−93.3802, 37.83615)
4.2.1.2. Browsable graph approach. The browsable graph complements the SPARQL query method of visualizing map semantics. The user of the browsable graph approach follows links from a starting point rather than matching a graph pattern against an entire data set. Though initially constricting the user to a semi-directed path, the properties and nodes of that path are arguably more relevant to the starting point the user chooses. To demonstrate the map KB system, a technical application was developed that uses RDF data – linked data – for mapping. The proof-of-concept focuses on accessing triple data from visual elements of a geographic map. Other essential functions, such as SPARQL query and reasoning capabilities that are critical to a map as a KB are available when the map interface is integrated with Marmotta, and so are not discussed here.
Figure 5. Plotted output from GeoSPARQL query showing the locations of EPA pollution sites within 5 km of the Pittsburg, Missouri fire station. The orthographic image is used as a background on which to plot the results and is not a part of the RDF KB. The plotted points are directly extracted by the SPARQL query from the RDF KB.
INTERNATIONAL JOURNAL OF CARTOGRAPHY
17
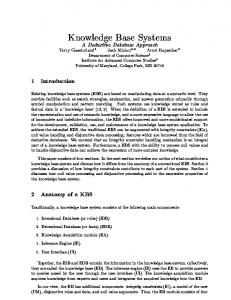
Furthermore, this demonstration is limited to multiple local graph files only. Querying data from other SPARQL endpoints is a capability reserved for Marmotta as well. An initial version of the application followed Murray (2013), but was expanded to more fully use linked data capabilities (Powell & Varanka, 2017). The sources of the data are an Esri Shapefile of county boundaries data from The National Map of the USGS, and an RDF database of the Geographic Names Information System (GNIS) of U.S. domestic names (U.S. Board on Geographic Names, 2017). The shapefile was converted to a GeoJSON file and linked via various properties with the GNIS database serialized in Terse RDF Triple Language (Turtle) format. The database is composed of roughly four predominant graphs: Feature, Name, Geometry (including Elevation), and History. A custom converter in Java reconstructs the files with a structure that is a mix of JSON-LD and GeoJSON. Additionally, the Geometry files were exported as their own GeoJSON file. Extracted data from multiple external JSON files can be represented in HTML path objects. A visual map displaying cartographic principles serves as the interface for data queries In the HTML file, the program accesses the D3 library to use a projection variable set to Albers USA. This allows the code to receive a coordinate pair and have a frame of reference to know where to map by initializing a path variable that uses D3’s geo functions. After setting an SVG window to create a canvas, JavaScript opens the GeoJSON file of county boundaries. The stylistic elements of the data are applied using CSS. The STATE_NAME value from The National Map differentiates counties by State for each GNIS data set, represented by differing colors to set the geographical extent of the data visualization. The resulting map has listeners that execute a variety of functions triggered by the cursor, hovering, and clicking (Figure 6(a)). A county outline is highlighted and a name appears when hovered. The on-click function takes the selected county (shown in red in Figure 6(b)) and begins accessing the other JSON files one at a time to link the data, parsing Turtle file triple resources for enough information to successfully link with the mapped GeoJSON (Figure 6(c)). The program starts with the history.json, and then cycles through the features.json file to match data and to expand the range of attributes. After finding a match both in the county and in the linking value, the index for the history.json file is stored to link again with the names.json file, and then with its geometry subfile, assuming these exist. At this point all the primary data have been gathered and are sent to the data window. These include: . . . . .
County name Name of the feature Classification of the feature Description of the feature History of the feature
The program then checks to see if there is a matching coordinate pair to fetch. If there is not, this ends the information gathering code. However, if the features.json file attribute hasGeometry is not null, the JavaScript cycles through the features-geo.json (feature geometry) file as done with the previous loops, and retrieves values matching features, and stores and uploads them. The program combines all the gathered data into a point
18
D. E. VARANKA AND E. L. USERY
Names.json 1 2 3
History.json 1 2 3
Point Data Array n
Point Object 1 Point Object 2 Point Object 3 Point Object 4
n
a.
Feature.json 1 2 3
n
n
Point Object
Map Points
Feature-Geo.json 1 2 3
n
CountyOrEquivalent.json 1 2 3
n
c.
County Name Name Feature in this County Name Classification Description History Elevation Coordinates
b.
d.
Figure 6. (a) Blank map – the HTML file with no current interactions, (b) diagram of data linking, (c) found point – screenshot showing the on-click function for counties, (d) related points.
coordinate object (the database coordinate data is limited to points) and repeats the cycle for the next triple. All point objects are stored in an array that is then appended to a (visual) circle object (shown in green in Figure 6(b)), which is plotted at the coordinates recently retrieved. User interaction with the map retrieves data within the linked property of the selected subject, a feature within a specific county (Figure 6(b)). Another data-linking opportunity occurs when a circle is clicked, several related points are retrieved. In Figure 6(d), all other found points linked as the same feature theme grow in size (shown in green) to indicate that they are similar to the selected structure. Also notable is the varying color intensity of the points, which is dependent on their respective elevations.
5. Results and conclusion The map as KB is a perspective on cartographic theory whereby cartography acts as a framework for compiling digital map elements that are linked to context-relevant and logically formalized information. Such cartography is enabled by advances in SW technology. This paper describes stages in the development of semantically enabled cartography. These stages include the diagraming of statements as concept maps, the formalization of predicates as logic, the establishment of geospatial and cartographic
INTERNATIONAL JOURNAL OF CARTOGRAPHY
19
vocabularies and semantics, and building basic software system architecture to support the implementation of KB concepts as maps. Such systems support machine-enabled map interpretation. Technical map KBs using the SPARQL query and browsable graph methods of user interaction were demonstrated by execution over local architecture. The results of these applications indicate that linked data are viable for mapping. A map can provide users access to RDF triple properties behind the visual vocabulary. The triple data model supports a direct transformation from conceptual to logical to physical design. A growing body of literature on various parts of the corpus of knowledge is expanding the map as KB perspective. Contemporary research in this subject area is expected to lead to new developments in the technology, improving geographic and geospatial analysis enabled by cartography. Broader impacts of the map as KB perspective are that research is open for designing maps with the visual reasoning for cartographic interpretation, especially if calculated through inference of new information using a simplified and flexible semantic specification model. These capabilities are possible when triple geospatial data resources displayed in the data window are linked for further graph exploration. Any use of trade, firm, or product names in this publication is for descriptive purposes only and does not imply endorsement by the U.S. Government.
Disclosure statement No potential conflict of interest was reported by the authors.
Notes on contributors Dalia Varanka is a Research Geographer with the U.S. Geological Survey (USGS) and Faculty at Johns Hopkins University. She received her BA degree from the University of Wisconsin-Green Bay in Urban and Regional Analysis (1978) and her MA degree in Urban Environmental Geography at the University of Illinois at Chicago (1987). She worked as a research assistant at The Field Museum of Natural History and The Newberry Library in Chicago. Dr Varanka’s PhD degree in Geography from the University of Wisconsin-Milwaukee (1994) focused on the spatial information theory and cartography and society. Dr Varanka began her Federal career in 1993 as a Physical Science Technician with the U.S. Bureau of Land Management. She joined the USGS in 1997 and has been a Research Grade Evaluation (RGE) scientist since 1999 with the National Geospatial Program. Dr Varanka leads the Geospatial Semantics and Ontology project of the Center of Excellence for Geospatial Information Science (http://cegis.usgs.gov/). Dr Varanka teaches a Geospatial Ontology and Semantics course for the Geographic Information Systems degree for the Johns Hopkins University Advanced Academic Programs. E. Lynn Usery is a Senior Scientist of the U.S. Geological Survey (USGS) and Director of the Center of Excellence for Geospatial Information Science (CEGIS). He has worked as a cartographer and geographer for the USGS for more than 28 years and a professor of geography for 17 years with the University of Wisconsin–Madison and the University of Georgia. He has served as President of the University Consortium for Geographic Information Science (UCGIS), the Cartography and Geographic Information Society (CaGIS), and the American Society for Photogrammetry and Remote Sensing (ASPRS). He is a Fellow of CaGIS and UCGIS and received the CaGIS Distinguished Career Award in 2012. Dr Usery is currently a Vice-President of the International Cartographic Association. His primary research areas are in theoretical cartography and geographic information science, geospatial semantics and ontology, CyberGIS, map projections, spatial data models, and data integration.
20
D. E. VARANKA AND E. L. USERY
ORCID Dalia E. Varanka http://orcid.org/0000-0003-2857-9600 E. Lynn Usery http://orcid.org/0000-0002-2766-2173
References Arenas, M., Bertails, A., Prud’hommeaux, E., & Sequeda, J. (2012). A direct mapping of relational data to RDF. Retrieved from http://www.w3.org/TR/rdb-direct-mapping/ Azócar Fernández, P. I., & Buchroithner, M. F. (2014). Paradigms in cartography, an epistemological review of the 20th and 21st centuries. Berlin: Springer-Verlag. Battersby, S. E., Finn, M. P., Usery, E. L., & Yamamoto, K. H. (2014). Implications of Web mercator and its use in online mapping. Cartographica, 49, 85–101. doi:10.3138/carto.49.2.iii. Bizer, C., & Cyganiak, R. (2017). D2RQ, accessing relational databases as virtual RDF graphs. Retrieved from http://d2rq.org/ Bostock, M. (2015). D3, data-driven documents. Retrieved from https://d3js.org/ Bostock, M., Ogievetsky, V., & Heer, J. (2011). D3: Data-driven documents. IEEE Transactions on Visualization and Computer Graphics, 17, 2301–2309. doi:10.1109/TVCG.2011.185. Brachman, R. J., & Levesque, H. J. (2004). Knowledge representation and reasoning. San Francisco, CA: Elsevier. Brewer, C. A. (2016). Designing better maps: A guide for GIS users (2nd ed.). Redlands, CA: Esri Press. Brickley, D. (2003). W3C semantic web interest group [Document]. Retrieved from http://www.w3. org/2003/01/geo/#overview Carral, D., Scheider, S., Janowicz, K., Vardeman, C., Krisnadhi, A. A., & Hitzler, P. (2013). An ontology design pattern for cartographic Map scaling. In P. Cimiano, O. Corcho, V. Presutti, L. Hollink, & S. Rudolph (Eds.), The semantic web: Semantics and big data: ESWC 2013 (pp. 76–93). Berlin: Springer-Verlag. Cartwright, W., Peterson, M. P., & Gartner, G. (2007). Multimedia cartography. Berlin: Springer. Cheatham, M., Varanka, D., & Arauz, F. (2017). Alignment of surface water ontologies, a comparison of manual and automated approaches. Unpublished manuscript. Choi, J., & Usery, E. L. (2004). System integration of GIS and a rule-based expert system for urban mapping. Photogrammetric Engineering & Remote Sensing, 70, 217–224. doi:10.14358/PERS.70.2. 217 Cyganiak, R., Wood, D., & Lanthaler, M. (2014). RDF 1.1 concepts and abstract syntax [W3C recommendation]. Retrieved from http://www.w3.org/TR/rdf11-concepts/ Dahlström, E., Dengler, P., Grasso, A., Lilley, C., McCormack, C., Schepers, D., … Jackson, D. (Eds.). (2011). Scalable vector graphics (SVG) 1.1. (2nd ed.). [W3C recommendation]. Retrieved from http://www.w3.org/TR/SVG11/ DCMI. (2017). Metadata innovation. Author. Retrieved from http://dublincore.org/ De Dauw, J. (2016). Extension: semantic maps. Retrieved from https://www.semantic-mediawiki.org/ wiki/Semantic_Maps Eastman, J. R. (1985). Cognitive models and cartographic design research. Cartographic Journal, 22, 95–101. doi:10.1179/caj.1985.22.2.95 Eckert, M., & Joerg, W. (1908). On the nature of maps and map logic. Bulletin of the American Geographical Society, 40, 344–351. doi:10.2307/198027 Fisher, P. F., & Mackaness, W. A. (1987). Are cartographic expert systems possible? In N. Chrisman (Ed.), Proceedings, eight international symposium on computer-assisted cartography auto-carto 8 (pp. 530–534). Falls Church, VA: American Society for Photogrammetry and Remote Sensing and American Congress on Surveying and Mapping. Gandon, F., & Schriber, G. (2014). RDF 1.1 XML syntax [W3C recommendation]. Retrieved from http:// www.w3.org/TR/rdf-syntax-grammar/ Gessler, D. D. G., Joslyn, C., & Verspoor, K. (2013). A posteriori ontology engineering for data-driven science. In T. Critchlow & K. Kleese van Dam (Eds.), Data-intensive science (pp. 216–244). Boca Raton, FL: CRC Press.
INTERNATIONAL JOURNAL OF CARTOGRAPHY
21
Gilmartin, P. (1982). The instructional efficacy of maps in geographic text. Journal of Geography, 41, 145–150. doi:10.1080/00221348208980869 Goczyła, K., Grabowska, T., Waloszek, W., & Zawadzki, M. (2005). The knowledge cartography – a new approach to reasoning over description logics ontologies. In J. Wiedermann, G. Tel, J. Pokorný, M. Bieliková, & J. Štuller (Eds.), SOFSEM 2006: Theory and practice of computer science (pp. 293–302). Merin, Czech Republic: Springer. Gould, N., & Mackaness, W. (2016). From taxonomies to ontologies: Formalizing generalization knowledge for on-demand mapping. Cartography and Geographic Information Science, 43, 208–222. doi:10.1080/15230406.2015.1072737 Gruber, T. (2009). Ontology. In L. Liu & M. Tamer Özsu (Eds.), Encyclopedia of database systems. Berlin: Springer-Verlag. Retrieved from http://tomgruber.org/writing/ontology-definition-2007.htm Grup de Recerca en Interacció Persona Ordinador I Integració de Dades. (2016). RDF to SVG form. Retrieved from http://rhizomik.net/html/redefer/rdf2svg-form/ Hahmann, T., & Usery, E. L. (2015). What is in a contour Map? A region-based logical formalization of contour semantics. In S. I. Fabrikant, M. Raubal, M. Bertolotto, C. Davies, S. Freundschuh, & S. Bell (Eds.), Spatial information theory, Lecture notes in computer science series 9368 (pp. 375–399). Santa Fe, New Mexico: Springer. Harris, S., & Seaborne, A. (Eds.). (2013). SPARQL 1.1 query language [W3C recommendation]. Retrieved from http://www.w3.org/TR/2013/REC-sparql11-query-20130321/ Harwell, R. (2004). Web mapping with SVG. Directions Magazine. Retrieved from http://www. directionsmag.com/entry/web-mapping-with-svg/123604 Head, C. G. (1984). The map as natural language: A paradigm for understanding new insights in cartographic communication. Cartographica, The International Journal for Geographic Information and Geovisualization, 21, 1–32. doi:10.3138/E816-M074-8791-4506 Hebeler, J., Fisher, M., Blace, R., & Perez-Lopez, A. (2009). Semantic Web programming. Indianapolis, IN: Wiley. Hitzler, P., Krötzsch, M., & Rudolph, S. (2010). Foundations of semantic Web technologies. Boca Raton, FL: Chapman & Hall/CRC. Imhof, E. (1977). Tasks and methods of theoretical cartography. Cartographica, The International Journal for Geographic Information and Geovisualization, 14, 26–37. doi:10.3138/XG51-L6G4U472-5636 ISO. (2007). Information technology – common logic (CL): A framework for a family of logic-based languages [ISO/IEC 24707]. Retrieved from https://www.iso.org/standard/66249.html Jankowski, P., & Nyerges, T. (1989). Design considerations for MaPKBS-map projection knowledgebased system. The American Cartographer, 16, 85–95. Janowicz, K., Hu, Y., McKenzie, G., Gao, S., Regalia, B., Mai, G., … Taylor, K. (2016). Moon landing or safari? A study of systematic errors and their causes in geographic linked data. In J. Miller, D. O’Sullivan, & N. Wiegand (Eds.), Geographic information science, 9th international conference GIScience 2016 (pp. 275–290). Berlin: Springer International. Jena. (2017). Spatial searches with SPARQL. Retrieved from https://jena.apache.org/documentation/ query/spatial-query.html Kavouras, M., & Kokla, M. (2008). Theories of geographic concepts, ontological approaches to semantic integration. Boca Raton, FL: CRC Press. Kimmerling, A. J., Buckley, A. R., Muehrcke, P. C., & Muehrcke, J. O. (2016). Map Use (6th ed.). Redlands, CA: Esri Press Academic. Kraak, M.-J., & Ormeling, F. (2010). Cartography, visualization of spatial data (3rd ed.). New York, NY: The Guildford Press. Krygier, J., & Wood, D. (2011). Making maps: A visual guide to Map design for geographic information systems (2nd ed.). New York, NY: Guilford Press. Lewis, R. (Ed.). (2007). Dereferencing HTTP URIs [W3C draft tag finding]. Retrieved from http://www.w3. org/2001/tag/doc/httpRange-14/2007-08-31/HttpRange-14.html Li, W., Goodchild, M. F., & Raskin, R. (2012). Towards geospatial semantic search: Exploiting latent semantic relations in geospatial data. International Journal of Digital Earth, 7, 17–37. doi:10. 1080/17538947.2012.674561
22
D. E. VARANKA AND E. L. USERY
Lucene, A. (2017). Lucene and Solr. Retrieved from http://lucene.apache.org/ Ludäscher, B., Lin, K., Brodaric, B., & Baru, C. (2003). GEON: Toward a cyberinfrastructure for the geosciences – a prototype for geologic map integration via domain ontologies. Digital Mapping Techniques ’03 – Workshop Proceedings (U.S. Geological Survey Open File Report 03-471). Retrieved from http://pubs.usgs.gov/of/2003/of03-471/pdf/ludascher.pdf MacEachren, A. M. (1995). How maps work; representation, visualization, and design. New York, NY: The Guilford Press. Mackaness, W. A., Fisher, P. F., & Wilkinson, G. G. (1986). Towards a cartographic expert system. In M. Blakemore (Ed.), Auto Carto London: International conference on the acquisition, management and presentation of spatial data, Conference Proceedings, Vol. 1 (pp. 578–587). London: Royal Institution of Chartered Surveyors. Meine, K.-H. (1977). Cartographic communication links and a cartographic alphabet. Cartographica: The International Journal for Geographic Information and Geovisualization, 14, 72–91. doi:10. 3138/8217-V732-21X0-5347 Murray, S. (2013). Interactive data visualization for the web. Sebastopol, CA: O’Reily Media. Neytchev, P. (2008). The cartographic knowledge base in formulating the linguistic trend of map semiotics. Geografija, 44(2), 75–82. Pease, A. (2011). Ontology, a practical guide. Angwin, CA: Articulate Software Press. Perry, M., & Herring, J. (2012). OGC GeoSPARQL – a geographic query language for RDF data (Open Geospatial Consortium, document reference number OGC 11-052r4). Retrieved from http://www. opengis.net/doc/IS/geosparql/1.0 Petchenik, B. B. (1975). Cognition in cartography. In J. C. Kavaliunas (Ed.), Proceedings of the international symposium on computer-assisted cartography: AutoCarto II (pp. 183–193). Falls Church, VA: American Congress on Surveying and Mapping. Peterson, M. (2014). Mapping in the cloud. New York, NY: Guilford. Peterson, M. (2002). Foundations of research in internet cartography. In M. Peterson (Ed.), Maps and the internet (pp. 437–445). Amsterdam: Elsevier. Powell, L. J., & Varanka, D. E. (2017). A linked GeoData map for enabling information access (U.S. Geological Survey Open-file Report 2017–1150), 6 p. Retrieved from https://doi.org/10.3133/ ofr20171150 Ramirez, A. D., & Gilmartin, P. (1996). Maps, text, and seventh-graders: A study of spatial learning. Cartographic Perspectives, 24, 3–12. doi:10.14714/CP24.752 Ratajski, L. (1973). The research structure of theoretical cartography. International Yearbook for Cartography, 13, 217–227. Salameh, K., Tekli, J., & Chbeir, R. (2014). SVG-to-RDF semantization. In A. J. M. Traina, C. Traina, Jr. & R. L. F. Cordeiro (Eds.), Similarity search and applications, Lecture notes in computer science 8821 (pp. 214–228). Springer. Salas, J. M., & Harth, A. (2011). NeoGeo vocabulary: Defining a shared RDF representation for GeoData. Retrieved from http://geovocab.org/doc/neogeo.html Salayandia, L. (2010). Contour map WDO [Resource]. Retrieved from http://cybershare-portal.utep. edu/node/214 Schlichtmann, H. (1984). Discussion of C. Grant head ‘The Map as natural language’: A paradigm for understanding. Cartographica: the International Journal for Geographic Information and Geovisualization, 21, 33–36. doi:10.3138/N478-8757-1P31-33L5 Slocum, T. A., McMaster, R. B., Kessler, F. C., & Howard, H. H. (2008). Thematic cartography and geographic visualization (2nd ed.). Upper Saddle River, NJ: Pearson Prentice Hall. Smith, R. A. (2010, November). Designing a cartographic ontology for use with expert systems. Paper presented at the ASPRS/CaGIS 2010 Fall Specialty Conference, Orlando, FL. Sorny, M., Longley, D., Kellogg, G., Lanthaler, M., & Lindstöm, N. (2014). JSON-LD 1.0, A JSON-based serialization for linked data. [W3C recommendation]. Retrieved from http://www.w3.org/TR/json-ld/ Takagi, S. (Ed). (2015). Svg:transform for mapping [W3C editor’s draft]. Retrieved from https://svgwg. org/specs/transform/ Taylor, D. R. F. (2003). The concept of cybercartography. In M. P. Peterson (Ed.), Maps and the internet (pp. 405–420). Oxford: Elsevier Science B.V.
INTERNATIONAL JOURNAL OF CARTOGRAPHY
23
Taylor, D. R. F., & Lauriault, T. (Eds.). (2014). Developments in the theory and practice of cybercartography: Applications and indigenous mapping. Amsterdam: Elsevier. Tsou, M.-H. (2003). An intelligent software agent architecture for distributed cartographic knowledge bases and internet mapping services. In M. Peterson (Ed.), Maps and the internet (pp. 229–243). Oxford: Elsevier Press. U.S. Board on Geographic Names. (2017). The geographic names information system (GNIS). Retrieved from https://geonames.usgs.gov/domestic/index.html Usery, E. L. (2017). Spatial feature classes. In D. Richardson, N. Castree, M. F. Goodchild, A. L. Kobayashi, W. Liu, & R. Marston (Eds.), The international encyclopedia of geography: People, the earth, environment, and technology (Vol. 12, pp. 6659–6666). Hoboken, NJ: Wiley-Blackwell. Usery, E. L., Altheide, P., Deister, R. R. P., & Barr, D. J. (1988). Knowledge-based GIS techniques applied to geological engineering. Photogrammetric Engineering and Remote Sensing, 54, 1623–1628. USGS. (2017). The national map. Retrieved from https://nationalmap.gov/ Varanka, D. (1991). An approach to map/text interrelationships. In D. M. Mark & P. F. Dordrecht (Eds.), Cognitive and linguistic aspects of geographical space (pp. 285–294). Norwell, MA: Kluwer Academic. Vasquez-Gross, H. A., Yu, J. J., Figueroa, B., Gessler, D. D. G., Neale, D. B., & Wegrzyn, J. L. (2013). Cartogratree: Connecting tree genomes, phenotypes, and environment. Molecular Ecology Resources, 13, 528–537. doi:10.1111/1755-0998.12067 Vijayasankaran, N. (2015). Enhanced place name search using semantic gazetteers (Unpublished master’s thesis). University of Maine, Orono, ME. VoCamp. (2017). Retrieved from http://vocamp.org/wiki/Main_Page W3C OWL Working Group. (2012). OWL 2 web ontology language, document overview (2nd ed.) [W3C recommendation]. Retrieved from http://www.w3.org/TR/owl2-overview Weigand, N., Grove, R., Wilson, J., & Kolas, D. (2014). Querying geospatial data over the Web: A GeoSPARQL interface. In Georich’14 proceedings of workshop on managing and mining enriched geo-spatial data. New York, NY: Association for Computing Machinery. Wood, D., & Fels, J. (1986). Designs on signs: Myth and meaning in maps. Cartographica: The International Journal for Geographic Information and Geovisualization, 23, 54–103. doi:10.3138/ R831-50R3-7247-2124 Wright, J. K. (1944). Map makers are human. Geographical Review, 32, 527–544. Zhang, C., Zhao, T., & Li, W. (2015). Geospatial semantic Web. Cham: Springer International.