arXiv:1704.03298v1 [cs.AI] 11 Apr 2017
The MATLAB Toolbox SciXMiner: User’s Manual and Programmer’s Guide Ralf Mikut, Andreas Bartschat, Wolfgang Doneit, Jorge Ángel González Ordiano, Benjamin Schott, Johannes Stegmaier, Simon Waczowicz, Markus Reischl Karlsruhe Institute of Technology (KIT), Institute for Applied Computer Science P.O. Box 3640, 76021 Karlsruhe, Germany
Phone: ++49/721/608-25731, Fax: ++49/721/608-25702 Email:
[email protected] Version 2017a (12.04.2017)
ii
Contents
Contents
iii
1
Motivation
1
2
Installation
3
3
Methods 3.1 Handling and functionality . . . . . . . . . . 3.2 Problem description . . . . . . . . . . . . . . 3.3 Further reading . . . . . . . . . . . . . . . . 3.4 Further toolboxes for classification (selection)
. . . .
4 4 5 6 8
. . . . . . . . .
9 9 9 9 11 13 14 16 17 18
4
5
6
. . . .
. . . .
. . . .
. . . .
Working with SciXMiner 4.1 Handling . . . . . . . . . . . . . . . . . . . . . . . 4.2 Import and export of projects . . . . . . . . . . . . . 4.2.1 Import of data . . . . . . . . . . . . . . . . . 4.2.2 Export of data . . . . . . . . . . . . . . . . . 4.2.3 Manual creation of SciXMiner projects . . . 4.3 Automation of analysis . . . . . . . . . . . . . . . . 4.4 Errors and warnings . . . . . . . . . . . . . . . . . . 4.5 Generation of application-specific extension packages 4.6 Known errors and problems . . . . . . . . . . . . . .
. . . .
. . . . . . . . .
. . . .
. . . . . . . . .
. . . .
. . . . . . . . .
. . . .
. . . . . . . . .
. . . .
. . . . . . . . .
. . . .
. . . . . . . . .
. . . .
. . . . . . . . .
. . . .
. . . . . . . . .
. . . .
. . . . . . . . .
. . . .
. . . . . . . . .
. . . .
. . . . . . . . .
. . . .
. . . . . . . . .
. . . .
. . . . . . . . .
. . . .
. . . . . . . . .
. . . .
. . . . . . . . .
. . . .
. . . . . . . . .
. . . .
. . . . . . . . .
. . . .
. . . . . . . . .
Sample projects 5.1 Building data set . . . . . . . . . . . . . 5.1.1 Introduction . . . . . . . . . . . . 5.1.2 Preparation of the data set . . . . 5.1.3 Application of cluster algorithms . 5.1.4 Time series prediction . . . . . . 5.2 Iris data set . . . . . . . . . . . . . . . . 5.2.1 Introduction . . . . . . . . . . . . 5.2.2 Classification . . . . . . . . . . . 5.2.3 Regression . . . . . . . . . . . .
. . . . . . . . .
. . . . . . . . .
. . . . . . . . .
. . . . . . . . .
. . . . . . . . .
. . . . . . . . .
. . . . . . . . .
. . . . . . . . .
. . . . . . . . .
. . . . . . . . .
. . . . . . . . .
. . . . . . . . .
. . . . . . . . .
. . . . . . . . .
. . . . . . . . .
. . . . . . . . .
. . . . . . . . .
. . . . . . . . .
. . . . . . . . .
. . . . . . . . .
. . . . . . . . .
. . . . . . . . .
. . . . . . . . .
. . . . . . . . .
. . . . . . . . .
19 19 19 19 23 25 27 27 27 29
Menu items 6.1 Menu items ’File’ . . . . 6.1.1 Load project . . 6.1.2 Save project . . . 6.1.3 Save project as...
. . . .
. . . .
. . . .
. . . .
. . . .
. . . .
. . . .
. . . .
. . . .
. . . .
. . . .
. . . .
. . . .
. . . .
. . . .
. . . .
. . . .
. . . .
. . . .
. . . .
. . . .
. . . .
. . . .
. . . .
. . . .
32 32 32 32 32
. . . .
. . . .
. . . .
. . . .
. . . .
. . . .
. . . .
. . . .
. . . . iii
iv
Contents
6.2
6.3
6.4
6.1.4 Mean value project (based on the selected output variable) 6.1.5 Export data . . . . . . . . . . . . . . . . . . . . . . . . . 6.1.6 Import data . . . . . . . . . . . . . . . . . . . . . . . . . 6.1.7 Fusion of projects . . . . . . . . . . . . . . . . . . . . . . 6.1.8 Apply SciXMiner batch file . . . . . . . . . . . . . . . . 6.1.9 Apply SciXMiner batch file (debug mode) . . . . . . . . . 6.1.10 Apply SciXMiner batch file (step and debug mode) . . . . 6.1.11 Normative data . . . . . . . . . . . . . . . . . . . . . . . 6.1.12 Data mining . . . . . . . . . . . . . . . . . . . . . . . . . 6.1.13 Options . . . . . . . . . . . . . . . . . . . . . . . . . . . 6.1.14 Exit . . . . . . . . . . . . . . . . . . . . . . . . . . . . . Menu items ’Edit’ . . . . . . . . . . . . . . . . . . . . . . . . . . 6.2.1 Select . . . . . . . . . . . . . . . . . . . . . . . . . . . . 6.2.2 Extract . . . . . . . . . . . . . . . . . . . . . . . . . . . 6.2.3 Convert . . . . . . . . . . . . . . . . . . . . . . . . . . . 6.2.4 Delete . . . . . . . . . . . . . . . . . . . . . . . . . . . . 6.2.5 Sorting . . . . . . . . . . . . . . . . . . . . . . . . . . . 6.2.6 Outlier detection . . . . . . . . . . . . . . . . . . . . . . 6.2.7 Category . . . . . . . . . . . . . . . . . . . . . . . . . . 6.2.8 Rename... . . . . . . . . . . . . . . . . . . . . . . . . . . 6.2.9 Generating trigger time series . . . . . . . . . . . . . . . 6.2.10 Edit trigger time series . . . . . . . . . . . . . . . . . . . 6.2.11 Looking for missing data . . . . . . . . . . . . . . . . . . Menu items ’View’ . . . . . . . . . . . . . . . . . . . . . . . . . 6.3.1 Classes for selected data points . . . . . . . . . . . . . . . 6.3.2 Number of terms for selected data points . . . . . . . . . 6.3.3 Time series (TS) . . . . . . . . . . . . . . . . . . . . . . 6.3.4 Single features . . . . . . . . . . . . . . . . . . . . . . . 6.3.5 Single features (multivariate) . . . . . . . . . . . . . . . . 6.3.6 Classification . . . . . . . . . . . . . . . . . . . . . . . . 6.3.7 Regression . . . . . . . . . . . . . . . . . . . . . . . . . 6.3.8 Aggregated features . . . . . . . . . . . . . . . . . . . . 6.3.9 Output variables . . . . . . . . . . . . . . . . . . . . . . 6.3.10 Spectrogram . . . . . . . . . . . . . . . . . . . . . . . . 6.3.11 Morlet spectrogram . . . . . . . . . . . . . . . . . . . . . 6.3.12 Cross and Auto Correlation Functions . . . . . . . . . . . 6.3.13 FFT . . . . . . . . . . . . . . . . . . . . . . . . . . . . . 6.3.14 Fuzzy systems . . . . . . . . . . . . . . . . . . . . . . . 6.3.15 Decision tree (LaTeX) . . . . . . . . . . . . . . . . . . . 6.3.16 Clustering . . . . . . . . . . . . . . . . . . . . . . . . . . 6.3.17 Self Organizing Maps... . . . . . . . . . . . . . . . . . . 6.3.18 Data point distances . . . . . . . . . . . . . . . . . . . . 6.3.19 Project report . . . . . . . . . . . . . . . . . . . . . . . . 6.3.20 Recoding table . . . . . . . . . . . . . . . . . . . . . . . Menu items ’Data mining’ . . . . . . . . . . . . . . . . . . . . . 6.4.1 Selection and evaluation of single features . . . . . . . . . 6.4.2 Evaluation of time series . . . . . . . . . . . . . . . . . . 6.4.3 Evaluation of output variables . . . . . . . . . . . . . . .
. . . . . . . . . . . . . . . . . . . . . . . . . . . . . . . . . . . . . . . . . . . . . . . .
. . . . . . . . . . . . . . . . . . . . . . . . . . . . . . . . . . . . . . . . . . . . . . . .
. . . . . . . . . . . . . . . . . . . . . . . . . . . . . . . . . . . . . . . . . . . . . . . .
. . . . . . . . . . . . . . . . . . . . . . . . . . . . . . . . . . . . . . . . . . . . . . . .
. . . . . . . . . . . . . . . . . . . . . . . . . . . . . . . . . . . . . . . . . . . . . . . .
. . . . . . . . . . . . . . . . . . . . . . . . . . . . . . . . . . . . . . . . . . . . . . . .
. . . . . . . . . . . . . . . . . . . . . . . . . . . . . . . . . . . . . . . . . . . . . . . .
. . . . . . . . . . . . . . . . . . . . . . . . . . . . . . . . . . . . . . . . . . . . . . . .
. . . . . . . . . . . . . . . . . . . . . . . . . . . . . . . . . . . . . . . . . . . . . . . .
. . . . . . . . . . . . . . . . . . . . . . . . . . . . . . . . . . . . . . . . . . . . . . . .
. . . . . . . . . . . . . . . . . . . . . . . . . . . . . . . . . . . . . . . . . . . . . . . .
. . . . . . . . . . . . . . . . . . . . . . . . . . . . . . . . . . . . . . . . . . . . . . . .
32 32 33 33 34 35 35 35 35 36 37 37 37 38 39 43 44 44 45 46 46 47 47 47 47 48 48 49 52 52 53 54 55 55 56 56 58 58 59 59 60 60 61 61 61 61 64 64
Contents
6.5
6.6
6.7
6.8
7
v
6.4.4 Classification . . . . . . . . . . . . . . . . . . . . . . . . . . 6.4.5 Time series classification . . . . . . . . . . . . . . . . . . . . 6.4.6 Hierarchical Bayes classifier . . . . . . . . . . . . . . . . . . 6.4.7 Fuzzy systems . . . . . . . . . . . . . . . . . . . . . . . . . 6.4.8 Clustering . . . . . . . . . . . . . . . . . . . . . . . . . . . . 6.4.9 Association analysis . . . . . . . . . . . . . . . . . . . . . . 6.4.10 Self Organizing Maps . . . . . . . . . . . . . . . . . . . . . 6.4.11 Regression . . . . . . . . . . . . . . . . . . . . . . . . . . . 6.4.12 Validation . . . . . . . . . . . . . . . . . . . . . . . . . . . . Menu items ’Extras’ . . . . . . . . . . . . . . . . . . . . . . . . . . 6.5.1 Play macro... . . . . . . . . . . . . . . . . . . . . . . . . . . 6.5.2 Play macro (debug mode)... . . . . . . . . . . . . . . . . . . 6.5.3 Record macro... . . . . . . . . . . . . . . . . . . . . . . . . . 6.5.4 Stop macro record . . . . . . . . . . . . . . . . . . . . . . . 6.5.5 Edit macro... . . . . . . . . . . . . . . . . . . . . . . . . . . 6.5.6 Reset macro names . . . . . . . . . . . . . . . . . . . . . . . 6.5.7 Execute M-file... . . . . . . . . . . . . . . . . . . . . . . . . 6.5.8 Edit M-file... . . . . . . . . . . . . . . . . . . . . . . . . . . 6.5.9 Edit SciXMiner batch file ... . . . . . . . . . . . . . . . . . . 6.5.10 Generate PDF project report (needs Latex) . . . . . . . . . . 6.5.11 Translate German Gait-CAD m-files and macros into English 6.5.12 Choose application-specific extension packages... . . . . . . . 6.5.13 Search path for m-files and plugins . . . . . . . . . . . . . . 6.5.14 Matlab Parallel . . . . . . . . . . . . . . . . . . . . . . . . . Menu items ’Favorites’ . . . . . . . . . . . . . . . . . . . . . . . . . 6.6.1 Edit user-defined favorites . . . . . . . . . . . . . . . . . . . 6.6.2 Delete all favorites . . . . . . . . . . . . . . . . . . . . . . . Menu items ’Window’ . . . . . . . . . . . . . . . . . . . . . . . . . 6.7.1 Close figures . . . . . . . . . . . . . . . . . . . . . . . . . . 6.7.2 Arrange figures . . . . . . . . . . . . . . . . . . . . . . . . . 6.7.3 Logarithmic scaling of current figures . . . . . . . . . . . . . 6.7.4 Remove Latex codes in MATLAB figures . . . . . . . . . . . 6.7.5 Update font and font size in figures . . . . . . . . . . . . . . 6.7.6 Plot all figures as images in files . . . . . . . . . . . . . . . . Menu items ’Help’ . . . . . . . . . . . . . . . . . . . . . . . . . . . 6.8.1 Show SciXMiner documentation (PDF) . . . . . . . . . . . . 6.8.2 About SciXMiner . . . . . . . . . . . . . . . . . . . . . . . . 6.8.3 License information . . . . . . . . . . . . . . . . . . . . . .
Control elements 7.1 Control elements for ’Project overview’ . . . . . . . . . . 7.2 Control elements for ’Time series: General options’ . . . . 7.3 Control elements for ’Time series: Extraction - Parameters’ 7.4 Control elements for ’Plugin sequence’ . . . . . . . . . . 7.5 Control elements for ’Single features’ . . . . . . . . . . . 7.6 Control elements for ’Data preprocessing’ . . . . . . . . . 7.7 Control elements for ’View: Single features’ . . . . . . . . 7.8 Control elements for ’View: Time series’ . . . . . . . . .
. . . . . . . .
. . . . . . . .
. . . . . . . .
. . . . . . . .
. . . . . . . .
. . . . . . . .
. . . . . . . . . . . . . . . . . . . . . . . . . . . . . . . . . . . . . .
. . . . . . . . . . . . . . . . . . . . . . . . . . . . . . . . . . . . . .
. . . . . . . . . . . . . . . . . . . . . . . . . . . . . . . . . . . . . .
. . . . . . . . . . . . . . . . . . . . . . . . . . . . . . . . . . . . . .
. . . . . . . . . . . . . . . . . . . . . . . . . . . . . . . . . . . . . .
. . . . . . . . . . . . . . . . . . . . . . . . . . . . . . . . . . . . . .
. . . . . . . . . . . . . . . . . . . . . . . . . . . . . . . . . . . . . .
. . . . . . . . . . . . . . . . . . . . . . . . . . . . . . . . . . . . . .
. . . . . . . . . . . . . . . . . . . . . . . . . . . . . . . . . . . . . .
. . . . . . . . . . . . . . . . . . . . . . . . . . . . . . . . . . . . . .
65 65 66 66 67 67 68 68 69 70 70 70 70 70 70 70 71 71 71 71 72 72 72 72 73 73 73 73 73 73 74 74 74 74 74 74 74 74
. . . . . . . .
. . . . . . . .
. . . . . . . .
. . . . . . . .
. . . . . . . .
. . . . . . . .
. . . . . . . .
. . . . . . . .
. . . . . . . .
. . . . . . . .
75 75 76 78 81 84 86 91 94
vi
Contents
7.9 7.10 7.11 7.12 7.13 7.14 7.15 7.16 7.17 7.18 8
9
Control elements for ’View: Spectrogram, FFT, CCF’ . . . . . . . . Control elements for ’View: Classification and regression’ . . . . . Control elements for ’Data mining: Classification of single features’ Control elements for ’Data mining: Classification of time series’ . . Control elements for ’Data mining: Regression’ . . . . . . . . . . . Control elements for ’Data mining: Clustering’ . . . . . . . . . . . Control elements for ’Data mining: Special methods’ . . . . . . . . Control elements for ’Data mining: Statistical options’ . . . . . . . Control elements for ’Data mining: Validation’ . . . . . . . . . . . Control elements for ’General options’ . . . . . . . . . . . . . . . .
Feature extraction from time series 8.1 Definition of feature types by plugins . . . . . 8.2 Standard plugins in SciXMiner . . . . . . . . . 8.3 Plugins for single features from single features 8.4 Defining intervals via files . . . . . . . . . . . 8.5 Definition of a feature ontology by categories .
. . . . .
. . . . .
. . . . .
. . . . .
. . . . .
. . . . .
. . . . .
. . . . .
. . . . .
. . . . .
. . . . .
. . . . . . . . . .
. . . . .
. . . . . . . . . .
. . . . .
. . . . . . . . . .
. . . . .
. . . . . . . . . .
. . . . .
. . . . . . . . . .
. . . . .
. . . . . . . . . .
. . . . .
. . . . . . . . . .
. . . . .
. . . . . . . . . .
. . . . .
. . . . . . . . . .
. . . . .
. . . . . . . . . .
. . . . .
. . . . . . . . . .
97 100 102 105 111 113 115 134 136 138
. . . . .
141 141 144 144 144 145
Conclusions and perspectives
147
A Important file structures
148
B Important internal data structures
150
C Needed Standard Toolboxes
152
D Included External Toolboxes (GNU-License)
153
E Symbols and abbreviations
157
F Known errors and problems
158
G Version history G.1 Versions . . . . . . . . . . . . . . . . . . . . . . . . . . . . . . . . . . . . . . . . . . . G.2 Selected changes between Gait-CAD version 2014b and SciXMiner version 2016b . . . G.3 Selected changes between SciXMiner versions 2016b and 2017a . . . . . . . . . . . . .
160 160 160 161
H Plugins
162
Bibliography
181
1 Motivation The Matlab toolbox SciXMiner is designed for the visualization and analysis of time series and features with a special focus to classification problems. It was developed at the Institute of Applied Computer Science of the Karlsruhe Institute of Technology (KIT), a member of the Helmholtz Association of German Research Centres in Germany. The aim was to provide an open platform for the development and improvement of data mining methods and its applications to various medical and technical problems. SciXMiner bases on Matlab (tested for the version 2017a). Many functions do not require additional standard toolboxes but some parts of Signal, Statistics and Wavelet toolboxes are used for special cases. The decision to a Matlab-based solution was made to use the wide mathematical functionality of this R R package provided by The Mathworks Inc. MATLAB and Simulink are registered trademarks of The MathWorks, Inc. SciXMiner is controlled by a graphical user interface (GUI) with menu items and control elements like popup lists, checkboxes and edit elements. This makes it easier to work with SciXMiner for inexperienced users. Furthermore, an automatization and batch standardization of analyzes is possible using macros. The standard Matlab style using the command line is also available. SciXMiner is an open source software. The download page is http://sourceforge.net/projects/SciXMiner/. It is licensed under the conditions of the GNU General Public License (GNU-GPL) of The Free Software Foundation (see http://www.fsf.org/). The toolbox bases on earlier internal versions of Gait-CAD [64, 72]. Please refer to [80] if you use SciXMiner for your scientific work. SciXMiner contains a base toolbox and various application-specific extension packages. Up to know, six extension packages were published: • analysis of images and videos [102, 101] including a link to the ITK-based pipeline generation tool XPIWIT [7], • object tracking [102, 101], • tissue detection and fluorescence quantification for zebrafish larvae (algorithms from [32]), • feature extraction and peptide optimization based on amino-acid distributions and chemical descriptors [71], • image processing and feature extraction for segmentation of grains in asphalt samples [92], and • extended measures and visualization to evaluate the quality of data and regression models [28].
2
Chapter 1. Motivation
This manual is organized as follows: Chapter 2 explains the installation procedure. Chapter 3 outlines the implemented functionality of SciXMiner followed by some recommendations for working with SciXMiner. The analysis of two benchmark data sets is discussed in Chapter 5. Detailed information for the use of menu items (Chapter 6) and control elements (Chapter 7) follow. Chapter 8 present possible application-specific extensions for the feature extraction from time series. The appendix provide information about file formats (Appendix A), internal data structures (Appendix B), necessary standard toolboxes (Appendix C) and integrated GNU-GPL-Matlab toolboxes of different groups (Appendix D), a list of symbols and abbreviations (Appendix E) and a list of known bugs and problems (Appendix F).
2 Installation The file SciXMiner-Installer.exe contains all necessary files as self-extracting executable. After starting the destination folder for SciXMiner has to be selected, e.g. d:\matlab\scixminer\. In a next step, the recent user path of the installed MATLAB version must be defined. An example is C:\Dokumente und Einstellungen\firstname.surname\My Documents\MATLAB. SciXMiner uses a subdirectory called scixminer of this directory to save options files. The user needs writing permissions for this directory. A starting file called scixminer.m is individually created for this computer and stored in the user path. For a different user on the same computer, scixminer.m must be copied to his/her user path. Alternatively, scixminer.m can be copied to any other path of the MATLAB search path (matlabpath). Alternatively, a zipped version scixminer.zip can be used. For the installation, the following steps are necessary: 1. extract in a directory, 2. copy start file admin\scixminer.m in a directory of the matlab work directory (check using command matlabpath), 3. modify the directories in this file with the directory from the first step. SciXMiner is now ready installed and can be started with scixminer. For developers, a SVN repository is available at: https : //svn.code.sf.net/p/scixminer/scixminer. Please check SciXMiner out in a directory on your computer, e.g. d : scixminer.
3 Methods 3.1
Handling and functionality
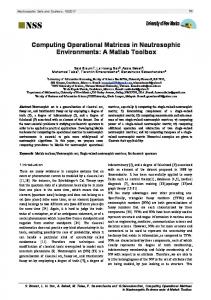
Data mining methods are useful in searching for unknown or partially known relations in large data sets (KDD: Knowledge Discovery from Databases). A well known definition is given by [30]: Data mining is a step in the KDD process that consists of applying data analysis and discovery algorithms that produce a particular enumeration of patterns (or models) over the data. Pattern describes typical significant characteristics in features of the data set. Hereby, a feature is an input variable for the data mining algorithm, which is relevant with respect to the data mining problem. In this manual every input variable is regarded as possible feature, as it may be helpful solving the problem. Starting with a verbalized data mining problem, an adequate formalization has to be found. This formalization influences as well the collection of the training data set from an (external) data base (i. e. by special import routines, like HeiDATAProViT in gait analysis [94]) as the collective of possible evaluation measures in SciXMiner (Figure 3.1).
Figure 3.1: Link between SciXMiner and the design of data mining methods
3.2. Problem description
5
SciXMiner permits a comfortable handling of numerous algorithms for the • selection of data points (i. e. detection of outliers, discarding of incomplete data points and features, selection of parts of data sets), • extraction of features (i. e. spectrograms, FFT analysis, correlation analysis, linear filtering, calculation of extrema, mean values, fuzzification etc.), • evaluation of features and their selection (i. e. multivariate analysis of variances, t-test, information measures, regression analysis), • aggregation of features (synonym: feature transformation, e.g. Discriminant Analysis, Principal Component Analysis (PCA), Independent Component Analysis (ICA)), • supervised and unsupervised classification (i. e. decision trees, cluster algorithms, Bayes classifier, Artificial Neural Networks (ANN), Nearest Neighbor algorithms, Support Vector Machines (SVM), fuzzy systems) and • validation strategies (i. e. cross-validation, bootstrap). Additionally, there are various possibilities to visualize results, import and export data sets, automatically log results and process steps in text and LATEXfiles, rename variables etc. Depending on the availability, functions from different toolboxes are called, thereunder standard Matlab functions, functions from internal Matlab toolboxes (see Appendix C), free available Matlab toolboxes (FastICA1 , SVM and Kernel Methods Matlab Toolbox [24]2 , SOM Toolbox [109]3 , lp_solve4 , see Appendix D) and many SciXMiner internal functions.
3.2
Problem description
A mandatory item to start a calculation is a training data set with n = 1, . . . , N data points, each containing • sz time series (matrices XT S [n] with xT S,r [k, n] ∈ R, r = 1, . . . , sz , k = 1, . . . , K sample points), • s features (vectors x[n] ∈ R with xl [n], l = 1, . . . , s) and • sy discrete output variables (vector y[n] ∈ N+ with yj [n], j = 1, . . . , sy ). Here, R is the set of real numbers and N+ the set of natural numbers. Ordinal, interval-scaled, and rational-scaled features may be processed. Ordinal features are discrete in value with respect to order scale (i. e. quantities with values like very small, small, middle, and big). The values do not contain any information about the semantics of their distances. If distances between all values are the same the scale is called interval-scaled (i. e. temperature in [◦ C] or [◦ F]). Rational-scaled values additionally contain a natural zero-point (i. e. length in [m], temperature in [K]). 1
http://www.cis.hut.fi/projects/ica/fastica/ http://asi.insa-rouen.fr/∼arakotom/toolbox/index.html 3 http://www.cis.hut.fi/projects/somtoolbox/ 4 http://lpsolve.sourceforge.net/5.5/ 2
6
Chapter 3. Methods
Besides further information like a priori preferences for features may be processed. The purpose is mainly the generation of static or quasi-static estimations yˆj [N + 1] =f (x[N + 1]) resp.
(3.1)
yˆj [N + 1] =f (x[N + 1](XT S [N + 1]))
(3.2)
for a data point N + 1 with an unknown output variable, as well es the generation of intermediate results like tables or catalogues of relevant features for certain problems. The management of multiple output variables (i. e. diagnoses with respect to diseases in medical applications, decisions for therapies, qualitative evaluations of therapy successes, gender, age-groups etc.) for each data point allows a flexible selection of multiple classification problems. Additionally, input and output variables may be changed in dependence of the problem. The training data set is given by a binary Matlab project file, containing matrices with standardized names (i. e. d_orgs for time series, d_org for features and code_alle for output variables). Additionally, matrices and structures are possible (not mandatory) to denote textual identifiers and further information. Missing information is compensated by standard values and identifiers. Using 1 GB of RAM a SciXMiner project file may have a size up to 500 MB without causing any problems with memory. Larger project files are problematic, due to the chosen data structures (arrays instead of cell arrays).
3.3
Further reading
A comprehensive illustration of all algorithms mentioned in this section can not be done within this manual. Therefore, some examples for further reading are given: • basic knowledge about multivariate statistics and classification [107, 69, 49] and specialties for time series [73], • basics in data mining [30, 15, 25, 78, 93] including tuning concepts [58], • cluster algorithms and Fuzzy C-Means (FCM): basics: [46, 48], specialties for time series [64], • decision trees (basics: [16, 85], implemented design algorithms [50, 76]), • fuzzy systems (basics: [117, 55, 61, 60], implemented design algorithms [50, 76, 13, 12]), , specialities to improve interpretability [31, 76] • a priori relevances [114, 76], • Independent Component Analysis [47, 106], • Support Vector Machines [18, 24, 98], • k-Nearest Neighbor Methods [26], • Artificial Neural Networks [42], • feature aggregation and selection using wrapper approaches [88], • validation strategies [69], and
3.3. Further reading
Application Asphalt grain analysis Brain-Machine-Interfaces Cell classification Ceramic actuator optimization Circadian parameter estimation Climate change events on streets Control of prosthesis with muscle signals Heartbeat detection of zebrafish Light-sheet microscopy Mobile working machines Modeling of labyrinth seals Morphology analysis of zebrafish Movement analysis Object segmentation of hardware items Optimization of antimicrobial peptides Peripheral nerve signals of rats pH sensor diagnosis Photo-Motor Response Photovoltaic systems Robotics Smart energy grids Toxicity tests Wind power systems
7
Data Images Time series Images and single features Time series and single features Time series Time series Time series Videos
Domain Engineering Medicine Biology
References [92] [70] [52]
Engineering
[17]
Medical technology Engineering
[99]
Medical ogy Biology
[83, 87, 89, 91, 97, 96]
technol-
[51]
[2, 84, 81]
3D-Images, 3DVideos Time series Single features
Biology
[101, 103, 104]
Engineering Engineering
[33, 34] [82]
Images
Biology
[2, 3, 100, 105]
Time series Images
Medicine Engineering
[20, 95, 113, 114, 115] [53, 54]
Sequences
Chemistry
Time series
Biology
[38, 56, 71, 74, 86, 79, 116] [44]
Time series Images, Time series Time series Time series Time series Images Time series
Engineering Biology
[37] [57, 67]
Engineering Engineering Engineering Biology Engineering
[35, 36] [8, 10, 9, 11] [21, 40, 65, 66, 110, 111] [3, 4, 45] [6]
Table 3.1: Selected SciXMiner applications
• alternative data mining software as Weka [41], Knime [14], Apache Spark’s machine learning library [68], Keel [1], Rattle/R [112], see surveys in [77, 62, 39] Selected SciXMiner applications are listed in Table 3.1. Further details about parameterization are given in the description of menu items (Chapter 6) and control elements (Chapter 7).
8
Chapter 3. Methods
3.4
Further toolboxes for classification (selection)
• PRTools (http://www.prtools.org/) University of Delft (The Netherlands): Matlab toolbox, e.g. Principal Component Analysis, Subspace classifiers, Artificial Neural Networks, without GUI, free for academic use • NEFCLASS (http://fuzzy.cs.uni-magdeburg.de/nefclass/) University Magdeburg (Germany): JAVA, e.g. Neuro-Fuzzy classifiers, free for academic use
4 Working with SciXMiner 4.1
Handling
The graphical user interface (GUI) of SciXMiner contains menu items and control elements like listboxes, checkboxes and text fields. They are implemented using Matlab functions (uicontrol, uimenu), which are partially called by encapsulated SciXMiner functions with additional functionality. These elements are using callback functions to exchange data with variables from the workspace and call functions which are independent from the GUI. Thus, the Matlab-typical way of programming using a command prompt and variables is possible, too. The elements of the graphical user interface are described in the following sections.
4.2
Import and export of projects
SciXMiner offers the opportunity for an import and export of projects from and into ASCII files. The possible options will be explained in the next two sections with a focus to the import and export of time series. Some differences for the export of single features will be also explained.
4.2.1
Import of data
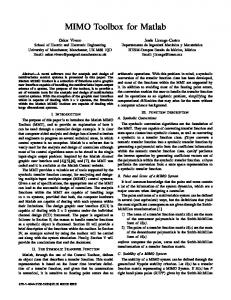
Data can be imported from one file or from many files in a directory. The latter option is also possible for existing subdirectories, but requires special naming conventions. For the import of time series, each data point is read from a separate file. It contains the time series in the columns and the sample points in the rows. For single features, all data points are normally read from one file containing the single features in the columns and the data points in the rows. An import from multiple files is also possible to characterize different output classes by the file and directory names. The window in Fig. 4.1 will be shown for an import using File - Import data - From a directory.... The option ”Searching in subdirectories” defines if subdirectories are scanned for matching files or not. The option ”Write in separate projects” defines that separate SciXMiner projects are generated for each import file. These separate projects can later fused by File - Fusion of projects. ”File extension” specifies all files for the import. Wildcards are not possible (e.g. .t*)! The ”Separator for output variables” controls the assignment of output variables. As a consequence, it is extremely important for a comfortable assignment of output variables to data points - especially for time series. It can be specified for directory names and for file names.
10
Chapter 4. Working with SciXMiner
Figure 4.1: Dialog window for the data import
Example: The import of three files d:\prj\names\Anna\Post-therapeutic.txt d:\prj\names\Anna\Pre-therapeutic.txt d:\prj\names\Peter\Post-therapeutic.txt from a folder d:\prj\names and the file extension ’*.txt’ generates two terms for the first output variable variables (”Anna”, ”Peter”) and two terms for the second output variable (”Pre-therapeutic”, ”Post-therapeutic”). For File - Import data - From a file..., the single file to be imported will be selected by a standard window. After this, a slightly different window is shown to specify the import, but the lower part of the windows agrees with Fig. 4.1. Inside a file, two different separators are expected for the separation of columns (e.g. tabulators for different time series or single features) and decimal numbers (e.g. ”Point”: 17.3, ”Comma: 17,3”). Such different separators for decimal numbers are necessary for compatibility reason for some foreign language versions as e.g. German software. The option ”First row contains names” reads the names of the single features and time series from the first row of the import file. Furthermore, a fix number of the rows at the beginning of the file (”Read from
4.2. Import and export of projects
11
row”) resp. all rows starting with a specified sign (”Ignore rows starting with”) can be ignored. This is especially useful for the import of files with a header. Empty rows will be ignored too. The option ”Import as” switches between an import of single features and an import of time series. A simultaneous import is not possible at the moment. The option ”Normalization of time series length” is only necessary if time series with different length will be imported. SciXMiner assumes always identical lengths. Different options exist: a resampling by the standard Matlab command (from the signal toolbox) to get the length of the longest time series, a filling of shorter time series with zeros or the last valid value. The last option ”Import with” switches between different import techniques. The ”Normal mode” generates a temporary file after a possible separator correction. It is normally the best version especially for large files. ”Write copy and read again” make the same line by line. ”Line-Option” is a standard line-wise reading by Matlab. ”Standard-ASCII” uses the Matlab command load -ascii and works only, if the file contains only numbers (without variable names etc.). This option has a reduced functionality but it can be very fast. ”Structured (with Strings)” tries to import numbers and strings for files with single features. The strings are converted into linguistic terms of output variables. This option should be used together with the option ”Write in separate projects”. ”Importdata (MATLAB)” uses the MATLAB function ”importdata”. It tries to import numbers and strings for files with single features. The strings are converted into linguistic terms of output variables. All columns with a string element in the first data row are interpreted as string columns. Such data is read from ”importdata” as ”textdata”. This option is faster than ”Structured (with Strings)”.
4.2.2
Export of data
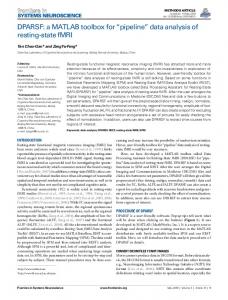
For the export of time series, each data point is written into a separate file. It contains the time series in the columns and the sample points in the rows. The possible options are controlled be the window in Fig. 4.2. The target directory must be defined manually for compatibility reasons with Matlab Version 5.3 (due to a missing window for the selection of directories). A copy from the clipboard is possible. The target directory must exist. The directory and file structure names are mainly determined by the following options. ”Write output variables in subdirectories” generates subdirectories for the first (n − 1) output variables and codes the n-th output variable in the file name. The file for each data point is saved in the directories and file with the corresponding name. Otherwise, the file name is generated by all terms. The parts are separated by the separator defined by ”Separator for the output variables for file names”. The option ”None” works without separators. If more than one data point for a term combination exists, a further directory splitting will be done. In this case, the file name is only the number of the data point. ”File extension” control the extension for the generated files. Example:
12
Chapter 4. Working with SciXMiner
Figure 4.2: Dialog window for the export of data
An export of time series into the destination folder d:\prj\names in a project with the output variables ”Names” (terms: ”Anna”, ”Maria”, ”Thomas”, ”Peter”) and ”Examination” (terms: ”Pre-therapeutic”, ”Post-therapeutic”) give the following file structure using the option ”Write output variables in subdirectories”: d:\prj\names\Anna\Post-therapeutic.txt d:\prj\names\Anna\Pre-therapeutic.txt d:\prj\names\Peter\Post-therapeutic.txt d:\prj\names\Peter\Pre-therapeutic.txt d:\prj\names\Maria\Post-therapeutic.txt d:\prj\names\Maria\Pre-therapeutic.txt d:\prj\names\Thomas\Post-therapeutic.txt d:\prj\names\Thomas\Pre-therapeutic.txt If more than one data point for a term combination exist, the directory and file names are slightly different, e.g.: d:\prj\names\Anna\Post-therapeutic\1.txt
4.2. Import and export of projects
13
d:\prj\names\Anna\Post-therapeutic\5.txt The separators for columns and decimal numbers are the same as for the import. The option ”Write names in first row” writes the names of the single features and time series in the first row of the export file. ”Export only selected data points and features” uses the recent selection in the project to reduce the data for the export. For the export of single features, all data points are written in one file. It contains the single features in the columns and the data points in the rows. Two differences exist for the export of single features: • A dialog box is shown for a file selection. Single features will be always exported into one file. • An additional option ”Export output variables as single features” add all output variables to the single features for the export. It simplifies the matching by data points and output classes. For time series, this task is solved by the file and directory names.
4.2.3
Manual creation of SciXMiner projects
In this section the creation of a SciXMiner project file is described, either manual or semi-automatic, if a fully automatic import is not possible. An overview of identifiers which are used by SciXMiner is given in Appendix B. SciXMiner projects are binary Matlab files. These files contain variables and at least one of the following identifiers has to be defined within the project file: • d_orgs: contains time series of the project. 3D-array with dimension N × K × sz • d_org: contains features of the project. 2D-array with dimension N × s. N denotes the number of data points, K denotes the number of sample points of the time series, sz is the number of time series and s is the number of features (see Section 3.2). The most comfortable way is to use the function generate_new_scixminer_project.m. This function supports the conversion of MATLAB variables into SciXMiner projects. All possible elements are explained in the following text and in the help text of the function, including some examples for the conversion. If output variables are known, they may be saved in an identifier called code_alle. This identifier contains an N × sy matrix with the sy different types of output variables in the columns and the class assignments of N data points in the rows. Thereby, each class is represented by a (positive) integer number. If this identifier is not defined, the class assignment of each data point is set to 1. Optionally, the following identifier may be defined. In order to simplify the handling of SciXMiner, the definition is recommended:
14
Chapter 4. Working with SciXMiner
• Names for output variables may be given in the identifier bez_code. This identifier contains a string-matrix, where the number of rows has to match the number of output variables. The number of columns depends on the length of the strings. An easy method to create bez_code is the integrated Matlab function strvcat. If bez_code is not defined, the output variables are named ”y1”, ”y2”, ... • The classes of the output variable may also be named by an identifier. Therefore, the struct zgf_y_bez with the dimension sy × max(my,i ) is used. my,i denotes the number of linguistic terms of the i-th output variable. The identifier is contained in the field name. Example: There are two output variables, containing two respectively four classes. The identification of these classes can be done using zgf_y_bez(1,1).name = ’Anna’; zgf_y_bez(1,2).name = ’Maria’; zgf_y_bez(1,3).name = ’Thomas’; zgf_y_bez(1,4).name = ’Peter’; zgf_y_bez(2,1).name = ’pre-therapeutic’; zgf_y_bez(2,2).name = ’post-therapeutic’; • The identifiers of time series are arranged in a matrix called var_bez. The number of rows of the matrix is equal to the number of time series within the project. The number of columns depends on the length of the identifiers (equal to bez_code). • The identifiers of features are arranged in a matrix called dorgbez. The number of rows of the matrix is equal to the number of features within the project. The number of columns depends on the length of the identifiers (equal to bez_code). Another two variables may be inserted optionally, although the use is rather untypical: • Project-specific struct projekt: This struct might contain additional information for the project. It will read out during loading the project and are written to parameter.projekt. • To weight features so called a priori relevances may be used. They are multiplied by the calculated feature relevances. Thus, features with doubtful values based on difficult environments for sensor measurements may be downgraded, to force the feature selection to use reliable features for classification. These a priori relevances have to be stored in a variable called interpret_merk. interpret_merk is a s × 1 vector. The project has to be saved using the suffix ”.prjz”. An easy way is the use of the Matlab command save. As additional parameter -mat has to be used.
4.3
Automation of analysis
The main strategy elements for the automation of analysis processes are • macros,
4.3. Automation of analysis
15
• SciXMiner batch files and • generated PDF files with project results. Macros are files containing sequences of clicked menu items and control elements. A manual modification of this file is possible due to its textual Matlab syntax. They can be recorded, executed, and modified (see remarks at Extras - Record macro... and example in Section 5.1). To Save a SciXMiner project automatically in a macro, the name of the project must be manually defined inside a macro to avoid the input from a GUI. This can be done by adding the following lines in a macro: %adds ’_new’ to the name of the current SciXMiner project, %e.g. myproject.prjz will be saved as myproject_new.prjz next_function_parameter = [parameter.projekt.datei ’_new’]; %% save the new project eval(gaitfindobj_callback(’MI_Speichern’));
To execute a macro inside a other macro, the following lines must be added in the calling macro: %defines the name of the macro %here: computing the exponential function for all selected single features next_function_parameter = ’feature_plugin_exp.makrog’; %execute the macro execute_macro_inside_macro;
A SciXMiner batch file is a file for the automatic execution of macros for one or more projects. The batch file might contain one project or a complete directory with all SciXMiner projects in all subdirectories. Optionally, a file with a list of control elements with the extension *.uihdg is loaded by File - Options Load options. For each of these projects, the following list of macros or *.m-files or variable assignments into the fields of the variable gaitcad_extern.user is executed. These variable assignments have to be complete matlab commands. They are valid for all following macros. A recursive definition with other batch files is possible. During execution, the related projects are loaded and the macros are executed. All files must be exist. Errors does not caused a stop of the execution. Errors are only written in a file called error.log. The files must hold the following scheme: 1-Inf x following block: [ 1 x *.batch file or [ 1 x *.prjz file or directory 0-1 x *.uihdg file 1-Inf x *.makrog file or *.m file or variable assignments in gaitcad_extern.user]]
Example for a SciXMiner batch file: building.prjz building_regression.makrog show_report.makrog building_trigger.makrog building_teilen.makrog building_day.prjz building_cluster.makrog gaitcad_extern.user.test = 1; show_report.makrog
16
Chapter 4. Working with SciXMiner
All project, batch, macro, option and m files can be written with absolute directory names. Relative directory names should be predefined in the variable gaitcad_extern.user. This strategy simplifies the modification of SciXMiner batch files with complex function calls, e.g., for the transfer to a computer with a different folder structure. Here, a project and a macro directory as well as the recent working directory (pwd) are supported. As an example, the directories local_directories.batch:
can
be
defined
in
a
SciXMiner
batch
file
called
gaitcad_extern.user.project_directory = ’d:\projects’ gaitcad_extern.user.macro_directory = ’d:\macros’
The main SciXMiner batch file can be organized as follows: local_directories.batch project_directory\building.prjz macro_directory\building_regression.makrog macro_directory\show_report.m macro_directory\building_trigger.makrog macro_directory\building_teilen.makrog project_directory\building_day.prjz macro_directory\building_cluster.makrog gaitcad_extern.user.test = 1; macro_directory\show_report.m
SciXMiner batch files can be started from the GUI or using the Matlab command line: gaitbatchfile = ’d:\matlab\scixminer\prj\building_demo.batch’;scixminerbatch;
A special option is the use of an empty project called noproject.prjz. After loading, the menu items can be enabled. Consequently, otherwise disabled menu items as e.g. the import of text files can be executed. PDF files can be generated for the documentation of project containing figures and latex files. This option requires a Latex installation (Open-Source). Further remarks can be found under Extras - Generate PDF project report (needs Latex). Using these strategy elements, even larger projects with a high computational effort or complete directories with many projects can be processed automatically.
4.4
Errors and warnings
Many errors and warnings in functions are displayed in a separated message box (see example for a warning message in Fig. 4.3). Three different options are available for a warning message: • ’Continue’: The function will be continued. • ’Cancel’: The function will be canceled. An error message ’Canceled by user!’ will be shown in the Matlab command window. • ’Ignore all warnings’: It is similar to ’Continue’, but all future warning methods will be ignored for the rest of the SciXMiner session.
4.5. Generation of application-specific extension packages
17
Figure 4.3: Warning message in SciXMiner
Error and warning messages stop SciXMiner until the message was confirmed or the message window was closed. The possible debugger options ”Stop if Error” or ”Stop if Warning” in the MATLAB editor redirect to the source code. It makes the confirming of the messages more complicated. It is recommended to avoid these options. Tip: Please change the waiting options in myerror.m resp. mywarning.m if you prefer a different behavior.
4.5
Generation of application-specific extension packages
Application-specific extension packages can be easily implemented by the function newpackage. It integrates the new package into the graphical user interface (GUI) of SciXMiner. The function is located in the directory \...\application_specials\template and can be started after the start of SciXMiner. The name of the new package is defined by a call of newpackage. Here, blanks and symbols should be avoided. To guarantee valid function names, very long names will be cut to 12 characters. The function generates templates for new menu items and control elements in a new directory. These templates are a starting point for a manual modification. Details are explained as comments in the files. The new package is available after the next SciXMiner start. Packages can be switched off by deactivating of the package in Extras - Choose application-specific extension packages... and finally removed by deleting the directory of the package. Example: The command newpackage(’Diagnosis’,parameter) generates a new directory \...\application_specials\diagnosis
18
Chapter 4. Working with SciXMiner
with functions as e.g. menu_elements_diagnosis.m (Menu items), control_elements_diagnosis.m (Control elements), optionen_felder_diagnosis.m (location of control elements). In addition, the templates for callback functions are can be used for the integration of own functions using any parameter from the control elements or available variables.
4.6
Known errors and problems
The toolbox was tested using Matlab 2017a. However, we may have overlooked one or another bug. To some extent, there arise problems based on Matlab itself. Especially, many problems can be traced back to a missing downward compatibility from Matlab which leads to differences in the syntax of some commands and demands for long-winded compromises. Regarding the activation and deactivation of menu items, we decided to activate some menu items although the recently chosen parameters do not permit the execution of the underlying function. However, in this way the user is enabled to recognize and to correct his mistake. If the menu items remained deactivated until correct parameters are chosen, the user would have to try various combinations without getting an output. Errors in functions are normally caught by separate warning and error messages. Possible Matlab editor settings ”Stop if Error” or ”Stop if Warning” lead the user in the case of warnings or errors to the corresponding source code. For safe use of Matlab, these options are better deactivated. Known bugs and problems can be looked up in detail in Appendix F.
5 Sample projects 5.1 5.1.1
Building data set Introduction
The goal of the Building-data set was to examine the effect of different parameters on the power consumption of a known building [59]. It contains a single example with ten time series (e.g. year, month, day, hour, energy consumption, temperature) and no further features. The time series are recorded for 175 days, 24 measures a day (every hour). With this data set the following topics are addressed: • splitting of time series and manipulation of data sets • usage of macros and plugins • application of cluster algorithms The given problem is the examination and comparison of the power consumption over a day. The subdirectory "prj" of the SciXMiner installation contains the Building data set as a SciXMiner project file (building.prjz).
5.1.2
Preparation of the data set
For the analysis of the power consumption over a day the time series have to be split in several data points, so that only the data of a single day is included in the time series. This is done via Edit - Convert - Separate time series with trigger events.... The time series is split with respect to a given trigger signal. A typical application is the extraction of segments of time series out of long recordings. Examples for trigger events are the occurrence of errors, start of a new measurement or external events. The trigger signal contains only zeros, except the sample points where a trigger event occurs. At these sample points, the amplitude of the trigger signal equals the linguistic term of the output variable. First, since this data set contains no defined trigger events, a trigger signal has to be created. Three different options exist • using a graphical editor for a manual definition by Edit - Generating trigger time series resp. Edit - Edit trigger time series,
20
Chapter 5. Sample projects
• using a macro, or • using a plugin for extraction of features or time series. The result is the same for all approaches: a time series containing values unequal to 0 at trigger events. This time series is called trigger signal. In this project, the trigger events are extracted out of a time series containing the hours of a day. The trigger events are defined as the sample points at which the hour declines from 23 to 0. For the sake of completeness, we consider all three approaches for the extraction of the trigger events:
5.1.2.1
Graphical generation and editing of a trigger time series
A trigger time series can be generated or edited with the window in Fig 5.1. The details are explained in Edit - Generating trigger time series. Fig. 5.1 shows four trigger events for the sample points 23, 47, 71 and 95 with two different classes for the output variable (weekend: 1 and working day: 2). The displayed time series show the ”Hour” and the ”Energy”. The temporal resolution is tuned by the two fields in the lower left corner (left: length of the shown time series segment, here: 110, right: each n-th element is shown, here: 1).
Figure 5.1: Graphical generation and editing of a trigger time series
5.1. Building data set
21
The disadvantage of this methods is very high manual effort for long time series. Consequently, the two following methods are better: 5.1.2.2
Extraction of trigger signal by use of macros
The following code have been created automatically by recording of a macro. The used time series and interval for the extraction are specific for every project. Thus, a macro is generally not usable for different projects. The recording contains the following commands (applied directly in the GUI): • Extras - Record macro... • Edit - Extract - Time series -> Time series, Time series -> Single features... • Selection of time series "Day", interval "Whole time series" and plugin "Velocity (V)". Finish the selection by a click on "OK" • Extras - Stop macro record The content of the macro file is as follows: 2
5
% MAKRO AUSWAHLFENSTER Z e i t r e i h e −> Z e i t r e i h e , Z e i t r e i h e −> E i n z e l m e r k m a l a u s w a h l . gen = [ ] ; a u s w a h l . gen {1}={ ’DAY’ } ; a u s w a h l . gen {2}={ ’ Whole t i m e s e r i e s ( 0 . . . 1 0 0 % ) ’ } ; a u s w a h l . gen {3}={ ’ V e l o c i t y (V) ’ } ; e v a l ( g a i t f i n d o b j _ c a l l b a c k ( ’ MI_Extraktion_ZRZR ’ ) ) ; eval ( get ( figure_handle ( size ( figure_handle ,1) ,1) , ’ callback ’) ) ;
Due to the computation of the velocity in SciXMiner by the formula f 0 (t) =
f (t + 1) − f (t − 1) 2
the trigger signal contains two sample points with values unequal to zero at the trigger events. Thus, the macro has to be expanded by the following code. 2
5
8
11
14
17
% The new t i m e s e r i e s i s t h e l a s t one d a y _ a b l = s q u e e z e ( d _ o r g s ( 1 , : , end ) ) ; % Search f or a l l samples with value unequal to zero i n d x = f i n d ( d a y _ a b l ~= 0 ) ; % Two s u b s e q u e n t s a m p l e s a r e z e r o . The s e c o n d % i s t h e wanted sample . Set t h e f i r s t t o z e r o . d _ o r g s ( 1 , i n d x ( 1 : 2 : end ) , end ) = 0 ; % The f i r s t day i s n o t i d e n t i f i e d by t h i s a p p r o a c h . % Set i t manually : d _ o r g s ( 1 , 1 , end ) = 1 ; % The a m p l i t u d e o f t h e t r i g g e r s i g n a l c o r r e s p o n d s t o t h e % c l a s s o f t h i s t r i a l . Add t e m p o r a r i l y a new c l a s s % c o n t a i n i n g t h e s u b s e q u e n t number o f t h e day : i n d x = f i n d ( s q u e e z e ( d _ o r g s ( 1 , : , end ) ) ~= 0 ) ; d _ o r g s ( 1 , i n d x , end ) = [ 1 : l e n g t h ( i n d x ) ] ; % Clear used v a r i a b l e s c l e a r day_abl indx ;
22
Chapter 5. Sample projects
Applying this macro by Extras - Play macro... leads to a new time series which is called "Day V". The subdirectory "prj" of the SciXMiner installation contains the file of the macro (comments in German) (building_trigger.makrog).
5.1.2.3
Extraction of trigger signal by plugins
A further approach of extracting a trigger signal is the usage of plugins. A plugin is a function which is automatically included in SciXMiner. The related M file has to be in the subdirectory "\plugins\mgenerierung". The code of a plugin for the extraction of the trigger signal is as follows (for a detailed description of plugins refer to Chapter 8): 1
4
7
f u n c t i o n [ datenOut , r e t , i n f o ] = plugin_nsprung ( paras , d a t e n I n ) anz_zr = 1; i n f o = s t r u c t ( ’ b e s c h r e i b u n g ’ , ’ Jump t o z e r o ’ , ’ b e z e i c h n e r ’ , ’ NSprung ’ , ’ a n z _ z r ’ , a n z _ z r , ’ anz_em ’ , 0 , ’ l a e n g e _ z r ’ , p a r a s . p a r . l a e n g e _ z e i t r e i h e , ’ t y p ’ , ’TS ’ ) ; i n f o . einzug_OK = 0 ; info . richtung_entfernen = 0; info . anz_benoetigt_zr = 1; info . explanation = s t r c a t ( ’ set value value = 0 otherwise . ’) ;
= 1 f o r a jump t o z e r o s , and
10
13
i f ( nargin < 2 | isempty ( datenIn ) ) datenOut = [ ] ; ret = []; return ; end ;
16
%d e t e c t z e r o v a l u e s d a t e n O u t . d a t _ z r = ( d a t e n I n . d a t == 0 ) ; 19
%d e t e c t a jump form a non−z e r o v a l u e t o a z e r o v a l u e d a t e n O u t . d a t _ z r ( : , 2 : end , : ) = d a t e n O u t . d a t _ z r ( : , 2 : end , : ) & ( d a t e n I n . d a t ( : , 1 : s i z e ( d a t e n I n . d a t , 2 ) − 1 , : ) ~=0) ; 22
r e t . ungueltig = 0; r e t . b e z e i c h n e r = ’ NSprung ’ ;
A sample of the new time series is zero if the sample of the original time series is zero and the preceding sample of the original time series is unequal to zero. For the extraction of the trigger signal we have to apply the plugin by Edit - Extract - Time series -> Time series, Time series -> Single features... with the selections "Original data (time series)": "Hour", "interval": "Whole time series" and plugin "Jump to zero (NSprung)". This plugin is unable to detect the first day, since there is no "jump" to zero. Thus, the splitting of the time series by usage of the macro leads to one data point more than with extraction by plugin. The subdirectory "prj" of the SciXMiner installation contains the file of the plugin (plugin_nsprung.m). It is automatically detected when a project is loaded.
5.1. Building data set
5.1.2.4
23
Splitting of the time series
After extracting the trigger signal, the project is ready to be converted. This is done by Edit - Convert - Separate time series with trigger events.... The options are set as shown in the following figure (use "Hour NSprung" as time series if the trigger signal is extracted by the plugin).
Figure 5.2: Options for the splitting of time series
If the first option is set to "Workspace" instead of "time series", variables from the workspace can be used as trigger signals. Since the extraction of the single trials should be start exactly at a trigger event and end 23 sample points after the trigger event (resulting in 24 hours after the trigger event), the offset is set to [0, 23]. By clicking on "OK" the project is saved with a new name and loaded automatically. The new project contains the same amount of time series (10), but 175 examples instead of 1 (resp. 174 after extracting the trigger signal by the plugin).
5.1.3
Application of cluster algorithms
In this section the application of clustering is shown. It is applied to the time series "Energy" in the project containing the split time series. If you did not apply the conversion of the time series described in the previous sections please use the project "building_day.prjz", included in the subdirectory "prj" of the SciXMiner installation. In the options window Control elements: Time series: General options the time series "Energy" is selected. The settings for the cluster algorithm are shown in Fig. 5.3. The clustering is started by a click at Data mining - Clustering - Design and apply. If the computation is finished the result can be visualized by View - Clustering - Cluster memberships (sorted by data points). The clusters correspond to weekday (Cluster 2, green), resp. weekend or vacations (Cluster 1, red). The rather long red interval belongs to Christmas time. To visualize the single time series with respect to the cluster membership, the following steps have to be accomplished (as a prerequisite, Control element:
24
Chapter 5. Sample projects
Figure 5.3: Options for the cluster algorithm
Figure 5.4: Results of the cluster algorithm for the time series ”Energy”
Data mining: Clustering - Append cluster as output variable has to be set to "new cluster number"): Set the output variable to the new one created by application of the cluster algorithm (option window Control elements: Time series: General options) and the time series to "Energy". By clicking at View -
5.1. Building data set
25
Time series (TS) - Original time series every example of time series "Energy" is plotted as single curve (cf. Fig. 5.5). The class means of the time series are plotted by clicking at View - Time series (TS) - Mean time series.
Figure 5.5: Visualization of the original data of the time series ”Energy” vs. the cluster membership values
All commands are included in the macro building_cluster.makrog in subdirectory "prj" of the SciXMiner installation.
5.1.4
Time series prediction
In this section the prediction of the energy time series of the building dataset is shown. The used settings for the regression are included in Fig. 5.6. All time series must be selected, including the energy time series! In this example, all selected time series are used for the regression. An example using linear regression coefficients for a feature preselection is shown later using the iris dataset. The samples of the previous day are used as features for the regression (samples k − 24, k − 25, . . . , k − 48). To edit the samples normal Matlab syntax is allowed (e.g. -48:-24 or -72:-24:-168). The sample 0 is automatically removed from the vector to avoid trivial prediction. Necessary settings for the polynomial are the degree (here: 2, Control element: Data mining: Special methods - Polynomial degree) and the maximal number of internal features (here: 4, Control element: Data mining: Special methods - Maximal number of internal features). The maximal number of internal features specifies how many coefficients should be computed by the regression algorithm. A selection of 10 time series and 24 samples leads to a total amount of possible coefficients of 240. In this case, 4 are selected by the regression algorithm.
26
Chapter 5. Sample projects
Figure 5.6: Settings for the regression.
By clicking Data mining - Regression - Design and apply the regression algorithm computes the coefficients and a prediction of the time series. A graphical examination of the result can be obtained by the functions included in View - Regression (see Fig. 5.7 for a scatter plot of the output variable and the estimation).
Figure 5.7: Result of regression.
The scatter plot includes all values of the output variable versus the estimation of the output variable for all samples. A disadvantage of this plot is the lost time information. But since the prediction of the output variable is added as a new time series to the project all build-in visualizations can be used, e.g. the visualization of the original time series versus the predicted time series. To force SciXMiner to plot both time series in the same subplot, the option Control element: View: Time series - Show time series as subplots must be turned off. A section of such a plot is included in Fig. 5.8. By Data mining - Evaluation of time series - Linear regression coefficients (univariate) univariate re-
5.2. Iris data set
27
Figure 5.8: Part of the original time series and predicted time series.
gression coefficients (multivariate is also possible) can be computed and visualized by View - Time series (TS) - Show all feature relevances (sorted table) (sorted by importance). The used sample is enclosed by squared brackets.
5.2
Iris data set
5.2.1
Introduction
The Iris data set (downloadable from UCI-Repository [43]) is one of the most-famous benchmark data sets for the comparison of classifiers. It describes three different irises by means of their petal width and length and sepal width and length. The data set contains 150 examples of three different irises, every single iris is represented by 50 examples [5]. It is used to show the application of classifiers to a data set containing single features.
5.2.2
Classification
Since the data set contains no different examples for design and validation of the classifiers all examples are used for both phases of classification. First, all examples are chosen by clicking on Edit - Select - All data points. Single classes are selectable by clicking on Edit - Select - Data points using classes ..., e.g. to select examples for the design of the classifier. For this example, the parameters have been set as shown in figure 5.9 (Control elements: Data mining: Classification of single features): The selected parameters of the classifier are the default values for the Bayes classifier (Metric: Tatsuoka distance, no use of a-priori probabilities). To change these settings select the options window Control elements: Data mining: Special methods. The Tatsuoka distance is an internal notion of class-specific distances comparable to the Mahalanobis distance. The means and covariance matrices are approximated separately for every single class.
28
Chapter 5. Sample projects
Figure 5.9: Options of the classifier for the Iris data set
By a click on Data mining - Classification - Design and apply the design of the selected classifier with respect to the currently selected examples is started and afterwards applied to the selected examples. The separate design and application of the classifier is done by Data mining - Classification - Design and Data mining - Classification - Apply respectively. The classification result is displayed on the Matlab command window, independently from the dimension of the feature space: Apply classifier ... 150 data points 2 features ... Complete ... Analyze classification result ... Number of misclassifications: 7 of 150 examples ( 4.67 %) Confusion matrix (Rows: True class assignments, columns: Result of classification): 50 0 0 0 47 3 0 4 46 Complete ...
A graphical visualization of the classification result is only possible for features spaces with dimensions less or equal to three. The settings for the graphical visualization of the classification result are made in the options window Control elements: View: Classification and regression. For the following visualization, the settings from Figure 5.10 are selected. ”DS-No. misclassification” means, that the examples are colored with respect to their real class membership and misclassified examples are marked by their number (see Figure 5.11). For the visualization in Figure 5.11 the menu item View - Classification - 2D classification with covariance matrixes was used. This visualization is only available after application of a Bayes classifier, due to
5.2. Iris data set
29
Figure 5.10: Options for the visualization of the classification results
Figure 5.11: Classification result for the Iris data set with two features and a Bayes classifier
the need of covariance matrices. For Support Vector Machines, the used support vectors can be displayed by clicking on View - Classification - 2D plot classifier with support vectors. Generally, the visualization of the classification result is done by View - Classification - Result.
5.2.3
Regression
This section contains a brief description of the application of regression algorithms to projects containing single features. To select all data tupels, use Edit - Select - All data points. Then, set the settings for the regression as shown in picture 5.12. The iris dataset contains only single features (no time series), thus time series can not be selected as input feature type. The feature selection should be done by multivariate regression coefficients, the number of features to be selected must be set in Control element: Data mining: Regression - Number of selected features. As an alternative, the feature selection could be done manually by setting the number of features (in Control element: Data mining: Classification of single features - Number of selected features) and a feature selection e.g. by using Data mining - Selection and evaluation of single features - MANOVA, multivariate. In this case, the features selection must be set to "selected features" for the regression. The output variable of the regression is set to "petal width" the type of the regression is set to "polynom". The parameter for the polynomial are to be set in Control elements: Data mining: Special methods. In
30
Chapter 5. Sample projects
Figure 5.12: Settings for the regression.
this example the degree of the polynomial is set to 1 and the maximal number of internal features to 4 (see the example using the building dataset for a description of this option). The design and application of the regression is started by Data mining - Regression - Design and apply. After exiting the algorithm the command window contains: Fitness of regression: Mean absolute value: 0.154808 Correlation coefficient between true value and estimation: 0.964228 to give a first impression of the regression’s quality. The estimation of the feature "petal width" has been added as a new feature. Make sure that you exclude the estimated feature from the list of used features for further regressions. Select a feature selection method including "selected features" in the description. (e.g.. "linear regression coefficients (multivariat, selected features)"). The output variable is automatically removed from the list of used features, but not estimations of the output variable. More detailed information about the regression’s quality can be obtained by the functions in View Regression, e.g. the real value versus the estimated value, see picture 5.13 and the coefficients of the polynomial model. The used polynomial is: petal width = −0.722 + 0.427 · petal length
(5.1)
+ 0.103 · sepal width An examination of single regression coefficients is possible via Data mining - Selection and evaluation of single features - Linear regression coefficients (univariate) (visualization of the result by View - Single features - Show feature relevances (sorted table)).
5.2. Iris data set
31
Figure 5.13: Result of the regression of ”petal width”.
6 Menu items 6.1
Menu items ’File’
This point includes all file operations.
6.1.1
Load project
A SciXMiner project file *.prjz will be loaded and default values are added. Necessary variables are ”d_org” or ”d_orgs”. In addition, the variables ”code”, ”code_alle”, ”dorgbez”, ”var_bez”, ”zgf_y_bez”, ”bez_code”, ”optionen”, ”projekt”, ”interpret_merk” are read.
6.1.2
Save project
saves the recent SciXMiner project *.prjz using the same file name. This function saves the data set (but without analysis results as designed classifiers) and optionally the current settings of the control elements (if chosen in Control elements: General options).
6.1.3
Save project as...
saves the SciXMiner project file *.prjz with a new name (see File - Save project).
6.1.4
Mean value project (based on the selected output variable)
generates a new SciXMiner project with averaged values for all linguistic terms of the selected output variable. In the new project, only one data point per linguistic term exists.
6.1.5
Export data
exports time series or single features in an ASCII file. The separators for columns and decimal numbers can be selected in the opened configuration window. • Time series in multiple files...: The time series of the given project (variable ”d_orgs”) will be exported into different files. We assume at least one output variable. If more output variables exist, the first (n-1) output variables 32
6.1. Menu items ’File’
33
build a directory structure, the information about the n-th output variable is encoded in the file name. Alternatively, all n output variables can be encoded in the file name if the option ”Separator for output variables in file name” is chosen. • Single features in a file...: The single feature of the given project (variable ”d_org”) will be exported as file (all data points in one file).
6.1.6
Import data
includes all functions for the import of data from files. • From a directory...: imports data from a directory structure. Its definition is explained in Section 4.2 and for the menu item File - Export data - Single features in a file.... The parallel import of single features and time series is impossible. Output variables should be included as single features in the file and can converted after import using Edit - Convert - Selected output variable → Single feature. Some import versions support more complex data formats including strings (see Section 4.2 ”Import and export of projects” in the SciXMiner documentation). Such strings are converted in output variables. • From a file...: imports data from a file. The filenames encode the output classes. The parallel import of single features and time series is impossible. Output variables should be included as single features in the file and can converted after import using Edit - Convert - Selected output variable → Single feature. Some import versions support more complex data formats including strings (see Section 4.2 ”Import and export of projects” in the SciXMiner documentation). Such strings are converted in output variables. • Interactive from a file: imports data with the MATLAB Import Wizard. • Import of time series names from file: imports identifiers for time series from a file. It is expected that exactly one identifier exists for every time series. The identifiers could either be separated by line breaks (i.e. one identifier per row) or by a separating character (i.e. tabulator, comma, or semicolon). • Import of single feature names from file: see File - Import data - Import of time series names from file, but for single features instead of time series.
6.1.7
Fusion of projects
contains functions for the fusion of existing SciXMiner projects to one joint project called fusion.prjz. It uses all projects from a directory selected by a configuration window. Incompatible projects will be ignored. Four different types are available.
34
Chapter 6. Menu items
• Additional time series and single features: fuses data from all SciXMiner projects in a directory by adding the data as new time series and single features. The number of data points, the length of time series, and the number and values of output variables must be identical for all projects. Example: SciXMiner-Projekt a.prjz with 5 data points, 2 time series, 1 single feature, and 1 output variable SciXMiner-Projekt b.prjz with 5 data points, 2 time series, 1 single feature, and 1 output variable SciXMiner-Projekt fusion.prjz with 5 data points, 4 time series, 2 single feature, and 1 output variable • Additional data points: fuses data from all SciXMiner projects in a directory by adding the data as new data points. The number and names of single features, time series and output variables and the length of time series must be identical for all projects. Linguistic terms of the output variable are matched by their names. Example: SciXMiner-Projekt a.prjz with 5 data points, 2 time series, 1 single feature, and 1 output variable SciXMiner-Projekt b.prjz with 5 data points, 2 time series, 1 single feature, and 1 output variable SciXMiner-Projekt fusion.prjz with 10 data points, 2 time series, 1 single feature, and 1 output variable • Additional time series and single features (tolerant for the selected output variable and data points, NaNs are deleted): like File - Fusion of projects - Additional time series and single features, but more tolerant to differences between data points. The values of the selected output variable of the selected data points (e.g. an ID resp. identifier) in the open project are used as the base for the fusion. Each data point will be deleted if the corresponding data points in the other project for the fusion cannot be found. Non selected data points are not used for fusion. • Additional time series and single features (tolerant for the selected output variable and data points, NaNs are retained): like File - Fusion of projects - Additional time series and single features, but more tolerant to differences between data points. The values of the selected output variable of the selected data points (e.g. an ID resp. identifier) in the open project are used as the base for the fusion. The fused time series resp. single features of each data point are set to NaN if the corresponding data points in the other project for the fusion cannot be found. Non selected data points are not used for fusion. • Additional events, event types and data points:
6.1.8
Apply SciXMiner batch file
executes a SciXMiner batch file with the extension *.batch. It can include one or more projects or even directories containing projects. Optionally, a file with a list of control elements with the extension *.uihdg is loaded by File - Options - Load options. For each of these projects, a list of macros is executed. A recursive definition with other batch projects is possible.
6.1. Menu items ’File’
6.1.9
35
Apply SciXMiner batch file (debug mode)
like File - Apply SciXMiner batch file, but with a stop after errors and warnings. This option is useful for debugging SciXMiner batch files. After a stop, the processing can be continued by return.
6.1.10
Apply SciXMiner batch file (step and debug mode)
like File - Apply SciXMiner batch file (debug mode), but with an additional step-wise execution of each macro in a SciXMiner batch file (continue with return).
6.1.11
Normative data
contains all operation for the handling of normative data. Examples for normative data are measurements of healthy people in medical data analysis or a desired process behavior for technical diagnosis. Normative data are defined by mean value and standard deviations for all time series and single features. They can be used for a comparison to a freely definable reference (e.g. for a typical behavior of a plant). • Load normative data: loads normative data (mean and standard deviation) for time series and single features from a ’*.norm’ file. • Save normative data: saves normative data (mean values and standard deviations) for time series and single features into a ’*.norm’ file. In detail, the variables ”dorgbez”, ”mstd”, ”mstd_em”, ”my”, ”my_em”, ”parameter”, ”titelzeile”, ”var_bez” will be saved. This function requires an executing of File Normative data - Mean value to normative data for the generation of normative data. • Mean value to normative data: uses the recent data selection for the generation of normative data. Therefore, only one class (= linguistic value for the output variable) has to be selected (e.g. in medicine: healthy people, for technical applications: error-free and normal behavior of a process or device).
6.1.12
Data mining
This menu item contains functions for loading and saving of parameters from designed data mining systems. • Load fuzzy system: loads a designed fuzzy system from a file with the extension ”*.fuzzy”. The assignment of input (single features) and output variables is based on the variable names. The file must contain the variables ”gaitcad_struct”, ”merkmale_projekt”, and ”mode”. The use of files from other projects gives misleading results, especially in case of identical variable names. The loaded fuzzy system is not yet directly usable as a fuzzy classifier. This application requires an export by Data mining - Fuzzy systems - Export fuzzy system to classifier.
36
Chapter 6. Menu items
• Load fuzzy system (only membership functions): loads only the membership functions of a pre-designed fuzzy system in a file and sets Control element: Data mining: Special methods - Type of membership function to ”Fix”. • Save fuzzy system: exports a designed fuzzy system in a file. The results are saved in the variables ”gaitcad_struct”, ”merkmale_projekt”, and ”mode”. • Export ANSI-C-Code fuzzy rulebase: exports the recent fuzzy rulebase in a C file. This C file needs a pointer to a vector x containing the selected input variables (single features) and to a pointer of membership values of the output variable. The numbers of the input variables are explained in the function header. The output of the function is the linguistic term of the output variable. The feature numbers start with x[1] instead of x[0]! • Load classifier: loads a designed classifier from a file with the extension ”*.class”. It contains all settings specified in Control elements: Data mining: Classification of single features and Control elements: Data mining: Special methods during the design. The assignment of input (single features) and output variables is based on the variable names. The file must contain the variables ”gaitcad_struct”, ”merkmale_projekt”, and ”mode”. The use of files from other projects might give misleading results, especially in case of identical variable names. • Save classifier: exports a designed classifier in a file. The results are saved in the variables ”gaitcad_struct”, ”merkmale_projekt”, and ”mode”. They contain all settings defined by the parameters in Control elements: Data mining: Classification of single features and Control elements: Data mining: Special methods. • Export ANSI C Code of the Bayes classifier: exports the recent Bayes classifier with feature selection and feature transformation into an ANSI C file. • Load regression model: loads a designed regression model from a file with the extension ”*.regression”. It contains all steps specified by Control elements: Data mining: Regression and Control elements: Data mining: Special methods during the design. The assignment of input (single features) and output variables is based on the variable names. The file must contain the variables ”gaitcad_struct”, ”merkmale_projekt”, and ”mode”. The use of files from other projects might give misleading results, especially in case of identical variable names. • Save regression model: exports a designed regression model in a file. The results are saved in the variables ”gaitcad_struct”, ”merkmale_projekt”, and ”mode”. They contain all steps defined by the parameters in Control elements: Data mining: Regression and Control elements: Data mining: Special methods.
6.1.13
Options
contains all functions for loading and saving SciXMiner options.
6.2. Menu items ’Edit’
37
• Load options: restores all options for the control elements as defined in the loaded option file with extension *.uihdg. • Save options: saves all options for the control elements and the command lines of the plugins into an option file with extension *.uihdg. • Save standard options: saves all options for the control elements and the command lines of the plugins into an option file with extension standard_options.uihdg. This file will be loaded at each SciXMiner start. • Load frequency list: loads a MATLAB file for the definition of frequency regions and overtones.
6.1.14
Exit
exits the application.
6.2
Menu items ’Edit’
contains all functions to edit a data set. It includes the selection of data points, time series and single features, the extraction of new single features from time series or other single features, several conversions, functions for deletion and operations for a data preprocessing.
6.2.1
Select
contains functions to select data points, single features and time series. • All data points: selects all data points and removes any chosen selection of data points. • Data points using classes ...: performs a selection of data points using a conjunction and disjunction of linguistic terms of output variables. It includes 1. a disjunction of all selected terms of one output variable and 2. a conjunction of the so selected data points for all output variables. A selection of ’ALL’ means that no data point is excluded due to its value for this output variable. The result should be evaluated using View - Classes for selected data points. • Data points using numbers ...: enables a manual selection of data points using its numbers. • Data point from GUI: selects the data points defined by Control element: General options - Manual selection of data points. This function is especially useful if the data point numbers for a desired selection are known.
38
Chapter 6. Menu items
• Random data points (defined percentage of selected data points): selects a pre-defined percentage of the selected data points by chance. The percentage value is defined by Control element: General options - Percent for selection. • Data points via most frequent terms: selects all data points belonging to frequent terms for the selected output variable. The minimal number of data points is defined by Control element: Data preprocessing - Minimal number of data points in one class. Example: 100 data points for o.k., 50 data points for Error Type A, 2 data points for Error Type B; Parameter 10; Selection of 150 data points for o.k. and Error Type A • Data points via values of single features: selects all selected data points with logical true values in Control element: Data preprocessing - Feature values for selection for the first selected single features. Multiple queries have to be executed step by step. Example for the selection of all values between 5 and 10 for a single features: 1. Select single feature, 2. Write in Control element: Data preprocessing - Feature values for selection ”>5”, 3. Execute Edit - Select - Data points via values of single features, 4. Write in Control element: Data preprocessing - Feature values for selection ”5 data points in each cell of the cross tabulation. Otherwise for cross tabulations with only two values 0 and 1, the (more conservative) Two-tail Exact Fisher Test is used in the implementation of [108] (function ”fisherextest”). A method for the correction of multiple tests can be defined by Control element: Data mining: Statistical options - Bonferroni correction.
6.4.4
Classification
contains all functions for a complete classification run based on single features (incl. feature selection and aggregation). • Design: trains a classifier based on the selected data points. The output variable for the supervised classification is defined by Control element: Time series: General options - Selection of output variable (also found in other windows, see e.g. Control elements: Data mining: Classification of single features). This run includes all steps defined by Control elements: Data mining: Classification of single features (optional feature selection, normalization, feature aggregation, normalization of aggregated features, and classification itself). The run is defined by all parameters from Control elements: Data mining: Classification of single features and Control elements: Data mining: Special methods. • Apply: applies a classifier design by Data mining - Classification - Design to all selected data points. This application includes all designed steps for feature selection, normalization, feature aggregation, normalization of aggregated features, and the classification itself. • Design and apply: performs a subsequent processing of Data mining - Classification - Design and Data mining Classification - Apply.
6.4.5
Time series classification
contains all functions to classify time series. • Design: designs a time series classifier using the parameters in Control elements: Data mining: Classification of time series. The different classifier types are described in [22]. The detailed parameters for the classifiers are defined by Control elements: Data mining: Special methods. • Apply: applies a classifier designed by Data mining - Time series classification - Design to the selected data points. • Design and apply: performs a subsequent processing of Data mining - Time series classification - Design and Data mining - Time series classification - Apply.
66
Chapter 6. Menu items
• Time aggregation: aggregates classifier decisions over the time using the filter parameters in (Control element: Data mining: Classification of time series - Filtering of results) resulting in modified classifier decisions. • Time aggregation with result plot: like Data mining - Time series classification - Time aggregation, but with an additional plot of the results.
6.4.6
Hierarchical Bayes classifier
contains functions for the design and application of hierarchical Bayes classifiers. • Design: designs a Hierarchical Bayes classifier by a step-wise separation of single classes from all other classes [87]. The maximum number of selected and aggregated features are defined by (Control element: Data mining: Classification of single features - Number of selected features) resp. Control element: Data mining: Classification of single features - Number of aggregated features. The feature aggregation is done by a Discriminant Analysis with optimization. This function always uses a Bayes classifier. • Apply: applies a classifier designed by Data mining - Hierarchical Bayes classifier - Design to all selected data points. • Design and apply: performs a subsequent processing of Data mining - Hierarchical Bayes classifier - Design and Data mining - Hierarchical Bayes classifier - Apply.
6.4.7
Fuzzy systems
contain all functions for the design and application of fuzzy systems. The design algorithms are described in [76]. • Design (single rules): searches for relevant fuzzy rules using only the selected single features and the selected output variable. This design does not consider the cooperation of the designed rules in a rule base (e.g. to avoid redundancies). Preexisting rules will be deleted. • Design (rule base): searches for a relevant fuzzy rule base using only the selected single features and the selected output variable. This design searches in first step for single rules and collects a small set of cooperating rules by an optimization. The evaluation measure prefers rules without redundancies and a complete coverage of the input space. Preexisting rules will be deleted. • Delete rules: open a window to delete fuzzy rules manually.
6.4. Menu items ’Data mining’
67
• Design membership functions for single features: designs membership functions for all single features using the method specified by Control element: Data mining: Special methods - Type of membership function. • Export fuzzy system to classifier: exports a designed fuzzy system as classifier. A design by Data mining - Fuzzy systems - Design (rule base) corresponds to a classifier design using the selected features without an aggregation. A design by Data mining - Fuzzy systems - Design (single rules) is also possible, but it leads in many cases to bad results due to redundant rules and missing priorities of good single rules. • Import fuzzy system from classifier: imports a fuzzy system from a designed fuzzy classifier. This function is only available if ”fuzzy classifier” was chosen in Control element: Data mining: Classification of time series - Classifier type during last design. It is useful to list and to visualize fuzzy rules from classifiers (see also View - Fuzzy systems). • Import fuzzy system from regression model: imports a fuzzy system from a regression model designed by Data mining - Regression - Design resp. Data mining - Regression - Design and apply. Before designing, ”Fuzzy system” has to be selected in Control element: Data mining: Regression - Type.
6.4.8
Clustering
contains all functions for the design and application of clusters. • Design and apply: contains different methods to search for subgroups with fuzzy cluster methods (FCM) for the selected time series and resp. or single features (see e.g. [64]). The design methods use only the selected data points. The application for the cluster assignment is done for all data points. The necessary parameters and methods as well as the options for the conversion of clusters into new output variables are defined in Control elements: Data mining: Clustering. Here, own clustering functions are applied. • Design and apply (Statistic Toolbox): computes clusters for the selected single features and resp. or time series. The necessary parameters and methods as well as the options for the conversion of clusters into new output variables are defined in Control elements: Data mining: Clustering. In contrast to Data mining - Clustering - Design and apply, the crisp and hierarchical cluster algorithms of the Statistic Toolbox of Matlab (e.g. ”pdist”, ”linkage” and ”cluster”) are used. A detailed description can be found in the handbook of this toolbox.
6.4.9
Association analysis
performs an Association analysis for all output variables. Here, an implementation of Narine Manukyan was integrated. The results are saved as file. If this analysis should include single features, these single features have to be converted to output variables by Edit - Convert - Selected single features → Output variables.
68
Chapter 6. Menu items
Output variables with too many linguistic terms will be ignored, the maximum of term numbers is defined by Control element: Data mining: Special methods - Ignore output variables with many terms. Only rules with a minimum confidence and support are shown (Definition in Control element: Data mining: Special methods - Minimum confidence resp. Control element: Data mining: Special methods - Minimum support).
6.4.10
Self Organizing Maps
contains the functions for the design and application of Self Organizing Maps. Here, the function selforgmap.m from MATLAB Neural Network Toolbox is used. • Design: designs Self Organizing Maps for all selected single features with the function selforgmap.m from MATLAB Neural Network Toolbox. The dimensionality is defined by Control element: Data mining: Special methods - Dimension, the number of neurons per dimension by Control element: Data mining: Special methods - Number of neurons and the number of training epochs by Control element: Data mining: Special methods - Number of learning epochs. • Apply: applies a Self Organizing Map designed by Data mining - Self Organizing Maps - Design to the selected data points. A new output variable with the number of winner neurons in the terms is generated.
6.4.11
Regression
contains all functions for the design and application of regression models. • Design: designs a regression model using the selected data points and the parameters chosen in Control elements: Data mining: Regression. The related options (regression of time series or single features, feature selection and aggregation, normalization, regression method) are chosen in Control elements: Data mining: Regression. The methods can be selected and parameterized using Control elements: Data mining: Special methods. • Apply: applies the recent regression model to the selected data points. The recent model results from the last design step or a loaded regression model. Hereby, all related operations (regression of time series or single features, feature selection, and aggregation, normalization, regression method) are executed. • Design and apply: performs a subsequent processing of Data mining - Regression - Design and Data mining - Regression - Apply.
6.4. Menu items ’Data mining’
6.4.12
69
Validation
validates the classification of single features and time series. • Classification of single features: validates classifiers. Possible validation strategies are a cross-validation (with diverse subtypes) and a bootstrap method (selection by Control element: Data mining: Validation - Validation strategy). The menu item Data mining - Classification - Design is performed for each produced training data set using the defined options. The resulting classifier is applied for each validation data set by means of Data mining - Classification - Apply. The results are aggregated and written into protocol files. • Classification of single features (selected macros): similar to Data mining - Validation - Classification of single features but with macros for classifier design and application instead of the corresponding menu items. The macros are defined by a configuration window or by the values of the variables ”makro_lern” (design) resp. ”makro_test” (application) for a script-based technique. • Hierarchical Bayes Classifier for single features: similar to Data mining - Validation - Classification of single features but for Hierarchical Bayes classifiers designed by Data mining - Hierarchical Bayes classifier - Design. • Time series classification: see Data mining - Validation - Time series classification (selected macros). Here, the design and application of the time series classifiers are executed. A selection of user-defined macros is not possible. • Time series classification (selected macros): validates time series classifiers. Two macros are executed for the classifier design and its application. Both macros are selected by a configuration window. Different types of cross-validation and bootstrap are available as validation strategies. The parameters are tuned by Control elements: Data mining: Validation. The results are separately computed for each trial. In addition, the mean value and the standard deviation for all trials are shown. For the cross-validation of time series, a variable zr_fehl_proz is introduced in the struct relevanz_cv_alle. It contains the classification error vs. time. The mean value and the standard deviation is defined by the minimum error of each trial. • Regression: see Data mining - Validation - Regression (own macros). Here, the design and application of the regression models are executed using the standard macros ”regr_em_en.makrog” (design) and ”regr_em_an.makrog” (application). A selection of user-defined macros is not possible. • Regression (own macros): validates regression models. Two macros are executed for the regression model design and its application. Each macro is selected by a configuration window. Different types of cross-validation and bootstrap are available as validation strategies. The parameters are tuned by Control elements: Data mining: Validation. The results (regression error and (Pearson) correlation coefficient) are separately computed for each trial. In addition, the mean value and the standard deviation for all trials are shown.
70
6.5
Chapter 6. Menu items
Menu items ’Extras’
contains all functions to work with macros and for the administration of application-specific extension packages.
6.5.1
Play macro...
loads and runs a recorded macro. If an error message about a missing macro in the search path occurs, possible reasons are deleted macros or errors during the last macro run. In latter case, the use of Extras Reset macro names might help.
6.5.2
Play macro (debug mode)...
executes a macro in debug mode. The selected macro is copied into a m-file called ”makro_m_file.m” and it is started. With this option, the complete debugging functionality MATLAB is available. After a new start, SciXMiner checks if ”makro_m_file.m” was changed manually. If yes, it asks if these changes should be transferred also to the macro.
6.5.3
Record macro...
records a sequence of clicked menu items and control elements as macro file *.makrog. A manual modification of this file is possible due to its textual Matlab syntax. The macro name is defined by an additional window. The background of the SciXMiner window is yellow during recording. All menu items are executed in parallel. The recording is stopped by Extras - Stop macro record. Some functions (especially file operations) are not available during macro recording. They can be added manually by using the related callbacks from the file menu_elements.m. A critical evaluation of the recorded macros is strongly recommended especially for complex tasks. A modified assignment of plotted figures (e.g. to plot multiple figures into subplots instead of separate windows) is possible by Control element: General options - For macros: plot always in current figure. Such commands (e.g. subplot) should be placed directly before the menu item in the macro to avoid a plot into wrong figures (especially in the SciXMiner main window).
6.5.4
Stop macro record
terminates the record of a macro.
6.5.5
Edit macro...
opens an existing macro in an editor window for a manual modification.
6.5.6
Reset macro names
resets the names of the recent macro in the Matlab workspace. This function is important after an occurring error during the macro execution. Otherwise, problems during the execution of different macros are possible.
6.5. Menu items ’Extras’
6.5.7
71
Execute M-file...
executes a M file.
6.5.8
Edit M-file...
opens an existing M-file in an editor window for a manual modification.
6.5.9
Edit SciXMiner batch file ...
opens an existing SciXMiner batch file in an editor window for a manual modification.
6.5.10
Generate PDF project report (needs Latex)
generates PDF reports using Latex for the given project or all projects within a directory. Latex must be installed and the functions texify and dvipdfm must be found in the Windows search path. The function generates a subdirectory ”report” in the recent working directory. Here, all new or modified files for the project report are saved. The title page is generated from the Latex file ”reporttemplate.tex”, located in the directory ”standardmakros” of SciXMiner. It can be modified for individual needs. Only for the first report, the template content is copied to a new file ”project_results_*.*” in the ”report” directory. After this, it can be also modified to individual needs only for this project or directory. The following contents are added if they exist: Once per PDF: 1. File ”general_comments.tex”. Here, all project related metadata can be added (e.g. experiment planning). 2. Error protocol ”error.log”. 3. All jpeg images located in a subdirectory ”images”. Once per project: 1. All jpeg image generated by SciXMiner for a project. 2. All Latex files generated by SciXMiner for a project. Here, only the parts between the begin and the end of the document are used. Optional sections SciXMiner parameters are removed starting from the first subsection{Parameter}. All modified files (and only these, not the images and unmodified Latex files) are written in the subdirectory ”report”. They should not be modified manually to an overwriting by the next generation of a project report. • for the current project: generated the PDF project report only for the recent project. • for all projects in the directory: generated the PDF project report for all projects in the recent directory. The different projects are included as sections. The name of the report is set to the name of the directory.
72
Chapter 6. Menu items
6.5.11
Translate German Gait-CAD m-files and macros into English
this menu item supports the translation of German Gait-CAD m-files and macros into English. It converts strings in all macros and m-files of a chosen directory using a dictionary. The related directory and a further directory for a safety copy are selected by a separate window.
6.5.12
Choose application-specific extension packages...
switch packages with application-specific extensions on or off. This selection will be done after the next SciXMiner start. At the moment, the extension packages ”Peptides”, ”Images and Videos” and ”Tracking” are available. The beta versions of the extension packages ”Gait analysis” and ”Text mining” are available on request.
6.5.13
Search path for m-files and plugins
adds a directory to the MATLAB search path to use m-files and plugins in this directory in SciXMiner. • Permanent: adds a directory permanently to the MATLAB search path to use m-files and plugins in this directory in SciXMiner. This information is saved in read_gaitcad_searchpath.m. • Temporary for the session: adds a directory for the recent SciXMiner session to the MATLAB search path to use m-files and plugins in this directory in SciXMiner. • Reset (permanent search path): resets the permanent search path, that was added by Extras - Search path for m-files and plugins Permanent and saved in read_gaitcad_searchpath.m. • Reset (only temporarily for the session): resets the search path for the SciXMiner session, that was defined by Extras - Search path for m-files and plugins - Temporary for the session.
6.5.14
Matlab Parallel
controls the use of configurations of the MATLAB Parallel Computing Toolbox. • Start: starts the use of the selected configuration of the MATLAB Parallel Computing Toolbox. Here, the configuration with the name defined by Control element: General options - Configuration name for MATLAB parallel is used (see also Parallel - Manage Configurations in the menu of the MATLAB command window). • Stop: stops the use of the recent configuration of the MATLAB Parallel Computing Toolbox.
6.6. Menu items ’Favorites’
6.6
73
Menu items ’Favorites’
contains all functions for a fast access to frequently used or user-defined menu points and macros. All deactivated entries (e.g. due to missing single features) are shown with a light gray color.
6.6.1
Edit user-defined favorites
opens a configuration window to add and delete menu points from the favorite list.
6.6.2
Delete all favorites
deletes all favorites.
6.7
Menu items ’Window’
activates or closes all open Matlab figures except the SciXMiner main window.
6.7.1
Close figures
closes all figure except the SciXMiner main window.
6.7.2
Arrange figures
contains different options for the placement of figures. • Horizontal: places all figures horizontally. • Vertical: places all figures vertically. • Cascade: places all figures as a cascade. • Position of the current figure: places all figures to the position of the last opened figure. This command is especially useful for the comparison of figures with small differences by switching between figures with the same size and position.
74
Chapter 6. Menu items
6.7.3
Logarithmic scaling of current figures
applies a logarithmic scale to all open MATLAB figures. • only x axis: applies a logarithmic scale to the x-axis of all open MATLAB figures. • only y-axis: applies a logarithmic scale to the y-axis of all open MATLAB figures. • x- and y axis: applies a logarithmic scale to the x- and the y-axis of all open MATLAB figures.
6.7.4
Remove Latex codes in MATLAB figures
removes Latex-style variables interpreted as equation (e.g. x1 instead of x_1) from all open MATLAB figures.
6.7.5
Update font and font size in figures
sets font type and size in all open MATLAB figures to the values defined by Control element: View: Single features - Font and Control element: View: Single features - Font size.
6.7.6
Plot all figures as images in files
plots the content of all figures in files. The filename is generated from the project and the figure name. The file type is defined by Control element: General options - File type for images. The image in the file depends on the size on the monitor.
6.8
Menu items ’Help’
contains SciXMiner version and license information as well as SciXMiner handbooks.
6.8.1
Show SciXMiner documentation (PDF)
opens the SciXMiner handbook and help file as PDF.
6.8.2
About SciXMiner
contains the version information and the contact address to the developer team.
6.8.3
License information
shows the license file for the GNU licence.
7 Control elements 7.1
Control elements for ’Project overview’
Figure 7.1: Control elements for Project overview - Show menu tips
75
76
Chapter 7. Control elements
7.2
Control elements for ’Time series: General options’
Figure 7.2: Control elements for Time series: General options
• Selection of output variable: selects an output variable. This selection influences many functions as the evaluation of single features and time series, the design of classifiers, almost all visualization functions etc. • Sampling frequency of time series: defines the sampling frequency for the time series in the data set. It is assumed that this value is equal for all time series. The parameter mainly influences the visualization of time series using time or frequency. • Unit: defines the physical quantity for time series (e.g. sampling frequency in kHz, per day etc.). The parameter mainly influences the visualization of time series or spectrograms using time or frequency. • Selection of time series (TS): selects time series for visualization and all following processing steps. The selection can be done by mouse clicks in the listbox, by writing the numbers in the edit field on the left hand side or by the ’ALL’ button to select all time series. The different fields will be synchronized after the input. TIP: An input in the edit field enables a selection with a different order (e.g. 2-4-1 for a visualization) in contrast to the listbox.
7.2. Control elements for ’Time series: General options’
77
• Complete time series: selects all sample points of the time series. • Time series segment from: defines the begin of a time series segment for the visualization of sample points. This parameter might also defined by a zooming in a time series visualization (View - Time series (TS)) and pushing the button ”Select time series segment” in the menu bar. The begin is the left limit of the current x-axis. The button ”Complete time series” set the time series segment to all sample points. • to: defines the end of a time series segment for the visualization of sample points. This parameter might also defined by a zooming in a time series visualization (View - Time series (TS)) and pushing the button ”Select time series segment” in the menu bar. The end is the right limit of the current x-axis. The button ”Complete time series” set the time series segment to all sample points. • Forbid segments of length 1: forbid time series segments of length 1. This option is almost always useful except some special cases for feature extraction.
78
Chapter 7. Control elements
7.3
Control elements for ’Time series: Extraction - Parameters’
Figure 7.3: Control elements for Time series: Extraction - Parameters
• Data-dependent feature extraction in plugins: defines the handling of plugins with data-dependent transformation functions (and not only datadependent output variables for time series and single features!). Typical examples are a transformation matrix for a Principal Component Analysis or fuzzy membership functions. Possible options are a computation with and without saving the results into a *.plugpar file with the same project name or a loading from these file. By loading, the name of the time series, the plugin description, and the segments must be the same. The handling has to be separately implemented for each plugin! • Sample point for Time series→Single feature: select the sample point for all functions using only one sample point for a conversion from time series to single features. • Parameter IIR filter: defines the filter parameter a for an Infinite-Impulse-Response (IIR) filter. The filter is a first-order lowpass with xf [k + 1] = a ∗ xf [k] + (1 − a) ∗ x[k]. The parameter defines the influence of old values. A higher value leads to a slower behavior due to a higher weighting of past values. Some functions and plugins for the feature extraction use this parameter. For stability reasons, the value is limited to [0, 1].
7.3. Control elements for ’Time series: Extraction - Parameters’
79
• IIR parameter (aF, aS, aSigma): defines the parameters for three different IIR filters for trend and standard deviation computation (see [90]). • Filter order (FIL): defines the order of the filter for feature extraction. • High-: switches to a high-pass filter for feature extraction. • Low-: switches to a low-pass filter for feature extraction. • Bandpass: switches to a band-pass filter for feature extraction. • Frequencies (FIL, Morlet spectrogram): defines the cutoff frequencies for different filters. The parameter is used for a Butterworth filter in feature extraction and for Morlet spectrograms. A high-pass filter and a low-pass filter use only the first value, whereas the band-pass filter uses both values. • Wavelet: selects the wavelet type for a wavelet decomposition (see e.g. [63] or the documentation of the Matlab Wavelet Toolbox). • Matlab wavelet decomposition: uses the Matlab implementation instead of the implementation of [63] for the wavelet decomposition. It requires the Matlab Wavelet Toolbox, but it is faster especially in case of many data points and long time series. • Wavelets: number of levels: defines the number of levels for a wavelet decomposition. It computes for the half of the sampling frequency fA an high-pass filter and a low-pass filter. The high-pass in level i has a cutoff frequency of (i = 1, . . .) with fA . 2i+1 The cut-off frequency for the low-pass filter is computed accordingly. • Morlet wavelet: frequency: defines the frequency for the generation of new time series by means of complex Morlet wavelets. This frequency describes the center of the frequency range which will not be damped by the wavelet. The width of this range is defined by the eigenfrequency of the Morlet wavelet (Control element: Time series: Extraction - Parameters - Morlet wavelet: eigenfrequency). For the computation of Morlet spectrograms, the parameter from Control element: Time series: Extraction - Parameters - Frequencies (FIL, Morlet spectrogram) is used instead of this parameter. • Causal Morlet wavelet: temporal shift the complex Morlet wavelet for a causal filtering. In addition, the wavelet will be limited in time. • Morlet wavelet: eigenfrequency: see Control element: Time series: Extraction - Parameters - Morlet wavelet: frequency.
80
Chapter 7. Control elements
• Shortening of time series: Window length or x-th sample point: defines the window lengths (Edit - Convert - Shorten time series - Shortening by window methods) resp. the step width (Edit - Convert - Shorten time series - Use only each x-th sample point) to short time series. • Shortening of time series: method: selects the method for shortening all time series in a project using Control element: Time series: Extraction - Parameters - Shortening of time series: Window length or x-th sample point. First, a window of with a length defined by Edit - Convert - Shorten time series - Shortening by window methods is chosen. Second, the new value for the short time series is computed by the mean, median, minimum, or maximum value of these windows. The windows do not overlap. • Match time series length to: defines the length for the shortening of the time series via Edit - Convert - Shorten time series Match time series lengths (use 0 and NaN as undefined values). The new length of the time series is fixed (percent: 100, per thousand 1000) or the shortest time series in the data set is used. The length of the shortest time series is defined by the sample after which the time series is only zero, Inf or NaN.
7.4. Control elements for ’Plugin sequence’
7.4
81
Control elements for ’Plugin sequence’
Figure 7.4: Control elements for Plugin sequence
• Show plugins: select the shown plugins depending on type (e.g. time series → time series). • Add: adds the selected plugins from Control element: Plugin sequence - Selection of plugins to a plugin sequence. • Update plugins: reads the available plugins from all plugin files. It is useful for the development of plugins to avoid SciXMiner restarts. • Show plugin list: writes the characteristics and descriptions of all available plugins in a file and displays this file. • Selection of plugins: selects the plugins used by Edit - Extract - Time series → Time series, Time series → Single features (via plugin sequence).... Only a definition in the edit window guarantees the selected order of the plugins. A definition in the list box ignores this order and sorts the plugins by their numbers. • Plugin parameter: set the parameters of the selected plugin from Control element: Plugin sequence - Selection of
82
Chapter 7. Control elements
plugins resp. Control element: Plugin sequence - Selected plugin sequence. The switch between multiple parameters is done by Control element: Plugin sequence - No.. • No.: selects a specific parameter for plugins with multiple parameters. • Forward: moves the selected plugins in Control element: Plugin sequence - Selected plugin sequence to earlier positions in the sequence. • XPIWIT: Execute pipeline stepwise: execute plugins in XPIWIT separately. In this option, for each plugin a separate call of XPIWIT.exe is executed. This option is only used by the extension package ”Images and Videos”. • Down: moves the selected plugins in Control element: Plugin sequence - Selected plugin sequence to later positions in the sequence. • Delete: deletes the recent plugin from the plugin sequence. • Delete all: deletes all plugins from a plugin sequence. • Load: loads a plugin sequence from a plugin sequence file (*.plugseq). The matching of the plugins is done by the function names. • Selected plugin sequence: shows the recent plugin sequence. The plugin sequence is performed step by step using Control element: Plugin sequence - Execute resp. Edit - Extract - Time series → Time series, Time series → Single features (via plugin sequence)... (plugins for time series) or Images and Videos - Apply plugin sequence to the selected images (plugins for images). Existing parameters of the plugins are set by Control element: Plugin sequence - Plugin parameter. The order of plugins can be changed by Control element: Plugin sequence - Down etc. WARNING! If the plugin sequence is recorded by a macro, each plugin must be added separately and its parameters have to be chosen before the next plugin can be added. Otherwise, the macros recording might cause problems if the plugin sequence contains more than one plugin with the same name. In this case, the parameter of the last plugin with the same name are adapted. • Save: saves a plugin sequence with the defined plugin parameters in a plugin sequence file (*.plugseq). • Show results: defines the visualization and save options for plugin sequences of images. Intermediate results are the result of all plugins except the last one. ”Show” means a visualization as image in a separate Matlab figure, ”Save” the generation of a new image file and the generation of a new image type. Plugins in projects without images ignores this option and set it to ”Save final result”. • Show parameters: shows all used parameters in a plugin sequence.
7.4. Control elements for ’Plugin sequence’
83
• Save performance log file: defines if computing times for single plugins or complete plugin sequences should be written in a log file ”*_PerformanceLog.csv” in the recent project directory. • Execute: executes the recent plugin sequence in Control element: Plugin sequence - Selected plugin sequence. • Use the same transformation matrix (e.g. PCA) for time series reduction of all data points: influences the reduction of time series by the Principal Component Analysis. If the option is marked, an identical transformation matrix is used for all data points. Otherwise, a separate transformation matrix is computed for each data point.
84
Chapter 7. Control elements
7.5
Control elements for ’Single features’
Figure 7.5: Control elements for Single features
• Selection of output variable: selects an output variable. This selection influences many functions as the evaluation of single features and time series, the design of classifiers, almost all visualization functions etc. • Selection of single feature(s) (SF): selects single features for visualization and all following processing steps. The selection can be done by mouse clicks in the listbox, by writing the numbers in the edit field on the left hand side or by the ’ALL’ button to select all single features. The different fields will be synchronized after the input. TIP: An input in the edit field enables a selection with a different order (e.g. 2-4-1 for a visualization) in contrast to the listbox. • Number of terms for Single feature→Output variable: defines the number of terms for a new output variable generated by Edit - Convert - Selected single features → Output variables (see also Control element: Single features - All values). The transformation is done by a maximum defuzzification. The membership functions are computed by a cluster method. • All values: uses all different values of a feature as separate linguistic terms (see Edit - Convert - Selected
7.5. Control elements for ’Single features’
85
single features → Output variables). The value of Control element: Single features - Number of terms for Single feature→Output variable will be ignored. Example: A single feature has the values 1, 2.5, 3.5 and 7. The result is an output variable with four terms called ”ca. 1”, ”ca. 2.5”, ”ca. 3.5” and ”ca. 7”. In contrast, new terms with the number defined in Control element: Single features - Number of terms for Single feature→Output variable will be computed if the checkbox is deactivated. • A priori feature relevances: switches on the use of a priori relevances of single features. For feature selection, features with higher a priori relevances are preferred. The values are between zero (bad feature) and one (preferable feature). They can be - defined in the project file (variable interpret_merk) - generated by means of categories, or - manually modified (e.g. by Control element: Single features - A priori feature relevances (fix value)). • Preference exponent alpha (Interpretability): defines an exponent for feature relevances using a priori relevances. The exponent weights the first value of the a priori relevances mostly associated with an interpretability value. A value of zero ignores the interpretability, large values prefer features with higher interpretability. • A priori feature relevances (fix value): sets a defined value for a priori relevances for a manual setting using Edit - Category - A priori relevances of selected features... - set to a fix value (from GUI) for all selected single features. • Preference exponent beta (Implementability): defines an exponent for feature relevances using a priori relevances. The exponent weights the second value of the a priori relevances mostly associated with the implementability. A value of zero ignores the implementability, large values prefer features with higher implementability.
86
Chapter 7. Control elements
7.6
Control elements for ’Data preprocessing’
Figure 7.6: Control elements for Data preprocessing - One-class
• Save result as output variable: save the result of the outlier detection as a new output variable. The option ”new output variable” adds always a new output variable with the result of the outlier detection. The variable name is ”Outlier” with the name of the used method. The option ”Replace identical output variable” replace the results in an existing output variable computed by the same method. Otherwise, a new output variable is added. • Threshold for outliers: defines a threshold parameter if a data point is classified as outlier or not (see Edit - Outlier detection - Apply (selected data points, designed data set)). The meaning of the parameter depends on the method: SVM - a value smaller than zero (tolerated distance to the class border) distance-based: distance value density-based: number of neighbors The level curves in the visualization are helpful for the parameter definition (see Control element: View: Classification and regression - Show outlier detection).
7.6. Control elements for ’Data preprocessing’
87
• Manual selection of outliers: removes the data points with the indices in the edit field from the training data set. This function supports the outlier detection in complicated cases because these data points are not evaluated as good measurements. Depending on the related positions in feature space, it normally increases the probability of an automatic outlier detection of these data points by applying the outlier detection. All selected data points are used if the field is empty or ”[]” is written in the field. During the application, all data points will be evaluated. The number of data points is shown if Control element: View: Single features - Show data point number is marked. • Method: selects the classifier type for the outlier detection. P The one-class method optimizes the coefficients ai and b of the function: f (z) = i ai K(z, xi ) + b, with an unknown data point z and the data points xi of the training data set. K is a kernel function known from Support Vector Machines. A data point z is handled as outlier if f (z) < Threshold (see [23] for algorithm details). The threshold is defined by Control element: Data preprocessing - Threshold for outliers. The distance-based method uses the Mahalanobis distance to the mean value of the training data set. All data points with a distance larger than Control element: Data preprocessing - Threshold for outliers (positive value) are handled as outliers. The density-based method classifies all data points without a minimal number of neighbors (defined by Control element: Data preprocessing - Threshold for outliers) as outliers. The neighborhood is defined by a maximal ([0,1]-normalized Euclidean) distance. The distance is tuned by Control element: Data preprocessing - Max. distance. • Compute class discriminant functions: switches between hard and soft limits for the one-class method. For hard limits, all training data are handled as class members. For soft limits, some training data could be automatically classified as outliers. It makes especially sense if some data points in the training data set look suspicious. • Kernel order: set the order of the kernel of the SVM. It is used for the classification with the SVM and by the SVM-based outlier detection. • Use cityblock distance: switches on the 1-norm (city block distance) instead of the Euclidean distance for the Gaussian RBF kernel in the one-class method of the outlier detection (see Control element: Data mining: Special methods - Kernel). This results normally in rougher class borders. • Penalty term Lambda (for soft limits): tunes the number of training data accepted as outliers. A larger value reduces the number of outliers. This parameter is only used if ”soft limits” are selected in Control element: Data preprocessing Compute class discriminant functions. • Minimal number of data points in one class: minimal number of data points for the selection with Edit - Select - Data points via most frequent terms.
88
Chapter 7. Control elements
• Threshold for deleting [Perc. missing data]: defines the percental threshold in data preprocessing for the deletion of time series or single features in case of missing values. Otherwise, each data point with at least one missing value in any single feature or data point will be deleted. A time series contains missing values if at least one sample point is missing. Missing values must be coded with NaN values or Inf values. Time series with zero values for all sample points are also considered as missing values. Example: Project with 100 data points and 15 % missing values (data point 1-15) for time series x1 and 5 % missing values for time series x2 (data point 96-100) and threshold of 10 %: Time series x1 will be completely deleted, data points 96-100 will be deleted. • Feature values for selection: value range for the selection of data points based on single feature values in Control element: Data preprocessing - Feature values for selection. • Date format: defines the date format for the conversion of dates and hours in an output variable into a MATLAB timestamp format using Edit - Convert - Selected output variable (Date) → Single feature (Timestamp).
7.6. Control elements for ’Data preprocessing’
89
Figure 7.7: Control elements for Data preprocessing - Density based
• Save result as output variable: save the result of the outlier detection as a new output variable. The option ”new output variable” adds always a new output variable with the result of the outlier detection. The variable name is ”Outlier” with the name of the used method. The option ”Replace identical output variable” replace the results in an existing output variable computed by the same method. Otherwise, a new output variable is added. • Threshold for outliers: defines a threshold parameter if a data point is classified as outlier or not (see Edit - Outlier detection - Apply (selected data points, designed data set)). The meaning of the parameter depends on the method: SVM - a value smaller than zero (tolerated distance to the class border) distance-based: distance value density-based: number of neighbors The level curves in the visualization are helpful for the parameter definition (see Control element: View: Classification and regression - Show outlier detection). • Manual selection of outliers: removes the data points with the indices in the edit field from the training data set. This function supports the outlier detection in complicated cases because these data points are not evaluated as
90
Chapter 7. Control elements
good measurements. Depending on the related positions in feature space, it normally increases the probability of an automatic outlier detection of these data points by applying the outlier detection. All selected data points are used if the field is empty or ”[]” is written in the field. During the application, all data points will be evaluated. The number of data points is shown if Control element: View: Single features - Show data point number is marked. • Method: selects the classifier type for the outlier detection. P The one-class method optimizes the coefficients ai and b of the function: f (z) = i ai K(z, xi ) + b, with an unknown data point z and the data points xi of the training data set. K is a kernel function known from Support Vector Machines. A data point z is handled as outlier if f (z) < Threshold (see [23] for algorithm details). The threshold is defined by Control element: Data preprocessing - Threshold for outliers. The distance-based method uses the Mahalanobis distance to the mean value of the training data set. All data points with a distance larger than Control element: Data preprocessing - Threshold for outliers (positive value) are handled as outliers. The density-based method classifies all data points without a minimal number of neighbors (defined by Control element: Data preprocessing - Threshold for outliers) as outliers. The neighborhood is defined by a maximal ([0,1]-normalized Euclidean) distance. The distance is tuned by Control element: Data preprocessing - Max. distance. • Max. distance: defines the accepted maximum distance for a neighborhood (see Control element: Data mining: Special methods - Evaluate minimum number of neighbors). • Minimal number of data points in one class: minimal number of data points for the selection with Edit - Select - Data points via most frequent terms. • Threshold for deleting [Perc. missing data]: defines the percental threshold in data preprocessing for the deletion of time series or single features in case of missing values. Otherwise, each data point with at least one missing value in any single feature or data point will be deleted. A time series contains missing values if at least one sample point is missing. Missing values must be coded with NaN values or Inf values. Time series with zero values for all sample points are also considered as missing values. Example: Project with 100 data points and 15 % missing values (data point 1-15) for time series x1 and 5 % missing values for time series x2 (data point 96-100) and threshold of 10 %: Time series x1 will be completely deleted, data points 96-100 will be deleted. • Feature values for selection: value range for the selection of data points based on single feature values in Control element: Data preprocessing - Feature values for selection. • Date format: defines the date format for the conversion of dates and hours in an output variable into a MATLAB timestamp format using Edit - Convert - Selected output variable (Date) → Single feature (Timestamp).
7.7. Control elements for ’View: Single features’
7.7
91
Control elements for ’View: Single features’
Figure 7.8: Control elements for View: Single features
• Show figures: switches between color-coded, number-coded (for the number of the linguistic term of the output variable), and (black and white) symbol-coded features and time series. • Color style: modifies the visualization of output variables by means of different color and style combinations for time series and single features. It defines the mapping of linguistic terms to colors and styles. • User-defined colors: defines the order of user-defined colors for the visualization of linguistic terms of the selected output variable in time series and single feature plots. Here, the color abbreviations of Matlab are used (see help text for the function plot). The option is only active if User-defined (color or symbol) resp. User-defined (color and symbol)) is selected in Control element: View: Single features - Color style and Colored is selected in Control element: View: Single features - Show figures. • User-defined symbols: defines the order of user-defined symbols for the visualization of linguistic terms of the selected output variable in time series and single feature plots. Here, the symbol abbreviations of Matlab are used (see help text for the function plot). The option is only active if User-defined (color or symbol) resp. User-defined (color and symbol)) is selected in Control element: View: Single
92
Chapter 7. Control elements
features - Color style and Black-and-white symbol is selected in Control element: View: Single features - Show figures. • Different output variable: shows the results of classification and regression with a free selectable output variable if ”Different output variable” was chosen in Control element: View: Classification and regression - Display classes for output variables. • SF display x-y-turn: rotates a figure by switching the x- and y-axes for a two-dimensional plot. • Inverse plot order terms: plots all data points in reverse order of the terms of the output variables. • Show data point number: switches the display of data point numbers on or off. • Evaluate only selected single features: evaluates only the selected single features. • Show legend: plot the legend with the linguistic terms of the output variable. • Show term names instead of data point numbers: shows the term names instead of the data point number in figures. The option is only active if Control element: View: Single features - Show data point number is activated. • Relative ratio noise term: relative ratio (relative to the axis scale of each single feature in the original plot) for an additional noise (see Control element: View: Single features - Add noise term). • Add noise term: adds a uniformly distributed noise with the factor from Control element: View: Single features Relative ratio noise term to the shown single features. This make sense for the easier visualization of discrete-valued single features. • Centers for histogram bins: defines bin centers for histograms manually (e.g. 0:10:100). This bin centers are used if Control element: View: Single features - Automatic is deactivated. • Automatic: defines the bin centers for histograms automatically. • Shown feature relevances in lists: defines the number of shown features and their relevance values in relevance lists. The value is only used if Control element: View: Single features - All is switched off. The reduction of the numbers allows more compact lists for documentation purposes. • All: shows all features and their relevance values in relevance lists. • Sorting of lists: defines the order of single features in lists and text files: ascending or descending sorted resp. unsorted.
7.7. Control elements for ’View: Single features’
93
• Decimal symbol in German format (comma): defines a German style number format with commas as decimal point. • Output variables protocol files absolute values: defines the protocol option of output variables in files generated by View - Single features - Absolute values. Possible values are all, the selected or none output variables. • Classes as rows: switches the style of protocol files for mean values etc. as generated by View - Single features Mean, standard deviation, minimum, maximum. If the option is activated, each class is written in a row and each single feature in a column. Otherwise, each single feature is written in a row and each class in a column. • Font: defines the font type, that is set by Window - Update font and font size in figures for all open MATLAB figures. • Font size: defines the font size, that is set by Window - Update font and font size in figures for all open MATLAB figures. • Marker size: defines the marker size in plots of single features.
94
Chapter 7. Control elements
7.8
Control elements for ’View: Time series’
Figure 7.9: Control elements for View: Time series
• Show figures: switches between color-coded, number-coded (for the number of the linguistic term of the output variable), and (black and white) symbol-coded features and time series. • Color style: modifies the visualization of output variables by means of different color and style combinations for time series and single features. It defines the mapping of linguistic terms to colors and styles. • User-defined colors: defines the order of user-defined colors for the visualization of linguistic terms of the selected output variable in time series and single feature plots. Here, the color abbreviations of Matlab are used (see help text for the function plot). The option is only active if User-defined (color or symbol) resp. User-defined (color and symbol)) is selected in Control element: View: Single features - Color style and Colored is selected in Control element: View: Single features - Show figures. • User-defined symbols: defines the order of user-defined symbols for the visualization of linguistic terms of the selected output variable in time series and single feature plots. Here, the symbol abbreviations of Matlab are used (see help text for the function plot). The option is only active if User-defined (color or symbol) resp. User-defined (color and symbol)) is selected in Control element: View: Single
7.8. Control elements for ’View: Time series’
95
features - Color style and Black-and-white symbol is selected in Control element: View: Single features - Show figures. • Percental (ignore sampling frequency): switches to a percental x-axis for the visualization of time series. The time series length is set to 100%. The chosen sampling frequency will be ignored. • Sample points: switches to the number of sample points on the x-axis for the visualization of time series. The chosen sampling frequency will be ignored. • Time [Unit]: switches to the time on the x-axis for the visualization of time series. The chosen sampling frequency in Control element: Time series: General options - Sampling frequency of time series will be used to transform sample points to the time. The time starts always with zero. • Project-specific: uses a project-specific time scale defined by (parameter.)projekt.timescale for the visualization of time series. This struct contains the elements .name for the name of the time scale and .time for the time values of each sample point. This option is useful for non-equidistant time scales or other onedimensional scales (e.g. mass for mass spectroscopy). An existing time series can be converted to a project-specific time scale by Edit - Convert - Selected time series → Project-specific time scale. • Show time series as subplots: plots selected time series to individual axes, if the option is activated. Otherwise, all time series are plotted to the same axis. Different time series are displayed with different colors. The color mapping to linguistic terms of output values gets lost. • Imageplot Time series (Color coding): shows time series in a color code. The scale is tuned by Control element: View: Spectrogram, FFT, CCF - Limits for color axis and Control element: View: Spectrogram, FFT, CCF - Function for color bar, the colormap by Control element: View: Spectrogram, FFT, CCF - Colormap. The selected data points are sorted by number or by the linguistic terms of the selected output variable depending on the value of Control element: View: Time series - Sorting classes for image plot. If only one time series is visualized, the option is switched off temporarily. • Sorting classes for image plot: switches between sorted by number or class-wise by the linguistic terms of the selected output variable. The selection is only relevant if Control element: View: Time series - Imageplot Time series (Color coding) is activated. • Show legend: plot the legend with the linguistic terms of the output variable. • Show data point number: switches the display of data point numbers on or off. • Poincare plot: Connect points: defines if the sample points in a Poincare plot will be connected by lines or not.
96
Chapter 7. Control elements
• Show normative data: shows normative data as light-gray region in the visualization of time series. Normative data has to be produced by File - Normative data - Mean value to normative data (internally from the project) or by File - Normative data - Load normative data from a file. • Normative data in foreground: the visualization of many original time series may overlay the normative data. Activate this option to plot the normative data in the foreground. • Logarithmic visualization: select an optional logarithmic scaling of times and resp. or amplitudes of time series for the visualization. • Linewidth: modifies the line width for the visualization of time series. It makes sense e.g. for the export of figures in LATEXfigures with values of e.g. 1.5 or 2. • Font: defines the font type, that is set by Window - Update font and font size in figures for all open MATLAB figures. • Font size: defines the font size, that is set by Window - Update font and font size in figures for all open MATLAB figures.
7.9. Control elements for ’View: Spectrogram, FFT, CCF’
7.9
97
Control elements for ’View: Spectrogram, FFT, CCF’
Figure 7.10: Control elements for View: Spectrogram, FFT, CCF
• Window size [sample points]: defines the window size for the computation of spectrograms. It controls the compromise between a temporal and frequency resolution. A small value prefers a better temporal resolution. The value is automatically reduced to the next power of two to preserve the efficiency of the FFT algorithm (e.g. 27 = 128, 210 =1024 etc.). The value is limited by the number of sample points. • Normalization for crosscorrelation: defines the mode of normalization for Auto and Cross Correlation Functions: - ”biased”, scales to the length of the time series, see MATLAB function xcorr - ”unbiased”, scales to (length of time series - lag), see MATLAB function xcorr (less robust results for large lags) - ”coeff”, normalizes the result to autocorrelation 1 with lag 0, see MATLAB function xcorr - ”coeff_local” - as ”biased”, but with an additional mean correction and variance normalization to one (identical to ”coeff_mean”, hold for compatibility reasons) - ”none” - without normalization, see MATLAB function xcorr In addition, options with mean value correction (+”_mean”) and linear trend compensation (+”_detrend”) of the time series exist.
98
Chapter 7. Control elements
• Copy correlation results to workspace: defines if the auto or cross-correlation functions compute by View - Cross and Auto Correlation Functions - Separately for each data point are saved into a workspace variable kkfs. • Time shift Tau [SP]: sets the time shift for the visualization of correlation coefficients in View - Cross and Auto Correlation Functions - Mean values of correlation coefficients (defined time shift) and View - Cross and Auto Correlation Functions - Class mean values of correlation coefficients (with defined time shift). A value of zero uses the same sample point for both time series. • Show correlation figures: defines if the figures of correlation functions are shown or not. The disabling is useful if the results are saved into a variable (see Control element: View: Spectrogram, FFT, CCF - Copy correlation results to workspace). • Morlet spectrogram: Frequency stepwidth: defines distances for frequencies, e.g. 1:100:10000. • Frequencies (FIL, Morlet spectrogram): defines the cutoff frequencies for different filters. The parameter is used for a Butterworth filter in feature extraction and for Morlet spectrograms. A high-pass filter and a low-pass filter use only the first value, whereas the band-pass filter uses both values. • Sample points baseline: see Control element: View: Spectrogram, FFT, CCF - Morlet spectrogram (relative to baseline). • Morlet spectrogram (relative to baseline): computes the Morlet spectrogram relatively to a baseline if the option is activated (see View - Morlet spectrogram - Compute and show (selected data points and time series)). Instead of absolute value, the temporal changes will be shown. The limits of the baseline are defined by Control element: View: Spectrogram, FFT, CCF - Sample points baseline. • Reduce sampling points for Morlet spectrogram: reduces the number of shown sample points, because exported figures with Morlet spectrograms need a lot of memory. If a value k is greater than one, only each k-th sample point will be shown. The loss of information is usually acceptable for small values. • Number of principal components for spectrogram: defines the number of principal components for View - Spectrogram - Principal component analysis for spectrograms. • Show color bar: shows the mapping between numbers and the color code for some visualizations as e.g. spectrograms. • Show phase response: shows the phase response in addition to the amplitudes of a spectrogram. • Function for color bar: changes the color code for the mapping of numbers (e.g. for spectrograms). It is useful especially for a better resolution for small values of amplitudes. Here, the roots square or the inverse exponential function increase the resolution for small amplitude values. The parameters Control element:
7.9. Control elements for ’View: Spectrogram, FFT, CCF’
99
View: Spectrogram, FFT, CCF - Exponent for exponential function resp. Control element: View: Spectrogram, FFT, CCF - Index of the root control the quantitative characteristic. • Exponent for exponential function: see Control element: View: Spectrogram, FFT, CCF - Function for color bar (exponent for exponential characteristic). A larger value increases the resolution for smaller amplitudes. • Index of the root: see Control element: View: Spectrogram, FFT, CCF - Function for color bar (n-fold root). A larger value increases the resolution for smaller amplitudes. • Colormap: changes the color style for some functions (e.g. for spectrograms). The colormaps are explained in the Matlab documentation (e.g. for Jet: help jet). The colormap 1 - Gray values inverts the gray map: 0 is now white and 1 black. • Limits for color axis: defines user-defined limits for some visualizations (e.g. for spectrograms). Larger and lower values are limited to the minimal resp. maximal value. All values between are scaled to identical values. This option is useful for an identical color code in different figures with different minimal or maximal values. The option is switched off by Control element: View: Spectrogram, FFT, CCF - Automatic (esp. for root and exponential). • Automatic (esp. for root and exponential): uses an automatic scaling (minimum to maximum value) to compute the colormap. Otherwise, the values from Control element: View: Spectrogram, FFT, CCF - Limits for color axis are used as limits. • Number of dominant frequencies for visualization: defines the number of shown frequencies in a frequency list file (*.freq). • Plot FFT vs. period length (instead of frequency): plot the FFT results vs. the period length. If the option is deactivated, the results are shown vs. frequency.
100
7.10
Chapter 7. Control elements
Control elements for ’View: Classification and regression’
Figure 7.11: Control elements for View: Classification and regression
• Display classes for output variables: switches the visualization of classification results with View - Classification - Result and similar functions: ”only learning data:” shows the true class assignments for the learning data set. ”only classification:” shows the classifier decisions. ”DS-No misclassification:” shows the true class assignments for the learning data set with the data point number for misclassified data points. ”Class-No misclassification:” shows the true class assignments for the learning data set with the number of the class decision for misclassified data points. • Show discriminant functions: plots the discrimination functions for the class borders using the recent classifier in the feature space. • Number of grid points: defines the number of grid points (in x- and y-direction) for the computation of regression functions or discriminant functions for class borders. The function will be applied to each grid point, resulting in (number of grid points)*(number of grid points) computations for two-dimensional problems.
7.10. Control elements for ’View: Classification and regression’
101
• Different output variable: shows the results of classification and regression with a free selectable output variable if ”Different output variable” was chosen in Control element: View: Classification and regression - Display classes for output variables. • Show outlier detection: contains the options for the outlier detection. ”None:” computes the result, but does not show any visualization. ”only result:” shows the classification of the selected data points as outliers or normal data points. ”Result with contour plot:” shows the classification of the selected data points as outliers or normal data points. In addition, lines with the values of the decision functions are plotted. The values of the feature space are expanded. The corresponding parameter can be changed in Control element: View: Classification and regression - Number of grid points. ”only discriminant function:” shows only the class borders in form of discriminant functions. • Regression visualization: Normalize and aggregate input features: show the results of the estimated output variable of the regression model in View - Regression Input variable(s), output variable, and regression function (2D resp. 3D) as a function of normalized and aggregated single features if such features were chosen in the design of the regression, see parameters in Control elements: Data mining: Regression. If not, the option does not influence the figure. If the option is switched off, the estimated output variable is shown as function of the original single features without normalization and aggregation. For more than two single features, View - Regression - GUI for multidimensional visualization has to be used.
102
7.11
Chapter 7. Control elements
Control elements for ’Data mining: Classification of single features’
contains the most important elements for the parameterization of data mining methods. The parameterization of the chosen classifier is done using Control elements: Data mining: Special methods.
Figure 7.12: Control elements for Data mining: Classification of single features - DA with optimization
• Selection of output variable: selects an output variable. This selection influences many functions as the evaluation of single features and time series, the design of classifiers, almost all visualization functions etc. • Selection of single features: defines the method for the feature selection (e.g. use the recent selected features, automatic selection by ANOVA), see Data mining - Selection and evaluation of single features. • Number of selected features: defines the maximum number of single features for an automatic feature selection. • Normalization of single features: performs a normalization of features before a classification. It improves the results for all methods which are sensitive against different scaled features. Two approaches are implemented; to the interval [0, 1] or to a mean value of zero and a standard deviation of one under the assumption of a normal distribution.
7.11. Control elements for ’Data mining: Classification of single features’
103
• Preselection of features: preselects all manually selected features (by Control element: Single features - Selection of single feature(s) (SF)) for an automatic feature selection. Example: Features x5 and x7 are manually selected, selection of four features by ANOVA, best features are x8, x9, x10, x13 leads to the selection of x5, x7, x8, x9. • Downgrading of correlated single features: downgrades a feature to a relevance of zero if it correlates significantly to at least one better feature. This significance is measured by a positive (linear) Pearson correlation coefficient with a value larger than a threshold define by the Control element: Data mining: Statistical options - Threshold for correlation coefficient). The aim of this function is the generation of a short list with different features. Otherwise, some very similar features might dominate at the first places of the list. • Feature aggregation: defines the method for the linear feature aggregation by means of a multiplication with a weighting matrix. Possible options are ”No aggregation”, a (linear) Discriminant Analysis, a Discriminant Analysis followed by a numerical optimization (”DA with optimization”, see Control element: Data mining: Classification of single features - Criterion for optimized DA for the optimization criterion), a ”Principal Component Analysis (PCA)”, an ”Independent Component Analysis (ICA)” or the sum resp. mean value. • Number of aggregated features: defines the number of aggregated features (sd ) in a classification (see e.g. [87]). The value is ignored if ”No aggregation” is chosen in Control element: Data mining: Classification of single features - Feature aggregation. A value of sd = 1 is always used for ”Sum” and ”Mean value”. • Criterion for optimized DA: specifies the criterion for a Discriminant Analysis with (numerical) optimization (see also Control element: Data mining: Classification of single features - Feature aggregation). Available options are an a maximization of the classification accuracy (”best_class”) or a maximization of the minimal distance between two classes using class-specific covariance matrixes as metric (”best_ldf”) [87]. • Normalization of aggregated features: performs a normalization of the aggregated features before a classification. It improves the results for all methods which are sensitive against different scaled features. Two approaches are implemented; to the interval [0, 1] or to a mean value of zero and a standard deviation of one under the assumption of a normal distribution. • Chosen classifier: defines the type of the classifier. Possible options are a ”Bayes classifier”, an ”Artificial Neural Network”, a ”Support vector machine”, a ”k-nearest neighbor” classifier in two different implementation options, a ”Fuzzy classifier”, a ”Decision tree” and Ensemble learning (fitensemble). Due to incompatibilities, the parameter of Control element: Data mining: Classification of single features - Multi-class problems might be modified as well. Here, an additional warning is shown in the Matlab command window. The selected classifier type is parameterized in more detail by Control elements: Data mining: Special methods.
104
Chapter 7. Control elements
• Multi-class problems: selects the approach for the optional decomposition of problems with more than two classes of the output variable: 1. Pure multi-class problems solve the problem without a decomposition. 2. The one-against-all method decomposes a problem with C classes in C two-class problems with class c vs. the union of all remaining classes. 3. The one-against-one method decomposes a problem with C classes in all pairwise problems with class c vs. class j (j 6= c). For the cases 2 and 3, a fusion of the single results is automatically done. • Save confusion matrix in file: saves the confusion matrix for the training data set of the recent classifier in a file, if the option is activated. • Graphical evaluation of classification results: opens a figure with classification results in the feature space of the classifier (if the option was activated).
7.12. Control elements for ’Data mining: Classification of time series’
7.12
105
Control elements for ’Data mining: Classification of time series’
Figure 7.13: Control elements for Data mining: Classification of time series - K5
• Trigger time series: selects the trigger time series out of the existing time series. It is zero until the trigger event, contains increasing values to measure the number of samples since the trigger and zeros after the end of the recent event. If no trigger time series was selected, the sample numbers of the complete time series are used: It starts with a value of one for the first sample point and ends up with the length of the time series. • Classifier type: selects a classifier type for the time series: K1 contains only one classifier and ignores the trigger events. K5 is similar, but it uses the time since the trigger event as additional input variable. K2 is a special kind of single feature classifier for all sample points and aggregates results via a discriminant analysis. K3 and K4 have separate sub-classifiers for each sample point since the trigger event. K3 has a fix selection of time series, K4 a variable one for each sample point. TSK-Fuzzy is similar to K4, but it aggregates similar sample points by means of fuzzy sets. [22, 73] give a detailed description of the classifiers. The feature selection and the underlying classifiers (e.g. Bayes classifiers) are parameterized using Control elements: Data mining: Classification of single features and Control element: Data mining: Special methods - Method.
106
Chapter 7. Control elements
• Time-weighting of time series relevances: gives the opportunity to prefer an earlier classification, e.g. for the feature selection of the K1 and K3 classifier. The method modifies the feature relevances by Rk =
R , for k > (ktrig + 0.15 · ktrig ) k − ktrig
ktrig is the sample point of the last trigger event. It increases feature relevances near the trigger event in contrast to later ones. • Filtering of results: select the method for filtering. The following options are available: ”No” filter is used.. ”IIR-Filter” uses the filter parameters in Control element: Data mining: Classification of time series - Parameter for IIR filter. ”Classification error for training data” prefers samples with a better classification accuracy in the training data set in contrast to samples with a lower accuracy. This results in time-variant filter constants. The ”Most frequent decision in a window” selects the estimated class with the highest frequency in a sliding window. The window length is defined in Control element: Data mining: Classification of time series - Temporal aggregation of features. The first sample points with a sample number up to the window length use all sample points up to this time for decision. • Results for filtering: switches between absolute and relative values as input values for the fusion by filtering. As an example, absolute values of a Bayes classifier are the estimated a-posteriori probabilities, relative values the percentage of the estimated a-posteriori probabilities for the given class relative to all classes. • Parameter for IIR filter: set the parameter for the IIR filtering for the temporal fusion of classification results in time series classification (see Control element: Data mining: Classification of time series - Filtering of results). • Temporal aggregation of features: tunes the temporal aggregation of sample points before the classification. The number and the names of time series remain unchanged. A selection of ”No” does not use a temporal aggregation. The ”Mean value” is computed in a sliding window defined by Control element: Data mining: Classification of time series - Temporal aggregation: Window length and Control element: Data mining: Classification of time series - Temporal aggregation: Step width. ”Minimum”, ”Maximum” and ”ROM” (Range of Motion) work with the same window, but with different operators. The aggregation is always causal, i.e. only past sample points are aggregated. The first window does not start before the trigger event. • Temporal aggregation: Window length: defines the length of the sliding window for the temporal aggregation of features (see also Control
7.12. Control elements for ’Data mining: Classification of time series’
107
element: Data mining: Classification of time series - Temporal aggregation of features). The aggregation is always causal, i.e. only past sample points are aggregated. The first window does not start before the trigger event. Consequently, the first window terminates at ”Trigger event + Window length - 1”. • Temporal aggregation: Step width: step width for the distance between two sliding windows. If all sample points should be used, a value of ”1” must be chosen. • K5: use each x. sample point: The classifier K5 handles a training data set of a classification problem for time series as a samplewise classification problem with the time since the trigger event as an additional feature. As a consequence, it has a high memory consumption because all sample points are handled as separate data points. It might cause problems up to Matlab crashes especially for Support Vector Machines (SVM). The option reduces the number of sample points for the training of a K5 classifier.
108
Chapter 7. Control elements
Figure 7.14: Control elements for Data mining: Classification of time series - TSK-Fuzzy
• Trigger time series: selects the trigger time series out of the existing time series. It is zero until the trigger event, contains increasing values to measure the number of samples since the trigger and zeros after the end of the recent event. If no trigger time series was selected, the sample numbers of the complete time series are used: It starts with a value of one for the first sample point and ends up with the length of the time series. • Classifier type: selects a classifier type for the time series: K1 contains only one classifier and ignores the trigger events. K5 is similar, but it uses the time since the trigger event as additional input variable. K2 is a special kind of single feature classifier for all sample points and aggregates results via a discriminant analysis. K3 and K4 have separate sub-classifiers for each sample point since the trigger event. K3 has a fix selection of time series, K4 a variable one for each sample point. TSK-Fuzzy is similar to K4, but it aggregates similar sample points by means of fuzzy sets. [22, 73] give a detailed description of the classifiers. The feature selection and the underlying classifiers (e.g. Bayes classifiers) are parameterized using Control elements: Data mining: Classification of single features and Control element: Data mining: Special methods - Method. • Time-weighting of time series relevances: gives the opportunity to prefer an earlier classification, e.g. for the feature selection of the K1 and
7.12. Control elements for ’Data mining: Classification of time series’
109
K3 classifier. The method modifies the feature relevances by Rk =
R , for k > (ktrig + 0.15 · ktrig ) k − ktrig
ktrig is the sample point of the last trigger event. It increases feature relevances near the trigger event in contrast to later ones. • Filtering of results: select the method for filtering. The following options are available: ”No” filter is used.. ”IIR-Filter” uses the filter parameters in Control element: Data mining: Classification of time series - Parameter for IIR filter. ”Classification error for training data” prefers samples with a better classification accuracy in the training data set in contrast to samples with a lower accuracy. This results in time-variant filter constants. The ”Most frequent decision in a window” selects the estimated class with the highest frequency in a sliding window. The window length is defined in Control element: Data mining: Classification of time series - Temporal aggregation of features. The first sample points with a sample number up to the window length use all sample points up to this time for decision. • Results for filtering: switches between absolute and relative values as input values for the fusion by filtering. As an example, absolute values of a Bayes classifier are the estimated a-posteriori probabilities, relative values the percentage of the estimated a-posteriori probabilities for the given class relative to all classes. • Parameter for IIR filter: set the parameter for the IIR filtering for the temporal fusion of classification results in time series classification (see Control element: Data mining: Classification of time series - Filtering of results). • Temporal aggregation of features: tunes the temporal aggregation of sample points before the classification. The number and the names of time series remain unchanged. A selection of ”No” does not use a temporal aggregation. The ”Mean value” is computed in a sliding window defined by Control element: Data mining: Classification of time series - Temporal aggregation: Window length and Control element: Data mining: Classification of time series - Temporal aggregation: Step width. ”Minimum”, ”Maximum” and ”ROM” (Range of Motion) work with the same window, but with different operators. The aggregation is always causal, i.e. only past sample points are aggregated. The first window does not start before the trigger event. • Temporal aggregation: Window length: defines the length of the sliding window for the temporal aggregation of features (see also Control element: Data mining: Classification of time series - Temporal aggregation of features). The aggregation is always causal, i.e. only past sample points are aggregated. The first window does not start before the trigger event. Consequently, the first window terminates at ”Trigger event + Window length - 1”.
110
Chapter 7. Control elements
• Temporal aggregation: Step width: step width for the distance between two sliding windows. If all sample points should be used, a value of ”1” must be chosen. • Number of clusters for TSK-Fuzzy: The TSK fuzzy classifier computes clusters to determine features with similar feature relevances vs. time. The parameter sets the number of clusters to be found. An interval value (e.g. 2:5) computes a set of clusters for each candidate number of clusters. The number with the first local minimum of the separation index will be selected. • Show cluster memberships: shows the result of the clustering by the search for time regions. It finds similar feature relevances for the time series classifier. • Threshold for fuzzy cluster: contains a threshold used for deletion of clusters representing very short regions. It represents the maximal value of the membership function. A large value simplifies the resulting classifier by the reduction of the number of linguistic terms for the TSK fuzzy classifier. A too low value might lead to an oversimplification.
7.13. Control elements for ’Data mining: Regression’
7.13
111
Control elements for ’Data mining: Regression’
Figure 7.15: Control elements for Data mining: Regression - Time series (TS)
• Feature type (input): switches between a regression model for single features with the model y = f (x1 , ..., xs ) and for time series with the model y[k] = f (x1 [k − i], ..., x1 [k − j], ..., xs [k − i], ..., xs [k − j]). The selection of input variables xi controls Control element: Data mining: Regression - Feature selection, the selection of output variables is done by Control element: Data mining: Regression - Output variable of regression. For time series, the sample points i, ..., j for the time shift are selected by Control element: Data mining: Regression - Sample points. The selection of the related model is only possible, if single features resp. time series exist in the project. • Feature selection: selects the input variables of the regression model. Possible selections are ”All features”, ”Selected features” (in Control element: Single features - Selection of single feature(s) (SF) or Control element: Time series: General options - Selection of time series (TS)) and automatically by univariate resp. multivariate regression coefficients. To set the number of automatically selected features, use Control element: Data mining: Regression - Number of selected features. • Number of selected features: defines the number of selected features by an automatic feature selection. For time series, each
112
Chapter 7. Control elements
combination of time series and sample points is handled as separate feature. As an example, x1 [k − 1] and x1 [k − 2] are two features. The value will be ignored if ”All features” or ”Selected features” are chosen in Control element: Data mining: Regression - Feature selection. • Preselection of features: preselects all manually selected features (by Control element: Single features - Selection of single feature(s) (SF)) for an automatic feature selection for regression of single features. • Normalization: performs a normalization of features before a regression. It improves the results especially for Artificial Neural Networks. Two approaches are implemented; to the interval [0, 1] or to a mean value of zero and a standard deviation of one under the assumption of a normal distribution. • Feature aggregation: defines the method for the linear feature aggregation by means of a multiplication with a weighting matrix. Possible options are ”No aggregation”, a ”Principal Component Analysis” or the sum resp. mean value. • Number of aggregated features: defines the number of aggregated features (sd ) in a regression (see e.g. [87]). The value is ignored if ”No aggregation” is chosen in Control element: Data mining: Regression - Feature aggregation. A value of sd = 1 is always used for ”Sum” and ”Mean value”. • Normalization of aggregated features: performs a normalization of aggregated features before a regression. It improves the results especially for Artificial Neural Networks. Two approaches are implemented; to the interval [0, 1] or to a mean value of zero and a standard deviation of one under the assumption of a normal distribution. • Output variable of regression: selects a single feature or a time series at sample point [k] as output of the regression model. Control element: Data mining: Regression - Feature type (input) switches between single features and time series. • Type: selects the method for the regression model. The methods are parameterized in detail using Control elements: Data mining: Special methods. • Sample points: defines the time shift for the regression of time series. The values must not be positive avoiding acausal models. If a time series is input and output variable, the value k = 0 is deleted for this time series. Example: The values ”0 -1 -24” with the time series x1 , x2 as input variables and the time series x1 as output variable are chosen. The resulting model is x1 [k] = f (x1 [k−1], x1 [k−24], x2 [k], x2 [k−1], x2 [k− 24]).
7.14. Control elements for ’Data mining: Clustering’
7.14
113
Control elements for ’Data mining: Clustering’
Figure 7.16: Control elements for Data mining: Clustering
• Feature classes: switches between a clustering of the selected time series (using the defined segment), the selected single features, or a co-clustering of time series and single features. • Number of clusters: defines the number of clusters to be computed by the cluster algorithms. A multiple selection (e.g. 2:8) is possible. In this case, the number is defined according to the first local minimum of the separation index. • Iteration steps: defines the maximal number of iteration steps of the cluster algorithm, if Control element: Data mining: Clustering - Unlimited iteration steps is deactivated. If the algorithms converge before this step, the algorithm is also terminated. • Unlimited iteration steps: executes the cluster algorithms until the internally defined convergence criterion was reached. • Distance measure: selects the metric for the distance between each data point and the cluster prototype. • Distance measure for the noise cluster: defines the method for the definition of a noise cluster [27] for a Fuzzy C-Means method. The
114
Chapter 7. Control elements
option ”None” does not generate a noise cluster. Alternatively, a new cluster is defined to which all data points have the same distance. Outliers are mainly assigned to this noise cluster. As a consequence, the influence of outliers to the other clusters is reduced. Possible distance measures are the mean distance of all data points to all other clusters [27] or the median of these distances. For the latter option, the distance is scaled by Control element: Data mining: Clustering - Factor for the distance to the noise cluster. • Factor for the distance to the noise cluster: defines a positive scaling factor for the distance to a noise cluster. A large value reduces the assignment of data points to the noise cluster (see also Control element: Data mining: Clustering - Distance measure for the noise cluster). • Fuzzifier for clustering: defines the fuzzifier in the fitness function of the Fuzzy C-Means method. The value should be at least 1.1 for numerical reasons. A higher value generates increases the fuzziness of the cluster membership values. For a value of 1, a crisp k-means method is used. • Compute start prototypes for clusters: selects the algorithms to compute start prototypes of the clusters. The possible options are ”equally distributed” clusters in the input space, ”random positions” of start prototypes, or ”random data points” selected as start prototypes. • Append cluster as output variable: adds the results of the cluster algorithms (the found crisp cluster memberships) to the project in form of a new output variable. • Video: shows the iterations of the cluster algorithms as video. • Plot original TS: shows the existing time series during the visualization of the cluster iterations. Possible options are ”all time series”, ”mean values”, and ”none”. • Fusion algorithm (Statistic Toolbox only): select the fusion algorithm for the hierarchical cluster algorithm of the Statistic Toolbox of MATLAB (see documentation of this toolbox).
7.15. Control elements for ’Data mining: Special methods’
7.15
115
Control elements for ’Data mining: Special methods’
Figure 7.17: Control elements for Data mining: Special methods - Bayes
• Method: parameterizes a method for the design of a classifier or regression model. The elements are contextsensitive to the method selected by Control element: Data mining: Special methods - Method. • Metrics of Bayes classifier: defines the metric for the Bayes classifier. • Use a priori probabilities: switches the use of estimated a priori probabilities of the different classes for the Bayes classifier on resp. off. The estimation uses the training data set.
116
Chapter 7. Control elements
Figure 7.18: Control elements for Data mining: Special methods - Artificial Neural Networks- MLP
• Method: parameterizes a method for the design of a classifier or regression model. The elements are contextsensitive to the method selected by Control element: Data mining: Special methods - Method. • Artificial Neural Network: Type: sets the type of the Artificial Neural Network. The available options include a Multi Layer Perceptron Net (MLP) and a Radial Base Function Net (RBF). The nets are used from the Neural Network Toolbox of Matlab. • MLP: number of output neurons: defines the number of output neurons for MLP nets. Possible options are ”one neuron” (values of the output variable: 1 to maximum class number) or ”one neuron per class” (values of the output variable: 0 ...1 for the related class membership). The latter case generates a higher number of parameters in the net, but gives often better results. A main reason is a better fit for more complex class topologies in the input space. For regression models, only one output neuron will be used. • Number of neurons per layer: defines the number of neurons for the hidden layer. • MLP: learning algorithm: defines the learning algorithms for the MLP net (see documentation of the Neural Network Toolbox).
7.15. Control elements for ’Data mining: Special methods’
117
• MLP: neuron type hidden layer: defines the type of neurons in the input layer of a MLP net (see documentation of the Neural Network Toolbox). • MLP: input weighting: describes the method to combine the input of a neuron with the weights. The option ”dotprod” uses a multiplication. • MLP: input function: describes the method to combine the weighted inputs of a neuron. The standard option ”netsum” adds all weighted inputs. • Error goal: defines the error goal for the neural net. If the goal is reached, the design process will be terminated. • Number of learning epochs: defines the maximum number of learning epochs for MLP nets (see documentation of the Neural Network Toolbox). • MLP: Visualization step width: defines the number of iterations between the visualizations of the MLP net. The value is only relevant if Control element: Data mining: Special methods - MLP: plot is activated. The design process of a neural net is restarted after each visualization with the last net as starting parameter. However, some internal strategy parameter for the design might be lost for some learning algorithms. Larger values mostly result in lower errors and faster convergence. • MLP: plot: switches plots for the recent learning progress of MLP nets on or off (see documentation of the Neural Network Toolbox). • Show training GUI: switches the use of the Learning GUI window of the Neural Network Toolbox on or off.
118
Chapter 7. Control elements
Figure 7.19: Control elements for Data mining: Special methods - Artificial Neural Networks- RBF
• Method: parameterizes a method for the design of a classifier or regression model. The elements are contextsensitive to the method selected by Control element: Data mining: Special methods - Method. • Artificial Neural Network: Type: sets the type of the Artificial Neural Network. The available options include a Multi Layer Perceptron Net (MLP) and a Radial Base Function Net (RBF). The nets are used from the Neural Network Toolbox of Matlab. • Number of neurons per layer: defines the number of neurons for the hidden layer. • Error goal: defines the error goal for the neural net. If the goal is reached, the design process will be terminated. • RBF: Spread: defines the spread of the Radial Base Function. A larger spread smoothes the function approximation. Too large spreads can cause numerical problems.
7.15. Control elements for ’Data mining: Special methods’
119
Figure 7.20: Control elements for Data mining: Special methods - Artificial Neural Networks- Feedforwardnet (MLP)
• Method: parameterizes a method for the design of a classifier or regression model. The elements are contextsensitive to the method selected by Control element: Data mining: Special methods - Method. • Artificial Neural Network: Type: sets the type of the Artificial Neural Network. The available options include a Multi Layer Perceptron Net (MLP) and a Radial Base Function Net (RBF). The nets are used from the Neural Network Toolbox of Matlab. • Number of layers: defines the number of hidden layers of feedforward nets. • Number of neurons per layer: defines the number of neurons for the hidden layer. • MLP: learning algorithm: defines the learning algorithms for the MLP net (see documentation of the Neural Network Toolbox). • Error goal: defines the error goal for the neural net. If the goal is reached, the design process will be terminated.
120
Chapter 7. Control elements
• Number of learning epochs: defines the maximum number of learning epochs for MLP nets (see documentation of the Neural Network Toolbox). • MLP: Visualization step width: defines the number of iterations between the visualizations of the MLP net. The value is only relevant if Control element: Data mining: Special methods - MLP: plot is activated. The design process of a neural net is restarted after each visualization with the last net as starting parameter. However, some internal strategy parameter for the design might be lost for some learning algorithms. Larger values mostly result in lower errors and faster convergence. • MLP: plot: switches plots for the recent learning progress of MLP nets on or off (see documentation of the Neural Network Toolbox). • Show training GUI: switches the use of the Learning GUI window of the Neural Network Toolbox on or off.
7.15. Control elements for ’Data mining: Special methods’
121
Figure 7.21: Control elements for Data mining: Special methods - Artificial Neural Networks- SOM
• Method: parameterizes a method for the design of a classifier or regression model. The elements are contextsensitive to the method selected by Control element: Data mining: Special methods - Method. • Artificial Neural Network: Type: sets the type of the Artificial Neural Network. The available options include a Multi Layer Perceptron Net (MLP) and a Radial Base Function Net (RBF). The nets are used from the Neural Network Toolbox of Matlab. • Number of neurons: defines the number of neurons per dimension for the design of Self Organizing Maps with Data mining - Self Organizing Maps - Design. The number is used for all dimensions, e.g., a value of 8 with a dimensionality of 2 means the design of a net with 8x8 neurons. • Dimension: defines the dimensionality for the design of Self Organizing Maps with Data mining - Self Organizing Maps - Design. • Number of learning epochs: defines the maximum number of learning epochs for MLP nets (see documentation of the Neural Network Toolbox). • Show training GUI: switches the use of the Learning GUI window of the Neural Network Toolbox on or off.
122
Chapter 7. Control elements
Figure 7.22: Control elements for Data mining: Special methods - Support Vector Machine
• Method: parameterizes a method for the design of a classifier or regression model. The elements are contextsensitive to the method selected by Control element: Data mining: Special methods - Method. • Use SVM-internal one-against-one or one-against-all: uses the internal decomposition of multi-class problems of the SVM toolbox. The function is faster and uses less memory compared to the external decomposition of SciXMiner. This external decomposition works with the one-against-one resp. the one-against-all option in Control element: Data mining: Classification of single features - Multi-class problems. • Kernel: defines the used kernel function for Support Vector Machines [18]. Homogenous polynomial kernels (without bias term), polynomial kernels (with bias term), and Gaussian radial base functions are implemented. The order is tuned by Control element: Data preprocessing - Kernel order. A first-order polynomial kernel means a linear hyperplane. • Kernel order: set the order of the kernel of the SVM. It is used for the classification with the SVM and by the SVM-based outlier detection. • Penalty term C: tunes the compromise between a small number of classification errors and the simplification of the hyperplanes to discriminate classes for the SVM. Larger values of C lead to a higher number of classification errors to simplify the hyperplanes.
7.15. Control elements for ’Data mining: Special methods’
• Epsilon: defines the width of the insensitive region of the loss function in Support Vector Regression.
123
124
Chapter 7. Control elements
Figure 7.23: Control elements for Data mining: Special methods - k-nearest-neighbor
• Method: parameterizes a method for the design of a classifier or regression model. The elements are contextsensitive to the method selected by Control element: Data mining: Special methods - Method. • k: defines the number of the k neighbors for the k-nearest neighbor classifier. • Metrics of k-NN: defines the metric to compute the nearest neighbors. • Distance weighting: enables a weighting of different distances. If ”None” is selected, all neighbors contribute equally to the decision (standard option). ”Inverse linear” prefers the nearest neighbor by a weighting with 1. The farthest of the k neighbors is weighted with 0. All neighbors between have an equidistant weighting, e.g. 0.25, 0.5 and 0.75 for k = 4. ”Inverse distance” uses 1/Distance as weight to prefer neighbors with smaller distances. A neighbor with distance 0 gets a maximum weight of 1/1E − 10. ”Inverse exponential” is similar but with more equal weights by using e−d with the distance d. • Region size: specifies the type of environment around a data point. If the option Control element: Data min-
7.15. Control elements for ’Data mining: Special methods’
125
ing: Special methods - Use all neighbors in a region was activated, all neighbors in the defined environment are included as neighbors (and not necessary only the k nearest). • Use all neighbors in a region: includes all neighbors in an environment defined by Control element: Data mining: Special methods - Region size. The classifier normalizes all values to an interval [0, . . . , 1]. Consequently, the value should be smaller than 1! If less than k neighbors are localized in the environment, only the k nearest neighbors are used. • Minimum neighbor number in max. distance: defines the minimum number of neighbors in a maximum accepted distance defined by Control element: Data preprocessing - Max. distance to make a decision. • Evaluate minimum number of neighbors: defines if a minimum number of neighbors in an environment (defined by a distance) should be used. If the number is not reached and the option is activated, the decision is set to rejection. The distance is tuned by Control element: Data preprocessing - Max. distance, the number by Control element: Data mining: Special methods - Minimum neighbor number in max. distance. • Max. distance: defines the accepted maximum distance for a neighborhood (see Control element: Data mining: Special methods - Evaluate minimum number of neighbors).
126
Chapter 7. Control elements
Figure 7.24: Control elements for Data mining: Special methods - k-nearest-neighbor (Toolbox)
• Method: parameterizes a method for the design of a classifier or regression model. The elements are contextsensitive to the method selected by Control element: Data mining: Special methods - Method. • k: defines the number of the k neighbors for the k-nearest neighbor classifier.
7.15. Control elements for ’Data mining: Special methods’
127
Figure 7.25: Control elements for Data mining: Special methods - Fuzzy classifier
• Method: parameterizes a method for the design of a classifier or regression model. The elements are contextsensitive to the method selected by Control element: Data mining: Special methods - Method. • Type of membership function: defines the algorithm for the design of a membership function (see Control element: Data mining: Special methods - Number of linguistic terms). ”Median” generates terms with approximately equal data point frequencies for all terms in the training data set. ”Equal distribution” generate terms with similar distances between the maximum values of the membership functions. ”Clustering” uses cluster prototypes as parameters. ”Fix” set the parameters of the membership functions to the values defined by Control element: Data mining: Special methods - Parameters MBF (fix). The choice ”with interpretability” rounds the found parameters using a method described in [76] to improve the interpretability. Remark: All design methods set the random number generator of Matlab to a fix value. It improves the reproducibility of found membership functions. Nevertheless, all methods with random elements might be sensitive to the state of the random number generator (e.g. cluster algorithms with random
128
Chapter 7. Control elements
start clusters). It can also influence other methods using these membership functions, e.g. by different selected features in a decision tree (e.g. Data mining - Selection and evaluation of single features - Information theoretic measures). • Number of linguistic terms: defines the desired number of linguistic terms for the design of the membership functions. The designed membership functions are standard partitions: The first and the last term have trapezoidal membership functions, middle terms triangular membership functions. The membership functions sum up to one for each value of the variable. The term number might be automatically reduced by the designed method, e.g. if only two different values exist and three terms should be designed. • Parameters MBF (fix): defines the parameters of the membership functions if ”fix” was chosen in Control element: Data mining: Special methods - Type of membership function. • Type of decision tree: defines the splitting criterion for the design of the decision tree. The type ID3 uses a maximized mutual information. The type C4.5 maximizes the mutual information divided by the input entropy. In addition, a statistical correction of the entropy can be chosen. It reduces the influence of an overestimation of feature relevances for small training data sets and avoids overfitted trees. All trees use the design fuzzy membership functions instead of computed binary splits for each node. • One-against-all-trees: uses C different decision trees for the rule generation. The trees are generated by a one-against-all approach of a class against all other classes. • Exponent for clearness: defines the evaluation method for the pruning of fuzzy rules [76]. An increasing clearness prefers highly specialized error-free rules to more generalized rules with some errors. • Inference: defines the inference method for the fuzzy system. The MIN-MAX inference uses the minimum operator for all conjunctions (e.g. for the aggregation) and the maximum for all disjunctions (e.g. for the accumulation of all rules with identical conclusions. The SUM-PROD inference uses the bounded sum for all disjunctions and the product for all conjunctions. An additional correction of overlapping rules [75] was implemented for artifacts by rules with the same or concurrent conclusions in case of the SUM-PROD inference. • Number of rules for a rulebase: defines the maximal number of selected rules in a fuzzy rulebase. • Looking for cooperating rules from rulebase: switches the search for cooperating rule bases on or off. If the option is off, all found single rules are used for classification or regression. • Significance level: influences the statistical evaluation of fuzzy rules. Values towards 100 % tends to the generation of only few, but very confident rules.
7.15. Control elements for ’Data mining: Special methods’
129
Figure 7.26: Control elements for Data mining: Special methods - Decision tree
• Method: parameterizes a method for the design of a classifier or regression model. The elements are contextsensitive to the method selected by Control element: Data mining: Special methods - Method. • Type of membership function: defines the algorithm for the design of a membership function (see Control element: Data mining: Special methods - Number of linguistic terms). ”Median” generates terms with approximately equal data point frequencies for all terms in the training data set. ”Equal distribution” generate terms with similar distances between the maximum values of the membership functions. ”Clustering” uses cluster prototypes as parameters. ”Fix” set the parameters of the membership functions to the values defined by Control element: Data mining: Special methods - Parameters MBF (fix). The choice ”with interpretability” rounds the found parameters using a method described in [76] to improve the interpretability. Remark: All design methods set the random number generator of Matlab to a fix value. It improves the reproducibility of found membership functions. Nevertheless, all methods with random elements might be sensitive to the state of the random number generator (e.g. cluster algorithms with random
130
Chapter 7. Control elements
start clusters). It can also influence other methods using these membership functions, e.g. by different selected features in a decision tree (e.g. Data mining - Selection and evaluation of single features - Information theoretic measures). • Number of linguistic terms: defines the desired number of linguistic terms for the design of the membership functions. The designed membership functions are standard partitions: The first and the last term have trapezoidal membership functions, middle terms triangular membership functions. The membership functions sum up to one for each value of the variable. The term number might be automatically reduced by the designed method, e.g. if only two different values exist and three terms should be designed. • Type of decision tree: defines the splitting criterion for the design of the decision tree. The type ID3 uses a maximized mutual information. The type C4.5 maximizes the mutual information divided by the input entropy. In addition, a statistical correction of the entropy can be chosen. It reduces the influence of an overestimation of feature relevances for small training data sets and avoids overfitted trees. All trees use the design fuzzy membership functions instead of computed binary splits for each node. • Significance level: influences the statistical evaluation of fuzzy rules. Values towards 100 % tends to the generation of only few, but very confident rules.
7.15. Control elements for ’Data mining: Special methods’
131
Figure 7.27: Control elements for Data mining: Special methods - Polynom
• Method: parameterizes a method for the design of a classifier or regression model. The elements are contextsensitive to the method selected by Control element: Data mining: Special methods - Method. • Polynomial degree: defines the maximal degree m of a polynomial function y = a0 + a1 x + ... + am xm . • Set a0 to zero: forces a polynomial regression model to estimate a model without a constant term called a0. • Maximal number of internal features: enables an internal feature reduction during the computation of the polynomial model. It is useful especially for the selection of terms with the most relevant power coefficients. • Weight matrix: selects a weighting matrix for data points during a Least Square estimation. ”None” uses equal weights (1), ”inverse proportional to class frequency” prefers data points from rare linguistic terms of the selected output variable.
132
Chapter 7. Control elements
Figure 7.28: Control elements for Data mining: Special methods - Curve fit (MATLAB)
• Method: parameterizes a method for the design of a classifier or regression model. The elements are contextsensitive to the method selected by Control element: Data mining: Special methods - Method. • Fit: specifies the method for the interpolation with the MATLAB function fit (part of the Curve Fitting Toolbox). For more details type ”help fit” in the MATLAB command window. The following methods are implemented (in parentheses: number of input variables and specialties): weibull (1D, no negative inputs), exponential (1D), fourier (1D), gauss (1D), cubicinterp (1D or 2D, no interpolation), pchipinterp (1D, no interpolation), poly curve (1D or 2D), power (1D, no negative inputs), rational (1D), sinus (1D), cubicspline (1D, no interpolation), smoothingspline (1D), biharmonicinterpolation (2D), local linear regr (2D), local quadratic regr (2D). • Parameter 1: select context-sensitive the first parameter for the selected method in Control element: Data mining: Special methods - Fit. This parameter is not used by every method. • Parameter 2: select context-sensitive the second parameter for the selected method in Control element: Data mining: Special methods - Fit. This parameter is not used by every method.
7.15. Control elements for ’Data mining: Special methods’
133
Figure 7.29: Control elements for Data mining: Special methods - Association analysis
• Method: parameterizes a method for the design of a classifier or regression model. The elements are contextsensitive to the method selected by Control element: Data mining: Special methods - Method. • Ignore output variables with many terms: defines the number of linguistic terms to ignore output variables with many terms (e.g., names or IDs) in an association analysis. • Number of rules: defines the maximum number of rules for an association analysis. • Minimum support: defines the minimal support P(A AND B) of a rule IF A THEN B. • Minimum confidence: defines the minimal confidence P(B|A) of a rule IF A THEN B. • Sorting: defines the sorting order for the found rules by support or by confidence.
134
7.16
Chapter 7. Control elements
Control elements for ’Data mining: Statistical options’
Figure 7.30: Control elements for Data mining: Statistical options
• Type for correlation parameters: defines the type of correlation (Linear: Pearson; Rank-oriented: Kendall, Spearman) to be used in visualizations or output files for correlations. • Threshold for correlation coefficient: defines a threshold for the correlation coefficient. A larger value is interpreted as a relevant pairwise correlation between two features. This value influences e.g. the listing of relevant correlation coefficients or the downgrading of correlated features in the feature selection. • Show correlation only for one selected feature: computes only the correlations of all selected single features to the feature defined by Control element: Data mining: Regression - Output variable of regression. • p-value for t test: defines the p-value for the t-test (accepted error probability of a statistical test). Usual values are 0.01...0.05. • Show all: defines whether all tested or only significant different single features (measured by the t-test) for the output variable should be shown.
7.16. Control elements for ’Data mining: Statistical options’
135
• Bonferroni correction: defines if statistics tests and correlations are computed with or without (”no”) corrections for multiple testings. A Bonferroni corrections divides the α values in Control element: Data mining: Statistical options - p-value for t test by the number of tests. The less conservative BonferroniHolm correction divides α by the number of test - the ranking of the tested values + 1. It accepts all successful tests before the first rejected test. • Test of normal distribution: selects a methods to test the normality of a distribution using Data mining - Selection and evaluation of single features - Test of normal distribution. Possible values are Chi Square Test, Lillie Test, Anderson Darling Test and Jarque Bera Test from the MATLAB Statistics Toolbox. • Show p values for correlation: defines the option for the reporting of p-values for correlation coefficients unequal zero in the correlation visualization (View - Single features - Correlation coefficients (Pearson) etc.). • Norm (Data point distances): select the used norm to compute data point distances.
136
7.17
Chapter 7. Control elements
Control elements for ’Data mining: Validation’
Figure 7.31: Control elements for Data mining: Validation
• n-fold cross-validation: defines the number n of parts for a n-fold cross-validation. As an example, a value of 10 means that the training data set is separated in 10 parts. For each run, 9 parts are used as training data and one part as validation data set. Consequently, a complete trial of a cross-validation requires 10 runs containing each selected data point exactly one times in the validation data set. Typical values are n = 2 . . . 10. The value will be ignored for the selection of ’Leave-one-out’ (n is equal to the number of selected data points) or ’Bootstrap’ in Control element: Data mining: Validation - Validation strategy. • Number of trials: defines the number of trials for a cross-validation. Internally, a random assignment of data points to the different parts will be chosen. This assignment takes the output variables into account to get an approximately equal distribution of linguistic output terms for the different parts. As a consequence, the results of different trials will differ. A higher number of trials costs computing time, but improves the estimation for the classification accuracy. Typical values are 1...50 depending on the necessary computing time. The value will be ignored for the selection of ’Leave-one-out’ in Control element: Data mining: Validation - Validation strategy (always 1 due to the deterministic selection of training data).
7.17. Control elements for ’Data mining: Validation’
137
• Validation strategy: switches the validation type between cross-validation, leave-one-out (N -fold cross-validation with the number N of selected data points and exactly one data point in each validation data set) and bootstrap method (training data set: random selection of data points with replacement resulting usually in a multiple selection of some data points, validation data set: all none selected data points) (see e.g. [29]). • Plot in file: controls if the validation results are written into a protocol file or not. • Crossvalidation (separated by classes): use the classes of the selected output variables to split the dataset. As a consequence, the data points belonging to a class are used as validation dataset, all other data points as training dataset. As usual for a crossvalidation, this split is rotated so that each selected data points is used exactly once as in the validation dataset.
138
7.18
Chapter 7. Control elements
Control elements for ’General options’
Figure 7.32: Control elements for General options
• TEX protocol: generates most generated protocol files in a LATEXformat. Otherwise, ASCII files are produced. • For tex tables: show tabularx: switches the tabularx style in the generation of Latex tables on or off. • Memory-optimized feature generation: modifies the algorithm for feature extraction from time series. If the option is chosen, the computing time for extraction increases and the risk of memory problems decreases. • Percentages 2D histogram: switches the generation of percentage information (per row and per column) in the file containing quantitative information of 2D histograms on or off. • Save options by saving the project: switches the saving of options (all GUI elements) on or off, if a project is saved. • Show tool tips: switches the context-sensitive help for control elements on or off, if the mouse arrow is over an element.
7.18. Control elements for ’General options’
139
• Invisible figures in SciXMiner batch files: hides all figures during execution of a SciXMiner batch file. This option is useful for parallel working on the same computer without disturbances of opening figures. The SciXMiner main figure is also hidden. If a batch file stops by error, the hidden figures can be restored by the input of the command ”restore_figures” in the MATLAB command window. • Detail plot of function interna: influences the level detail for some texts and figures with intermediate results (marked = more details). • Show menu tips: if activated, a short description of the clicked menu item is shown as part of the project overview (Control elements: Project overview). • Show short protocol: switches off the complete listing for all control elements in the protocol files. Here, only some project characteristics are written into the files. • For macros: plot always in current figure: plots all visualizations in the recent figure. This option is useful for the generation of user-defined subplots in macros. However, it requires a manual modification of the macro with figure and sub-figure commands. Otherwise, figures are overwritten without any warning. • Project names as part of the variable names: adds project names during the project fusion for new single features and time series to mark the source project of a single feature or time series. • For macros: stop if error: switches off the error handling with try/catch in macros. It allows a better backtracking of error messages. • Output variable: few terms first: shows in View - Classes for selected data points the output variables with only few terms first. This option is useful in projects with many linguistic terms and data points. • Open files in MATLAB editor: defines whether generated text files (e.g., for feature evaluation) will be immediately opened by the MATLAB editor or not. • Number format for result plots: defines the format of numbers for most visualization and protocol functions, especially the number of digits before and after the decimal point . ”%g” is the automatically chosen standard Matlab format, ”%f” means floating points. The parameter does not influence export functions. • Name conventions for feature generation: defines the name conventions for extracted features. Possible options are a combination of name fragments by blanks or underscores. • File type for images: defines the file type for the hardcopy of all open figures into files. The abbreviations are the same as for the MATLAB print command. The EPS format is subdivided into black-and-white images (eps) and color images (epsc).
140
Chapter 7. Control elements
• Manual selection of data points: sets the numbers of data points for the selection with Edit - Select - Data point from GUI. • Percent for selection: defines the percentage of selected data points by using Edit - Select - Random data points (defined percentage of selected data points). • Save mode for MATLAB file: defines the compatibility mode for binary MATLAB files. ’-V6’ is compatible to the MATLAB versions 5 and 6, ’-V7.0’ to version 7 and ’-V7.3’ to version 7.3. For lower versions, only a reduced set of modes is available. • Load plugins at start: defines the modus of loading and initializing of plugins for feature extraction during loading a project: never, always, only if the project contains time series or images. • Order of linguistic terms: defines a new order for the linguistic terms of the selected output variable. The resorting is done by Edit - Convert - Resort linguistic terms (order from GUI). • Configuration name for MATLAB parallel: defines the name of the configuration for the MATLAB Parallel Computing Toolbox that can be started by Extras - Matlab Parallel - Start (see also Parallel - Manage Configurations in the menu of the MATLAB command window).
8 Feature extraction from time series 8.1
Definition of feature types by plugins
The feature extraction of time series is realized with plugins. Please notice that SciXMiner was actually developed in German language, so some variable names are German. Unfortunately, it was impossible to change this inconvenience. Plugins are single Matlab functions named plugin_*.m, which are included in a special directory of the SciXMiner installation (...\scixminer\plugins\mgenerierung) or in the directory which contains the loaded project. To work with SciXMiner properly, they have to abide by the following format: function [datenOut, ret, info] = pluginfct(paras, datenIn). The return value info contains the following elements: • info.beschreibung: short description of the new feature with one or two words (e.g. minimum, maximum, velocity). Only one description is allowed, independent from the numbers of computed features. The description must not start with a hyphen (minus)! • info.bezeichner: short identifier of the new feature (e.g. MIN, MAX, V). The matrix has to contain one identifier per feature or time series (every row is a single identifier). Use str2mat(’String’,’OtherString’) to create a matrix with one identifier per row. • info.explanation: explanation of the plugin (approx. 1-2 sentences) • info.explanation_long: optionally an additional longer text, used only for documentation • info.anz_zr: numbers of time series extracted by the plugin (has to be 0, if info.anz_em 6= 0) • info.anz_benoetigt_zr: numbers of time series needed for the computation of the new time series. If > 1 the first anz_benoetigt_zr time series are always given to the plugin. The plugin have to check the correct amount of time series! If the plugin is able to deal with an arbitrary amount of time series (e.g. computation of minimum), use Inf for anz_benoetigt_zr. • info.anz_em: numbers of features extracted by the plugin (has to be 0, if info.anz_zr 6= 0) • info.anz_benoetigt_em: number of input single features of the plugin (will be used in future versions) • info.anz_im: number of images generated in the plugin (only used together with Image Extension Package)
142
Chapter 8. Feature extraction from time series
• info.anz_benoetigt_im: number of images needed for the generation of new images or single features (only used together with Image Extension Package) • info.callback: optional callback function to avoid the transfer of images into functions (only used together with Image Extension Package)1 • info.einzug_OK: If the plugin is able to deal with intervals other than the complete time series, set einzug_OK to 1, otherwise to 0. For a description of intervals, see Section 8.4). • info.richtung_entfernen: special parameter for plugins for the gait analysis. Removes identifier "left" or "right" if this variable is set to 1. The default is 0. • info.typ: specifies the type of the result: ’TS’: time series, ’SF’: feature. The type ’Norm’ requires additional normative data. For images, the additional types ’IM’ (image) and ’IMSlice’ (3D stack of images) are in preparation. A plugin must not extract both time series and features. Missing info elements are replaces by standard entries if it is possible. Plugins can contain parameters. Here, the use of one or more plugin parameters with edit or popup elements is possible. For each parameter p, the following definitions exist: • info.commandline.description{p}: name of the parameters • info.commandline.parameter_commandline{p}: default value (string, number or vector of numbers; scalar for popup elements means number of the selected string) • info.commandline.popup_string{p}: string with alternatives, e.g. ’yes|no’ (only for popup elements) • info.commandline.tooltext{p}: text for tool tips • info.commandline.wertebereich{p}: possible range for numbers in edit elements, the two elements means the minimum and maximum value, e.g. {1 Inf }. The use of variables is possible, e.g. {1 ’paras.par.laenge_zeitreihe’ } for the length of the time series • info.commandline.ganzzahlig{p}: optional restriction for the use of integer values in edit elements, if the value is 1 • info.commandline.format{p}: ignoring of the internal format supervision, if the value is ”any” The parameters are defined using Control element: Plugin sequence - Plugin parameter for the recent selected plugin in Control element: Plugin sequence - Selection of plugins resp. Control element: Plugin sequence - Selected plugin sequence. The change between different parameters of a plugin is done using Control element: Plugin sequence - No.. All parameters can be modified using a macro. In a plugin, the access to the parameters is possible with paras.parameter_commandline{2} for the second parameter etc. The inputs are as follows: • datenIn 1 Operations on images needs more time if images are transferred to functions. As an alternative, the callbacks are used in plugin sequences to allow a direct access to the variable myimage in the workspace.
8.1. Definition of feature types by plugins
143
– datenIn.dat: matrix of the input data (size paras.par.anz_dat × sample points in interval × info.anz_benoetigt_zr). The third dimension is missing, if info.anz_benoetigt_zr == 1! – datenIn.ref : data of a reference.) • paras – paras.par: par vector from SciXMiner – paras.code: currently selected output variable – paras.code_alle: all output variables – paras.var_bez: identifier of time series – paras.merk_red: number of features to select – paras.einzuege: interval from which the data has been copied out of the complete time series (size 1 × 2) – paras.ind_zr_merkmal: indices of selected time series (size 1× anz_benoetigt_zr). – paras.anz_gew_merk: number of selected time series – paras.parameter: SciXMiner parameter struct (contains options from the GUI) – paras.parameter_commandline: cell array with values of the plugin parameters The parameters are set in the file "merkmalsgenerierung_plugins.m". One can add new elements to the parameter struct. Use the Matlab command isfield to check, whether an element exists in the struct. The following elements has been added for some plugins: – iirfilter: parameter for an IIR-Filter (included due to plugin_iirfilter) – iirfilter_aS_aL_aSigma: Some plugins (e.g. Trend and standard deviation estimation) use multiple IIR-Filters – abtastfrequenz: sampling rate of the time series [Hz] – samplepunkt: single sample for the computation of a new feature (e.g. extraction of a specific sample out of a given time series If the plugin is called with an empty matrix for datenIn, the info-Struct has to be returned by the plugin. datenOut and ret remain empty. This proceeding is necessary to query some information about the existing plugins. The paras-Struct is always committed by the calling function. The first rows of the plugin could be: info = struct(’identifier’, ’MIN’, ’anz_zr’, 1, ... ’anz_em’, 0, ’typ’, ’ZR’, ...); if (nargin < 2 | isempty(datenIn)) datenOut = []; ret = []; return; end;
The outputs have to contain the following elements: • datenOut: – datenOut.dat_zr: new time series, if the plugin extracts time series (size paras.par.anz_dat × paras.par.laenge_zeitreihe × info.anz_zr). Empty otherwise.
144
Chapter 8. Feature extraction from time series
– datenOut.dat_em: new features, if the plugin extracts features (size paras.par.anz_dat × info.anz_em). Empty otherwise. • ret: – ret.ungueltig: set to 1, if the extraction of the feature or time series has failed. The result of the plugin is not accepted by SciXMiner. – ret.bezeichner: contains the identifier of the time series or features if the amount of extracted time series or features depends on parameters in the GUI (e.g. Principal Component Analysis or IIR-Filter). If this element exists and is not empty it is used as identifier instead of the identifier from the info-Struct. The identifier from the info-Struct must not be changed.
8.2
Standard plugins in SciXMiner
A list of include plugins in the standard installation of SciXMiner is shown in Section H. In a project, the list of all available plugins can be shown by Control element: Plugin sequence - Show plugins.
8.3
Plugins for single features from single features
Plugins for the extraction of new single features from existing single features are not yet implemented in a formal way. Two different alternatives exist: • implementation of individual plugins via macros (see two examples in the directory standardmakros: feature_plugin_div2.makrog for the division of two selected single features and feature_plugin_log.makrog to compute the logarithm of all selected features) • computing aggregated features (see Edit - Extract - Single features -> Single features (with the selected feature aggregation from Options-Data Mining: Classification of single features))
8.4
Defining intervals via files
Intervals are used to restrict the feature extraction to specific sample points of the time series (only available for plugins with info.einzug_OK = 1. After loading a SciXMiner project, all *.einzug files in the current directory and in the subdirectory plugins/einzuggenerierung of the SciXMiner installation are imported. An interval file is an ASCII file including a chart of the intervals. The rows are separated with line breaks, columns with tabs. To avoid an empty interval do not add a line break after the last interval. The first row of the file has to include the following four column names (separated by tabs): Identifier
Short Identifier
Start
The intervals can be defined in the following rows, e.g.: Standphase Schwungphase
ST_P SW_P
1 [FootOff] [FootOff]+1 -1
Stop
8.5. Definition of a feature ontology by categories
145
Special features are: • In the definition, features and mathematical operations can be used, e.g. [OppositeFootOff]+([OppositeFootContact]-[OppositeFootOff])/2. Pay attention, that used features exist in the project! • The end of a time series can be labeled by -1 or maxtime. Function calls or variables from the Matlab workspace can not be used.
8.5
Definition of a feature ontology by categories
Categories are useful to define an ontology for single features and time series. Here, similar features and time series can be grouped into classes. They defined one or more categories. Such categories might be used in different analysis and visualization functions (see [64, 114]). The assignment to categories can be done by plugins, segments, or name fragments. It is defined in one or more files with the extension *.categories. Here, all files in the current working directory or in the subdirectory ”plugins/mgenerierung” of SciXMiner or a user-defined extension package are considered. These functions are text files and have a pre-defined format: #CategoryName ’Temporal derivation’ #DefaultTermName ’No’ #TermName ’Velocity’ #TermRelevance 0.8 ’plugin_geschwindigkeit’ ’plugin_geschwindigkeit_kausal’ ’_V’ ’ V ’ #TermName ’Acceleration’ #TermRelevance 0.6 ’plugin_beschleunigung’ ’_A’ ’ A ’ The following key words are used: • #CategoryName: name of the category. • #TermName: name of a term of the recent category followed by a string. In the next rows, identifiers for a mapping of time series or single features are defined. Such identifiers can be name fragments (e.g. ’_V’), names of used plugins (e.g. ’plugin_geschwindigkeit’) or names of segments using the key word einzug_short_description (e.g. einzug_ST_P). Consequently, each time series or single feature containing any of these identifiers belongs to the
146
Chapter 8. Feature extraction from time series
term ’Velocity’ of the category ’Temporal derivation’ if ’_V’ is part of the name, the plugin ’plugin_geschwindigkeit’ was used for feature extraction by Edit - Extract - Time series -> Time series, Time series -> Single features.... • #DefaultTermName (optional): defines the name for the default term. It used if as time series or a single feature does not belong to an other term of the category. Its standard name is ’unknown’. • #TermRelevance (optional): defines the a priori relevances for the recent term. It might be defined with one or two values between zero and one separated by a space. The first value is the interpretability weighted by the exponent alpha, the second the implementability weighted by the exponent beta. If the values are missing, the standard value is one.
9 Conclusions and perspectives This manual describes the functionality of the open source Matlab toolbox SciXMiner. The aim of this toolbox is to provide an interface to apply and compare data mining methods. The architecture of the toolbox is chosen in a way that the developer crew from Karlsruhe, Germany and/or other developer crews are easily able to enlarge the toolbox by further algorithms. Everyone is kindly invited to support the further development of SciXMiner. Thanks: Thanks to all the busy programmers, developers of algorithms, testers, especially to Rüdiger Alshut, Alessandro Angelin, Martin Ashby, Sebastian Beck, Sebastian Braun, Ole Burmeister, Joachim Dieterle, Patrick Gerland, Sebastian Gollmer, Andreas Gommlich, Lutz Gröll, Markus Grube, Eduard Hübner, Jens Jäkel, Sina Keller, Thilo Krüger, Jessica Legradi, Tobias Loose, Mihai Lipovei, Jörg Matthes, Dimitrios Patikas, Sebastian Pfeiffer, Tim Pychynski, Matthias Schablowski, Oliver Schill, Martin Wieland, Sebastian Wolf, Mohamed Zayani and Baifan Zhou. The support by the Deutsche Forschungsgemeinschaft (German research association) within the project ’Diagnosis support in gait analysis” was a great help to build the gait analysis-specific part and thus, to build a basis for the further development of the toolbox. The Collaborative Research Center for Humanoid Robots, also sponsored by DFG, has inspired us to many technical applications. The present contribution was supported by the Helmholtz Association in the program ”BioInterfaces in Technology and Medicine” and under the Joint Initiative “Energy System 2050– A Contribution of the Research Field Energy”.
147
A Important file structures • A SciXMiner batch file (*.batch) is an ASCII file. It contains directories, projects, options and macros for automated analyses. • A classifier file (*.class) is a Matlab file. It contains data to apply a designed classifier as klass_single struct array. It includes the selected single features, aggregation transformations and the classifier itself as well as chosen standardizations. The mapping of single features and of the output variables uses the feature names. One-against-x classifiers are described by a vector- shaped klass_single struct. • A frequency list file (*.freq) is a Matlab file. It contains a struct freqlist with two substructs: freqlist.segments characterizes segments with elements freqlist.segments.f (vector with two elements for the lower and the upper frequency) and .name (segment name). freqlist.multiples characterizes overtones with freqlist.segments.f (scalar for frequency), .ftol (tolerance for overtones) and .name (overtone name). An example is shown in sounds.freq in the directory standardmakros. • A fuzzy system file (*.fuzzy) is a Matlab file. It contains membership functions and a fuzzy rulebase. The mapping to single features and to the output variable is done by variable names. • A segment file (*.einzug) is an ASCII file. It defines segments for the feature extraction from time series (see Section 8.4 for details). • A macro file (*.makrog) is a text file containing a sequence of pushed menu items and control elements. This file can be manually modified, e.g. by adding other Matlab commands. • A plugin sequence file (*.plugseq) is (binary) Matlab file. It contains a plugin sequence with plugin parameters. • A SciXMiner project file (*.prjz) is a (binary) Matlab file. It contains at least the three-dimensional matrix of time series (d_orgs) or the matrix with single features (d_org). In addition, some additional data can be included as e.g. names of time series. This file can be loaded and saved using the SciXMiner GUI or the Matlab command window (see Section 4.2.3). • A LATEXfile (*.tex) is an ASCII file containing various results. It is prepared to be included using LATEX. The user can switch between normal text files and LATEXfiles with the control element Control element: General options - TEX protocol. Some examples for result protocols are rule bases (*_cp*.tex), feature relevances (*_alle_merkmale.tex, *_besten_merkmale.tex), mean values (*_MWST.tex) or correlation coefficients (*_CORR.tex). • A text file (*.txt) is an ASCII file containing various results. It can be opened with any text editor. The user can switch between text files and LATEXfiles with the control element Control element: General options - TEX protocol. The results are similar to LATEXfiles.
149
• An option file (*.uihdg) is a Matlab file containing all options defined by the control elements in Chapter 7.
B Important internal data structures Please notice that SciXMiner was actually developed in German language. From this time, some variable names are German. Unfortunately, it was impossible to change this inconvenience. Name bez_code cluster_ergebnis code
Dimension (sy , any) (Struct) (N, 1)
code_alle
(N, sy )
d_org d_orgs
(N, s) (N, K, sz )
dorgbez
(s, any)
fuzzy_system gaitcad_extern
(Struct) (Struct)
ind_auswahl interpret_merk
(Nred , 1) (s, 1)
interpret_merk_rett
(s, 1)
klass_single klass_zr L
(Struct) (Struct) (Struct)
Remarks Vector (string array) with names of output variables Struct for results and parameters of cluster methods Vector of the selected output variable, classes must be coded as serial integer values between 1 and my Matrix of all existing output variables, classes must be coded as serial integer values between 1 and my code contains a redundant copy for the selected output. Matrix of single features Matrix of time series (WARNING! Definition as global variable to avoid memory problems due to multiple copies in the called functions) Matrix (string array). The rows contain names of single features. If the names are not defined in the project, standard names as x1 ... xs are chosen Struct for a designed fuzzy system Struct for different variables (especially for macros and SciXMiner batch files), which are reloaded after the start of SciXMiner Indices of selected data points a priori relevances of single features (set to an empty variable by deactivation of Control element: Single features - A priori feature relevances) saved a priori relevances of single features (are not changed by deactivation of Control element: Single features - A priori feature relevances, but are necessary to restore interpret_merk after (re-activation)) Struct with settings and parameters for feature classifiers Struct with settings and parameters for time-series classifiers Struct with settings for decision theory. It can be initialized as empty. At the moment in use: L.ld: Matrix of decision costs for the recent output variable, L.ld_alle (struct): Matrix of decision costs of all output variables
151
Name makro_lern
Dimension (1, any)
makro_test
(1, any)
mu_y
(N, my )
parameter
(Struct)
pos
(N, 1)
prz
(N, 1)
var_bez
(sz , beliebig)
zgf
(s + 1, max(ml , my ))
zgf_bez
(s + 1, max(ml , my ))
zgf_y_bez
(sy , max(my,i ))
Remarks contains the macro as string, which is used for the design of classifier in a validation process contains the macro as string, which is used for the application of classifier in a validation process matrix, membership values of the estimated output variable as a result of the fuzzy analysis Struct with parameters about the project. A detailed description is given later-on in this chapter contains the estimated class membership for a chosen classifier. Data points which are not classified are marked with 0. contains the relative probability for a class estimation. Data points which are not classified are marked with 0. matrix (string array), rows contain the denotations of the time series. They are set to standard terms, if they are not defined within the project file. After the last row of this variable the output variable is appended. parameter of the membership functions (MBF) of the linguistic terms of the s features and of the output variable in the element s + 1, features: only trapezoid MBFs at the margins and triangular MBFs for all others permitted, output variable: singletons array, contains the denotation of the linguistic terms of the s features and of the output variable in the element name. It is set to standard terms if it is not defined within the project file. array, contains the denotations of the linguistic terms of the output variables in the element name. It is set to standard terms if it is not defined within the project file.
The parameter-Struct contains three elements, allgemein, gui, projekt. These elements again contain Structs. parameter.allgemein contains general information about paths, extensions, and status variables. parameter.gui encapsulates manages the control elements and contains variables, which correspond to the control elements. By encapsulated functions it is ensured, that these variables always contain the current content. Furthermore, the setting of these variables and the following actualization of the graphical user interface is implemented, too. parameter.projekt contains values of the recent project, for instance file name, path of the project and further status variables. In parameter.projekt.abtastfrequenz the sampling frequency of the time series within the project may be saved.
C Needed Standard Toolboxes Some functions need standard toolboxes from Matlab: the Signal Processing Toolbox is used • to filter time-series (functions filter and butter), • to calculate spectrograms (function specgram), • to calculate Cross and Auto Correlation Functions (function xcorr), • to calculate Matlab wavelet decompositions (function interp) and • to import time series with varying lengths (function resample) The use of resample is checked when time-series are imported. If an error occurs, a warning will be displayed and the import is proceeded with appended zeros. The Neural Network Toolbox is necessary, to calculate and apply a Artificial Neural Network as classifier. The Statistic Toolbox is necessary, • to calculate paired or an unpaired t-test, • to use k-NN classifiers from this toolbox with other metrics than the Euclidean (function pdist) and • to use the cluster-function (out of this toolbox). The Wavelet Toolbox is needed, to do a Matlab wavelet decomposition. If this toolbox is not available, a SciXMiner-integrated version may be used.
D Included External Toolboxes (GNU-License)
3
6
9
12
ICA − T o o l b o x % FastICA f o r Matlab 5 . x % V e r s i o n 2 . 1 , J a n u a r y 15 2001 % Copyright ( c ) %Hugo G ä v e r t , Jarmo H u r r i , J a a k k o S ä r e l ä , and Aapo H y v ä r i n e n (GNU−GPL ) . f a s t i c a .m f p i c a .m p c a m a t .m remmean .m w h i t e e n v .m −−−−−−−−−−−−−−−−−−−−−−−−−−−−−−−−−−−−−−−−−−−−−−−−−−−−−−−−−−−−−−−−−−−−−−−−
15
18
21
24
27
30
% SVM and K e r n e l Methods M a t l a b T o o l b o x \ c i t e { Canu03 } % h t t p : / / a s i . i n s a −r o u e n . f r / ~ a r a k o t o m / t o o l b o x / i n d e x . h t m l % C o p y r i g h t S CANU − sc anu@ insa −r o u e n . f r (GNU−GPL ) c o u t .m monqp .m s v m c l a s s .m s v m k e r n e l .m s v m m u l t i c l a s s .m s v m m u l t i c l a s s o n e a g i a n s t o n e .m s v m m u l t i v a l .m s v m m u l t i v a l o n e a g i a n s t o n e .m svmreg .m s v m v a l .m −−−−−−−−−−−−−−−−−−−−−−−−−−−−−−−−−−−−−−−−−−−−−−−−−−−−−−−−−−−−−−−−−−−−−−−−
33
36
39
SOM T o o l b o x % V e r s i o n 2 . 0 b e t a , May 30 2002 % C o p y r i g h t 1997 −2000 by Esa A l h o n i e m i , J o h a n Himberg , % J u h a P a r h a n k a n g a s and J u h a V e s a n t o (GNU−GPL ) % h t t p : / / www. c i s . h u t . f i / p r o j e c t s / s o m t o o l b o x / knn .m s o m _ e u c d i s t 2 .m v i s _ v a l u e t y p e .m
42
−−−−−−−−−−−−−−−−−−−−−−−−−−−−−−−−−−−−−−−−−−−−−−−−−−−−−−−−−−−−−−−−−−−−−−−−
154
Appendix D. Included External Toolboxes (GNU-License)
lp_solve 5.5.0.7 45
48
% % % % %
http : / / lpsolve . Co−d e v e l o p e r s Licence terms Citation policy
sourceforge . net / 5 . 5 / : Michel Berkelaar , K j e l l Eikland , P e t e r N o t e b a e r t : GNU LGPL ( L e s s e r G e n e r a l P u b l i c L i c e n c e ) : G e n e r a l r e f e r e n c e s a s p e r LGPL Module s p e c i f i c r e f e r e n c e s a s s p e c i f i e d t h e r e i n
51
54
57
60
mxlpsolve . d l l lpsolve55 . dll m x l p s o l v e .m l p _ m a k e r .m The ∗ . DLL h a v e t o be c o p i e d i n < m a t l a b r o o t > / b i n / ! −−−−−−−−−−−−−−−−−−−−−−−−−−−−−−−−−−−−−−−−−−−−−−−−−−−−−−−−−−−−−−−−−−−−−−−− Kolmogorov−Smirnov−T e s t f o r d i s t r i b u t i o n s % Armin G ü n t h e r , U n i v e r s i t ä t G r e i f s w a l d , Germany
63
k s t e s t .m 66
69
72
75
78
81
−−−−−−−−−−−−−−−−−−−−−−−−−−−−−−−−−−−−−−−−−−−−−−−−−−−−−−−−−−−−−−−−−−−−−−−− XML r e a d (BSD l i c e n c s e ) %J a r e k T u s z y n s k i , SAIC %h t t p : / / www. mathworks . com / m a t l a b c e n t r a l / f i l e e x c h a n g e /12907 − x m l i o t o o l s x m l r e a d .m −−−−−−−−−−−−−−−−−−−−−−−−−−−−−−−−−−−−−−−−−−−−−−−−−−−−−−−−−−−−−−−−−−−−−−−− F i s h e r e x t e s t : Fisher ’ s Exact P r o b a b i l i t y Test %T r u j i l l o −O r t i z , A . , R . Hernandez −Walls , A . C a s t r o −P e r e z , L . %R o d r i g u e z −Cardozo , N . A . Ramos−D e l g a d o and R . G a r c i a −S a n c h e z . %(2004) . F i s h e r e x t e s t : F i s h e r ’ s E x a c t P r o b a b i l i t y T e s t . A %MATLAB f i l e . [WWW document ] . h t t p : / / www. mathworks . com / %m a t l a b c e n t r a l / f i l e e x c h a n g e / l o a d F i l e . do ? o b j e c t I d =5957 f i s h e r e x t e s t .m
84
−−−−−−−−−−−−−−−−−−−−−−−−−−−−−−−−−−−−−−−−−−−−−−−−−−−−−−−−−−−−−−−−−−−−−−−− VAT ( v i s u a l a s s e s s m e n t o f t e n d e n c y ) − an a l g o r i t h m t o i m p r o v e t h e v i s u a l i z a t i o n of data point d i s t a n c e matrices 87
% C o p y r i g h t by Timothy Havens , M i c h i g a n Tech % h t t p : / / www. e c e . mtu . edu / ~ t h a v e n s / c o d e /VAT .m 90
v a t .m 93
96
−−−−−−−−−−−−−−−−−−−−−−−−−−−−−−−−−−−−−−−−−−−−−−−−−−−−−−−−−−−−−−−−−−−−−−−− Association Analysis ( Apriori Algorithm ) : Given a s e t o f t r a n s a c t i o n s , f i n d r u l e s t h a t w i l l p r e d i c t t h e o c c u r r e n c e o f an i t e m b a s e d on t h e o c c u r r e n c e s o f o t h e r
155
items in the t r a n s a c t i o n 99
102
% a u t h o r : N a r i n e Manukyan 0 7 / 0 8 / 2 0 1 3 % C o p y r i g h t ( c ) 2 0 1 3 , N a r i n e Manukyan f i n d R u l e s .m −−−−−−−−−−−−−−−−−−−−−−−−−−−−−−−−−−−−−−−−−−−−−−−−−−−−−−−−−−−−−−−−−−−−−−−−
105
Uipickfiles : GUI p r o g r a m t o s e l e c t
f i l e s and / o r f o l d e r s
108
111
% % % % %
V e r s i o n : 1 . 1 5 , 2 March 2012 A u t h o r : D o u g l a s M. Schwarz Email : dmschwarz = i e e e ∗ org , dmschwarz = u r g r a d ∗ r o c h e s t e r ∗ edu R e a l _ e m a i l = r e g e x p r e p ( Email , { ’ = ’ , ’ ∗ ’ } , { ’@’ , ’ . ’ } ) h t t p : / / www. mathworks . com / m a t l a b c e n t r a l / f i l e e x c h a n g e /10867 − u i p i c k f i l e s −− u i g e t f i l e −on−s t e r o i d s
114
u i p i c k f i l e s .m uipickfiles_license . txt 117
−−−−−−−−−−−−−−−−−−−−−−−−−−−−−−−−−−−−−−−−−−−−−−−−−−−−−−−−−−−−−−−−−−−−−−−− MATLAB2TIKZ Save f i g u r e i n n a t i v e LaTeX ( TikZ / P g f p l o t s ) . 120
% 123
126
129
132
135
C o p y r i g h t ( c ) 2008 − −2014 , Nico S c h l o e m e r < n i c o . s c h l o e m e r @ g m a i l . com>
m 2 t U p d a t e r .m c l e a n f i g u r e .m f i g u r e 2 d o t .m m 2 t I n p u t P a r s e r .m m a t l a b 2 t i k z .m −−−−−−−−−−−−−−−−−−−−−−−−−−−−−−−−−−−−−−−−−−−−−−−−−−−−−−−−−−−−−−−−−−−−−−−− LIBSVM % % % %
h t t p : / / www. c s i e . n t u . edu . tw / ~ c j l i n / l i b s v m Version : 3.20 Author : Chih−Chung Chang and Chih−J e n L i n License : m o d i f i e d BSD l i c e n s e
libsvm −3.20\∗.∗ 138
−−−−−−−−−−−−−−−−−−−−−−−−−−−−−−−−−−−−−−−−−−−−−−−−−−−−−−−−−−−−−−−−−−−−−−−− ARESLab 141
144
147
150
% % % %
h t t p : / / www. c s . r t u . l v / j e k a b s o n s / Version : 1.13.0 Author : Gints Jekabsons ( g i n t s . jekabsons@rtu . lv ) License : GNU GPL
−−−−−−−−−−−−−−−−−−−−−−−−−−−−−−−−−−−−−−−−−−−−−−−−−−−−−−−−−−−−−−−−−−−−−−−− CSV r e a d % h t t p s : / / g i t h u b . com / g i d e o n g f e l l e r / m a t l a b / b l o b / m a s t e r / r e a d _ m i x e d _ c s v .m
156
% license : 153
r e a d _ m i x e d _ c s v .m
Appendix D. Included External Toolboxes (GNU-License)
none
E Symbols and abbreviations Symbol ACF ANOVA CCF CCOEF DA FFT ICA k-NN MBF MEAN MLP MANOVA PCA SF STD SVM TS K m ml my N s sm sd sz
Meaning Auto correlation function Analysis of Variances Cross Correlation Function Cross Correlation Function Discriminant analysis Fast Fourier transformation Independent Component Analysis k-nearest-neighbor Membership function Mean value Multi-layer perceptron Multivariate Analysis of Variances Principal Component Analysis Single feature Standard deviation Support Vector Machines Time series Number of sample points Number of linguistic terms of all features Number of linguistic terms of the l-th feature xl Number of linguistic terms (classes) of the output variable Number of data points Number of features Number of selected features Number of transformed (aggregated) features Number of time-series
F Known errors and problems • SciXMiner needs certain variable, which must not be overwritten or deleted. For instance, the variable parameter encapsulates the control elements and enables SciXMiner to internally access these variables. If this Variable is deleted or does not contain the needed elements, a further execution of SciXMiner is not possible. The only possible solution is a restart. Further necessary variables are listed in Appendix B. • To execute a macro as well the needed features and/or time series have to exist in within the project as the output variables. There may be the possibility that a macro has to be recorded separately for each project to ensure a proper functionality. • If a macro is recorded, it saves the names of selected elements in a popup window for a reconstruction. If the name is not available during a replay, an error message ”Inconsistent selection fields (see MATLAB command window for further details)” is shown. In this case, you should verify the available elements in this field. Possible reasons are new names for variables or changed names for program options. • Frequently opening and closing of the SciXMiner GUI leads to a slower processing of figures. This problem may be traced back to an incorrect deletion of control and menu items in Matlab. • At the moment, massive problems with lp_solve occur due to version conflicts. • Using the novelty detection with the one-class method the following error message occurs: ”Error! lp_solve library not found. Please copy *.dll from the toolbox path in ...\bin”: The novelty detection with the one-class method uses an external toolbox, which needs a dynamic link libraries (DLL). Matlab is not able to find these libraries, if they are not contained in the general Matlab path for libraries. This directory is located in ”\bin”. The directory is given in Matlab by using the command matlabroot. The following files have to be copied from the SciXMiner subdirectory ”toolbox” to the above mentioned directory: ”mxlpsolve.dll” and ”lpsolve55.dll”. • Applying the Matlab wavelet decomposition the following error message occurs: ”Error using ==> interp Length of data sequence must be at least 9 You either need more data or a shorter filter (L).”: The integrated Matlab function calculates time-series which are shorter than the original time series. A plugin interpolates them to the correct length. The used command for interpolation (interp) interrupts if time series are too short. Indeed, the used number of sample points may be reduced for the interpolation. However, this error correlates with another error in the wavelet decomposition, which originates from a too high number of levels. To solve the problem reduce the number of levels or deactivate the Matlab wavelet decomposition. Then, an alternative implementation will be used. • Errors occur for the macro recording if popup elements have digits as first characters.
159
• Missing MATLAB functions can cause SciXMiner errors in older MATLAB versions: – The MATLAB function ”iscolumn” is available from MATLAB version 2011a.
G Version history G.1
Versions
• earlier Gait-CAD-Versions, see version history in Gait-CAD documentation • Version 2016b (13.03.2017) • Version 2017a (12.04.2017)
G.2
Selected changes between Gait-CAD version 2014b and SciXMiner version 2016b
• integration of support vector regression • option to generate polynomial models without absolute value (a0 term) • handling of timestamp data (conversion from strings in linguistic terms of output variables to timestamps resp. from timestamps to date and time) • visualization of multidimensional single features • optional hiding of figures in batch files • extended conversion options from data points into time series • export of the error of the recent regression model into a single feature • deletion of selected or unselected sample points in time series • deletion of unselected single features • additional style options for protocol files of classes and single features • switchable percentage statistics in 2D histograms • various internal changes related to the transfer from Gait-CAD to SciXMiner (naming, internal code optimizations etc.) • large variety of bug fixes • compatibility to MATLAB 2016b 160
G.3. Selected changes between SciXMiner versions 2016b and 2017a
G.3
Selected changes between SciXMiner versions 2016b and 2017a
• compatibility to MATLAB 2017a
161
H Plugins • COG SF (COG): computes the center of gravity of a time series or a time series segment. – Function name: plugin_cog_em.m – Type: SF – Time series: 1 inputs, 0 outputs, Segments possible: yes – Single features: 0 inputs, 1 outputs – Images: 0 inputs, 0 outputs – Direct callback: none – Number of parameters: 0 • Maximum (MAX): computes the maximum of a time series or a time series segment as single feature. – Function name: plugin_max.m – Type: SF – Time series: 1 inputs, 0 outputs, Segments possible: yes – Single features: 0 inputs, 1 outputs – Images: 0 inputs, 0 outputs – Direct callback: none – Number of parameters: 0 • Maximum position (MAPO): computes the position of the maximum (number of the sample point) for a time series or a time series segment as single feature. – Function name: plugin_mapo.m – Type: SF – Time series: 1 inputs, 0 outputs, Segments possible: yes – Single features: 0 inputs, 1 outputs – Images: 0 inputs, 0 outputs – Direct callback: none – Number of parameters: 0 • Mean value SF (MEAN): computes the mean of a time series or a time series segment as single feature. – Function name: plugin_mean_em.m 162
163
– Type: SF – Time series: 1 inputs, 0 outputs, Segments possible: yes – Single features: 0 inputs, 1 outputs – Images: 0 inputs, 0 outputs – Direct callback: none – Number of parameters: 0 • Mean value SF NaN (MEAN): computes the mean of a time series or a time series segment as single feature. NaN values in a time series will be ignored. – Function name: plugin_mean_em_nan.m – Type: SF – Time series: 1 inputs, 0 outputs, Segments possible: yes – Single features: 0 inputs, 1 outputs – Images: 0 inputs, 0 outputs – Direct callback: none – Number of parameters: 0 • Median SF (MEDIAN): computes the median of a time series or a time series segment as single feature. – Function name: plugin_median_em.m – Type: SF – Time series: 1 inputs, 0 outputs, Segments possible: yes – Single features: 0 inputs, 1 outputs – Images: 0 inputs, 0 outputs – Direct callback: none – Number of parameters: 0 • Median SF NaN (MEDIAN): computes the median of a time series or a time series segment as single feature. NaN values in a time series will be ignored. – Function name: plugin_median_em_nan.m – Type: SF – Time series: 1 inputs, 0 outputs, Segments possible: yes – Single features: 0 inputs, 1 outputs – Images: 0 inputs, 0 outputs – Direct callback: none – Number of parameters: 0 • Minimum (MIN): computes the minimum of a time series or a time series segment as single feature. – Function name: plugin_min.m – Type: SF
164
Appendix H. Plugins
– Time series: 1 inputs, 0 outputs, Segments possible: yes – Single features: 0 inputs, 1 outputs – Images: 0 inputs, 0 outputs – Direct callback: none – Number of parameters: 0 • Minimum position (MIPO): computes the position of the minimum (number of the sample point) for a time series or a time series segment as single feature. – Function name: plugin_mipo.m – Type: SF – Time series: 1 inputs, 0 outputs, Segments possible: yes – Single features: 0 inputs, 1 outputs – Images: 0 inputs, 0 outputs – Direct callback: none – Number of parameters: 0 • Norm deviation (absolute value) (ND Abs): computes the mean absolute norm deviation of a time series in a segment as single feature (mean value of Eq. (3) in [114] for a segment) – Function name: plugin_normzahl_betrag.m – Type: SF – Time series: 1 inputs, 0 outputs, Segments possible: yes – Single features: 0 inputs, 1 outputs – Images: 0 inputs, 0 outputs – Direct callback: none – Number of parameters: 0 • Norm deviation (direction) (ND Dir): computes the mean value of the directed deviation from a time series to a norm time series in a segment as a single feature. (mean value of the directed norm deviation for a segment, Eq. (3) in [114] without the absolute value in the nominator) – Function name: plugin_normzahl_richtung.m – Type: SF – Time series: 1 inputs, 0 outputs, Segments possible: yes – Single features: 0 inputs, 1 outputs – Images: 0 inputs, 0 outputs – Direct callback: none – Number of parameters: 0 • Range of Motion (ROM): computes the range (of motion) of a time series or a time series segment as single feature. – Function name: plugin_rom.m – Type: SF
165
– Time series: 1 inputs, 0 outputs, Segments possible: yes – Single features: 0 inputs, 1 outputs – Images: 0 inputs, 0 outputs – Direct callback: none – Number of parameters: 0 • STD SF (STD SF): computes the standard deviation of all values of a time series or a time series segment. Normalization to K instead of K-1 – Function name: plugin_std_em.m – Type: SF – Time series: 1 inputs, 0 outputs, Segments possible: yes – Single features: 0 inputs, 1 outputs – Images: 0 inputs, 0 outputs – Direct callback: none – Number of parameters: 0 • Sum SF (SUM): computes the sum if a time series or of a time series segment as single feature. – Function name: plugin_sum_em.m – Type: SF – Time series: 1 inputs, 0 outputs, Segments possible: yes – Single features: 0 inputs, 1 outputs – Images: 0 inputs, 0 outputs – Direct callback: none – Number of parameters: 0 • TS->DISCR SF MEAN (TERMQ1TERMQ2TERMQ3TERMQ4TERMQ5): computes the frequencies for (crisp) discretizations in time series. – Function name: plugin_discr_em.m – Type: SF – Time series: 1 inputs, 0 outputs, Segments possible: yes – Single features: 0 inputs, 5 outputs – Images: 0 inputs, 0 outputs – Direct callback: none – Number of parameters: 2 ∗ Number of terms (Number of terms for discretization) ∗ Type of membership function (defines the algorithm for the design of a membership function (see ”Control element: Data mining: Special methods - Number of linguistic terms”). ”Median” generates terms with approximately equal data point frequencies for all terms in the training data set.
166
Appendix H. Plugins
”Equal distribution” generate terms with similar distances between the maximum values of the membership functions. ”Clustering” uses cluster prototypes as parameters. ”Fix” set the parameters of the membership functions to the values defined by ”Control element: Data mining: Special methods - Parameters MBF (fix)”. The choice ”with interpretability” rounds the found parameters using a method described in Literature: Mikut05 to improve the interpretability. Remark: All design methods set the random number generator of Matlab to a fix value. It improves the reproducibility of found membership functions. Nevertheless, all methods with random elements might be sensitive to the state of the random number generator (e.g. cluster algorithms with random start clusters). It can also influence other methods using these membership functions, e.g. by different selected features in a decision tree (e.g. ”Data mining - Selection and evaluation of single features - Information theoretic measures”). ) • TS->FUZZY SF MEAN (TERM1TERM2TERM3TERM4TERM5): computes the frequency of fuzzy terms in a fuzzified time series as single features. – Function name: plugin_fuzzy_em.m – Type: SF – Time series: 1 inputs, 0 outputs, Segments possible: yes – Single features: 0 inputs, 5 outputs – Images: 0 inputs, 0 outputs – Direct callback: none – Number of parameters: 2 ∗ Number of terms (Number of terms for discretization) ∗ Type of membership function (defines the algorithm for the design of a membership function (see ”Control element: Data mining: Special methods - Number of linguistic terms”). ”Median” generates terms with approximately equal data point frequencies for all terms in the training data set. ”Equal distribution” generate terms with similar distances between the maximum values of the membership functions. ”Clustering” uses cluster prototypes as parameters. ”Fix” set the parameters of the membership functions to the values defined by ”Control element: Data mining: Special methods - Parameters MBF (fix)”. The choice ”with interpretability” rounds the found parameters using a method described in Literature: Mikut05 to improve the interpretability. Remark: All design methods set the random number generator of Matlab to a fix value. It improves the reproducibility of found membership functions. Nevertheless, all methods with random elements might be sensitive to the state of the random number generator (e.g. cluster algorithms with random start clusters). It can also influence other methods using these membership functions, e.g. by different selected features in a decision tree (e.g. ”Data mining - Selection and evaluation of single features - Information theoretic measures”). )
167
• TS->PC SF (PC1PC2): computes new single features using a Principal Component Analysis of a time series or a time series segment (K -> s_d). – Function name: plugin_zrhkem.m – Type: SF – Time series: 1 inputs, 0 outputs, Segments possible: yes – Single features: 0 inputs, 2 outputs – Images: 0 inputs, 0 outputs – Direct callback: none – Number of parameters: 2 ∗ Number of aggregated PCA features (Number s_d of principal components from a time series (Transformation number of sample points K -> s_d)) ∗ Normalize standard deviations (defines the normalization for the variances of the sample points) • TS->SF (TSSP): extracts the value of the time series for one sample point as single feature. – Function name: plugin_zr_em.m – Type: SF – Time series: 1 inputs, 0 outputs, Segments possible: none – Single features: 0 inputs, 1 outputs – Images: 0 inputs, 0 outputs – Direct callback: none – Number of parameters: 1 ∗ Number of the sample point (Sample point for Time series -> Single feature) • below/above norm mean value (ND Sign): computes a single feature indicating values above or below the norm time series – Function name: plugin_normzahl_mittelwert.m – Type: SF – Time series: 1 inputs, 0 outputs, Segments possible: yes – Single features: 0 inputs, 1 outputs – Images: 0 inputs, 0 outputs – Direct callback: none – Number of parameters: 0 • Absolute value (ABS): rectifies a time series by computing the absolute values – Function name: plugin_abs.m – Type: TS – Time series: 1 inputs, 1 outputs, Segments possible: none – Single features: 0 inputs, 0 outputs – Images: 0 inputs, 0 outputs
168
Appendix H. Plugins
– Direct callback: none – Number of parameters: 0 • Acausal median of a window (FE-MED-AC): sets all values of the time series in the window to the median value of the window. Here, an acausal filter is used. – Function name: plugin_zr_fenster_medac.m – Type: TS – Time series: 1 inputs, 1 outputs, Segments possible: none – Single features: 0 inputs, 0 outputs – Images: 0 inputs, 0 outputs – Direct callback: none – Number of parameters: 1 ∗ Window length (determines the window length in sample points for the filtering with a sliding window.) • Acceleration (A): computes the second time derivation of a time series. see Eq. (3.3) in [64]). – Function name: plugin_beschleunigung.m – Type: TS – Time series: 1 inputs, 1 outputs, Segments possible: none – Single features: 0 inputs, 0 outputs – Images: 0 inputs, 0 outputs – Direct callback: none – Number of parameters: 1 ∗ Time (defines the scaling (per sample point resp. per time using the sampling frequency from the GUI)) • Addition of time series (ADDTS): adds all selected time series. – Function name: plugin_add_zr.m – Type: TS – Time series: Inf inputs, 1 outputs, Segments possible: none – Single features: 0 inputs, 0 outputs – Images: 0 inputs, 0 outputs – Direct callback: none – Number of parameters: 0 • Change sign (SIGNIN): multiplies a time series with −1 – Function name: plugin_vorzeichen_umkehr.m – Type: TS – Time series: 1 inputs, 1 outputs, Segments possible: none – Single features: 0 inputs, 0 outputs
169
– Images: 0 inputs, 0 outputs – Direct callback: none – Number of parameters: 0 • Compute square root (ROOT): Compute root of the amplitudes of a time series. – Function name: plugin_root.m – Type: TS – Time series: 1 inputs, 1 outputs, Segments possible: none – Single features: 0 inputs, 0 outputs – Images: 0 inputs, 0 outputs – Direct callback: none – Number of parameters: 0 • Compute trend (Trend): Here, two first order IIR filters with the parameter aF (fast) and aS (slow) are used. The computation is explained in [90]. – Function name: plugin_iirfilter_trend.m – Type: TS – Time series: 1 inputs, 1 outputs, Segments possible: none – Single features: 0 inputs, 0 outputs – Images: 0 inputs, 0 outputs – Direct callback: none – Number of parameters: 1 ∗ Parameter aF aS (to 0: no smoothing, to 1: strong smoothing. aSlow must be greater than aFast.) • Difference of two time series (DIFF): computes the difference between the first and second time series. – Function name: plugin_diffzr.m – Type: TS – Time series: 2 inputs, 1 outputs, Segments possible: none – Single features: 0 inputs, 0 outputs – Images: 0 inputs, 0 outputs – Direct callback: none – Number of parameters: 0 • Estimate standard deviation (StdTS): applies different digital lowpass filters x_f [k + 1] = a ∗ x_f [k] + (1 − a) ∗ x[k] with parameters aFast, aSlow and aSigma to compute the standard deviation. see Eq. (2-6) in [90] with aF = aSigma, aL = aSlow, aS = aFast. – Function name: plugin_iirfilter_stdschaetzer.m – Type: TS – Time series: 1 inputs, 1 outputs, Segments possible: none
170
Appendix H. Plugins
– Single features: 0 inputs, 0 outputs – Images: 0 inputs, 0 outputs – Direct callback: none – Number of parameters: 1 ∗ Parameters aFast aSlow aSigma (to 0: no smoothing, to 1: strong smoothing. aSlow must be greater than aFast.) • Filtered maximum (Fil-MAX): sliding maximum value with exponential forgetting. Here, a causal filter is used. – Function name: plugin_zr_gefiltert_max.m – Type: TS – Time series: 1 inputs, 1 outputs, Segments possible: none – Single features: 0 inputs, 0 outputs – Images: 0 inputs, 0 outputs – Direct callback: none – Number of parameters: 0 • Filtered minimum (Fil-MIN): sliding minimum value with exponential forgetting. Here, a causal filter is used. – Function name: plugin_zr_gefiltert_min.m – Type: TS – Time series: 1 inputs, 1 outputs, Segments possible: none – Single features: 0 inputs, 0 outputs – Images: 0 inputs, 0 outputs – Direct callback: none – Number of parameters: 0 • Filtering (FIL): filters a time series. A Butterworth filter is used.This plugin needs the Signal Processing Toolbox of Matlab. The Bode plot can be shown under Show - Time series. – Function name: plugin_filter.m – Type: TS – Time series: 1 inputs, 1 outputs, Segments possible: none – Single features: 0 inputs, 0 outputs – Images: 0 inputs, 0 outputs – Direct callback: none – Number of parameters: 4 ∗ Filter type (determines the filter characteristics in the frequency domain.) ∗ Frequencies (defines the critical frequencies for the filter using the unit of the sample frequency (e.g. in Hz). The second parameter is only used for bandpass filters.) ∗ Filter order (FIL) (determines the order of a filter.)
171
∗ Initial values (computes initial values of the filter, Filtic+Static assumes a steady state filter at k=1, computed with MATLAB function filtic.m) • Filtering with Morlet wavelet (Morl): – Function name: plugin_morletfilter.m – Type: TS – Time series: 1 inputs, 1 outputs, Segments possible: none – Single features: 0 inputs, 0 outputs – Images: 0 inputs, 0 outputs – Direct callback: none – Number of parameters: 3 ∗ Morlet wavelet: frequency (This frequency describes the center of the region which is not damped by the Morlet-Wavelet.) ∗ Morlet wavelet: frequency (The width of the region is defined by the eigenfrequency of the Morlet wavelet) ∗ Causal Morlet wavelet (Use the same transformation matrix (e.g. PCA) for time series reduction of all data points) • IIR filter (IIR): applies a digital lowpass filter x_f [k + 1] = a ∗ x_f [k] + (1 − a) ∗ x[k]. – Function name: plugin_iirfilter.m – Type: TS – Time series: 1 inputs, 1 outputs, Segments possible: none – Single features: 0 inputs, 0 outputs – Images: 0 inputs, 0 outputs – Direct callback: none – Number of parameters: 1 ∗ Parameter a (to 0: no smoothing, to 1: strong smoothing) • Individual norm deviation (NABW): Here, the plugins IIR (Parameter aF) and StdTS are used for the estimation – Function name: plugin_normabweichung.m – Type: TS – Time series: 1 inputs, 1 outputs, Segments possible: none – Single features: 0 inputs, 0 outputs – Images: 0 inputs, 0 outputs – Direct callback: none – Number of parameters: 1 ∗ Parameters aFast aSlow aSigma (to 0: no smoothing, to 1: strong smoothing. aSlow must be greater than aFast.) • Jerk (J): computes the jerk (3rd time derivation) of a time series (acausal).
172
Appendix H. Plugins
– Function name: plugin_ruck.m – Type: TS – Time series: 1 inputs, 1 outputs, Segments possible: none – Single features: 0 inputs, 0 outputs – Images: 0 inputs, 0 outputs – Direct callback: none – Number of parameters: 1 ∗ Time (defines the scaling (per sample point resp. per time using the sampling frequency from the GUI)) • Jump to zero (ZEROJump): set value = 1 for a jump to zeros, and value = 0 otherwise. – Function name: plugin_nsprung.m – Type: TS – Time series: 1 inputs, 1 outputs, Segments possible: none – Single features: 0 inputs, 0 outputs – Images: 0 inputs, 0 outputs – Direct callback: none – Number of parameters: 0 • Logarithm 10 TS (LOG10): computes the logarithm to the base 10 for all values of a time series. – Function name: plugin_log10_zr.m – Type: TS – Time series: 1 inputs, 1 outputs, Segments possible: none – Single features: 0 inputs, 0 outputs – Images: 0 inputs, 0 outputs – Direct callback: none – Number of parameters: 0 • Maximum of a window (FE-MAX): sets all values of the time series in the window to the maximum value of the window. Here, a causal filter is used. – Function name: plugin_zr_fenster_max.m – Type: TS – Time series: 1 inputs, 1 outputs, Segments possible: none – Single features: 0 inputs, 0 outputs – Images: 0 inputs, 0 outputs – Direct callback: none – Number of parameters: 1 ∗ Window length (determines the window length in sample points for the filtering with a sliding window.)
173
• Maximum of multiple time series (MAXTS): computes the maximum for all time series in the configuration window. – Function name: plugin_max_zr.m – Type: TS – Time series: Inf inputs, 1 outputs, Segments possible: none – Single features: 0 inputs, 0 outputs – Images: 0 inputs, 0 outputs – Direct callback: none – Number of parameters: 0 • Mean of a window (FE-MEAN): sets all values of the time series in the window to the mean value of the window. Here, a causal filter is used. – Function name: plugin_zr_fenster_mean.m – Type: TS – Time series: 1 inputs, 1 outputs, Segments possible: none – Single features: 0 inputs, 0 outputs – Images: 0 inputs, 0 outputs – Direct callback: none – Number of parameters: 1 ∗ Window length (determines the window length in sample points for the filtering with a sliding window.) • Mean value of multiple time series (MEANTS): computes the mean for all time series in the configuration window. – Function name: plugin_mean_zr.m – Type: TS – Time series: Inf inputs, 1 outputs, Segments possible: none – Single features: 0 inputs, 0 outputs – Images: 0 inputs, 0 outputs – Direct callback: none – Number of parameters: 0 • Median of a window (FE-MED): sets all values of the time series in the window to the median value of the window. Here, a causal filter is used. – Function name: plugin_zr_fenster_median.m – Type: TS – Time series: 1 inputs, 1 outputs, Segments possible: none – Single features: 0 inputs, 0 outputs – Images: 0 inputs, 0 outputs – Direct callback: none
174
Appendix H. Plugins
– Number of parameters: 1 ∗ Window length (determines the window length in sample points for the filtering with a sliding window.) • Minimum of a window (FE-MIN): sets all values of the time series in the window to the minimum value of the window. Here, a causal filter is used. – Function name: plugin_zr_fenster_min.m – Type: TS – Time series: 1 inputs, 1 outputs, Segments possible: none – Single features: 0 inputs, 0 outputs – Images: 0 inputs, 0 outputs – Direct callback: none – Number of parameters: 1 ∗ Window length (determines the window length in sample points for the filtering with a sliding window.) • Minimum of multiple time series (MINTS): computes the minimum for all time series in the configuration window. – Function name: plugin_min_zr.m – Type: TS – Time series: Inf inputs, 1 outputs, Segments possible: none – Single features: 0 inputs, 0 outputs – Images: 0 inputs, 0 outputs – Direct callback: none – Number of parameters: 0 • Multiplication of time series (MULTTS): multiplies all time series that are selected in the configuration window. – Function name: plugin_mult_zr.m – Type: TS – Time series: Inf inputs, 1 outputs, Segments possible: none – Single features: 0 inputs, 0 outputs – Images: 0 inputs, 0 outputs – Direct callback: none – Number of parameters: 0 • Multiplication with a constant (CONST): Multiplication with a constant. – Function name: plugin_mult_const.m – Type: TS – Time series: 1 inputs, 1 outputs, Segments possible: none – Single features: 0 inputs, 0 outputs
175
– Images: 0 inputs, 0 outputs – Direct callback: none – Number of parameters: 1 ∗ Constant gain • Norm deviation time series absolute value (NDTS ABS): computes the absolute value of the norm deviation as time series. (Eq. (3) in [114]) – Function name: plugin_normzeitreihe_abs.m – Type: TS – Time series: 1 inputs, 1 outputs, Segments possible: none – Single features: 0 inputs, 0 outputs – Images: 0 inputs, 0 outputs – Direct callback: none – Number of parameters: 0 • Norm time series (NDTS): computes the deviation from a time series to a norm time series as a new time series. (Eq. (3.9) in [64]) – Function name: plugin_normzeitreihe.m – Type: TS – Time series: 1 inputs, 1 outputs, Segments possible: none – Single features: 0 inputs, 0 outputs – Images: 0 inputs, 0 outputs – Direct callback: none – Number of parameters: 0 • Normalized time series (NORM): normalizes a time series or a time series segment. – Function name: plugin_normalized_ts.m – Type: TS – Time series: 1 inputs, 1 outputs, Segments possible: none – Single features: 0 inputs, 0 outputs – Images: 0 inputs, 0 outputs – Direct callback: none – Number of parameters: 1 ∗ Type of normalization (defines the type of normalization for a time series) • Normalized to mean value (NORMMEAN): normalizes the time series to the mean value normalizes the time series to the mean value – Function name: plugin_mean_norm_ts.m – Type: TS – Time series: 1 inputs, 1 outputs, Segments possible: none
176
Appendix H. Plugins
– Single features: 0 inputs, 0 outputs – Images: 0 inputs, 0 outputs – Direct callback: none – Number of parameters: 0 • ROM of a window (FE-ROM): sets all values of the time series in the window to the range of the window. Here, a causal filter is used. – Function name: plugin_zr_fenster_rom.m – Type: TS – Time series: 1 inputs, 1 outputs, Segments possible: none – Single features: 0 inputs, 0 outputs – Images: 0 inputs, 0 outputs – Direct callback: none – Number of parameters: 1 ∗ Window length (determines the window length in sample points for the filtering with a sliding window.) • Relative ratio of two time series (RELRAT): computes the relative ratio of the first time series to the sum of both time series selected in the configuration window. – Function name: plugin_verhzr.m – Type: TS – Time series: 2 inputs, 1 outputs, Segments possible: none – Single features: 0 inputs, 0 outputs – Images: 0 inputs, 0 outputs – Direct callback: none – Number of parameters: 0 • Remove trend (DETREND): corrects the linear trend of a time series (MATLAB function detrend) corrects the linear trend of a time series (MATLAB function detrend) – Function name: plugin_detrend.m – Type: TS – Time series: 1 inputs, 1 outputs, Segments possible: none – Single features: 0 inputs, 0 outputs – Images: 0 inputs, 0 outputs – Direct callback: none – Number of parameters: 1 ∗ Detrend method (Direction of model:
linear - removes a continuous, piecewise linear trend;
constant - removes just the mean value) • Sorted time series (SORT TS): sorts all values of a time series in ascending order. – Function name: plugin_sort_zr.m
177
– Type: TS – Time series: 1 inputs, 1 outputs, Segments possible: none – Single features: 0 inputs, 0 outputs – Images: 0 inputs, 0 outputs – Direct callback: none – Number of parameters: 0 • Square (SQR): computes the square of the amplitudes of a time series. – Function name: plugin_square.m – Type: TS – Time series: 1 inputs, 1 outputs, Segments possible: none – Single features: 0 inputs, 0 outputs – Images: 0 inputs, 0 outputs – Direct callback: none – Number of parameters: 0 • TS->DISCR TS MEAN (TERMQ): computes a discretized time series with a tunable number of terms for discretization. – Function name: plugin_discr_zr.m – Type: TS – Time series: 1 inputs, 1 outputs, Segments possible: yes – Single features: 0 inputs, 0 outputs – Images: 0 inputs, 0 outputs – Direct callback: none – Number of parameters: 2 ∗ Number of terms (Number of terms for discretization) ∗ Type of membership function (defines the algorithm for the design of a membership function (see ”Control element: Data mining: Special methods - Number of linguistic terms”). ”Median” generates terms with approximately equal data point frequencies for all terms in the training data set. ”Equal distribution” generate terms with similar distances between the maximum values of the membership functions. ”Clustering” uses cluster prototypes as parameters. ”Fix” set the parameters of the membership functions to the values defined by ”Control element: Data mining: Special methods - Parameters MBF (fix)”. The choice ”with interpretability” rounds the found parameters using a method described in Literature: Mikut05 to improve the interpretability. Remark: All design methods set the random number generator of Matlab to a fix value. It improves the reproducibility of found membership functions. Nevertheless, all methods with random elements might be sensitive to the state of the random number generator (e.g. cluster algorithms with random start clusters). It can also influence other methods
178
Appendix H. Plugins
using these membership functions, e.g. by different selected features in a decision tree (e.g. ”Data mining - Selection and evaluation of single features - Information theoretic measures”). ) • TS->PC TS (PCTS1PCTS2): computes new time series by means of a Principal Component Analysis of time series (Transformation number of time series s_z -> s_d). – Function name: plugin_zrhkzr.m – Type: TS – Time series: Inf inputs, 2 outputs, Segments possible: none – Single features: 0 inputs, 0 outputs – Images: 0 inputs, 0 outputs – Direct callback: none – Number of parameters: 3 ∗ Number of aggregated PCA features (Number s_d of principal components computed of a time series) ∗ Normalize standard deviations (defines the normalization for the variances of the sample points) ∗ Transformation matrix (Use the same transformation matrix (e.g. PCA) for time series reduction of all data points) • Time shift (SHIFT): shift the time series K samples (positive values shift to the future). – Function name: plugin_shift_ts.m – Type: TS – Time series: 1 inputs, 1 outputs, Segments possible: none – Single features: 0 inputs, 0 outputs – Images: 0 inputs, 0 outputs – Direct callback: none – Number of parameters: 1 ∗ Shift of a time series (positive values shift to the future, negative values to the past) • Value in region (REGION): set all values in a region of a time series to 1 and all other to 0. – Function name: plugin_timeseries_region.m – Type: TS – Time series: 1 inputs, 1 outputs, Segments possible: none – Single features: 0 inputs, 0 outputs – Images: 0 inputs, 0 outputs – Direct callback: none – Number of parameters: 2 ∗ Lower threshold (Lower threshold for the binarization of the time series) ∗ Upper threshold (Upper threshold for the binarization of the time series)
179
• Value larger than threshold (THRES): set all values of a time series above a threshold to 1, all other values to 0. – Function name: plugin_timeseries_threshold.m – Type: TS – Time series: 1 inputs, 1 outputs, Segments possible: none – Single features: 0 inputs, 0 outputs – Images: 0 inputs, 0 outputs – Direct callback: none – Number of parameters: 1 ∗ Threshold (Threshold for a binarization of time series) • Velocity (V): computes the first time derivation of a time series. The result is a single time series. Here, an acausal filter is used. see Eq. (3.2) in [64]) – Function name: plugin_geschwindigkeit.m – Type: TS – Time series: 1 inputs, 1 outputs, Segments possible: none – Single features: 0 inputs, 0 outputs – Images: 0 inputs, 0 outputs – Direct callback: none – Number of parameters: 1 ∗ Time (defines the scaling (per sample point resp. per time using the sampling frequency from the GUI)) • Velocity (causal) (V_kausal): computes the first time derivation of a time series. The result is a single time series. Here, a causal filter is used. – Function name: plugin_geschwindigkeit_kausal.m – Type: TS – Time series: 1 inputs, 1 outputs, Segments possible: none – Single features: 0 inputs, 0 outputs – Images: 0 inputs, 0 outputs – Direct callback: none – Number of parameters: 1 ∗ Time (defines the scaling (per sample point resp. per time using the sampling frequency from the GUI)) • Wavedec (db1, Low 4 db1, High 1db1, High 2db1, High 3db1, High 4): – Function name: plugin_wavedec.m – Type: TS – Time series: 1 inputs, 5 outputs, Segments possible: none – Single features: 0 inputs, 0 outputs
180
Appendix H. Plugins
– Images: 0 inputs, 0 outputs – Direct callback: none – Number of parameters: 3 ∗ Wavelet (defines the wavelet type.) ∗ Wavelets: number of levels (defines the number of levels.) ∗ Matlab wavelet decomposition (defines the used implementation.)
Bibliography [1] A LCALÁ , J.; F ERNÁNDEZ , A.; L UENGO , J.; D ERRAC , J.; G ARCÍA , S.; S ÁNCHEZ , L.; H ER RERA , F.: KEEL Data-mining Software Tool: Data Set Repository, Integration of Algorithms and Experimental Analysis Framework. Journal of Multiple-Valued Logic and Soft Computing 17 (2011) 2-3, S. 255–287. [2] A LSHUT, R.: Konzept für Bildanalysen in Hochdurchsatz-Systemen am Beispiel des Zebrabärblings. Dissertation, Karlsruher Institut für Technologie (KIT), 2016. [3] A LSHUT, R.; L EGRADI , J.; L IEBEL , U.; YANG , L.; VAN W EZEL , J.; S TRÄHLE , U.; M IKUT, R.; R EISCHL , M.: Methods for Automated High-Throughput Toxicity Testing using Zebrafish Embryos. Lecture Notes in Artificial Intelligence 6359 (2010), S. 219–226. [4] A LSHUT, R.; M IKUT, R.; L EGRADI , J.; L IEBEL , U.; S TRÄHLE , U.; B RETTHAUER , G.; R EIS CHL , M.: Automatische Klassifikation von Bildzeitreihen für toxikologische HochdurchsatzUntersuchungen. at-Automatisierungstechnik 59(5) (2011), S. 259–268. [5] A NDERSON , E.: The Irises of the Gasp´e Peninsula. Bulletin of the American Iris Society 59 (1935), S. 2–5. [6] A RNOLDT, A.; K ÖNIG , S.; M IKUT, R.; B RETSCHNEIDER , P.: Application of Data Mining Methods for Power Forecast of Wind Power Plants. In: Proc., 9th International Workshop on Large-scale Integration of Wind Power and Transmission Networks for Offshore Wind Farms, Quebec, 2010. [7] BARTSCHAT, A.; H ÜBNER , E.; R EISCHL , M.; M IKUT, R.; S TEGMAIER , J.: XPIWIT - An XML Pipeline Wrapper for the Insight Toolkit. Bioinformatics 32 (2016) 2, S. 315–317. [8] BAUER , C.: Neues Konzept zur Bewegungsanalyse und -synthese für Humanoide Roboter basierend auf Vorbildern aus der Biologie. Dissertation, Karlsruher Institut für Technologie, KIT Scientific Publishing, 2014. [9] BAUER , C.; E NGELMANN , M.; G AISER , I.; S TEIN , T.; F ISCHER , A.; M IKUT, R.; S CHULZ , S.: Hardware Design and Mathematical Modeling for an Artificial Pneumatic Spine for a Biped Humanoid Robot. In: Proc., German Conference on Robotics, S. 7–11, 2012. [10] BAUER , C.; M ILIGHETTI , G.; YAN , W.; M IKUT, R.: Human-like Reflexes for Robotic Manipulation using Leaky Integrate-and-Fire Neurons. In: Proc., IEEE/RSJ International Conference on Intelligent Robots and Systems (IROS2010), S. 2572–2577, 2010. [11] BAUER , C.; M ORS , M.; F ISCHER , A.; S TEIN , T.; M IKUT, R.; S CHULZ , S.: Konzept für einen biologisch inspirierten, semi-passiven pneumatisch angetriebenen zweibeinigen ProthesenRoboter-Hybrid. at-Automatisierungstechnik 60 (2012) 10, S. 662–671. 181
182
Bibliography
[12] B ECK , S.: Ein Beitrag zum automatischen Entwurf von Fuzzy-Entscheidungssystemen bei unvollständiger Information. Dissertation, Universität Karlsruhe, Universitätsverlag Karlsruhe, 2005. [13] B ECK , S.; M IKUT, R.; J ÄKEL , J.: A Cost-Sensitive Learning Algorithm for Fuzzy Rule-Based Classifiers. Mathware and Soft Computing 11(2-3) (2004), S. 175–195. [14] B ERTHOLD , M. R.; C EBRON , N.; D ILL , F.; G ABRIEL , T. R.; K ÖTTER , T.; M EINL , T.; O HL , P.; S IEB , C.; T HIEL , K.; W ISWEDEL , B.: KNIME: The Konstanz Information Miner. In: Data Analysis, Machine Learning and Applications, S. 319–326, Springer, 2008. [15] B ORGELT, C.: Data Mining with Graphical Models. Dissertation, O.-v.-Guericke Universität Magdeburg, 2000. [16] B REIMAN , L.; F RIEDMAN , J. H.; O LSHEN , R. A.; S TONE , C. J.: Classification and Regression Trees. Belmont, CA: Wadsworth, 1984. [17] B RÜCKNER , B. W.: Neue Methodik zur Modellierung und zum Entwurf keramischer Aktorelemente. Dissertation, Karlsruher Institut für Technologie (KIT), 2012. [18] B URGES , C.: A Tutorial on Support Vector Machines for Pattern Recognition. Knowledge Discovery and Data Mining 2(2) (1998), S. 121–167. [19] B URMEISTER , O.: Analyse von Zeitreihen in der Medizin: Informationsgehalt, Klassifikation und Unsicherheit. In: Proc., 16. Workshop Computational Intelligence, S. 234–247, Universitätsverlag Karlsruhe, 2006. [20] B URMEISTER , O.: Zeitvariante Klassifikatoren zur Analyse und Interpretation multimodaler Biosignale und deren Anwendung in der Prothetik und Rehabilitation. Dissertation, Karlsruher Institut für Technologie (KIT), Universitätsverlag Karlsruhe, 2009. [21] B URMEISTER , O.; R EISCHL , M.; B RETTHAUER , G.; M IKUT, R.: Data-Mining-Analysen mit der MATLAB-Toolbox Gait-CAD. at-Automatisierungstechnik 56(7) (2008), S. 381–389. [22] B URMEISTER , O.; R EISCHL , M.; G RÖLL , L.; M IKUT, R.: Zeitvariante Klassifikatoren zur Steuerung von Brain Machine Interfaces und Neuroprothesen. at-Automatisierungstechnik 54(11) (2006), S. 537–545. [23] C AMPBELL , C.; B ENNETT, K. P.: A Linear Programming Approach to Novelty Detection. In: Proc., Neural Information Processing Systems Conference, 2000. [24] C ANU , S.; G RANDVALET, Y.; R AKOTOMAMONJY, A.: SVM and Kernel Methods Matlab Toolbox. Perception Systèmes et Information, INSA de Rouen, Rouen, France, 2003. [25] C IOS , K. (Hg.): Medical Data Mining and Knowledge Discovery, Bd. 60 von Studies in Fuzziness and Soft Computing. Heidelberg: Physica, 2001. [26] C OVER , T.; H ART, P.: Nearest Neighbor Pattern Classification. IEEE Transactions on Information Theory 13(1) (1967), S. 21–27. [27] DAVÉ , R.; S EN , S.: Robust Fuzzy Clustering of Relational Data. IEEE Transactions on Fuzzy Systems 10 (2002) 6, S. 713– 727. [28] D ONEIT, W.; M IKUT, R.; G RÖLL , L.; P YCHYNSKI , T.; R EISCHL , M.: DaMoQ: An Open Source MATLAB Toolbox for Data and Model Quality Assessment. at-Automatisierungstechnik 65 (2017) 3, S. 207–2018.
Bibliography
183
[29] E FRON , B.; T IBSHIRANI , R.: Cross-Validation and the Bootstrap: Estimating the Error Rate of a Prediction Rule. Techn. Ber. TR-477, Dept. of Statistics, Stanford University, 1995. [30] FAYYAD , U.; P IATETSKY-S HAPIRO , G.; S MYTH , P.: From Data Mining to Knowledge Discovery in Databases. AI Magazine 17 (1996), S. 37–54. [31] G ACTO , M. J.; A LCALÁ , R.; H ERRERA , F.: Interpretability of Linguistic fuzzy Rule-based Systems: An Overview of Interpretability Measures. Information Sciences 181 (2011) 20, S. 4340– 4360. [32] G EHRIG , J.; R EISCHL , M.; K ALMAR , E.; F ERG , M.; H ADZHIEV, Y.; Z AUCKER , A.; S ONG , C.; S CHINDLER , S.; L IEBEL , U.; M ÜLLER , F.: Automated High Throughput Mapping of PromoterEnhancer Interactions in Zebrafish Embryos. Nature Methods 6 (2009) 12, S. 911–916. [33] G ERLAND , P.; G ROSS , D.; S CHULTE , H.; K ROLL , A.: Robust Adaptive Fault Detection using Global State Information and Application to Mobile Working Machines. In: Conference on Control and Fault-Tolerant Systems (SysTol), S. 813–818, IEEE, 2010. [34] G ERLAND , P.; S CHULTE , H.; K ROLL , A.: Probability-based Global State Detection of Complex Technical Systems and Application to Mobile Working Machines. In: Control Conference (ECC), 2009 European, S. 1269–1274, IEEE, 2009. [35] G ONZÁLEZ O RDIANO , J. Á.; D ONEIT, W.; WACZOWICZ , S.; G RÖLL , L.; M IKUT, R.; H AGEN MEYER , V.: Nearest-Neighbor Based Non-Parametric Probabilistic Forecasting with Applications in Photovoltaic Systems. In: Proc., 26. Workshop Computational Intelligence, Dortmund, S. 9–30, 2016. [36] G ONZÁLEZ O RDIANO , J. Á.; WACZOWICZ , S.; R EISCHL , M.; M IKUT, R.; H AGENMEYER , V.: Photovoltaic Power Forecasting using Simple Data-driven Models without Weather Data. Computer Science - Research and Development (2016), S. 1–10. [37] G RUBE , M.: Ein neues Konzept zur Diagnose elektrochemischer Sensoren am Beispiel von pHGlaselektroden. Dissertation, Karlsruher Institut für Technologie (KIT), KIT Scientific Publishing, in Vorbereitung, 2011. [38] VON G UNDLACH , A.; G ARAMUS , V.; G ORNIAK , T.; DAVIES , H.; R EISCHL , M.; M IKUT, R.; H ILPERT, K.; ROSENHAHN , A.: Small Angle X-ray Scattering as a High-throughput Method to Classify Antimicrobial Modes of Action. Biochimica et Biophysica Acta (BBA)-Biomembranes 1858 (2016) 5, S. 1024–1033. [39] G UPTA , P.; S HARMA , A.; J INDAL , R.: Scalable Machine-Learning Algorithms for Big Data Analytics: A Comprehensive Review. Wiley Interdisciplinary Reviews: Data Mining and Knowledge Discovery (2016), S. 194–214. [40] H AGENMEYER , V.; C AKMAK , H. K.; D ÜPMEIER , C.; FAULWASSER , T.; I SELE , J.; K ELLER , H. B.; KOHLHEPP, P.; K ÜHNAPFEL , U.; S TUCKY, U.; WACZOWICZ , S.; M IKUT, R.: Information and Communication Technology in Energy Lab 2.0: Smart Energies System Simulation and Control Center with an Open-Street-Map-based Power Flow Simulation Example. Energy Technology 4 (2016), S. 145–162. [41] H ALL , M.; F RANK , E.; H OLMES , G.; P FAHRINGER , B.; R EUTEMANN , P.; W ITTEN , I. H.: The WEKA Data Mining Software: An Update. Association for Computing Machinery SIGKDD Explorations Newsletter 11 (2009) 1, S. 10–18.
184
Bibliography
[42] H AYKIN , S.: Neural Networks: A Comprehensive Foundation. Upper Saddle River, NJ: Prentice Hall, 1994. [43] H ETTICH , S.; BAY, S. D.: The UCI KDD Archive. Irvine, CA: University of California, Department of Information and Computer Science. http://kdd.ics.uci.edu, 1999. [44] H IEBL , B.; B OG , S.; M IKUT, R.; BAUER , C.; G EMEINHARDT, O.; J UNG , F.; K RÜGER , T.: In vivo Assessment of Tissue Compatibility and Functionality of a Polyimide Cuff Electrode for Recording Afferent Peripheral Nerve Signals. Applied Cardiopulmonary Pathophysiology 14 (2010), S. 212–219. [45] H O , N. Y.; YANG , L.; L EGRADI , J.; A RMANT, O.; TAKAMIYA , M.; R ASTEGAR , S.; S TRÄHLE , U.: Gene Responses in the Central Nervous System of Zebrafish Embryos Exposed to the Neurotoxicant Methyl Mercury. Environmental Science & Technology 47 (2013) 7, S. 3316–3325. [46] H ÖPPNER , F.; K LAWONN , F.; K RUSE , R.: Fuzzy Cluster Analysis. New York: John Wiley, 1999. [47] H YVÄRINEN , A.: Survey on Independent Component Analysis. Neural Computing Surveys 2 (1999), S. 94–128. [48] JAIN , A. K.: Data Clustering: 50 Years Beyond K-means. Pattern Recognition Letters 31 (2010) 8, S. 651–666. [49] JAIN , A. K.; D UIN , R. P. W.; M AO , J.: Statistical Pattern Recognition: A Review. IEEE Transactions on Pattern Analysis and Machine Intelligence 22(1) (2000), S. 4–36. [50] J ÄKEL , J.; G RÖLL , L.; M IKUT, R.: Tree-Oriented Hypothesis Generation for Interpretable Fuzzy Rules. In: Proc., 7th European Congress on Intelligent Techniques and Soft Computing EUFIT’99, S. 279–280, Aachen, CD-ROM, 1999. [51] K ELLER , S.: Datenbasierte Analyse und Modellbildung zur Abschätzung spezifischer Gefahren des Klimawandels für Straßen-Methodik und Szenarien. Dissertation, Karlsruhe, Karlsruher Institut für Technologie (KIT), Diss., 2015, 2015. [52] K HAN , A.; R EISCHL , M.; S CHWEITZER , B.; W EISS , C.; M IKUT, R.: Feedback-Driven Design of Normalization Techniques for Biological Images Using Fuzzy Formulation of a Priori Knowledge. Studies in Computational Intelligence 445 (2013), S. 167–178. [53] K HAN , A. U . M.; M IKUT, R.; R EISCHL , M.: A Benchmark Data Set to Evaluate the Illumination Robustness of Image Processing Algorithms for Object Segmentation and Classification. PLoS One 10 (2015) 7, S. e0131098. [54] K HAN , A. U . M.; M IKUT, R.; R EISCHL , M.: A New Feedback-Based Method for Parameter Adaptation in Image Processing Routines. PloS one 11 (2016) 10, S. e0165180. [55] K IENDL , H.: Fuzzy Control methodenorientiert. München: Oldenbourg, 1997. [56] K NAPPE , D.; RUDEN , S.; L ANGANKE , S.; T IKKOO , T.; R ITZER , J.; M IKUT, R.; M ARTIN , L. L.; H OFFMANN , R.; H ILPERT, K.: Optimization of Oncocin for Antibacterial Activity using a SPOT Synthesis Approach: Extending the Pathogen Spectrum to Staphylococcus aureus. Amino Acids 48 (2016) 1, S. 269–280.
Bibliography
185
[57] KOKEL , D.; D UNN , T.; A HRENS , M.; A LSHUT, R.; C HEUNG , C. Y.; S AINT-A MANT, L.; B RUNI , G.; M ATEUS , R.; VAN H AM , T.; S HIRAKI , T.; F UKADA , Y.; KOJIMA , D.; Y EH , J.R.; M IKUT, R.; VON L INTIG , J.; E NGERT, F.; P ETERSON , R.: Identification of Non-visual Photomotor Response Cells in the Vertebrate Hindbrain. The Journal of Neuroscience 33 (2013) 9, S. 3834–3843. [58] KONEN , W.; KOCH , P.; F LASCH , O.; BARTZ -B EIELSTEIN , T.; F RIESE , M.; NAUJOKS , B.: Tuned Data Mining: A Benchmark Study on Different Tuners. In: Proc., 13th Annual Conference on Genetic and Evolutionary Computation, S. 1995–2002, ACM, 2011. [59] K REIDER , J. F.; H ABERL , J. S.: The Great Energy Predictor Shootout. In: Proc., ASHRAE Meeting, 1993. [60] K ROLL , A.: Computational Intelligence. De Gruyter Oldenbourg, 2016. [61] K RUSE , R.; J. G EBHARDT, F. K.: Foundations of Fuzzy Systems. New York: John Wiley, 1994. [62] L ANDSET, S.; K HOSHGOFTAAR , T. M.; R ICHTER , A. N.; H ASANIN , T.: A Survey of Open Source Tools for Machine Learning with Big Data in the Hadoop Ecosystem. Journal of Big Data 2 (2015) 1, S. 24. [63] L IPOVEI , M.: Evaluation of Biometric Signal Characteristics for Movement Classification. Diplomarbeit, Universität Bukarest, Forschungszentrum Karlsruhe, 2004. [64] L OOSE , T.: Konzept für eine modellgestützte Diagnostik mittels Data Mining am Beispiel der Bewegungsanalyse. Dissertation, Universität Karlsruhe, Universitätsverlag Karlsruhe, 2004. [65] M AASS , H.; C AKMAK , H.; S UESS , W.; Q UINTE , A.; JAKOB , W.; S TUCKY, K.-U.; K UEHNAPFEL , U.: First Evaluation Results Using the New Electrical Data Recorder for Power Grid Analysis. IEEE Transactions on Instrumentation and Measurement 62 (2013) 9, S. 2384– 2390. [66] M AASS , H.; C AKMAK , H. K.; BACH , F.; M IKUT, R.; H ARRABI , A.; S ÜSS , W.; JAKOB , W.; S TUCKY, K.-U.; K ÜHNAPFEL , U. G.; H AGENMEYER , V.: Data Processing of High Rate Low Voltage Distribution Grid Recordings for Smart Grid Monitoring and Analysis. EURASIP Journal on Advances in Signal Processing 1 (2015), S. 1–21. [67] M ARCATO , D.; A LSHUT, R.; B REITWIESER , H.; M IKUT, R.; S TRÄHLE , U.; P YLATIUK , C.; P ERAVALI , R.: An Automated and High-throughput Photomotor Response Platform for Chemical Screens. In: Proc., 37th Annual International Conference of the IEEE Engineering in Medicine and Biology Society (EMBS), 2015. [68] M ENG , X.; B RADLEY, J.; Y UVAZ , B.; S PARKS , E.; V ENKATARAMAN , S.; L IU , D.; F REEMAN , J.; T SAI , D.; A MDE , M.; OWEN , S.; ET AL .: MLlib: Machine Learning in Apache Spark. Journal of Machine Learning Research 17 (2016) 34, S. 1–7. [69] M ICHIE , D.; S PIEGELHALTER , D.; TAYLOR , C.: Machine Learning, Neural and Statistical Classification. Ellis Horwood, 1994. [70] M IKUT, R.: Data Mining in der Medizin und Medizintechnik. Universitätsverlag Karlsruhe, 2008. [71] M IKUT, R.: Computer-based Analysis, Visualization, and Interpretation of Antimicrobial Peptide Activities. Methods in Molecular Biology 618 (2010), S. 287–299.
186
Bibliography
[72] M IKUT, R.; B URMEISTER , O.; B RAUN , S.; R EISCHL , M.: The Open Source Matlab Toolbox Gait-CAD and its Application to Bioelectric Signal Processing. In: Proc., DGBMT-Workshop Biosignalverarbeitung, Potsdam, S. 109–111, 2008. [73] M IKUT, R.; B URMEISTER , O.; G RÖLL , L.; R EISCHL , M.: Takagi-Sugeno-Kang Fuzzy Classifiers for a Special Class of Time-Varying Systems. IEEE Transactions on Fuzzy Systems 16(4) (2008), S. 1038–1049. [74] M IKUT, R.; H ILPERT, K.: Interpretable Features for the Activity Prediction of Short Antimicrobial Peptides Using Fuzzy Logic. International Journal of Peptide Research and Therapeutics 15(2) (2009), S. 129–137. [75] M IKUT, R.; J ÄKEL , J.; G RÖLL , L.: Inference Methods for Partially Redundant Rule Bases. In: Fuzzy Control: Theory and Practice (H AMPEL , R.; WAGENKNECHT, M.; C HAKER , N., Hg.), Advances in Soft Computing, S. 177–185, Heidelberg: Physica, 2000. [76] M IKUT, R.; J ÄKEL , J.; G RÖLL , L.: Interpretability Issues in Data-Based Learning of Fuzzy Systems. Fuzzy Sets and Systems 150(2) (2005), S. 179–197. [77] M IKUT, R.; R EISCHL , M.: Data Mining Tools. Wiley Interdisciplinary Reviews: Data Mining and Knowledge Discovery 1 (2011) 5, S. 431–443. [78] M IKUT, R.; R EISCHL , M.; B URMEISTER , O.; L OOSE , T.: Data Mining in Medical Time Series. Biomedizinische Technik 51(5/6) (2006), S. 288–293. [79] M IKUT, R.; RUDEN , S.; R EISCHL , M.; B REITLING , F.; VOLKMER , R.; H ILPERT, K.: Improving Short Antimicrobial Peptides Despite Elusive Rules for Activity. Biochimica et Biophysica Acta (BBA)-Biomembranes 1858 (2016) 5, S. 1024–1033. [80] M IKUT, R.; S TEGMAIER , J.; BARTSCHAT, A.; D ONEIT, W.; Á NGEL G ONZÁLEZ O RDIANO , J.; P ETER , N.; S CHOTT, B.; WACZOWICZ , S.; R EISCHL , M.: SciXMiner: A MATLAB Toolbox for Data Mining of Multidimensional Data. Submitted paper (2017). [81] P FRIEM , A.: Neues Konzept für ein modulares Robotersystem zur automatischen Untersuchung von Zebrabärblingen in Hochdurchsatzverfahren. Dissertation, Karlsruher Institut für Technologie (KIT), 2016. [82] P YCHYNSKI , T.; B LESINGER , G.; M IKUT, R.; D ULLENKOPF, K.; BAUER ., H.-J.: Modelling the Labyrinth Seal Discharge Coefficient Using Data Mining Methods. In: Proc., ASME TURBO EXPO; Glasgow, 2010. [83] P YLATIUK , C.; M ÜLLER -R IEDERER , M.; K ARGOV, A.; S CHULZ , S.; S CHILL , O.; R EISCHL , M.; B RETTHAUER , G.: Comparison of Surface EMG Monitoring Electrodes for Long-term Use in Rehabilitation Device Control. In: Proc., International Conference on Rehabilitation Robotics, Kyoto, 2009. [84] P YLATIUK , C.; S ANCHEZ , D.; M IKUT, R.; A LSHUT, R.; R EISCHL , M.; H IRTH , S.; ROTTBAUER , W.; J UST, S.: Automatic Zebrafish Heartbeat Detection and Analysis for Zebrafish Embryos. Zebrafish 11 (2014), S. 379–383. [85] Q UINLAN , J. R.: C4.5: Programs for Machine Learning. San Mateo, CA: Morgan Kaufmann, 1993.
Bibliography
187
[86] R AMON -G ARCIA , S.; M IKUT, R.; N G , C.; RUDEN , S.; VOLKMER , R.; R EISCHL , M.; H ILPERT, K.; T HOMPSON , C. J.: Targeting Mycobacterium tuberculosis and other Microbial Pathogens using Improved Synthetic Antibacterial Peptides. Antimicrobial Agents and Chemotherapy 57 (2013) 5, S. 2295–2303. [87] R EISCHL , M.: Ein Verfahren zum automatischen Entwurf von Mensch-Maschine-Schnittstellen am Beispiel myoelektrischer Handprothesen. Dissertation, Universität Karlsruhe, Universitätsverlag Karlsruhe, 2006. [88] R EISCHL , M.; G RÖLL , L.; M IKUT, R.: Optimized Classification of Multiclass Problems Applied to EMG-Control of Hand Prostheses. In: Proc., IEEE International Joint Conference on Neural Networks, S. 1473–1478, Budapest, 2004. [89] R EISCHL , M.; G RÖLL , L.; M IKUT, R.: Evaluation of Data Mining Approaches for the Control of Multifunctional Arm Prostheses. Integrated Computer-Aided Engineering 18 (2011), S. 235–249. [90] R EISCHL , M.; M IKUT, R.; P YLATIUK , C.; S CHULZ , S.; B ECK , S.; B RETTHAUER , G.: Steuerungs- und Signalverarbeitungskonzepte für eine multifunktionale Handprothese. atAutomatisierungstechnik 50(6) (2002), S. 279–286. [91] R EISCHL , M.; T UGA , M. R.; M EISTER , L.; A LBERG , E.; D ONEIT, W.; L IEBETANZ , D.; RUPP, R.; M IKUT, R.: Einfluss von Trainingseffekten auf die Parameteradaption für Mensch-MaschineSchnittstellen in der Medizintechnik. at-Automatisierungstechnik 64 (2016) 10, S. 816–826. [92] R EISCHL , M.; W ITTENBERG , A.; K ARCHER , C.; M IKUT, R.: Asphalt Image Miner: A Tool for Automatic Quantification of Grains in Asphalt Samples. at-Automatisierungstechnik 62 (2014) 9, S. 676–683. [93] RUNKLER , T. A.: Data Analytics: Models and Algorithms for Intelligent Data Analysis. SpringerLink: Bücher, Wiesbaden: Springer Vieweg, 2nd ed. 2016 Aufl., 2016. [94] S CHABLOWSKI , M.; S CHWEIDLER , J.; RUPP, R.: HeiDATAProVIT-Heidelberg Data Archiving, Tag Assembling, Processing and Visualization Tool. Computer Methods and Programs in Biomedicine 73 (2004), S. 61–70. [95] S CHABLOWSKI -T RAUTMANN , M.: Konzept zur Analyse der Lokomotion auf dem Laufband bei inkompletter Querschnittlähmung mit Verfahren der nichtlinearen Dynamik. Dissertation, Universität Karlsruhe, Universitätsverlag Karlsruhe, 2006. [96] S CHILL , O.: Konzept zur automatisierten Anpassung der neuronalen Schnittstellen bei nichtinvasiven Neuroprothesen. Dissertation, Karlsruher Institut für Technologie, KIT Scientific Publishing, 2014. [97] S CHILL , O.; RUPP, R.; P YLATIUK , C.; S CHULZ , S.; R EISCHL , M.: Automatic Adaptation of a Self-Adhesive Multi-Electrode Array for Active Wrist Joint Stabilization in Tetraplegics. In: Proc., IEEE Toronto International Conference–Science and Technology for Humanity, 2009. [98] S CHÖLKOPF, B.: Support Vector Learning. München: Oldenbourg, 1997. [99] S CHOTT, B.; S TEGMAIER , J.; A RBAUD , A.; R EISCHL , M.; M IKUT, R.; L ÉVI , F.: Robust Individual Circadian Parameter Estimation for Biosignal-based Personalisation of Cancer Chronotherapy. In: Proc., Workshop Biosignal Processing, Berlin, arXiv preprint arXiv:1604.02909, 2016.
188
Bibliography
[100] S HAHID , M.; TAKAMIYA , M.; S TEGMAIER , J.; M IDDEL , V.; G RADL , M.; K LÜVER , N.; M IKUT, R.; D ICKMEIS , T.; S CHOLZ , S.; R ASTEGAR , S.; YANG , L.; S TRÄHLE , U.: Zebrafish Biosensor for Toxicant Induced Muscle Hyperactivity. Scientific Reports 6 (2016) 23768, S. 1–14. [101] S TEGMAIER , J.: New Methods to Improve Large-Scale Microscopy Image Analysis with Prior Knowledge and Uncertainty. Dissertation, Karlsruhe Institute of Technology, 2016. [102] S TEGMAIER , J.; A LSHUT, R.; R EISCHL , M.; M IKUT, R.: Information Fusion of Image Analysis, Video Object Tracking, and Data Mining of Biological Images using the Open Source MATLAB Toolbox Gait-CAD. Biomedizinische Technik (Biomedical Engineering) 57 (S1) (2012), S. 458– 461. [103] S TEGMAIER , J.; A MAT, F.; L EMON , W. B.; M C D OLE , K.; WAN , Y.; T EODORO , G.; M IKUT, R.; K ELLER , P. J.: Real-Time Three-Dimensional Cell Segmentation in Large-Scale Microscopy Data of Developing Embryos. Developmental Cell 36 (2016) 2, S. 225–240. [104] S TEGMAIER , J.; S CHOTT, B.; H ÜBNER , E.; T RAUB , M.; S HAHID , M.; TAKAMIYA , M.; KO BITSKI , A.; H ARTMANN , V.; S TOTZKA , R.; VAN W EZEL , J.; S TREIT, A.; N IENHAUS , G. U.; S TRÄHLE , U.; R EISCHL , M.; M IKUT, R.: Automation Strategies for Large-Scale 3D Image Analysis. at-Automatisierungstechnik 64 (2016) 7, S. 555–566. [105] S TEGMAIER , J.; S HAHID , M.; TAKAMIYA , M.; YANG , L.; R ASTEGAR , S.; R EISCHL , M.; S TRÄHLE , U.; M IKUT, R.: Automated Prior Knowledge-Based Quantification of Neuronal Patterns in the Spinal Cord of Zebrafish. Bioinformatics 30 (2014) 5, S. 726–733. [106] S TONE , J.: Independent Component Analysis: An Introduction. Trends in Cognitive Sciences 6(2) (2002), S. 59–64. [107] TATSUOKA , M. M.: Multivariate Analysis. New York: Macmillan, 1988. [108] T RUJILLO -O RTIZ , A.; H ERNANDEZ -WALLS , R.; C ASTRO -P EREZ , A.; L. RODRIGUEZ -C ARDOZO , N.; R AMOS -D ELGADO; G ARCIA -S ANCHEZ , R.: Fisherextest: Fisher’s Exact Probability Test. A MATLAB file. [WWW document]. http://www.mathworks.com/matlabcentral/fileexchange/loadFile.do?objectId=5957, 2004. [109] V ESANTO , J.; H IMBERG , J.; A LHONIEMI , E.; PARHANKANGAS , J.: SOM Toolbox for MATLAB. Techn. Ber., Helsinki University of Technology, 2000. [110] WACZOWICZ , S.; K LAIBER , S.; B RETSCHNEIDER , P.; KONOTOP, I.; W ESTERMANN , D.; R EISCHL , M.; M IKUT, R.: Data mining to analyse the effects of price signals on household electricity customers. at-Automatisierungstechnik 62 (2014) 10, S. 740–752. [111] WACZOWICZ , S.; R EISCHL , M.; K LAIBER , S.; B RETSCHNEIDER , P.; KONOTOP, I.; W ESTER MANN , D.; H AGENMEYER , V.; M IKUT, R.: Virtual Storages as Theoretically Motivated Demand Response Models for Enhanced Smart Grid Operations. Energy Technology 4 (2016), S. 163–176. [112] W ILLIAMS , G.: Data Mining with Rattle and R: The Art of Excavating Data for Knowledge Discovery. Springer Science & Business Media, 2011. [113] W OLF, S.; B RAATZ , F.; M ETAXIOTIS , D.; A RMBRUST, P.; D REHER , T.; D ÖDERLEIN , L.; M IKUT, R.: Gait analysis may help to distinguish hereditary spastic paraplegia from cerebral palsy. Gait & Posture 33(4) (2011), S. 556–561.
Bibliography
189
[114] W OLF, S.; L OOSE , T.; S CHABLOWSKI , M.; D ÖDERLEIN , L.; RUPP, R.; G ERNER , H. J.; B RETTHAUER , G.; M IKUT, R.: Automated Feature Assessment in Instrumented Gait Analysis. Gait & Posture 23(3) (2006), S. 331–338. [115] W OLF, S. I.; M IKUT, R.; K RANZL , A.; D REHER , T.: Which Functional Impairments are the Main Contributors to Pelvic Anterior Tilt during Gait in Individuals with Cerebral Palsy? Gait & Posture 39 (2014) 1, S. 359–364. [116] Y U , K.; L AI , B. F.; G ANI , J.; M IKUT, R.; H ILPERT, K.; K IZHAKKEDATHU , J. N.: Interaction of Blood Components with Cathelicidins and their Modified Versions. Biomaterials 69 (2015), S. 201–211. [117] Z ADEH , L.: Fuzzy Sets. Information and Control 8 (1965), S. 338–353.