Blonk, T.J., Duin, R. van, 1992: CO2-Emissies Vanwege Nederlands .... Paper presented at the NOP-MLK symposium, 29-30 October, Garderen. Gielen, D.J. ...
March 2001
This project is carried out in the framework of the Dutch National Research Programme on Global Air Pollution and Climate Change registered under nr. 953214, entiteld:
THE MATTER PROJECT Integrated energy and materials systems engineering for GHG emission mitigation
T. Kram, D.J. Gielen, A.J.M. Bos, M.A.P.C. de Feber, T. Gerlagh and B.J. Groenendaal ECN Policy Studies H.C. Moll, M.E. Bouwman and B.W. Daniëls IVEM, Groningen University E. Worrell, M.P. Hekkert and L.A.J. Joosten NW&S, Utrecht University P. Groenewegen and T. Goverse Free University of Amsterdam
Vrije Universiteit amsterdam
2
ABSTRACT In industrialized regions like OECD Europe, today the production and processing of a limited number of bulk materials represents the lion’s share of industrial energy consumption and emissions of greenhouse gases (GHGs) from the sector. Most current studies of future options to reduce GHG emissions fail to encompass the options, limitations and interactions between commonly addressed energy system changes and innovative ways to meet the future demands for material goods. Although approaches like Life Cycle Analysis (LCA) and Material Flow Analysis (MFA) are developed and applied with this very goal in mind, it is argued here that only a fully interlinked and dynamic systems approach, covering energy and material flows can reveal the merits of options like new material processes, substitution, recycling and re-use and changes in product design. To this end a new model is built, drawing upon widely adopted energy systems models like MARKAL, but integrating material flows and the specific challenges posed by the dynamics of materials and products. The resulting MATTER model draws upon a series of in-depth studies of key groups of materials (metals, organic chemicals and building materials) and product groups (packaging, buildings, road vehicles). These in-depth studies address current situation and trends and new possibilities and trends in a detailed way, accounting for the specific conditions and practices of the sectors involved. As such they provide valuable overviews in their own right. At the same time, more generalized and stylized information is extracted for specification of the MATTER model. Together, the sector studies and the overall integrated model analyses give complementary insights in longer-term prospects for GHG emission mitigation associated directly and indirectly with production, consumption and waste management of materials as induced by the demand for goods and services in OECD Europe in the next 50 years. The first analyses indicate good prospects for materials oriented policies, integrated with more common energy system adjustments, to reduce GHG emissions: costs to meet a given emission target can be significantly lowered if materials options are included in the assessment.
3
CONTENTS ABSTRACT .................................................................................................................................................................... 3 SAMENVATTING ......................................................................................................................................................... 8 1.
INTRODUCTION ............................................................................................................................................... 20 1.1 PROJECT FRAMEWORK ....................................................................................................................................... 20 1.2 PROJECT GOAL ................................................................................................................................................... 20 1.3 PROJECT PRODUCTS ........................................................................................................................................... 24 1.4 DEVIATIONS FROM THE ORIGINAL PROJECT PLAN ............................................................................................... 25
2.
METHODOLOGICAL ISSUES......................................................................................................................... 26 2.1 OVERVIEW ......................................................................................................................................................... 27 2.2 THE MATTER3.0 MARKAL MODEL................................................................................................................ 27 2.2.1
The essentials of a MARKAL model ......................................................................................................... 27
2.2.2
The distinction between the energy system and the materials system....................................................... 31
2.3 DEMAND ELASTICITIES....................................................................................................................................... 35 3.
INTEGRATED ENERGY AND MATERIALS STRATEGIES ..................................................................... 42 3.1 GENERAL RESULTS FOR GHG EMISSION REDUCTION ......................................................................................... 42 3.2 GENERAL ANALYSIS OF THE CONTRIBUTION OF MATERIALS OPTIONS ................................................................ 45 3.3 CONCLUSIONS .................................................................................................................................................... 49
4.
IRON AND STEEL ............................................................................................................................................. 52 4.1 INTRODUCTION .................................................................................................................................................. 52 4.1.1
Processes and definition of production routes.......................................................................................... 53
4.1.2
Short route descriptions............................................................................................................................ 57
4.2 THE MEASURE OF ATTRACTIVENESS OF OPTIONS: NET PRESENT VALUE ............................................................ 62 4.3 COSTS AND EMISSIONS STRUCTURE .................................................................................................................... 64 4.4 THE INFLUENCE OF ELECTRICITY EMISSION FACTORS AND TAXES ON THE NPV................................................. 68 4.4.1
Standard values of prices and other external parameters ........................................................................ 69
4.4.2
No upgrade requirements ......................................................................................................................... 76
4.4.3
Results overview ....................................................................................................................................... 78
4.5 VARIATIONS IN THE COSTS OF SHIFTS ................................................................................................................. 78 4.5.1
The integrated plant.................................................................................................................................. 79
4.5.2
The mini-mill ............................................................................................................................................ 84
4.6 PROBABILITY OF TECHNOLOGY INTRODUCTION ................................................................................................. 85 5.
PETROCHEMICALS ......................................................................................................................................... 88 5.1 INTRODUCTION .................................................................................................................................................. 88 5.2 RESULTS ............................................................................................................................................................ 90 5.2.1
4
The petrochemical complex structure....................................................................................................... 90
5.3 CONCLUSIONS .................................................................................................................................................... 95 6.
REDUCTION OF CO2 EMISSIONS BY IMPROVED MANAGEMENT OF PACKAGING MATERIALS ............................................................................................................................................................................. 100 6.1 INTRODUCTION ................................................................................................................................................ 100 6.2 MATERIAL USE FOR PACKAGING IN EUROPE..................................................................................................... 102 6.3 DESCRIPTION OF MEASURES FOR MORE EFFICIENT MATERIAL USE. .................................................................. 103 6.4 POTENTIAL FOR CO2 EMISSION REDUCTION ..................................................................................................... 108 6.4.1
Static analysis......................................................................................................................................... 108
6.4.2
Dynamic Analysis ................................................................................................................................... 114
6.5 DISCUSSION AND CONCLUSION ........................................................................................................................ 118 7.
BUILDINGS AND INFRASTRUCTURE ....................................................................................................... 120 7.1 INTRODUCTION ................................................................................................................................................ 120 7.2 ANALYSIS OF CO2 EMISSIONS FOR BUILDINGS.................................................................................................. 120 7.3 CHARACTERISATION OF IMPROVEMENT OPTIONS ............................................................................................. 124 7.3.1
Increased resource efficiency ................................................................................................................. 127
7.3.2
Increased materials efficiency ................................................................................................................ 128
7.3.3
Increased product efficiency................................................................................................................... 131
7.3.4
Resource substitution.............................................................................................................................. 132
7.3.5
Materials substitution ............................................................................................................................. 133
7.4 THE IMPACT OF A CHANGING ENERGY AND MATERIALS SYSTEM CONFIGURATION ........................................ 137 7.5 CONCLUSIONS .................................................................................................................................................. 139 8.
ROAD VEHICLES............................................................................................................................................ 142 8.1 INTRODUCTION: ROAD VEHICLES AND MATERIAL USE ..................................................................................... 142 8.2 MATERIAL - ENERGY INTERACTIONS ................................................................................................................ 143 8.3 CHANGING STANDARD ..................................................................................................................................... 145 8.4 APPLIED METHODOLOGY FOR ASSESSING MATERIAL SUBSTITUTION OPTIONS .................................................. 147 8.5 MATERIAL FLOWS ASSOCIATED WITH PASSENGER CARS .................................................................................. 147 8.6 REDUCTION POTENTIAL OF ENERGY AND MATERIAL USE IN PASSENGER CARS ................................................. 160 8.7 CONCLUSIONS AND CONSIDERATIONS .............................................................................................................. 164
9.
AGRICULTURE AND FORESTRY ............................................................................................................... 166 9.1 INTRODUCTION ................................................................................................................................................ 166 9.2 AGRICULTURE, FORESTRY, AND THE GHG PROBLEM ...................................................................................... 167 9.3 THE BIOMASS SUPPLY AND DEMAND SITUATION .............................................................................................. 172 9.4 AGRICULTURE AND FORESTRY MODEL STRUCTURE.......................................................................................... 173 9.5 SCENARIO CHARACTERISTICS ........................................................................................................................... 175 9.6 RESULTS .......................................................................................................................................................... 176 9.7 CONCLUSIONS .................................................................................................................................................. 181 ANNEX 1 SELECTION OF BIOMASS STRATEGIES: THE IMPACT OF THE DISCOUNT RATE AND THE MARKAL COST OPTIMISATION ALGORITHM ....................................................................................................................................... 184
5
10.
BARRIERS: TECHNICAL OPTIONS AND INNOVATIONS ................................................................ 188
10.1
INTRODUCTION ............................................................................................................................................ 188
10.2
ADJUSTMENT OF MODEL INPUT .................................................................................................................... 190
10.3
THEORIES OF TECHNICAL CHANGE ............................................................................................................... 191
10.3.1
Innovation typology............................................................................................................................ 192
10.3.2
The role of networks........................................................................................................................... 195
10.3.3
Sector developments and innovation.................................................................................................. 196
10.3.4
Conclusion ......................................................................................................................................... 197
10.4
IMPLEMENTATION CHARACTERISTICS OF OPTIONS ....................................................................................... 198
10.4.1
Socio-economic characterisation of technological options: the quick-scan ...................................... 198
10.5
SECTOR ANALYSIS OF BARRIERS .................................................................................................................. 202
10.6
CONSTRUCTION AS EXTENDED EXAMPLE OF A SECTOR ANALYSIS OF TECHNICAL CHANGE .......................... 205
10.6.1
Sector innovation ............................................................................................................................... 206
10.6.2
Technological systems in construction............................................................................................... 207
10.6.3
National influence on innovation & technology development............................................................ 208
10.6.4
Implementing CO2 options in construction: three examples .............................................................. 208
10.6.5
Future modeling and technical change efforts ................................................................................... 212
10.7 11.
CONCLUSIONS AND DISCUSSION .................................................................................................................. 215 CONCLUSIONS............................................................................................................................................ 218
11.1
CONCLUSIONS.............................................................................................................................................. 218
11.1.1
Methodological Contributions ........................................................................................................... 218
11.1.2
Materials Strategies for Greenhouse Gas Emission Mitigation......................................................... 219
11.1.3
The Consequences and the Limits of the MARKAL Modelling Approach for the Conclusions.......... 222
11.2
RECOMMENDATIONS.................................................................................................................................... 225
11.2.1
Recommendations for policy-makers ................................................................................................. 225
11.2.2
Recommendations for Further Greenhouse Gas Emission Reduction Studies................................... 230
REFERENCES ........................................................................................................................................................... 233
6
7
SAMENVATTING Inleiding en methodologie In de afgelopen decennia is een groot aantal studies uitgevoerd naar de mogelijkheden om verdergaande economische groei te realiseren, rekening houdend met emissie plafonds ter voorkoming van klimaatverandering door menselijk handelen. De meeste kwantitatieve analyses maken gebruik van ofwel top-down modellen, ofwel van bottom-up proces modellen. In de literatuur is en wordt veel aandacht besteed aan de verschillen en de voors en tegens van beide benaderingen, ondanks de vele aandacht voor pogingen om een integratie tot stand te brengen tussen de hoofdzakelijk gedragsgedreven economische modellen en fysiek georiënteerde technische modellen. Nadere bestudering van beide typen leert dat in geen van beide goed toegerust is om het potentiële belang van (veranderingen in) materiaalstromen in kaart te brengen. Dit ondanks dat productie en bewerking van een beperkt aantal basis materialen het leeuwendeel van het industriële energie gebruik en broeikasgas (BKG) emissies vertegenwoordigen. Industrietakken als ijzer en staal, aluminium en andere non-ferro metalen, petrochemie, hout, papier en karton, anorganische chemie, cement en andere keramiek leveren samen ca. 85% van alle huidige BKG emissies vanuit de industrie. Verder is de keuze voor materialen en productieprocessen nogal eens mede bepalend voor energie gebruik van de resulterende producten. Bijvoorbeeld, lichtere verpakkingen leiden tot een lager energie gebruik voor transport van producten. Tenslotte blijven de producten ook na afdanking invloed uitoefenen op gebruik van materialen en energie en de daarbij behorende emissies. Recycling en hergebruik, mogelijk gemaakt door een adequaat afvalbeleid, heeft evenals de verwerking van organisch afval en vuilverbranding invloed op het (netto) energie gebruik en BKG emissies. Tot dusverre is het inzicht dat materiaalstromen (a) een belangrijke factor vormen voor het doorgronden van huidige energie en emissie trends en (b) een belangrijke bron van opties vormen voor toekomstige verbeteropties niet wijd verspreid. Zoals hierboven is gesteld laten de belangrijkste onderzoeks richtingen geen expliciete behandeling toe van de drijvende krachten en relevante mechanismen achter veranderingen in toekomstige materiaalstromen, met name in relatie tot het klimaatprobleem en andere aspecten van duurzame ontwikkeling. Wel zijn er innovatieve methoden en instrumenten ontwikkeld en in toenemende mate toegepast met het doel om meer inzicht te krijgen in product ketens en materiaalstromen. Levenscyclus analyse (LCA) is ontwikkeld om de directe en indirecte energie en milieu impacts te bepalen van een bepaald product, bepaald voor alle stappen van (primaire) grondstoffen tot en met de definitieve afvalverwerking. Hoewel LCA ongetwijfeld nuttig bruikbare inzichten verschaft, met name om knelpunten en verbetermogelijkheden op te sporen, zijn de gangbare modellen te zeer afhankelijk van veelal statische multipliers voor de bepaling van energie gebruik en milieu-indicator niveaus. Een andere lijn is de materiaalstroom analyse (Materierial Flow Analysis - MFA), waarin materialen getraceerd worden van herkomst tot eindbestemming met alle bewerkingen daartussenin. Het materiaal staat dus centraal in tegenstelling tot LCA waar het product centraal staat. Doelstellingen van MATTER Startpunt voor de MATTER studie is de notie dat nu ingezet klimaatbeleid nog niet geleid heeft tot een stabilisering van BKG emissies, zelfs niet in de hoogontwikkelde westerse industrielanden. Dit ondanks de brede steun voor een absolute vermindering van BKG uitstoot, zoals tot uitdrukking komt in nationaal en internationaal beleid. Vandaar het belang om alle mogelijke opties nader te bekijken en, mits ze veelbelovend lijken, in de beleidsvorming te betrekken. Hier wordt zo'n gebied onderzocht, namelijk de rol van materialen in de economie. Doel is het inzicht te vergroten in potentieel belang en kosten van BKG reducties middels veranderingen in productie en gebruik van materialen in OECD Europa. Momenteel is nog weinig bekend van zulke materiaal strategieën en evenmin van hun interacties met de gewoonlijk bestudeerde BKG reductie strategieën binnen de energiesector. De twee hoofdvragen zijn: (1) hoe kan het potentieel van materiaal strategieën bepaald worden; en (2) in welke mate kunnen veanderingen in het materialen systeem bijdragen aan reductie van BKG emissies? Gezien het vernieuwende karakter van de studie konden voor de hand liggende vervolg vragen over de (on)mogelijkheden van de huidige beleidspraktijk om adequate materiaal strategieën te identificeren en bevorderen, of de rol van tegenkrachten (bijv. potentiële bedreiging van gevestigde economische belangen, institutionele barrières in de markt, e.d.) niet uitvoerig behandeld worden. Enkele aspecten, zoals mogelijke weglekeffecten (carbon leakage) en barrières voor innovatie in de bouwsector komen aan de orde, maar staan niet centraal in de eigenlijke MATTER analyse.
8
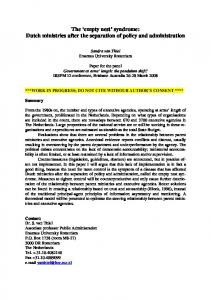
Geïntegreerde energie- en materiaal strategieën Het integrale energie/materiaal systeem-analytische model is ontwikkeld en toegepast in een aantal opeenvolgende versies in het kader van het MATTER project. Iedere versie bouwt voort op de voorgaande, maar voegt sectoren, BKG bronnen en/of nieuwe model eigenschappen toe. Met dit nieuwe model, eveneens MATTER (of MARKALMATTER) genaamd, is een serie analyses uitgevoerd (zie Hoofdstuk 3), startend met een baseline scenario zonder specifiek BKG beleid. In de baseline komt het post-industriele karakter van de West-Europese economie al naar voren. Terwijl het BNP met een factor 3,5 groeit tot het jaar 2050, stijgen in dezelfde periode de BKG emissies maar beperkt met niet meer dan 25%. Met deze baseline als uitgangspunt is een aantal andere cases onderzocht met een toenemende prijs op BKG emissies lopend van een bescheiden 20 EURO tot een zeer hoog niveau van 200 EURO per ton CO2eq. Bij het hoogste prijsniveau komen de emissies in 2050 ca. 4 maal zo laag uit als in 1990. Een belangrijke bijdrage aan dat resultaat wordt geleverd door een afname van de vraag naar goederen en diensten onder invloed van hogere prijzen, in de laatste MATTER versie 3.0 geïntroduceerd middels prijs elasticiteiten. Voor een voorbeeld van de bijdrage van materiaal strategieën zie Figuur S1. Figuur S.1
Bijdrage van onderscheiden materiaal strategieën in 2030 [Gielen et al 1999c] [Mt CO2 EQUIV./YEAR] 1200
WASTE MANAGEMENT MATERIALS EFFICIENCY
1000
MATERIALS SUBSTITUTION
800
OTHER RESOURCES SUBSTITUTION PETROCHEMICAL FEEDSTOCK SUBSTITUTION
600
END-OF-PIPE
400
200
0 20 ECU/t CO2 100 ECU/t CO2 50 ECU/t CO2 200 ECU/t CO2
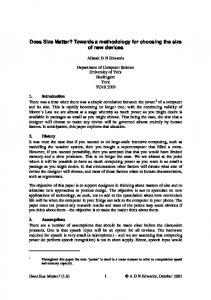
Het relatieve belang van materiaal strategieën in aanvulling wat gebruikelijk beschouwd wordt door veranderingen in de energiesector wordt getoond in figuur S.2. Benadrukt dient te worden dat de resultaten van het MATTER model het hoogst haalbare weergeven van wat met de ingevoerde opties bereikt zou kunnen worden, als alle belanghebbenden volledig geïnformeerd zouden zijn over huidige en toekomstige omstandigheden en zouden handelen vanuit gezamenlijk belang in plaats van hun eigen belangen voorop te stellen. Verder worden beslissingen uitsluitend genomen op basis van economische overwegingen met voorbijgaan aan andere beslissingsfactoren. Met deze beperkingen vanaf het begin op het oog is besloten speciaal aandacht te geven aan mogelijke barrières voor het kiezen van de optimale opties. In de loop van de studie werd duidelijk dat een eenduidige behandeling van barrières binnen het MATTER model verre van eenvoudig zou zijn als gevolg van een te sterk uiteenlopend concept t.o.v. barrière benaderingen in de gehanteerde literatuur. In Hoofdstuk 10 wordt het onderwerp barrières geïntroduceerd samen met een case studie voor de bouwsector.
9
Figuur S.2
Bijdrage van technische emissiereductie opties aan de materiaalvraag kant EMISSION REDUCTION [Mt CO2 EQUIV.] E+M 3000
E+Msupply
IMPACT M DEMAND REDUCTION
2000
1000
0
0
50
100 PENALTY [ECU/t CO2]
150
200
Dieptestudies van materiaal- en productgroepen In de hoofdstukken 2 t/m 9 is een serie dieptestudies weergegeven, die elk een bepaalde groep van materialen of producten behandelen. De focus en aanpak verschilt tussen de studies, enerzijds in verband met specifieke aandachtspunten en benaderingen van de betrokken onderzoeksgroepen, anderzijds door de specifieke eigenschappen van de materialen en producten. De studie van de Iron and Steel (I&S) sector behandeld een van de meest belangrijke materialen in de huidige maatschappij in termen van volume en van aantal functies en toepassingen. Daarnaast gebruikt de I&S sector naar schatting de helft van alle energie voor materiaal productie. Bovenop de energie gerelateerde emissies leidt het maken van ijzer en staal tot proces emissies van CO2 door het gebruik van koolstof als reductiemiddel voor ijzererts. In postindustriële economieën is de vraag naar staal afgenomen en nu min of meer stabiel ondanks voortgaande economische groei. In veel producten is staal verdrongen door andere materialen en hoge kwaliteit staal behoeft minder materiaal om hetzelfde doel te dienen. Een gedetailleerd optimalisatiemodel is gebouwd om een reeks bestaande en nieuwe processen te onderzoeken, resulterend in 13 afzonderlijke productieroutes waaronder varianten met CO2 verwijdering en opslag. Met dit model is een groot aantal cases en gevoeligheidsanalyses uitgevoerd, inclusief emissiefactoren voor elektriciteit tussen 0 en 200 ton CO2 per GJe en CO2 heffingen tussen 0 en 400 EURO per ton. In aanvulling op de gangbare kosten minimalisatie (laagste Netto Contante Waarde), is afzonderlijk gekeken naar de kosten verbonden aan de overgang van één productieketen in een geïntegreerde ijzer- en staalfabriek naar een andere configuratie. Hiermee is het belang onderstreept van het kiezen van geschikte momenten voor dergelijke veranderingen, in samenhang met vervanging en revisie. Het MATTER model is gebruikt om naar de petrochemie te kijken, die bestaat uit plastics, oplosmiddelen en schoonmaakmiddelen. Gangbaar worden die gemaakt uit feedstocks en half-fabrikaten uit de olieraffinaderijen. Naast voor de hand liggende opties als verbeterde processen en bedrijfsvoering beschouwt het onderzoek de introductie van duurzame feedstocks en diverse routes voor recycling van afvalplastic. De resultaten geven aan dat de belangrijkste bijdrage aan BKG reductie in 2030 wordt gevormd door substitutie van feedstocks, gevolgd door bestrijding van N2O emissie, recycling en energiewinning uit afval, en verhoogde materiaal efficiency. Om deze verbeteringen te kunnen ontwikkelen zijn nog aanzienlijke R&D inspanningen nodig, die echter gelijktijdig de duurzaamheid va de sector bevorderen. Gegeven het internationale karakter van deze sector (en vele andere materiaal producerende sectoren) vormt het risico van verplaatsen van activiteiten naar regio's zonder stringent klimaatbeleid een serieus punt. Drie verschillende cases zijn bekeken: industrieën in andere regio's hebben te maken met soortgelijk klimaatbeleid; de petrochemie wordt ontzien in het klimaatbeleid; er komt een systeem van verhandelbare emissierechten. Terwijl het Midden-Oosten een onzekere factor blijft vormen, zien de vooruitzichten voor nieuwe capaciteit in Oost Europa er goed uit, vooral gezien de beschikbaarheid van land voor agrificatie van de sector. Een groeiende stroom materiaal wordt gebruikt voor verpakking. Een inventarisatie van de huidige status en trends van de stromen verpakkingsmaterialen is gemaakt, gevolgd door een overzicht van maatregelen om die efficienter in te
10
zetten en uiteindelijk een schatting van het CO2 reductie potentieel van de verpakkings industrie in de periode 19902010. De ramingen worden ook naast uiutkomsten van het MATTER model gezet met als doel de verschillen te bekijken die voortkomen uit de dynamische benadering van het model versus the statische methode die in de dieptestudie werd gebruikt. Op dit moment neemt glas (voor flessen) de voornaamste plaats in tussen de verpakkingsmaterialen, gemeten naar gewicht. Daarna volgen de natuurlijke materialen karton, papier en hout. Verbeter opties voor primaire verpakkingen zijn onder andere dunnere en dus lichtere ontwerpen, statiegeld- in plaats van wegwerpflessen, en plastic zakken ter vervanging van flessen en kartonnen pakken voor vloeistoffen. Alternatieven bij transport verpakkingen omvatten eveneens lichtere ontwerpen, daarnaast vooral retour en statiegeld regelingen ter vermindering van eenmalige verpakkingen. Uitgaande van ongewijzigd gebruik, zou doorvoering van alle opties in 2010 leiden to 51% minder materiaal voor primaire verpakkingen en 42% minder voor transport verpakkingen. Onder gebruikmaking van een classificatiemethode uit het onderzoek naar barrieres voor introductie van technische verbeteringen eninnovaties, zijn de verbeter opties onderverdeeld in drie categorieen die de complexiteit van hun introductie weergeven van small (S) via medium (M) naar large (L). In algemene zin kan gesteld worden dat de mate van complexiteit een goede indicatie geeft van de moeite die het zal kosten een optie aanvaard te krijgen op de markt. Vooral bij transport verpakkingen geldt dat het grootste potentieel juist te vinden is bij opties die qua complexiteit in de L-klasse vallen. De dynamische analyse met het MATTER model start met een scenario waarin de European Packaging Directive (EPD) volledig wordt doorgevoerd. Vervolgens zijn alle vanuit macro perspectief kosten-effectieve verbeter opties toegelaten, leidend tot een Base Case Packaging (BCP) scenario. De stap van EPD naar BCP leidt tot 25% minder BKG emissies, van 130 naar 98 Mt CO2 eq. De emissies dalen verder als BKG heffingen worden opgelegd en wel tot 85 Mt bij een heffing van 100 EURO/t CO2 eq., een daling van 35% ten opzichte van de EPD case. De ondergrens is bereikt bij een heffing van 500 EURO/t en ligt bij 55 Mt, een reductie met 58% in vergelijking met EPD. De economisch haalbare reductie met 35% (bij 100 EURO/t) is wat minder dan wat de statische analyse aangeeft (51%, resp. 42% voor primaire en transportverpakkingen). Op zich is dit conform de verwachting , aangezien dergelijke verschillen tussen de twee benaderingen veelal gevonden worden. Een zeer belangrijke sector voor materiaal gebruik wordt gevormd door de Bouw en Infrastructuur, zeker in termen van gewicht van het in constructies opgeslagen materiaal, maar ook door het energiegebruik tijdens de gebruiksfase, m.n. voor verwarming. De keuze van bouwmaterialen is mede van invloed op het energiegebruik van het gebouw. Hoewel verschillen in materiaal eigenschappen grotendeels ondergeschikt gemaakt worden aan bouwvoorschriften en normen, is het gewicht van de constructie van belang voor het thermisch gedrag ervan. Ter vergelijking: het energie gebruik voor gebouwverwarming in OECD Europa is geschat op 12 EJ in 1992, terwijl het energie gebruik voor productie van alle materialen rond 13 EJ ligt. Gemeten naar energie gebruik is ca. een kwart van de materialen naar de bouwsector. Daaruit volgt dat de ratio tussen directe (verwarming) en indirecte (materialen) energie rond 4:1 uitkomt. Bij verdergaande isolatienormen en andere energiebesparende maatregelen kan die ratio in de komende decennia verder zakken naar 3:1 of zelfs 2:1. Dit geeft aan hoe belangrijk de materialen zijn bij een integrale afweging van opties in deze sector. In de bouwsector zijn BKG emissies niet proportioneel met het energie gebruik door de hoge anorganische CO2 emissies bij productieprocessen van cement en kalksteen. Een andere factor van belang in deze sector is de opslag van natuurlijke producten als hout en board in de constructie en inrichting, veelal voor meerdere decades. Volgens een schatting die binnen het MATTER project gemaakt lag in 1997 de totale CO2 emissie van bouwmaterialen tussen 215 en 315 Mt. In hetzelfde jaar werd rond 70 Mt opgeslagen in constructies, tussen een kwart en een derde van de bruto emissie van de sector. De lange levensduur van gebouwen en infrastructurele werken als wegen, spoorwegen en kunstwerken vormt een extra facet, omdat in het heden gemaakte keuzes consequenties hebben die zich tot ver in de eeuw uitstrekken, bijvoorbeeld de aard van het bouwafval na sloop. De beschouwde verbeteropties vallen in twee groepen: ‘efficiency verbeteringen’ omvatten een hoger grondstofrendement (minder grondstof per eenheid materiaal), verhoogd materiaalrendement (minder materiaal in de productmix) en verhoogd productrendement (minder producten per eenheid geleverde dienst). De tweede groep ‘substitutie’ omvat zowel andere grondstoffen (hoogovenslak in plaats van cementklinker) als andere materialen (hout in plaats van baksteen). Een groot aantal opties binnen deze twee groepen is nader uitgewerkt en die zijn voorzien van een indicator n.a.v. de barriere problematiek. In dit geval is een relatief simpele tweedeling gehanteerd: ‘haalbaar (feasible)’ versus ‘problematisch’. Indien in de komende decennia eisen gesteld gaan worden t.a.v. BKG emissies verdienen o.a. de volgende opties de hoogste prioriteit: vervanging van niet-duurzaam geteeld tropisch hardhout door ander hout (de BKG baten treden echter buiten de OECD Europa regio op); verbeterde cement productie; hogere en meer constante kwaliteit bouwmaterialen; herontwerp van constructies en meer hergebruik van reststoffen inclusief energiewinning uit afvalhout. Om meer ambitieuze BKG doelstellingen te halen is vervanging van cement en andere keramische materialen door hout een belangrijke kandidaat, die echter wel te maken zal krijgen met hoge barrieres voor introductie. Een ander belangrijk aspect vormt het feit dat het prijsverho-
11
gende effect van zelfs hoge BKG heffingen op vrijwel alle bouwelementen beneden de 10% blijft, dit door het arbeidsintensieve karakter van de sector. Het is sterk de vraag of zo'n relatief zwak prijssignaal tot, soms ingrijpende, vernaderingen in de bouwpraktijk zal leiden. Naar alle waarschijnlijkheid zijn andere, ondersteunende beleidsmaatregelen vereist om dit soort transities op gang te brengen. De vloot wegvoertuigen vormt een omvangrijke voorraad staal, recycling is dan ook een belangrijke stap naar het sluiten van de materiaalkringloop. De materiaalkeuze en nieuwe ontwerpen voor lichtgewicht voertuigen zijn sterk medebepalend voor het brandstofverbruik tijdens de gebruiksfase. Als alles verder gelijk wordt verondersteld, leidt een verhoging van hety voertuiggewicht met 100 kg tot een extra verbruik van een halve liter benzine per 100 km. Het voertuiggewicht heeft echter ook te maken met veiligheids- en leefstijlaspecten, een verdere versterking van de links tussen de productie en de consumptiezijde. Momenteel maakt staal ca. 60% van het totale leeggewicht van personenauto's, vanwege de relatief gunstige eigenschappen van het materiaal: goedkoop; eenvoudig te vormen, verbinden, bewerken en afwerken; goede structurele eigenschappen als sterkte en stijfheid. Door deze eigenschappen steeds beter te benutten heeft staal zijn leidende positie weten te behouden tegen de druk van opkomende alternatieven als aluminium en plastics in. ondanks het relatief hoge soortelijk gewicht van 7,8 ton per m3. Als de gehele keten beschouwd wordt, moet het meestal hogere energiegebruik van andere materialen in de productiefase goedgemaakt kunnen worden door het lagere gewicht in de gebruiksfase en/of door voordelen in de afvalfase. In het onderzoek is expliciet aandacht gegeven aan de trend naar een hoger voertuiggewicht, die toe te schrijven valt aan veiligheidsmaatregelen (airbags, ABS, versterkte carrosserie) en aan nieuwe snufjes als airconditioning, stuurbekrachtiging e.d. Bovendien geeft het toenemende gezinsinkomen ruimte om grotere en meer luxueuze auto's aan te schaffen. Per saldo woog de gemiddelde nieuwe auto in Nederland in 1984 rond 900 kg en was dit 10 jaar later gestegen tot 1050 kg. In de projecties, die leiden tot 8 miljoen auto's in 2020, is een verdere stijging onderbouwd en meegenomen. Om de verbeteropties te inventariseren, is de auto denkbeeldig in vier aparte secties verdeeld, elk met hun specifieke eisen voor de denkbare materialen. Vernaderingen in één sectie, bijvoorbeeld extra gewicht door nieuwe snufjes in het interieur, leiden ook tot extra gewicht voor de dragende delen (het koetswerk) plus een krachtiger motor om dezelfde prestatie te kunnen handhaven. Dat laatste leidt op zich ook weer tot extra gewicht en dus extra gewicht voor de dragende delen. Rekening houdend met de specifieke eisen en de onderlinge relaties zijn drie alternatieve ontwerpen geschetst: lichtgewicht staal, aluminium en plastic. Elk ontwerp bevat uiteraard nog steeds materiaal uit de andere twee groepen, maar met wisselende aandelen; daarnaast ook nog andere gemeenschappelijke materialen als glas en rubber. Scenario's voor de introductie van de drie types zijn opgesteld, steeds op termijn leidend tot overheersing van de markt. De stalen auto leidt in 2050 tot een totaal energie gebruik (direct en indirect) van 375 PJ, de plastic variant tot 340 PJ en de aluminium variant is het zuinigst met 310 PJ. Vervolgens is gekeken naar de bijbehorende stromen primaire, recycled en afvalmaterialen en de vraag naar aluminium en plastics naar herkomst. Uiteraard spelen de veronderstellingen t.a.v. recycling een zeer belangrijke rol. De op materiaal substitutie gebaseerde opties zijn ter vergelijking naast andere technologische veranderingen in aandrijfconcepten en motorbrandstoffen geplaatst, waarmee in principe veel verdergaande BKG reducties haalbaar kunnen worden. Tenslotte zijn ook andere strategieën met een veel sterkere invloed op leefstijl en consumentengedrag bekeken, waaronder een verschuiving van verplaatsingen van auto's naar openbaar vervoer (28% OV in 2020 in plaats van de 14% in de oorspronkelijke projectie) en verlenging van de levensduur van de voertuigen. De laatste dieptestudie betreft de land- en bosbouw, toegespitst op de vooruitzichten voor biomassa strategieën in OECD Europa. De onderscheiden strategieën zijn: bovengrondse koolstofopslag in nieuwe bossen; koolstofopslag in bodems; koolstofopslag in houten materialen en producten; bio-energie; bio-materialen en energiewinning uit organisch afval. Met uitzondering van de laatstgenoemde hebben alle strategieën te maken met concurrentie t.a.v. landgebruik, zowel onderling als van de productie van voedsel en veevoer. De studie is opgezet om kosteneffectieve strategieën te identificeren en de rol van biomassa in die integrale benadering. Door introductie van de landbouwsector in de analyse neemt de dekkingsgraad van de BKG emissies sterk toe, aangezien hier de belangrijkste bronnen van methaan (CH4) en lachgas (N2O) te vinden zijn. Naast de bovengenoemde biomassa opties zijn ook specifieke bestrijdingsmaatregelen voor die CH4 en N2O emissies meegenomen. Voor wat betreft het aanbod van biomassa bestaan er limieten vanwege de concurrentie met bossen, landbouw en ander bestemmingen als steden, wegen en industrieterreinen. Betere benutting van de jaarlijks aangroei van bossen en herbestemming van landbouwgrond die vrij komt door productiviteitsverbetering zouden resp. 200 en 500 Mt droge stof opleveren. Daarbij moet nog wel aangetekend worden dat een krachtig doorzetten van de huidige trend naar een meer duurzame landbouwpraktijk verdere productiviteitsverbetering af kan zwakken of zelfs om doen slaan. Dan is er veel minder land beschikbaar in de regio voor de biomassa opties. Reststromen van de oogst en voedingsindustrie (200 Mt) en mest (300 Mt droge stof) zouden ook voor energetische toepassingen benut kunnen worden. Ook hier zijn alternatieve en concurrerende aanwendingen bijv. mest voor
12
bemesting en stro voor grondverbetering. De huidige aandacht gaat voornamelijk uit naar bio-energie, met name elektriciteitsopwekking. Bio-materialen en koolstofopslag in bossen en houten producten zijn onderbelicht gebleven. Met het uitgebreide MATTER model zijn drie scenario's doorgerekend, met uiteenlopende aannames voor voedingspatronen en (netto) import van landbouwproducten. Bij toenemende BKG heffingen neemt de inzet van biomassa voor energie en materialen toe, maar herbebossing is eveneens aantrekkelijk in veel onderzochte gevallen. Bij een heffing van 100 EURO/t wordt in 2030 ca. 300 Mt biomassa gebruikt voor energie doeleinden. Biomassa als materiaal blijft gedomineerd worden door de traditionele toepassingen: pulp voor de papierindustrie en hout voor de bouwsector. Bij een BKG heffing van 100 EURO/t wordt tot 40 Mt biomassa extra gebruikt voor houtskool (in plaats van kolen en cokes bij de ijzer- en staalindustrie) en als feedstock voor plastics (in plaats van olieproducten). Conclusies en aanbevelingen In algemene zin kan gesteld worden dat het MATTER project veel heeft bijgedragen aan het ontsluiten en begrijpen van de relaties tussen materiaal en product levenscycli en de daaraan gerelateerde BKG emissies, voornamelijk van het nauw gelieerde energiesysteem. Om de complexe interacties tussen de vele opties en strategieeen, in kaart gebracht middels dieptestudies, te kunnen traceren is het integrale MATTER model van onschatbare waarde gebleken. Hiermee is een belangrijke bijdrage geleverd aan de methodologie ontwikkeling. De, soms opvallende, verschillen tussen resultaten en bevindingen uit de integrale benadering en die uit eerdere, partiele benaderingen verdient aandacht. De onvermijdelijke complexiteit van de integrale modellering kan als minpunt beschouwd worden, maar blijkt wel degelijk relevant en toepasselijk om de complexe en samenhangende processen in de maatschappij te bestuderen. De integrale analyse van energie/materiaal systemen, hoewel nog maar net gestart, is wel al nuttig gebleken voor het opsporen van veelbelovende extra mogelijkheden voor het terugdringen van BKG emissies. Een beperkt aantal materialen geproduceerd uit natuurlijke hulpbronnen is verantwoordelijk voor het grootste deel van de CO2-emissies vanuit de materialen productie. Die vormt weer de belangrijkste bron van industriële BKG emissies en verdient daarmee meer aandacht in zowel onderzoek als beleidsvorming. Broeikasgas beleid, hier gesimuleerd door BKG heffingen, kan een grote invloed hebben op de materialen productie en de afvalverwerking, in veel gevallen al bij relatief bescheiden heffingen. Het eindgebruik van materialen wordt veel minder sterk beïnvloed hoewel dit terrein ook relatief minder onderzocht is binnen MATTER. Aluminium (voor lichtgewicht voertuigen) en hout (voor de bouw en als chemische feedstock) kunnen voordeel hebben van BKG beleid. De vraag naar cement is gevoelig en vermindert licht, terwijl het gebruik van andere materialen min of meer gelijk blijft. In 2030 stoot het materialen systeem ca. 1200 Mt CO2-equivalenten aan BKG emissies uit van de 5100 MT vanuit alle antropogene bronnen. Bij hoge BKG heffingen boven de 100 EURO/t kan de met materialen samenhangende emissie tot 800 Mt lager uitvallen, en reductie met tweederde deel. Een aanzienlijk deel van dit potentieel is al haalbaar bij meer bescheiden heffingen tot 50 EURO/t. In het algemeen is het effect op prijzen van consumptiegoederen beperkt, zelfs als hoge BKG heffingen volledig doorwerken in prijzen van materialen en producten. Het is maar de vraag of zulke zwakke prijssignalen op zichzelf voldoende zijn om de transitie naar soms drastisch andere productieketens in gang te zetten. Ondersteunend beleid zal nodig zijn, hoewel consequente hantering van een prijskaartje aan BKG emissies onmisbaar blijft om de kosten door te kunnen leiden door de zeer complexe en onderling verknoopte materiaal- en energiestromen. Als vergaande reductiedoelstellingen als -50% binnen de eigen regio gehaald zouden moeten worden, is ook met de materiaalopties een hogere (impliciete) BKG heffing nodig. Daarmee zouden veel belangrijke industrietakken in OECD Europa hun concurrentiekracht verliezen t.o.v. producenten in andere regio's waar niet een soortgelijk streng beleid zou heersen, zelfs als die aan de andere kant van de wereld gevestigd zijn. Om dit CO2 weglekeffect te voorkomen is specifiek aanvullend beleid nodig. In deze analyses is verplaatsen van industriële activiteiten naar andere wereld regio's niet bestudeerd, maar vervolgonderzoek zou zeker gerechtvaardigd zijn op basis van de gevonden resultaten.
13
SUMMARY Introduction and methodological issues A wealth of studies and analyses dealing with the need to reconcile economic progress with growing concerns over human induced climate change has been conducted in the last decades. Most quantitative approaches or models applied in these studies are either of the so-called top-down type or of the so-called bottom-up or engineering type. In literature much is made, and is continued to be made of this perceived dichotomy, even though a lot of research is devoted to efforts to bridge the gap by integrating predominantly (economic) behaviour driven top-down models with essentially physically oriented technical process models. Closer examination of both types of models and the results they produce indicates that neither appears particularly suited to capture the potential impacts of changes in material flows. Yet, production and processing of a limited number of bulk materials represents the lion’s share of industrial energy consumption and emissions of greenhouse gases (GHGs) from the sector. Together, industries like iron and steel, aluminum and other non-ferrous metals, petrochemicals, natural organic materials like wood, paper and board, inorganic chemicals like fertilizers, and cement and other ceramics, account for some 85% of all industrial GHG emissions today. Moreover, the choice of materials and manufacturing processes to turn them into practical end products often influence energy consumption during their useful life. For example, weight-reduced packaging will reduce transport energy demand and so will lightweight vehicles. Finally, after their useful life the products made from these materials continue to have an impact on energy consumption and emissions. Recycling and re-use, facilitated by adequately structured waste management practices, as well as organic waste processing and waste incineration all have implications for (net) energy use and emissions. Thus far, the notion that material flows are an important factor in understanding current energy and emission trends as well as an important source of future improvement options and strategies has not enjoyed a lot of attention in studies and analyses to date. As mentioned above, mainstream approaches pursued and published do not explicitly address the drivers and mechanisms relevant to capture potential and relevance of changes in future material flows, e.g. induced by concerns over climate change and other aspects of more sustainable economic development patterns. In recent years, several innovative methods aiming at a better understanding of product chains and material flows in a comprehensive and rigorous fashion are developed and applied. On the one hand, Life Cycle Analysis (LCA) methods and tools were designed and used to investigate the direct and indirect energy and environmental implications of all steps from (primary) resources to waste processing associated with a certain product. While LCA undoubtedly provides meaningful information and insights, e.g. to identify key bottlenecks and improvement options, it essentially depends upon (typically static) multipliers to estimate energy consumption and environmental indicator levels. Another line of research looks at the flow of materials (Material Flow Analysis or MFA) from origin to final destinations, so making a certain material rather than a certain type of product (like LCA) the focus of the analysis. Objectives of MATTER Point of departure for the MATTER study is the observation that policies in place have not yet succeeded to stop further growth of GHG emissions even in western industrialized regions. This despite the acknowledged importance of reducing GHG emissions reflected by national and international policies. Therefore it is felt that all additional options and strategies should be analysed thoroughly and, if shown to be promising, be adopted in the policy-making processes. Here, one such area is addressed, dealing with the role played by materials in the economy. The goal is to raise the level of understanding of the potential and cost of GHG emission reduction resulting from changes in production and use of materials in the OECD-Europe region. Such material strategies are currently not well understood, nor is their interaction with other, more commonly studied GHG reduction strategies focussing on the energy sector. The main questions for this study are: (1) how can the potential of material strategies be quantified; and (b) to what extent can changes in the materials systems contribute to a reduction in GHG emissions? In light of the innovative character of the analysis, obvious follow-up questions like the (un-) suitability of current policy practices to capture and foster appropriate materials strategies, or the counter-acting forces induced (e.g. potential threats to vested economic interests, institutional barriers in the market place as well as in policy making practices)
14
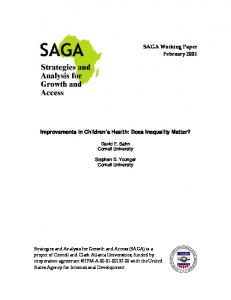
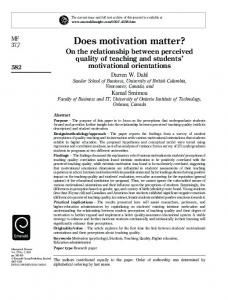
could not be treated exhaustively. Some aspects, including potential carbon leakage and barriers within the construction sector, are identified and touched upon, but are not central to the MATTER analysis proper. Integrated Energy and Material Strategies The integrated energy and material systems analysis model is developed and applied in subsequent versions during the MATTER project. Each version builds upon the previous one and adds sectors, sources of GHGs and new model features. With this model, also named MATTER, a series of cases is analyzed in Chapter 3, starting from a baseline scenario in which no specific climate change policies. In the baseline, the post-industrial nature of the Western European economy is underlined by a very moderate increase of 25% in GHG emissions until 2050 and a simultaneous 3.5 fold increase in GDP. Starting from this case, a series of alternative cases is assessed with increasing levels of implicit values attached to GHG emissions, ranging from a modest 20 EURO to the quite high 200 EURO per ton CO2eq. At the highest penalty level, 2050 emissions that are around four times lower than today could be attained. An important factor is the impact of reduced demands for goods and services resulting from higher prices, introduced in the final MATTER version 3.0 with elastic demands. An example of the contribution of materials strategies is given in Figure S1. Figure S.1
Contribution of individual materials strategies, 2030 [Gielen et al 1999c] [Mt CO2 EQUIV./YEAR] 1200
WASTE MANAGEMENT MATERIALS EFFICIENCY
1000
MATERIALS SUBSTITUTION
800
OTHER RESOURCES SUBSTITUTION PETROCHEMICAL FEEDSTOCK SUBSTITUTION
600
END-OF-PIPE
400
200
0 20 ECU/t CO2 100 ECU/t CO2 50 ECU/t CO2 200 ECU/t CO2
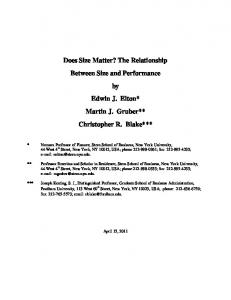
The relative importance of materials strategies over and above what is commonly found from adjustments in the energy sector is shown in Figure S2. It must be stressed that the results produced by the MATTER model represent the ultimate benchmark of what the identified options could contribute, if all stakeholders were fully informed of current and future conditions and would act towards a common cause rather than to let their own interests take precedence. In addition, decisions are based upon economic criteria alone and forego other determinants of actual decision making. Recognizing these limitations from the outset, special attention was given to investigate possible barriers to choosing optimal strategies and options. In the course of the study it became apparent that a rigorous treatment of barriers within the MATTER model would be far from straightforward due to inherently diverging paradigms governing the discussion of barriers in literature. In Chapter 10 the issue of barriers is introduced and a case study for the construction sector is presented to illustrate their relevance.
15
Figure S.2
Contribution of technological emission reduction options on the materials demand side, 2030, pricing policy scenario I EMISSION REDUCTION [Mt CO2 EQUIV.] E+M 3000
E+Msupply
IMPACT M DEMAND REDUCTION
2000
1000
0
0
50
100 PENALTY [ECU/t CO2]
150
200
In-dept Studies of Key Material and Product Groups In Chapters 2 to 9 a series of in-depth case studies is presented, each addressing a specific group of materials or products. The focus and approach to each of these studies differs, reflecting specific interests and approaches pursued by the different research groups as well as material and product specific properties. The study of the Iron and Steel (I&S) sector deals with one of the most important materials in present society in terms of sheer volume and number of functions and applications. It is also estimated that the I&S sector consumes about half the energy of the total required for all materials. On top of energy related emissions, primary steel making also leads to process emissions of CO2 associated with the use of carbon as reducing agent for iron ore. In post-industrial societies the use of steel has leveled of and is more or less stable despite ongoing economic growth. In many products other materials substitute for steel and high quality steels require less material to deliver the same performance. A detailed optimization model was built to investigate a range of established and innovative technologies for the I&S sector, resulting in 13 production routes altogether, including variants equipped with CO2 removal and storage. With this model a range of cases and sensitivity analyses were investigated, including assumed emission factors for electricity from 0 to 0.2 t CO2 per GJe and CO2 taxes from 0 to 400 EURO per ton. In addition to the more straightforward cost minimization analysis, measured by the lowest Net Present Value, special attention was given to the issue of costs associated with shifting from one chain of processes in an integrated plant to an alternative layout. This underlines the importance of choosing proper moments for such shifts, coinciding with capital stock turnover needs. The MATTER model was used to investigate the petrochemical industry, covering plastics, solvents and detergents. Traditionally, these products are made from feedstocks and intermediates delivered by oil refineries. Besides obvious options like improved processes and operations, the analysis considers the introduction of renewable feedstocks and various routes for recycling of waste plastics. The results indicate that the main contributor to reduce overall emissions in 2030 are feedstock substitution, followed by abatement of N2O emissions, recycling and energy recovery, and increased materials efficiency. To be able to develop these improvements, significant R&D efforts are required that will, however, simultaneously contribute to enhance the sustainability of the sector. Given the international character of this sector, and many other materials producing industries, potential relocation to areas not subject to climate change policies is a serious consideration. Three different cases were distinguished here: industries outside Western Europe are subject to similar GHG policies; petrochemical industries are exempted from GHG restrictions; a system of tradable permits is established in the region. While the Middle East poses an uncertain factor, the prospects for new production capacity in Eastern Europe looks favourable especially in light of the availability of land for agrification of the industry.
16
An increasing amount of materials is used for different packaging purposes. An inventory of the current status and trends of packaging material flows is made, followed by an inventory of measures to use them more efficiently and finally an estimate of the CO2 reduction potential in the West European packaging sector in the period 1995-2010. These estimates are presented in comparison with outcomes of the MATTER model with the aim to investigate the difference induced by the dynamic nature of the latter versus the static method applied in the in-depth study. Measured by weight, today glass (for bottles) constitutes a dominant share of packaging material use, followed by the natural organic materials (board, wood and paper). Improvement options considered for primary packaging include thinner and lighter designs, recycled instead of one-way bottles and plastic pouches to replace lined board boxes and bottles for liquids. Transport packaging options also cover lighter designs, recycling and re-use schemes to reduce one-way packaging. Assuming constant use of packaging materials, the impact of adopting these improvements is estimated at 51% for primary packaging and 42% for transport packaging. Adopting a screening method suggested by the research on barriers for introduction of technical options and innovations, the improvement options are broken down in three categories reflecting the complexity of their implementation from small (S) via medium (M) to large (L) complexity. In general, the level of complexity is a good indicator of the ease and speed of adoption of the measures in the marketplace. Static supply curves are drawn, broken down by level of complexity. Especially in transport packaging the biggest potential is found for product re-use options, that fall in the L-complexity level. The dynamic analysis with the MATTER model starts from a scenario in which the European Packaging Directive (EPD) is fully implemented. Next, all improvement options that are cost-effective from the macro perspective are included, leading to a Base Case Packaging (BCP) scenario. Through this step from EPD to BCP, emissions drop some 25%: from 130 to 98 Mt CO2eq. Emissions decrease further if GHG penalties are applied, e.g. to 85 Mt at 100 EURO/tCO2eq, a reduction of 35% from the EPD case. The technical limit of 55 Mt emissions, 58% below the EPD level, is reached at extremely high penalty levels of 500 EURO/t. The economically conceivable reduction level of 35%, emerging at 100 EURO/t in the dynamic analysis, is somewhat lower than the percentages found in the static analysis (51 and 42% for primary and transport packaging). This is well in line with commonly found differences between the two approaches. An important category is formed by Buildings and Infrastructure, both with regard to material use and to energy consumption during use of buildings. The choice of building materials also influences the energy consumption of the resulting building, although differences in material properties are mostly overridden by building codes and standards. For comparison: total energy consumption for heating of buildings in OECD Europe amounted to 12 EJ in 1992, while energy consumption for all material production was 13 EJ. Roughly one quarter of all materials, measured in energy terms, were used for construction. Hence the ratio between direct (heating) and indirect (materials) energy use lies around 4:1. With ever increasing levels of insulation and other measures to cut energy use for heating, this ratio is assumed to decrease further to perhaps 3:1 or even 2:1 in the next decades. This underscores the importance of an integral assessment of direct and indirect energy use in this sector. Especially in the building sector CO2 emissions are not directly proportional to energy use due to the significant emissions of inorganic origin emerging from cement and lime production. Another relevant factor is to note that natural products like wood and board are used in buildings and thereby atmospheric carbon is ‘stored’ for many decades. According to an inventory made for the MATTER study the total CO2 associated with materials for construction amount to 215 to 315 Mt in 1997. In the same year about 70 Mt CO2 was stored in constructions, one third to one quarter of the amount released. The long life of buildings and infrastructure (roads, railways, waterworks, etc.) poses a specific challenge, as choices made today have consequences extending well into the century ahead, including composition and volume of waste after demolotion. Improvement options considered fall into two categories: ‘efficiency improvements’ encompass increased resource efficiency (less natural resources to yield the same amount of material); increased materials efficiency (less material in the product mix); and increased product efficiency (less products to meet the same service demand). The second category is ‘substitution’, both of resources (blast furnace slag to replace cement clinker) and of materials (wood instead of bricks). A large number of concrete improvement options within these groupings are elaborated in detail, and labels are attached to them to reflect the implementation barriers discussion. Here a two-way split is applied: ‘feasible’ versus ‘problematic’. Priority steps for the next decades in case of GHG reduction requirements include replacement of non-renewable tropical timber by renewable timber (impact outside the OECD region), improved cement production, enhanced quality of construction materials, re-design of building structures and enhanced waste recovery including energy recovery form wood waste. For further reaching targets substitution of concrete and ceramic products by (renewable) wood products is an important candidate, but subject to serious implementation barriers. Another noteworthy finding is that, due to the labour intensive nature of the industry, the price increase of all main structural building parts is below 10%
17
even at high CO2 taxes. It can be questioned if such a small price signal would induce the adoption of, sometimes drastically, different building practices. Other policy measures like legislation or voluntary agreements might be indispensable to initiate the transition process. The fleet of road vehicles constitutes an important stock of steel. Recycling of car materials is thus an important step towards closing the materials loop. Choice of materials and new designs towards lightweight vehicles are also an important determinant of fuel consumption during the active use phase of the life cycle. Everything else remaining the same, adding 100 kg to a car would lead to an increase in fuel consumption of 0.5 liters per 100 km. Furthermore, car weight is associated with safety and lifetime issues, adding to the connections between the consumption system and the production system. Today, steel makes up some 60% of total car weight as a consequence of its favourable properties: cheap, easy to form, join, process and coat, and good structural properties. By further exploiting these properties, steel has thus far retained a leading position against upcoming alternatives like aluminum and plastics despite its relatively high density of 7.8 ton per cubic meter. When considering the entire chain, the fact that most alternatives to steel require substantially more energy for production (the GER value) constitutes an energy investment in the production phase, that must be recovered while driving and from waste handling processes. In the analysis the observed trend towards higher vehicle weight is investigated and ascribed to new safety features (air bags, anti-lock brakes, body strengthening) and gadgets (air conditioning, power steering, etc.). In addition, rising income levels support sales of bigger and more comfortable cars. On aggregate, the average new car sold in the Netherlands in 1984 weighed 900 kg, 10 years later this value was already 1050 kg. An attempt was made to factor in a further weight extrapolation in the projection, leading to a stock of 8 million cars in the Netherlands by 2020. To assess the improvement options, passenger cars were artificially divided into four functional areas, each with their own requirements for material characteristics. Changes in one area, for example extra weight for new gadgets means more weight for the car structure to support the extra weight, and a more powerful and heavier engine to retain the performance level. The latter implies again extra weight for the car structure. Keeping the specific requirements and mutual relationships in mind, alternative lightweight concepts were developed: one relying on lightweight steel, one aluminum car and one plastic vehicle. Note that each design still uses all three main materials in different proportions, and that all share other materials like glass and rubber. Different scenarios were assumed, each leading to a absolute dominance for one of the three cars designs on the market. While the steel car results in a total (direct plus indirect) energy consumption in the Netherlands in 2050 of 375 PJ, the plastic car requires 345 PJ and the aluminum variant is the most efficient at 310 PJ. Further analysis examines flows of primary, recycled and waste materials and the resulting demand for aluminum and plastics with the sources of supply. As expected, assumptions on recycling play an important role in the considerations. A comparative assessment was made of materials substitution based improvements versus other technological changes in drive trains, motor fuels, etc. In principle, these could lead to much more significant GHG reductions than the materials options studied. Finally, other strategies with a much stronger impact on lifestyle and consumer behaviour were looked at, such as changing the modal split towards a 28% share for public transport by 2020 from 14% in the central scenario and extending the vehicle lifetime. The last case study concerns agriculture and forestry, with focus on the prospects for biomass strategies in the OECD Europe region. The strategies discerned are: carbon storage above ground in new forests; carbon storage in soils; carbon storage in wood material and products; biomass energy; biomass materials; and energy recovery from organic waste. With the exception of the latter, these strategies compete for limited land-space with each other and with production of food and fodder. The study is geared to identify cost-effective combinations of emission reduction strategies and the role for biomass in an integrated approach. By introducing agriculture in the analysis the coverage of GHG sources also becomes much more comprehensive, as this sector is an important source of methane (CH4) and nitrous oxide (N2O). Specific reduction options for these emissions were included besides the alternative land-use strategies listed above. Regarding biomass supply the availability is limited by the competing requirements of land for forests, agriculture and other purposes like roads, towns and industrial sites. Enhanced recovery of annual re-growth of forests and using land not needed for feed and fodder due to productivity increases could yield some 200 Mt and 500 Mt dry matter. However, emerging trends in agriculture towards more extensive practices inspired by health and general sustainability concerns could well more than offset the productivity gains and lead to less land for biomass strategies. Residues from crops and food processing (200 Mt) and manure (300 Mt) can also be used for energy purposes. Also here alternative applications exist: fertiliser from manure, straw for soil improvement, etc. Current attention is almost exclusively focussed on bio-energy, mainly for electricity generation. Biomass for materials production and carbon storage in forests and woody products are far less studied. The extended MATTER model was used to examine
18
three scenarios, in which assumptions on food consumption patterns and (net) imports of agricultural products are varied. With increasing GHG penalties, the use of biomass for energy and material purposes tends to increase, but afforestation is also favoured in a wide range of cases. At a GHG penalty level of 100 EURO/t in 2030 around 300 Mt biomass is used for energy purposes in all three scenarios. Biomass use for materials remains concentrated on traditional markets: pulp making for paper production and use of timber for construction. At a GHG penalty level of 100 EURO/t, up to 40 Mt is additionally used to produce charcoal (replacing coal and coke for steel making) and feedstocks (replacing oil products for petrochemicals). Conclusions and Recommendations In general it can be stated that the MATTER project has contributed a lot to disclosing and understanding the relationships between materials/product life cycles and associated GHG emissions dominated by the closely linked energy system. In order to track down the complex interactions between the many options and strategies identified in the indepth studies, the rigorous and comprehensive modelling tool MATTER has proved to be invaluable. In this respect major contributions are made to methodological development. The sometimes striking differences between results from the integrated analysis and from earlier, partial assessments is worth mentioning. The complexity inherent in the integrated model approach can be seen as a drawback, but appears sufficiently relevant and appropriate to examine the complex and inter-linked processes in real life economies. The analysis indicates that integration of materials option, even though only recently started, with common energy systems assessments is helpful to identify additional and promising strategies to abate GHG emissions. A limited number of materials produced from natural resources is responsible for the major part of CO2 emissions allocated to the materials production system. This in turn is the major source of industrial GHG emissions, and warrants much more attention in research and in policy making alike. Greenhouse gas abatement strategies, here mimicked by GHG emission penalties, have big impact on materials production and waste handling, in many cases already at relatively modest penalty levels. Materials consumption is not nearly as much affected, though the analysis is less exhaustive in this area than on the production side. Aluminum (for lightweight vehicles) and wood (for construction and to produce chemical feedstocks) can benefit from GHG reduction policies. The use of cement is vulnerable and reduces slightly, while the use of most other materials remains more or less unchanged. In 2030 the materials system constitutes some 1200 Mt CO2 equivalent emissions out of a grand total of 5100 Mt from all antropogenic sources. At high GHG penalty levels, in excess of 100 EURO/t CO2eq., reduction of materials related emissions can be as high as 800 Mt or two thirds. A good part of this ultimate potential is already achievable at relatively modest GHG penalty levels up to 50 EURO/t. In general, consumer product prices are not affected strongly, not even by high GHG penalty levels internalized in materials and products. It seems questionable that such relatively weak price signals alone will initiate the transition towards sometimes drastically different production chains. Supporting policies will be called upon, but rigorous pricing of GHG emissions remains an indispensable element to reveal the cost implications through highly complex and inter-linked systems of materials and energy flows. If more ambitious reduction targets are pursued like -50% within the own region, higher (implied) GHG penalties must be counted with even with inclusion of the materials strategies. These in turn might render many key industrial operations in OECD Europe uncompetitive against suppliers in regions not subject to similarly severe GHG policies, even if those are located at the other side of the globe. To prevent this effect, often referred to as carbon leakage, additional policy measures must be considered. In this analysis relocation of industries to other world regions is not assumed, but follow-up investigations are certainly required.
19
1.
INTRODUCTION
Dolf Gielen and Tom Kram; ECN
1.1
Project framework
The MATTER (MATerials Technologies for greenhouse gas Emission Reduction) project is carried out in the framework of the Dutch national research programme on global air pollution and climate change (NOP-MLK). The project period was June 1995-February 1999. The project was co-sponsored by the Dutch National Research Programme (NOP-MLK), the Dutch Science Organisation (NWO) and the Netherlands Energy Research Foundation (ECN). MATTER is an extension of an earlier modelling exercise for the Netherlands, also for NOPMLK, in the context of the EMS project (Energy and Materials Scenarios for CO2 emission reduction). An important conclusion from the EMS project was that, while interesting new prospects and insights were gained, the developing materials policies for the Netherlands is complicated by the open character of the Dutch economy. Western Europe poses a much more closed system with respect to material flows, thus posing a better framework for materials policy analysis.
1.2
Project goal
The point of departure for this study is the importance of GHG emission reduction as a national and international policy issue in all West European countries. To date, policies in place have not yet succeeded to even stop further growth of GHG emissions. Given the threat that currently proposed strategies may prove inadequate to meet the Kyoto targets and show increasingly high costs, all additional promising strategies should be thoroughly analysed for policy-making. One such group of strategies focuses on the role played by materials in the economy. Materials strategies for GHG emission reduction are not well understood. Nor is the interaction of materials strategies with other greenhouse gas emission reduction strategies, even though this is potentially relevant.
20
The main questions for this study are: (1) how can the potential of materials strategies be quantified; and: (b) to what extent can changes in the materials system contribute to a reduction in greenhouse gas emissions? The goal of this study is to raise the level of understanding of the potential and cost for greenhouse gas emission reduction resulting from changes in the production and use of materials in the West European economies over the next few decades. This information is not only relevant for government but also for industries that will be affected by greenhouse gas emission reduction policies. The study aims to increase the level of understanding of the consequences of GHG emission reduction in the whole regional energy and material system for the individual materials and products. In this context the term ‘Materials’ refers to all flows of bulk substances, which are usually not taken into explicit consideration in energy system studies for greenhouse gas emission reduction. In this study, ‘potential’ refers to the cost-effective greenhouse gas emission reduction that can be achieved within the framework of certain national or supra-national emission reduction policy goals. The time horizon of the analysis is the middle of the next century. There are two reasons for this long time span. The first is that it will take time to achieve a significant reduction in greenhouse gas emissions because this will imply a replacement of a large fraction of the existing capital equipment, infrastructure and building stock. Such measures cannot be introduced rapidly because of the high costs involved in replacing the expensive capital equipment for fossil fuel transportation, storage and combustion. The lifespan of this equipment is several decades. The alternatives for fossil fuels are either costly (e.g. Photovoltaics), their availability is limited (e.g. hydropower) or they are environmentally and socially problematic (e.g. nuclear energy). The second reason for a long term perspective from a materials point of view is that those options that have an effect on the consumption of materials over the next few decades will also have long-term consequences for waste recycling and energy recovery from waste. The analysis includes the potential emission reduction through improvements in materials production, through changing the quantity of the material flows, changing the quality of these flows, and by changing the direction of these flows. Options that affect the materials and product service level for the consumer (changing lifestyles) are not considered because it makes little sense to conduct an analysis into these on the basis of cost-effectiveness. Options that affect the level and distribution of welfare are not considered for the same reason. Energy efficiency options, such as 21
heat cascading, exergy and pinch analysis, and process integration in materials production will not be analysed in detail because they require a highly detailed site-specific approach [Weijnen, 1998]. Optimisation of modes of transport and transportation distances is not taken into consideration. In principle, while these energy efficiency and transportation options can be analysed with the same analysis tool, they still require a more focused analysis (a more detailed spatial approach). These limitations result in an under-estimation of the emission reduction potentials. The practical constraints regarding implementation of the improvement options is not discussed in this study. This problem requires a different analysis approach; see e.g. [Groenewegen et al, 1998]. More insight is required into how the materials flow through the economy, and how these flows can be optimised [Bringezu et al, 1998]. More insight is also required into how technological development and changing product demand changes the material flows in the economy autonomously [Vellinga et al, 1996]. More insight is also needed into how materials strategies interact with each other, and how they interact with the emission reduction strategies in the energy system [Brand and Fischer, 1997]. The cost comparison of both sets of strategies requires further analysis. These topics will be analysed in more detail in this study. The following procedure has been followed: Static system structure analysis Based on a material flow analysis for Western Europe, key materials and material applications are identified. The closed character of the West European materials system is analysed. The relevance of material flows for GHG emissions in Western Europe is established on the basis of an analysis of the current materials production and consumption. Key processes in the existing materials life cycle will be identified. Method development: Materials system model The key elements of the materials system and its improvement options are modelled. Promising improvement options in the materials system are identified and characterised by their energy and material flows, conversion processes, and costs. A model structure will be developed which represents the materials system and is best suited to the analysis framework.
22
Computer model building and calibration An integrated energy and materials system model will be developed for Western Europe. Dynamic system optimisation This model will be used to analyse the interactions of improvement options in the materials system and improvement options in the energy and the materials system. Analysis and strategy assessment Based on the modelling results, the GHG emission reduction potential and the costs of materials strategies will be evaluated for the economy as a whole and for a number of different subsystems in the economy. The key research questions addressed are: − What are the most relevant flows and processes in the materials system from a GHG emission point of view? − Which GHG emission reduction options exist in relation to the quantity, quality and direction of material flows in the economy, and which level of detail is required for the analysis? − How far can materials strategies reduce GHG emissions? For example, can the ‘factor four’ hypothesis be confirmed, that claims that it is possible to achieve a factor four reduction in the GHG emissions related to these materials through an improved materials efficiency of the economy without affecting lifestyle (based on [Weizsäcker, 1994]) − Which strategy should be further developed (and which strategy not)? Compare the hypothesis: GHG emission mitigation will have much more impact on materials production and waste handling than on materials consumption (based on [Blonk and Duin, 1992, Paauw and Perrels 1993]) − How do the costs of these materials-related emission reduction options compare to the costs of energy-related emission reduction options? In order to answer these questions, a number of sub-projects or tasks were identified: Task 1: Integrated energy and materials systems model for Western Europe (ECN) Task 2: Analysis of material flows (Bureau Fuels and Resources) Task 3: Metals (IVEM) Task 4: Natural and synthetic organic materials (STS)
23
Task 5: Ceramic and inorganic materials (ECN) Task 6: Transportation (IVEM) Task 7: Packaging (STS) Task 8: Buildings and infrastructure (ECN) Task 9: Institutional barriers for shifts in materials use and evaluation of MARKAL input from task 3-8 (FU)
1.3
Project products
Model input data and background information for these data are provided in separate reports (Table 1.1). All documents with analysis results are also included in this table. This documentation, the input data and some results can also be found on the Internet [Http://www.ecn.nl/unit_bs/etsap/MARKAL/MATTER]. Table 1.1
MATTER project results
Topic Methodological Model characterisation issues Policy Model input Material flow analysis characterisation Energy system characterisation Agriculture Metals Ceramic and inorganic materials Natural organic materials Synthetic organic materials Buildings and infrastructure Packaging Road vehicles MATTER General model results Steel/aluminium
Report [Gielen et al 1998d, Gielen 1999a, Franssen 1999] [Gielen and Kram , 1998a] [Duin 1997, Gielen 1998a] [Ybema et al 1997, Lako and Ybema 1997] [Gerlagh and Gielen 1998] [Daniels and Moll 1998, Gielen and Dril 1997] [Gielen 1997c] [Hekkert and Worrell 1997, Gielen et al 1998e] [Joosten 1998] [Gielen 1997d] [Hekkert et al 1997a] [Bouwman and Moll 1997] [Gielen 1999b, Gielen and Kram 1998b] [Daniels and Moll 1998, Gielen and Dril 1997a, Gielen and Dril 1997b] Waste [Gielen 1998b] Petrochemicals [Groenendaal and Gielen 1999] Packaging [Hekkert and Gielen 2001] Biomass/agriculture [Gielen et al 1998e, Gielen et al 1998f, Gielen et. al. 1998g, Gielen et al 1999d] Barriers [Groenewegen et al 1998] Detailed sector Metals [forthcoming; in PhD thesis] analyses results Natural/synthetic organic materials [forthcoming; in PhD thesis] outside the Packaging [Hekkert, 2000] model Transportation [Bouwman, 2000]] Barriers [Goverse, (forthcoming), PhD thesis]
24
1.4
Deviations from the original project plan
During the project period 1995-1999, the GHG policy framework has changed significantly. This has resulted in an extension of the project with a number of issues: − non-CO2 greenhouse gases and afforestation have been included, − an additional report has been produced by ECN for petrochemicals, − an additional report and MATTER module has been developed by ECN for agriculture and food products, − model extension with elastic demands. In addition, in the course of the four-year period of the project, priorities and focus of research at university partners have shifted. As a result, phase-two research was less closely linked to the overall goals of MATTER than anticipated, and hence no separate phase-two reports were produced from the project. Relevant inputs are integrated into the following chapters, and further details on the sector analyses will appear only in a series articles, conference papers and Ph.D. thesis reports; see also Table 1.1. In the original project plan a broad, international workshop was to foreseen to disseminate the insights and results to policy advisers in relevant fields. However, in the course of the project this purpose was already successfully reached through spin-off projects for the EU and the OECD [Gielen et al 2000, OECD 1999]. Hence the concluding workshop is no longer planned. Instead, well-focussed contributions will be made to the COOL project conducted under the NOP-MLK. Results of specific interest for industry branches will be communicated in focussed articles, e.g. for branch oriented journals.
25
2.
METHODOLOGICAL ISSUES
Dolf Gielen and Tom Kram; ECN As laid out in the introduction, the general purpose of the MATTER project is to analyse and understand the material production and consumption system and its relation with the energy system and the integral emissions of greenhouse gases caused by the material and the energy system. Based on the understanding of these systems present and future options can be derived with a potential to reduce future greenhouse gas emissions. In the MATTER-MARKAL model these present and future options are implemented in an optimising environment to assess the macroeconomic and macro-environmental consequences of the introduction of emission taxes for greenhouse gases. The material system at large is built up out of, interlinked, sub-systems. The division in subsystems can be based on a typology of materials such as metals, polymers, natural materials and so on. Each type can be subdivided further till the level of individual materials, with well-defined properties. The division in sub-systems can also be based on consumption categories, such as food, transport, housing and so on. Both approaches are reasonable within the context of the MATTER-MARKAL model. The satisfaction of present and future demand of services is the primary optimisation objective of the model. Artefacts like houses and cars satisfy present and future demands for products and services. The flows in the model are energy and material based; so the flows of the most important materials in the system should be accounted. Combining the materialbased and the demand-driven approach interesting cross-sections do appear. The car fleet forms an important stock of steel in the society. The potential for recycling of car materials determines the extent to which for instance the flow pattern of steel can become a closed loop. The use of cars by the consumers is also connected to the material use for cars. Lightweight cars do consume less energy; the weight of a car seems to be connected to the car safety and the average lifetime of cars. The analysis of these cross-sections of the material production and recycling system and the consumption system may create new approaches for further environmental improvement. However in these cross-sections also possibilities for problem shifting may occur, because of unforeseen changes elsewhere in the system. The MATTER-MARKAL approach allows to evaluate the effects of measures working on the interface of the material system and the demand system in an integrated fashion.
26
This chapter presents the modelling approach followed, that can be characterised as a n integrated energy/materials/emissions model, firmly rooted in the well-established systems analytical process modelling tradition.
2.1
Overview
The analysis in this study is based on an extended MARKAL type model as to include technical options for changes in materials life cycles. The underlying MARKAL model also allows for decreasing demand in response to higher prices. Important characteristics of this extended MARKAL model with elastic demand (MATTER 3.0 MARKAL) are described in Section 2.2. The purpose of this study is to estimate the difference in efficiency of GHG emission reduction policies between an ‘Ideal’ (I) scenario and a ‘Policy Continuation’ (C) scenario, as well as estimating the effects of changes in materials life cycles on the effectiveness and efficiency of GHG emission reduction policies. To this end, first the contribution of changes in materials life cycles to GHG emission reduction must be defined (Paragraph 2.2.2). Next, the policy scenarios I and C, have to be defined (Section 2.3). The C scenario has 4 different versions, allowing for some sensitivity analyses, inter alia concerning the efficiency of a regulation of cleaner cars and a regulation of renewable energy sources. The results of the calculations are presented in Chapter 3.
2.2
The MATTER3.0 MARKAL model
2.2.1 The essentials of a MARKAL model At present MARKAL11 is one of the most widely used model for analysing the impacts of GHG emission reduction policies, although its results often have to be completed using top down models (like General Equilibrium models). A MARKAL model is a representation of (part of) the economy of a particular region. The economy is modelled as a system of interdependent technical processes. These processes are characterised by their physical and eco-nomic properties which determine the physical and monetary flows between these processes within that (part of the) econ-
1 1
The MARKAL linear programming model was developed 20 years ago within the international IEA/ETSAP framework (International Energy Agency/Energy Technology Systems Analysis Programme). More than 50 institutes in 27 countries use nowadays MARKAL [1]. MARKAL is an acronym for MARKet ALlocation. At present it is the most widely used model for analysing the impacts of GHG emission reduction policies.
27
omy of a region. It is a linear programming model, that maximises an objective function (e.g. minimisation of emissions) under constraints (e.g. the attainment of certain production levels, the availability of certain technologies etc.). The solution of a MARKAL model represents the equilibrium that would be achieved in an ideal market (according to the neo-classical welfare economics). In the following paragraphs the processes and the optimisation procedure are briefly described. Processes Processes (also called technical options) are the building blocks of a MARKAL model. They are characterised by: − their physical inputs and outputs of energy and materials, − their costs, − other characteristics (in this study their GHG emissions and waste volumes), over a number of time periods. Implicitly these process descriptions yield a very detailed input-output structure linking several hundreds of processes that are analysed in a dynamic perspective, covering the total life cycle for both energy and materials. Of course not all substance flows in the entire economy are analysed. First, not all processes in the economy are included in the model. Secondly not all emissions are included in the description of the processes. This study for example is confined to GHG emissions and to processes with GHG relevance. Other environmental issues can in principle be analysed within the same framework. Processes represent all activities that are necessary to provide certain products and services, in this study: the provision of energy and materials. These processes are listed in Volume 3 of this study. Many products and services can be generated through a number of alternative (sets of) processes that feature different costs and different GHG emissions. Process descriptions follow a standard format, consisting of two data sheets. One sheet describes the physical inputs and outputs (of energy and materials). The other characterises the economic data and the other process data. The input data structure depends to some extent on the process that is characterised. Data for different types of power plants, conversion processes, and end-use technologies are characterised in different ways. A schematic example of the input for conversion processes is shown in Table 2.2. The data input is divided into nine time periods (column heading 28
1.9). The length of the time period is set by the user of the model and is usually 5 or 10 years (10 years in this model version). One column is reserved for time-independent variables (TID). The physical data do not represent the total mass and energy balance where input equals output (because of flows that are not accounted for). The cost characteristics of the processes are divided into investment costs (which are proportional to the installed capacity), fixed annual costs (proportional to the installed capacity) and variable costs (proportional to production volume). The user of the model can impose restrictions on the deployment of certain processes (technical options). Such restrictions may include political preferences, intentions expressed in policy papers, or long term physical constraints such as land availability. Increasing process efficiency is modelled by decreasing inputs per unit of output (such as for energy carrier A and material A in Table 2.2). Decreasing costs or changing restrictions can be modelled in a similar way. This is illustrated for the investment costs in Table 2.2, which decrease in time. This is a way to account for so-called ‘learning curves’, accounting for decreasing costs as the installed capacity increases. Table 2.2 MARKAL model data structure for a conversion process Sheet 1: Physical flows
Period
Inputs
Energy carrier A Energy carrier B Material A
Outputs
Energy carrier C Product A
Unit
TID
1
2
3
4
5
6
7
8
9
[GJ/unit] [GJ/unit] [t/unit]
2.0 1.0 5.0
1.9 1.0 4.5
1.8 1.0 4.2
1.7 1.0 4.0
1.7 1.0 4.0
1.7 1.0 4.0
1.7 1.0 4.0
1.7 1.0 4.0
1.7 1.0 4.0
[GJ/unit] [unit]
0.1 1
0.1 1
0.1 1
0.1 1
0.1 1
0.1 1
0.1 1
0.1 1
0.1 1
100 5 2 1 0.9
80 5 2 1 0.9
70 5 2 1 0.9
60 5 2 1 0.9
60 5 2 1 0.9
60 5 2 1 0.9
60 5 2 1 0.9
60 5 2 1 0.9
60 5 2 1 0.9
0.1 2 5 0
0.9 0 10 0
0.8 0 50 0
0.8 0 50 0
0.8 0 50 0
0.8 0 50 0
0.8 0 50 0
0.8 0 50 0
0.8 0 50 0
Sheet 2: Other data Investments [Euro/unit cap] Fixed annual costs [Euro/unit cap./yr.] Variable costs [Euro/unit] Delivery costs [Euro/t A] Availability factor [unit/unit cap] Life [periods] Start [period] N2O emissions [t/unit activity] Residual capacity [unit cap] Maximum capacity [unit cap] Minimum capacity [unit cap]
2 1
Bounds − The data sheets also allow for certain restrictions on the application of certain processes. These application restrictions are called ‘bounds’. In this study the following bounds play a 29
role: bounds on maximum penetration of certain technologies, reflecting e.g. social and strategic considerations (e.g. a maximum bound on nuclear and hydropower, a maximum import of natural gas from Russia). − Bounds on the maximum investment rate in certain new technologies. − Bounds reflecting the standing capacity from earlier periods (e.g. for the existing building stock). − Bounds on the availability of natural resources (e.g. disposal capacity, land availability). Time span The time span to be modelled is divided into nine periods of equal length, generally covering a period of decades. The model is used to calculate the least-cost system configuration for the whole time period, meeting product and service demands and meeting emission reduction targets. This optimisation is based on a so-called ‘perfect foresight’ approach, where all time periods are simultaneously optimised. Future constraints are taken into account in current investment decisions. In summary The user of the model determines the processes from the database that will enter the calculations, he or she also determines the constraints for the individual processes, as well as constraints for the whole region. Constraints are determined by the demand for products and services, the maximum introduction rate of new processes, the availability of resources, environmental policy goals for energy use and for emissions etc. Processes are characterised by their physical inputs and outputs of energy and material, by their costs, and by their environmental impacts. Environmental impacts are endogenised in the process costs and the costs of energy and material flows between processes. The time scale is chosen according to the questions analysed. Since most of the processes take a long time to reach their maximum penetration (often at the expense of others), such time horizons tend to cover several decades, in this study until 2030. The calculation of least cost combinations (LCCs) of processes /technical options MARKAL requires as input projections of energy service demands - for example room space to be heated or vehicle-miles to be travelled. All these demand categories are listed in Volume 3. In the model used (MARKAL MATTER), also the materials demand for these services are included. Then, a reference case is defined in which, for example, no measures are required to reduce carbon dioxide emissions. This is the Base Case scenario. Next, a series of runs is made with in30
creasing emission penalties. Because of the underlying detailed input/output relations (imputed by means of the data sheets), interdependencies between the various processes or technical options are taken into account. The model thus automatically calculates the combined effects of these interdependent options. Moreover, the integrated dynamic systems approach ensures also that interactions between technical options in one period and interactions between periods are reflected. In each case, the model will find the least expensive combination (least cost combinations, LCCs) of technologies that meet that requirement -- up to the limits of feasibility --. But with each further restriction the total energy (energy materials) system cost will increase2. Thus, the total future cost of emission reductions is calculated according to how severe such restrictions may become. These can be plotted as continuous total abatement cost curves. In addition, the marginal cost of emission reduction in each time period3 for each emission reduction is known (equivalent to the penalty level). This figure is of special interest in establishing abatement policy because it can be interpreted as the minimum amount of carbon tax, or the minimum price of GHG permits that would be needed to achieve this level of abatement. Some uses of MARKAL (MARKAL MATTER) are: − to identify least-cost energy systems, − to identify cost-effective responses to restrictions on emissions, − to perform prospective analysis of long-term energy balances under different scenarios, − to evaluate new technologies and priorities for R&D, − to evaluate the effects of regulations or prices (taxes, tradable permits, subsidies), or both, − to project inventories of greenhouse gas emissions, − to estimate the value of regional co-operation.
2.2.2 The distinction between the energy system and the materials system MARKAL has originally been used as an energy systems analysis tool. Conventional energy system models cover the conversion of primary energy into final energy and the subsequent final en-
2 3
In the linear programming approach all processes are characterised as black boxes with a linear relation between inputs and outputs of energy and materials, costs and emissions. Economies of scale are not taken into account for any given process type. More precisely, the cost of the most expensive technology that must be applied to comply with the predetermined level of emissions is calculated. So, actually the model calculations give us the cost of the marginal technology. All other technologies that are part of the least cost combination (LCC) cost less per unit of emission reduction. Actors who can apply these less expensive technologies will choose to apply it, when confronted with a tax or with a price of tradable permits to avoid paying the tax or to free permits they can sell on the market. As a consequence more expensive technologies will not be deployed.
31
ergy use in economic sectors. Of course they include industrial use of energy e.g. to produce materials, and will therefore include for example energy efficiency gains in the production of a material. But conventional energy system studies do not analyse the effects of changes in materials life cycles such as materials substitution, increased materials efficiency and recycling. In MATTER 3.0 MARKAL (the model used in this study), however, all bulk material flows are included. They include all substances without relevant physical shape (not being consumer or investment goods) that are not defined as energy carriers and food products. The model covers more than 50 types of energy carriers and 150 materials, which means a substantial enlargement of more traditional MARKAL models. More than 100 products represent the applications of these materials. 30 categories of waste materials are modelled. These materials are characterised by their physical characteristics and by their quality. This means that a large number of technical options (processes) are added to the database of energy options. Identifying these options requires for each bulk material a rather detailed analysis of the flow of that particular substance through the economy ‘from cradle to grave’ [Gielen 1999a]. The inclusion of materials technical options is important for a number of reasons. − By adding materials flows, the model chooses from a more comprehensive set of technological improvement options when calculating the least cost combinations. As a result a typical MATTER 3.0 MARKAL estimate of the least costs for attaining a certain GHG emission target tend to be lower than a typical MARKAL estimate. In fact the differences in the obtained least cost combinations are quite substantial. − Because the energy and materials systems are intricately interwoven, technical improvements influence each other strongly. Ignoring technical improvement options in materials life cycles may lead to an overestimation of the effects of energy options4 and misguided policy choices. − It is extremely difficult, if possible at all, to foresee the effects of these interdependencies if one does not apply a formalised model that is based on rather detailed information concerning the interrelationships between the various technical options.
4
For example, a technical change that reduces the emissions of electricity generation, will make the substitution from steel to aluminium (which primary production uses much electricity) more attractive. At the same token, it will reduce the environmental improvements that would result from using secondary aluminium instead of primary aluminium, (Secondary aluminium requires only 5% of the energy needed for primary material). Another example: If buildings are well insulated, an improvement of the efficiency of the heating system will have a less pronounced effect on overall emissions than in the case of poorly insulated buildings.
32
− It requires a comprehensive analysis of energy and materials flows to identify the appropriate points of impact for policy measures (in particular regulatory approaches) and to identify unexpected responses to policy actions. Figure 2.1
Generic MATTER energy and materials system model structure, showing the close interactions of energy and material flows in the economy. Dotted lines indicate energy flows, drawn lines indicate material flows [Gielen 1999a]
PRIMARY ENERGY
FINAL ENERGY INDUSTRY
OIL GAS COAL URANIUM RENEWABLES
REFINERIES POWER PLANTS
OIL PRODUCTS
MATERIALS/ PRODUCTS
ELECTRICITY HEAT
RESIDENTIAL
GAS COAL
TRANSPORTATION
WASTE MATERIALS
RENEWABLES OTHER
INCINERATION
Figure 2.1 shows the energy and materials system model structure on an aggregated sector level and Figure 2.2 depicts the inter-sectoral flows of materials, that result from changes in a life cycle of a material. The actual model input data are on the level of individual processes in the product lifecycle. Subsequently, these data are aggregated to produce results for economic sectors (see Figure 2.1) and for the economy as a whole.
33
Figure 2.2
Materials system model structure
1 PRIMARY PRODUCTION
2 RECYCLING
MATERIAL 3 PRODUCT ASSEMBLY PRODUCT 4 PRODUCT USE WASTE PRODUCT 5 REMOVAL &SEPARATION
WASTE MATERIAL 6 ENERGY RECOVERY
7 DISPOSAL
Figure 2.3 shows the definitions of the energy as well as the materials system. Conceptually it is difficult to separate energy from materials systems. After all, from an physics point of view, all environmentally relevant economic activities are just transformations of MATTER, using energy, and any distinction between the energy and materials system is arbitrary. In this study, all energy used for materials production (e.g. the production of iron, steel, aluminium, building materials etc.), is considered to be part of the materials system. This, because this study investigates the GHG effects of changes in materials life cycles. We want to know, for example, what changes in GHG emissions would result from changes in the inputs for of cement production. The effects of such a choice on GHG emissions are obviously strongly influenced by the energy requirements (quantity and quality) of the alternative inputs. Likewise, we want to know the effects on GHG emissions of building a car from aluminium or plastic, instead of from steel, or building a house from wood, instead of from concrete, steel and bricks. In both these cases the energy that goes into these production processes are part of the materials system. Ideally, also the energy required for space heating and driving the cars should be linked to the choice between alternative materials and therefore should be part of the materials system. Available energy statistics, however, do not permit this. Therefore, the energy that is needed for the use of the house (space heating) or the use of the car (fuels to drive it) is part of the energy system.
34
Figure 2.3
Definition of the energy system and the materials system
MINING/ CONVERSION
MATERIALS INDUSTRY
CONSUMER
WASTE MANAGEMENT
ENERGY SYSTEM
ENERGY PRODUCTION
USE
ENERGY PRODUCTION
MATERIALS PRODUCTION
ENERGY RECOVERY
MATERIALS SYSTEM
The MATTER model version that was used for this analysis is version 3.0. Version 1.0 included the energy and materials system model [Gielen et al 1998d]. In version 2.0, a land use and food production module has been added [Gerlagh and Gielen 1999]. Version 3.0 includes a further extension with an elastic demand function [Franssen 1999]. Common MARKAL is characterised by an exogenously defined fixed demand for energy and product services. However in the new model version that is applied in this study the demand depends on the product prices (see Section 2.2).
2.3
Demand elasticities
A weak point of traditional ‘common MARKAL’ models is that price effects do not change demand (the demand is exogeneously defined). In recent years, the MARKAL model algorithm has been extended to make demand levels dependent on prices. Two approaches have been developed: MARKAL-MACRO (MM) [Hamilton et al 1992] and MARKAL Elastic Demand (MED) [Loulou and Lavigne 1996]. MM is a nonlinear dynamic optimisation model that links the ‘bottom-up’ specification of a regional energy system to a ‘top-down’ macroeconomic growth model, MED is a partial equilibrium model where
35
the exogenously defined useful demands have been replaced by price-driven demand functions (see below). For this study, the MED algorithm has been selected instead of MM for a number of reasons: − The MATTER model is too large to run with the non-linear MM algorithm. − The difference between MM and MED results is generally small, while the calculation time differs significantly. − MED allows a better representation of demand elasticities for individual demand categories, important for an in-depth study of materials industries. − The MATTER3.0 MARKAL model covers not only the vast majority of environmentally relevant emissions, but also a much more substantial part of the entire economy (around 50% in the start year) than anticipated in the set-up and calibration procedure of MARKALMACRO. Hence, in contrast to traditional MARKAL models that focus on the energy sector in the narrower sense, MACRO is no longer a valid representation of the remaining part of the economy when combined with MATTER3.0 MARKAL.
36
Box 4. Top down or bottom up MARKAL models are ‘bottom up’ models, meaning that they start from detailed technical options ‘at the work floor’ so to speak. The optimisation procedure (calculating least cost combinations) is firmly based on the standard micro-economic tenet that welfare is maximised if the sum of consumers and producers surpluses is maximised (marginal costs equals marginal revenues). These models make maximum use of the available knowledge about technology (For example, at what oil prices, energy from renewable sources becomes profitable, and how much time it is likely to take to install these renewable energy sources). On the other hand these models are based on rather heroic assumptions, like perfect markets, perfect knowledge and foresight and assumptions regarding technological developments over a long period of time. Moreover most MARKAL based models lack the feedback of price changes on the economy and poorly reflect trade issues. Empirical economic models are top down models. They contain much more economic detail, notably on money and trade flows. Being empirical, the sensitivity of for example investments in renewable energy sources to changes in oil prices, is derived from statistical data concerning the past, but such elasticities can change drastically due to for example technical change. Moreover profound technical changes may occur too slowly to show up clearly in statistical data. On the other hand these models implicitly take non-price factors into account that influence technical change. The lack of technical detail allows for rather general conclusions only. So far it has been proven to be rather difficult to merge both types of models. One such attempt is to link MARKAL to macro-economic models. This has resulted in MARKAL MAKRO (MM). Another attempt is to introduce demand elasticities in MARKAL (MED), and estimate changes in the social surplus as a proxy for firstorder welfare effects. The latter approach is followed in this study. The MATTER model version used in this study is based on the MED algorithm. The decreasing demand due to increasing energy and product service prices is accounted for, but the rebound effect due to the redeployment of these funds is not considered. However from a modelling point of view, this approach has important advantages: the model is still based on linear equations, allow37
ing rapid calculations. It is not possible to run the complex MATTER model with non-linear demand equations. Figure 2.5 shows the (simplified) equilibrium that is achieved in ‘common MARKAL (such as MATTER2.0). Figure 2.6 shows the equilibrium that is achieved in the model version with elastic demands, such as the model MATTER3.0. Figure 2.5
Supply and demand equilibrium in MATTER2.0 (common MARKAL) D
P
S’
SP’
S SP
EQ=EQ’
Figure 2.6 P
Q
Supply and demand equilibrium in MATTER3.0 (MED) D S’ S
SP’ SP
EQ’
EQ
Q
Figure 2.5 and Figure 2.6 each show a supply curve (S) and a demand curve (D) for the base case calculations (without GHG emission penalties). Both curves are linearised in MARKAL in order to be able to use a linear programming algorithm, which has major advantages from a computing 38
point of view. The horizontal axis Q represents the quantity, the vertical axis P represents the price. In common MARKAL (Figure 2.5), the demand is independent of the price, so the demand function is a vertical line. In MED (Figure 2.6), the demand decreases if the price increases, so the demand function is a curve. Equilibrium between supply and demand is reached in point EQ, which is the same for both figures in the base case. The price that is set in this market is the shadow price SP. Supply curves are derived from the database of supply options in the model. Each supply option is characterised by costs, physical inputs and outputs and emissions. The potential contribution of each option is limited by the availability of the physical inputs and by the bounds on each supply option (e.g. a bound on wind energy because of the limited availability of suitable locations). MARKAL selects supply options on the basis of cost minimisation, thus simulating the supply curve. If GHG penalties are introduced, the supply curve moves in an upward direction because all emissions in the supply chain are penalised and transferred in the production chain through increasing energy and materials prices (S changes to S’). In the case of fixed demand (Figure 2.5), this has no consequences for the demand (EQ=EQ’). However, shadow prices are increased (from SP to SP’). In the case of elastic demand (Figure 2.6), demand decreases and a new equilibrium price and equilibrium quantity are achieved, below the prices and quantities in case of fixed demand. Three variables are used to model the demand function: the elasticity, the maximum decrease of the demand, and the number of demand steps. The demand function is: DMi,p/DMi,b = (Pi,p/Pi,b)ei where: DMi,p
= demand for i after introduction of GHG penalty
DMi,b
= demand for i in the base case
Pi,p
= price i after introduction of the GHG penalty
Pi,b
= price i in the base case
ei
= price elasticity for i
The demand function is linearised into a 20 step function [Loulou and Lavigne 1996]. A literature study has revealed that the price elasticities from econometric literature diverge considerably 39
[Franssen 1999]. Even for one single demand category, long-term demand elasticities range from -0.1 up to -2.5. However the bulk of the long term demand elasticities ranges from -0.1 to -0.5. For this reason, all elasticities are in this model version fixed at a value of -0.5. This value is considered to represent an upper limit for the impact of demand elasticities, given the fact that many demand reductions based on technological change are endogenised in the MATTER model. Improved estimates based on an engineering bottom-up approach are currently being developed. The high value for elasticities is compensated by the assumption that demand can at most decrease by 50%. This approach has been applied for all 100 demand categories in MARKAL (see Volume 3 for an overview of demand categories). Comparison of the model calculations for MATTER2.0 and MATTER3.0 show an additional emission reduction by 400 Mt in 2030 in case a 100 Euro/t penalty is applied (Figure 2.7). The base case emission in 2030 is approximately 5100 Mt CO2 equivalents (see Volume 2 Chapter 2, 2200 Mt emission reduction in MATTER2.0 with a penalty of 100 Euro/t CO2), so the impact on emission reduction is 20% additional emission reduction. This figure shows that the impact of demand elasticities is limited compared to the impact of technological options for emission mitigation. Figure 2.7
40
MATTER3.0 results (MED) in comparison with MATTER2.0 results (‘common’ MARKAL), penalty of 100 Euro/t CO2 equivalent
[Mt CO2 Equivalent/Year]
6000 5000 4000 3000 2000 1000 0 1990
2000
2010
2020 MARKAL
2030
2040
2050
MED
Recent analysis suggests that elasticities for energy services will have an elasticity in between -0.1 and -0.5, while elasticities for materials services may be higher [Franssen, 1999]. Due to the lower price elasticities the reduction in demand is less. The GHG emissions in the emission reduction cases tend to be 100-200 Mt higher than in the calculations in this analysis, mainly due to a higher demand for energy services (e.g. air transportation and commercial electricity) [OECD, 1999].
41
PART 1: AGGREGATE MARKAL MODELLING RESULTS
3.
INTEGRATED ENERGY AND MATERIALS STRATEGIES
Dolf Gielen and Tom Kram; ECN In order to understand the results on a sectoral level it is necessary to understand the general changes in the system for increasing GHG penalties. These general results are discussed in this chapter. The following issues are discussed: 3.1
General results for GHG emission reduction,
3.2
General analysis of the contribution of materials options.
3.1
General results for GHG emission reduction
Figure 3.1 shows the trend for the West European gross domestic product in real terms (GDP) and the trend in GHG emissions for the base case and the emission reduction cases. GDP increases by a factor 3.5, while the GHG emissions increase moderately in the base case and decrease significantly in the emission reduction cases. In the base case the decoupling of GDP and GHG emissions is 1.7% per year (the gap between the GDP index and the BC index). This gap is more important for future GHG emissions than the GHG emission reduction that can be achieved through emission penalties. In model terms, the gap between GDP and GHG emissions can be attributed to a product service demand that does not grow as fast as GDP. The demand for energy and product services is in this model estimated in a bottom-up approach. Growth in the existing product demand categories is estimated on the basis of logistic penetration curves in time. Consequently, the growth in all demand categories levels off in time. New product service demand categories have not been identified. However, the additional income must be spent. The question is whether additional consumption will really be irrelevant from a GHG emission point of view. Where this additional income will be spent is not clear at present. On the supply side, the trend towards a service economy is obvious [Ybema et al 1997]. Trends such as the rapid development of telecommunication and computer technology may result in new products that are very GHG-extensive. However, whether these trends can really result in such a strong decoupling over a period of decades should be ana-
42
lysed in more detail on the basis of other socio-economic analysis methods. The problem extends beyond the scope of this study, but it is of major importance for GHG emission reduction. Figure 3.1
GDP and GHG emissions in the base case BC and for increasing GHG penalties INDEX [-] 350 GDP
300 GHG BC
250
GHG 20 EUR/T GHG 50 EUR/T
200 GHG 100 EUR/T
150
GHG 200 EUR/T
100
50
0 1990
2000
2010
2020 [YEAR]
2030
2040
2050
The emission reduction for the integrated energy and materials system (E+M) is shown in Figure 3.2. This result suggests that a factor 4 emission reduction is feasible, even in a situation with a growing demand. However, the penalty level where such a goal can be achieved exceeds the penalty levels currently under discussion. Note the high contribution of CO2 to the total GHG emissions in the base case. Autonomous developments reduce the emissions of other GHGs (e.g. closure of the German and UK coal mines and the ban on disposing organic waste reduce methane emissions). Increasing CO2 emissions are linked to a growth in demand in sectors such as transportation.
43
Figure 3.2
Changing GHG emissions with increasing emission penalties, 2030 [Mt CO2 EQUIV./YEAR] 6000
NET IMPORTS PFC
5000
N2O CH4 CO2
4000
3000
2000
1000
0 BC 20 EUR/t CO2
50 EUR/t CO2 200 EUR/t CO2 100 EUR/t CO2
The contribution of individual strategies to the total GHG emission reduction is shown in Figure 3.3. The figure shows that the bulk of the emission reduction can be attributed to energy and materials efficiency (including all types of improvements on the materials demand side and demand reductions, up to 1900 Mt CO2 equivalents). CO2 storage and the non-CO2 GHG contribute together approx. 1100 Mt CO2 equivalents. Fuel switches (from coal to natural gas, nuclear and renewables) contribute up to 640 Mt CO2 equivalents.
44
Figure 3.3
Contribution of individual GHG emission reduction strategies for increasing GHG penalties, I scenario, 2030 [Mt CO2 eq.]
4,000
3,000
2,000
1,000
0
BC
20 EUR/t
FOSSIL FUEL SWITCH CO2-STORAGE
3.2
50 EUR/t RENEWABLES E+M EFFICIENCY
100 EUR/t
200 EUR/t
NUCLEAR NON-CO2 GHG
General analysis of the contribution of materials options
The contribution of the changing demand to the emission reduction is shown in Figure 3.4. This result is based on the comparison of a set of calculations for the MATTER2.0 model (with fixed demand) and MATTER3.0 model calculations (with elastic demands). The difference in emission reduction can be attributed to the change in demand. The results show that this contribution increases gradually to 550 Mt in the 200 Euro/t case. This represents a contribution of 15% to the total emission reduction at this penalty level.
45
Figure 3.4
Aggregated emission reduction including elastic demands (MATTER3.0) and excluding elastic demands (MATTER2.0), 2030 EMISSION REDUCTION [Mt CO2 EQUIV.] MATTER3.0 3000
MATTER2.0
IMPACT DEMAND REDUCTION
2000
1000
0
0
50
100 PENALTY [ECU/t CO2]
150
200
The contribution of individual materials strategies is shown in Figure 3.5 (based on MATTER2.0 model runs). These emission reductions were calculated with the integrated energy and materials system model. Certain groups of options have been set to zero in these calculations. For example: in the strategy category ‘end-of-pipe’, the options for CH4 recovery from landfills, N2O emission mitigation in the chemical industry, and CO2 removal and underground storage in industry (excluding refineries and electricity production) have been removed from the model. The difference in emission reduction in the calculations with and without these options is the emission reduction which is attributed to this strategy. The end-of-pipe strategy proves to be important. The contribution of biomass feedstocks for the petrochemical industry is also significant (both fermentation and flash pyrolysis processes). ‘Other resources substitution’ in Figure 3.5 refers to the use of slag materials and Pozzolan for the production of cement and the use of tropical hardwood substitutes. Some materials substitution occurs (the substitution of steel for aluminium in the transport sector and the substitution of concrete for wood in the building sector). Materials substitution proves to be important because it induces emission reductions in the energy system (e.g. lightweight vehicles reduce transportation fuel demand). Moreover, the calculations show an additional 35 Mt CO2 equivalent of carbon storage in wood products in the 200 Euro/t penalty case, compared to the base case (mainly in the building sector). On the waste management side, waste from renewable materials (wood, paper) is increasingly used for energy recovery, while waste from synthetic organic materials (plastics) is increasingly recycled. Waste management becomes especially im46
portant in the 200 Euro/t penalty case. Sensitivity analysis shows that the model would opt for disposal of these materials as a carbon storage strategy if no restrictions were added. Improved materials quality (the category ‘materials efficiency’ in Figure 3.5) is introduced in the 200 Euro/t penalty case. One must consider that the model representation of materials efficiency is incomplete. The option has only been considered for steel and for concrete because of the scarcity of reliable data for other materials. Some case studies indicate similar efficiency potentials for other materials. As a consequence, its potential is probably more significant than Figure 3.5 suggests. Figure 3.5
Contribution of individual materials strategies, 2030 [Gielen et al 1999c] [Mt CO2 EQUIV./YEAR] 1200
WASTE MANAGEMENT MATERIALS EFFICIENCY
1000
MATERIALS SUBSTITUTION
800
OTHER RESOURCES SUBSTITUTION PETROCHEMICAL FEEDSTOCK SUBSTITUTION
600
END-OF-PIPE
400
200
0 20 ECU/t CO2 100 ECU/t CO2 50 ECU/t CO2 200 ECU/t CO2
Strategies such as higher industrial energy efficiency and emission reduction in electricity production for materials production have not been considered in Figure 3.5. For proper comparison, the model was run without all emission reduction options on the materials demand side. The results can be compared to the results in Figure 3.5. End-of-pipe strategies are not included in the difference between both curves in Figure 3.6. Figure 3.6 shows a maximum contribution of the materials demand side of 700 Mt CO2 equivalents, compared to a maximum contribution of 800 Mt in Figure 3.5 (excluding end of pipe). The problem with these estimates is the impact of materials options on the emission reductions in the energy system. The 800 Mt include significant emission reductions which are achieved through e.g. energy by-products from
47
the use of biomass feedstocks (biomass crackers etc.) and through introduction of light weight materials in the transportation sector (which reduces the transportation fuel demand). In this analysis, these emission reductions are completely allocated to the materials demand side. If these emission reductions are subtracted from the 800 Mt emission reduction, the contribution of the materials supply side is in the range of 200-300 Mt CO2 equivalents. Figure 3.6
Contribution of technological emission reduction options on the materials demand side, 2030, pricing policy scenario I EMISSION REDUCTION [Mt CO2 EQUIV.] E+M 3000
E+Msupply
IMPACT M DEMAND REDUCTION
2000
1000
0
0
50
100 PENALTY [ECU/t CO2]
150
200
The preceding analysis shows the importance of an integrated energy and materials systems modelling approach. The interaction of emission reduction strategies - both in the materials system and between the energy system and the materials system - decrease the effectiveness of individual strategies considerably. Significant differences occur in the changing materials consumption between the pricing approach and the regulation approach (Figure 3.7 and 3.8). The significant increase in wood consumption is related to more wood use for buildings (coupled to less cement use), for feedstock substitution and for paper. The increased wood use for paper production is related to the increased energy recovery from waste paper. It is interesting to note the generally lower demand in the regulation model runs. This can be explained by the demand elasticities. Due to the higher system costs in the regulation approach, the demand decrease is more significant than in the pricing model runs.
48
Figure 3.7
The impact of GHG penalties on materials consumption, 2030, pricing policy scenario I
CONSUMPTION INCREASE [%]
80 60 40 20 0 -20 BC CEMENT
Figure 3.8
50 EUR/t CO2 200 EUR/t CO2 20 EUR/t CO2 100 EUR/t CO2 IRON
ETHYLENE
ALUMINIUM
ROUNDWOOD
The impact of GHG penalties on materials consumption, 2030, policy continuation scenario C
CONSUMPTION INCREASE [%]
80 60 40 20 0 -20 BC CEMENT
3.3
50 EUR/t CO2 200 EUR/t CO2 20 EUR/t CO2 100 EUR/t CO2 IRON
ETHYLENE
ALUMINIUM
ROUNDWOOD
Conclusions
The MATTER modelling results show a moderate emission growth in the base case. Some other econometric - simulation models, show higher emission growth rates for Western Europe. The 49
difference can be explained by the tendency of bottom-up models, like MARKAL, to underestimate growth (e.g. because future new demand sectors are not adequately modelled) and the tendency to overestimate efficiency gains (all options that are cost-effective are included in the base case, while these options may not be introduced because of non-financial barriers like knowledge gaps etc.). On the other hand, econometric models may underestimate the rate of technological change. Regarding emission reductions, the non-CO2 GHG and CO2 removal and underground storage contribute up to 30% of the total emission reduction. Approximately 20% of the emission reduction is caused by fuel switches (from coal to gas, nuclear and renewables). The remaining 50% is caused by the increased efficiency in energy and materials use. MATTER modelling results suggest that a significant emission reduction potential exists with regard to the materials demand side (up to 500-700 Mt CO2 equivalents, depending on the calculation method). This potential constitutes up to 20% of the total GHG emission reductions. The relevance of the materials system is even higher if the emission reductions on the materials supply side are also allocated up to the materials system: 800 Mt CO2 equivalents, 35% of the total GHG emissions [Gielen 1999a]. Technological development is one of the key driving forces that determine the system configuration. Technology will change significantly within a time horizon of half a century. In the framework of the energy and materials system, major changes can be expected in power generation (gasification technology, new technology for renewables), in the transport sector (biofuels, fuel cells, electric vehicles) and for materials production (e.g. smelting reduction processes for iron production, new paper drying technology, biomaterials). Regarding product use, technological development seems to be a less important driving force. For recycling, cheap materials separation technology (in order to prevent downcycling, e.g. for metals) and improved recycling technology for plastics pose a challenge. These technological changes will affect the systems configuration and must be considered in long-term strategy development. End-of-pipe technology for CO2, CH4 and N2O and industrial fuel substitution do already receive a great deal of attention in many European countries. More attention should be devoted to feedstock substitution in the petrochemical industry, to improved materials quality, materials substitution/product redesign, and to the GHG consequences of future waste management technologies. 50
The results show that it is important to consider the interactions between improvement options in the optimisation. If such interactions are not considered, emission reduction potentials are overestimated. Greenhouse gas emission mitigation will have much more impact on materials production and waste handling than on materials consumption. This hypothesis has been approved by this case study. Aluminium production and wood production can significantly benefit from GHG emission reduction. The results also show a moderate decline in cement production. For other materials, the impact on materials consumption is limited.
51
PART 2: CASE STUDIES
4.
IRON AND STEEL
Bert Daniëls and Henk Moll; IVEM
4.1
Introduction
In this chapter the analysis of one materials sub-systems, as modelled in the MATTER3.0MARKAL model, is described. Before going into the details of the steel sub-system, the position of this sub-system in the integral energy and material system is discussed; and the most promising ways to reduce the greenhouse gas emissions from this sub-system are introduced. Steel is one of the most important materials in present society, measured by volume used and by the number of functions delivered. Also the energy requirement to produce the presently consumed volume of steel is substantial. It is estimated that steel production consumes about a half of the total energy required to produce the materials for the economy. The production of primary iron and steel requires the element carbon (in the form of cokes, coal or natural gas) as reducing agent of the ferrous oxide in the iron ore. So primary steel production generates because of the reduction chemistry always CO2 emissions. Next to primary steel production also a large amount of steel is produced out of scrap. In many cases, the average lifetime of steel products is relatively high. So substantial stocks of steel are built up within the economic system. A large part of this steel stock can be recycled after disposal. Recycling of steel results in waste reduction, energy savings and reduction of CO2 emissions. However different technologies are required to reuse steel scrap and also steel produced with scrap may have different properties than primary steel. Use of steel in post-industrial societies like Western Europe is not growing but more or less stable, notwithstanding the growth in the economic system. In many products steel has been substituted by light-weight metals and by polymers to reduce weight (dematerialization), material costs and transport costs.
52
For the future role of steel in the western society some potential trends are of importance: − the possible introduction of new energy saving and environmentally friendly primary steel production technologies, − the optimisation of steel recycling due to new design concepts and technologies for the production of durable goods like cars, houses and infrastructure (design to dismantle, design to recycle), and the role of steel for the production of future consumer and capital goods (a continued dematerialization or a reappraisal of steel). With regard to dematerialization the position and the dynamics for other materials may be more important than the dynamics within the steel sector itself. Therefore we focus in this chapter on the internal dynamics of the steel production sector (primary and secondary). The dynamics with regard to steel use in products should be studied by product case studies and should be assessed integrally by MATTER-MARKAL model exercises. Looking more closely to the structure of steel production sector one observes a relatively small number of large-scale primary producers owning highly integrated and capital intensive plants. This implies that future trends in the European steel production sector will be determined by discrete decisions that are guided by a specific temporal and spatial context. The rationale for transitions in the steel sector depends not only on the general characteristics of new technologies, but also on the specific context of the producer. Path-dependency plays an important role. Therefore we analyse - next to the general characteristics of future steel production technologiesalso the specific economic, environmental and spatial conditions that may stimulate or impede the transition to less CO2 emitting steel production.
4.1.1 Processes and definition of production routes As far as possible, process data have directly been drawn from public data sources. For processes currently in use, Eurofer has been an important source of economical and consumption data. In case of contradictions between Eurofer and other sources, Eurofer data generally have prevailed, because of the unusual completeness of Eurofer and its orientation on the West-European situation. The Making, Shaping and Treating of Steel has been a useful and important source for background information on processes, and more precisely specified data on consumption figures. For new processes, various more specialised sources have been important. It was often necessary to
53
fill gaps in the data by estimates, based on the available information of the respective processes, and on comparable data from other processes. Table 4.1
Status of technologies
Category TechnologyIntroduction Current status preprocessing sintering ~1950 established, linked to blast furnace pelletising ~1950 established, linked to DRI/Corex, also for the blast furnace coke oven 250
30
10-100
0 - > 250
feasible
4 4 30
2-10 2-6 20-40
100 - 250 > 250 0 - 250
feasible feasible feasible
4
2-6
0 - 500
problematic
6 20
4-8 10-30
0 250
problematic
20 23 25
10-30 10-30 0-100
0 - 100 0 - 100 0 - 500
feasible problematic feasible
10
5-20
0 - 100
problematic
25-200
< 0 - 1000
10-125
feasible problematic
feasible
The options will be discussed in more detail in Section 3.1-3.6. All materials production in the reference situation is based on primary production (from natural resources) with high specific CO2 emissions (see Table 7.3). Some emission reduction, e.g. in the case of substitution of nonrenewable timber, is accomplished abroad (i.c. reduced deforestation in the tropics).
126
The characterisation ‘feasible’ and ‘problematic’ in Table 7.4 refers to the barriers to introduction of options that are posed by technological feasibility (proven technology or conceptual stage) and the diffusion barriers (one strong market party or many actors). The barriers are currently analysed in much more detail in a separate MATTER study [Goverse and Groenewegen 1997].
7.3.1 Increased resource efficiency A
Increased recycling
Demolition waste separation, recycling, and energy recovery Used buildings are stripped of valuable building parts for reuse, recycling and/or energy recovery. Some sources suggest increased recycling as an important improvement strategy. The key to increased recycling is enhanced waste separation, either at the building site or in a centralised plant. Table 7.5 shows the estimates for current recycling rates of building waste (recycling of stone type materials like brick and concrete is not considered because of its minor significance from a CO2 emission point of view). The emission reduction potential refers to a (hypothetical) situation with 100% recycling. The table suggests that the highest potential exists for wood waste. Table 7.5
Current recycling rates and remaining CO2 emission reduction potential for building materials Waste arising [Mt material pa]
Recycling rate [%]
11 10 0.2 0.4 25
10 90 90 90 20
Plastics Steel Aluminium Copper Wood Total
1
CO2 potential [Mt CO2 pa] 3 1 0.3 0.2 5 9.5
90% non-structural elements: e.g. floor coverings, cables, pipes and ducts recycling rates refer to the current waste arising. Recycling excludes incineration
A significant part of the post-consumer wood waste is e.g. in Germany already used for production of particle board. It is possible to recycle sawnwood, particle and fibreboards into new particle boards, MDF or hardboard. However, toxic compounds pose a serious problem for recycling and for energy recovery as well. In the current situation, where Western European forest regrowth exceeds the wood harvest, recycling wood makes little sense from an energy/CO2 point of view (because 127
primary wood can be used as well). On the short term, energy recovery in combination with off-gas cleaning seems the best option. Dedicated gasifiers or energy recovery in waste incineration plants can be used. The emission reduction potential, based on energy recovery, is around 5 Mt CO2 per year (assuming electricity production in waste incinerators).
7.3.2 Increased materials efficiency This section includes - Product part reuse, - Improved product design. A Product part reuse If buildings are demolished, significant parts of the structure are often still in good condition and can potentially be reused (on other locations). Parts like steel beams, wooden beams, prefab concrete elements, bricks or sand-lime bricks can be reused. German examples show for example the possibility to reuse prefab structural elements from multi-family buildings. Irreversible bonding technologies limit however the reuse potential, because they result in high disassembly cost and damaged building parts. Typical examples are glued parts, nail connections, rivets and on site cast concrete structures. An estimate of the potential contribution of product part reuse to CO2 emission reduction is shown in Table 7.6. The figures should be considered as high estimates of the emission reduction potential. Table 7.6
Current potential for CO2 emission reduction through increased deconstruction
Material/part Bricks Prefab concrete Wood beams, floors etc. Steel beams Total
Waste amount [Mt pa] 25 10 5 5 45
CO2 impact 100% reuse [Mt pa] 3 5 2 3 13
The estimate in Table 7.6 is based on 100% reuse. In practice, 25-50% seems more realistic. For this reason, the potential has been adjusted downwards to 5 Mt CO2 per year.
128
B Improved product design Improved design refers to improved shapes of product parts that allow the use of less materials to achieve the same product performance. New shapes of structural building elements can also save considerable amounts of material. Circular sections require considerably less material than rectangular sections: the savings are up to 60% (Figure 7.2). Higher and narrower loadbearing beams save up to 50% weight. The use of honeycombed steel beams can be further spread. Lattice girders can be reintroduced. In many other cases, saving potentials are however limited. Figure 7.2
Cross sections and relative weight of structures with equal bending strength
1,5 mm
2,7 mm
24 mm
25 mm
40 mm
50 mm
WEIGHT 100 %
WEIGHT 85 %
WEIGHT 55 %
WEIGHT 40 %
Perforated bricks instead of hollow bricks, gas concrete instead of solid concrete blocks are other examples. This design saving potential is not exhausted because of the problematic availability of special building element shapes, conservative building standards, and traditional architect and consumer preferences. It is assumed that on average 10% material savings can be achieved (for all product shapes) through improved product part design, using available technology and meeting all constructive and design requirements. C Increased average materials quality - Engineered wood products, - High strength steel, - High strength concrete.
129
Engineered wood products: plywood, laminated beams, prefab shapes The advantage of engineered wood products is the reduced variation in materials properties. As a consequence, the constructive properties improve significantly. It is assumed that an increased performance (or weight reduction) of 40% can be achieved for applications with bending loads. Because only a part of the applications are characterised by bending loads, it is assumed that the average saving potential is 40% for 50% of all material applications. High strength steel Common reinforcement steel possesses a yield strength of approximately 300 MPa. Different types of reinforcement steel can be discerned. Their tensile strength ranges from 340 to 500 MPa. These differences are accounted for by different rolling and cooling treatments and by different alloys. Examples for e.g. reinforcement steels show that its strength can be increased by 18% using an additional heat treatment after the hot rolling process [Doorn 1989]. For structural steel, even higher weight savings can be achieved, compared to conventional carbon steel. Welding of steel structures can however destroy the increased strength - special care and post-treatment is required. On average, the saving potential for steel through increased strength is assumed to be limited to 10%. High strength concrete (HSC) Concrete strength can be significantly improved. It is assumed that the increased cement content of HSC can be reduced to values similar to conventional concrete. High strength concrete can on average contribute a factor 2 to the weight reduction of concrete columns with axial loads. For floor elements, it is assumed that the weight saving potential is 20%. The potential contribution is approximately 30 Mt CO2. Barriers for increased materials quality are posed by the technological feasibility, the adjustment of building standards and the adjustment of the building practice. This is typically a category of options that will require a long time for implementation, but with potentially significant efficiency gains and cost reductions. D Less spread in materials quality Less spread in materials quality for concrete
130
The bulk of cement is applied for concrete production. Prefab production of concrete elements allows a better control of the spread in average strength: while the standard deviation is 5-7% for insitu cast concrete, it is 3-5% for prefab concrete. Due to the reduced standard deviation, the design strength is 10-20% higher than for in-situ cast concrete with the same water/cement ratio. The total use of cement for floors and pillars is approximately 45 Mt. Assuming that on average 10% material savings are possible through prefab construction, the total saving potential is 4 Mt CO2 per year. E More diverse standardisation/reduced safety factors for design Design safety factors do significantly differ between countries. Based on a comparison of design factors of concrete for the USA, Japan, and Western Europe, it is assumed that on average 15% structural steel can be saved through adjustment of the safety factors. The minimum concrete cover of steel reinforcements, the cement content, and the strength requirements show also a considerable range. It is assumed that on average 10% cement savings are possible through adjustment of the design criteria.
7.3.3 Increased product efficiency Increased building life Buildings are demolished for various reasons. Longer life can be achieved by construction of higher quality buildings. More expensive and larger residences tend to have a longer life than smaller and simpler ones. Buildings with large open floor areas are more easily adjusted to new user characteristics and desires. Buildings with high quality standards (better insulation, lower noise levels, increased materials durability) can longer comply with new functional requirements. Reuse of large industrial buildings, storage facilities etc. for residential purposes has been practised in many cities. Building demolition is often a result of lacking comfort or inconvenient lay-out. Such problems can to a large extent be avoided through the use of adjustable constructions. Flexible building design seems especially promising for (currently) short life buildings like public utility buildings, offices, commercial buildings and industrial buildings. This strategy includes for example detachable building partition walls, mobile buildings, modular buildings. It is assumed that a more flexible building design can increase the average building life in 25% of all cases by 25%. As a consequence, the (long-term) saving potential is 20 Mt CO2. Flexible building design will require high quality materials (with higher CO2 emissions), while the ultimate reuse is still uncertain. Another 131
problem is how short-term increased emissions (because of increased materials production) must be weighed against long-term emission reductions (because of an increased building life).
7.3.4 Resource substitution The following options will be discussed in this section: - slag use instead of cement clinker, - geopolymeric cement, - renewable wood instead of non-renewable wood. Slag use instead of cement clinker The amount of cement clinker per unit of concrete has been reduced as a result of increased use of supplementary cementing materials. Blast furnace slag is used for production of blast furnace slag cement. Fly ash can also be used for cement production. Its chemical composition does however influence the cement properties. Pozzolan and Trass (volcanic ashes) pose an alternative for cement. The current clinker/cement ratio in Western European cement production is on average 82% [Worrell 1995]. Cement contains 5% gypsum, the remaining 13% difference between clinker and cement consumption consists of blast furnace slag, fly ash and pozzolan. From an availability point of view, there is still a potential for additional use of all three types of additives (total availability blast furnace slag and fly ash in EU + EFTA is 41 Mt, this suggests a potential of 25 Mt, equivalent to approx. 20 Mt CO2 emission reduction). With regard to fly ash, CO2 reduction policies will decrease coal based power production. As a consequence, fly ash availability may decrease significantly. Pozzolan can be considered as back-stop option: high availability, but the resources are mainly located in Italy and in Germany, resulting in high transportation costs. Geopolymeric cement Plain portland cement contains 65% CaO, the remainder being SiO4 and AlO4. This CaO can be substituted by a much smaller amount of NaCO2O. The resulting product is called ‘geopolymeric cement’ [Davidovits 1993]. Taking the additional energy use for NaCO2O production into account, the saving is approximately 0.5 t CO2/t cement clinker. Assuming that geopolymeric cement can be applied in 25% of all cases, the saving potential is 23 Mt CO2. Only one reference was found that advocates this emission strategy; its technological feasibility is unclear. Substitution of non-renewable tropical wood 132
Non-renewable tropical hardwood can be replaced by renewable alternatives. A number of improvement options are required to substitute non-sustainable wood, each with special benefits. Efforts to plant tropical hardwoods in plantations are currently on their way in countries like Costa Rica and Indonesia. This option can only be applied for certain tree types and will require several decades before the trees reach maturity. European hardwood types like oak, chestnut, or robinia are significantly more expensive and generally not available in large quantities. Many softwoods cannot meet the durability criteria without environmentally problematic treatment with toxins. PLATO (Providing Lasting Advanced Timber Options) and wood acetylation are options to enhance the durability of softwoods. Engineered wood products (e.g. Glulam) can serve as substitute for tropical hardwoods in case large wood dimensions are required.
7.3.5 Materials substitution Substitution of steel reinforcements by steel fibers and synthetic organic fibers Steel reinforcement bars and wires are used for concrete reinforcement. Other fibers with a high modulus of elasticity and high tensile strength can substitute steel in this application. Several technological problems have up till now limited the wide-spread application of alternative reinforcement materials. The current research focuses on carbon fibers; the research regarding Arapree, other plastic fibers, and glass fibers decreased in recent years [Civieltechnisch 1996]. There is an important secondary advantage regarding the substitution of steel reinforcements from a CO2 point of view. The cement content of concrete serves as a buffer to keep the pH above 10. At these pH levels, the steel reinforcements cannot be oxidised. For other reinforcement materials, oxydation poses less of a problem. As a consequence, the cement content can be lowered by 50 to 75%. There are also developments regarding the use of new types of steel reinforcements. One trend is the use of steel fibers in industrial floors. If steel fibers substitute reinforcement bars in concrete floors, less steel is required. The weight reduction is approximately 50%: 100 kg/m3 vs. 50 kg/m3 for reinforced floor slabs [Chorinsky 1989]. Further reductions are being planned, 30 kg/m3 is currently used in Germany [Olivier 1994]. The concrete slab thickness can often be reduced by 25% (from 25 to 20 cm), resulting in additional savings because less cement is used. However it is unclear whether the fibers can be recovered in the demolition phase. It is assumed that the option can be applied in 25% of all reinforcement applications. 133
Structural materials Substitution of concrete, bricks, and cement by wood is often mentioned as an important option to reduce CO2 emissions. The effect is two-fold. One part of the emission reduction is achieved because the emissions in the production of wooden buildings and building elements are considerably lower than the emissions for competing materials. The second part of the emission reduction is achieved because an increasing wood stock in buildings constitutes a net CO2 sink. This sink can be significantly enhanced by an increased wood use. However one must emphasise that the net sink effect can on the long term be reversed into a net emission, if the wood stock in buildings decreases. A second problem with the wood storage strategy is that it is not allowed to consider this storage in the current emission accounts. However the accounting practice may change in the future, depending on the outcome of UNFCCC negotiations. In order to provide an estimate for the potential of substitution, an additional wood consumption of 50 Mt per year has been analysed. This quantity is well below the current net annual increment of the Western European forest stock. If concrete and bricks are substituted, the emission reduction due to reduced emissions in materials production is approximately 1 t CO2/t wood. This coefficient is based on a weight substitution ratio of concrete and bricks by wood of 5:1-10:1. The net carbon storage is 1.5 t CO2/t wood. As a consequence, 50 Mt wood results in a reduction of emissions in materials production by 50 Mt. The net carbon storage effect is 75 Mt per year. The total emission reduction is 125 Mt per year. The net annual increase of the Western European standing wood stock is currently more than 100 Mt per year, so wood availability poses no problem. The interaction between indirect and direct emissions Data in Section 2 show that the direct energy consumption for heating and cooling is higher than the indirect energy demand for building materials. The choice of materials can influence the direct energy consumption. Such interactions require special care because relative increases in direct annual CO2 emissions can outweigh gains in materials related CO2 emissions. The concrete industry states that concrete buildings show additional thermal mass, which reduces heating and cooling energy demand. The wood industry states that wooden buildings are better insulated, which results in an even lower heating energy demand. Both statements will be addressed in this section.
134
Thermal mass Thermal mass of buildings can influence direct energy use because it serves as cooling medium during the summer day, so cooling energy can be saved. On the other hand, additional thermal mass requires additional energy for heating in the winter. Data concerning the impact of thermal mass are shown Table 7.7. These data are based on calculations at ECN with a building simulation model TRNSYS. A light construction is made out of e.g. wood or plastic/steel. A heavy weight construction is made out of e.g. concrete or (double wall) bricks. The table shows a significant impact of the building materials selection on the energy requirements for heating and for cooling. The ‘best’ solution depends on the building type. One must add that these data cannot straightforwardly be applied to all buildings within a certain category. The direction towards the sun, the glass surface, and the behaviour of the residents can reverse the results. Table 7.7
The impact of building weight on the direct energy use, Dutch situation, NorthSouth orientation
Outer/inner structure Single family dwelling Light/Light Light/Heavy Heavy/Light Heavy/Heavy
[m3 gas equiv./m2] [%] 9.8 100 8.3 85 9.3 95 10.1 103
Multi family dwelling [m3 gas equiv./m2] 8.0 7.5 8.0 8.2
[%] 100 94 100 103
Office building (with cooling) [m3 gas equiv./m2] [%] 21.4 100 20.2 94 20.9 98 19.9 93
The difference between the direct energy use of different building designs in Table 7.7 may seem small, but if a ratio of direct and indirect energy use of 4:1 is assumed for the whole building life cycle, a 10% advantage in direct energy use represents 40% of the indirect energy use. These differences must be accounted for in order to achieve a valid comparison. The results indicate that heavy inside structures and light outside walls are favourable the Dutch residences that have been analysed (the inside structure refers to the walls inside the insulation layer, the walls outside the insulation are irrelevant). Regarding the offices, the optimal solution depends on the use of cooling in the summer. If no cooling is applied, the best solution is a light outside structure and a heavy inside structure. In the situation with cooling, a combination of heavy inside structures and heavy outside structures is favoured. A similar sensitivity can be expected for residences.
135
Future behavioural changes may result in increasing intermittent building use. Such changes would favour light weight solutions. The consideration of such changes during the building life can significantly affect the choice of the optimal building materials. Much more research is required regarding the impact of thermal mass. The point to be considered for this analysis is that optimal strategies should initially focus materials selection for minimisation of the direct energy use. This optimisation is case specific. The impact of the building materials selection on the building insulation Literature sources indicate that the average air infiltration rates in ‘heavy, wet’ constructions (in-situ cast concrete) are lower than in ‘light, dry’ constructions (timber, masonry) [Olivier 1994]. This feature depends however to a large extent on the workmanship. It is possible to construct masonry and timber buildings with similar airtightness characteristics. For this reason, this difference is neglected in the analysis. The wood industry argues often that their buildings show better insulation (lower U-values) than the reference buildings. This depends of course on the insulation measures that are included in the structure. It is possible to insulate concrete or brick buildings to the same extent as wooden frame buildings. This implies however additional costs compared to a reference building (200 mm insulation and upwards). Moreover, a well insulated brick or concrete wall requires more space than a similar wood wall. This disadvantage is important in situations with limited building space.
136
7.4
The Impact of a Changing Energy and Materials System Configuration
The relevance of strategies that affect the use of materials depends on the reduction of the upstream emissions. This depends on the type of energy carrier that is used for materials production and, for materials that require electricity, the emissions in electricity production. MARKAL results show that CO2 penalties will significantly affect the emissions in materials production. This is illustrated in Figure 7.3, based on earlier calculations that will not be elaborated in this paper. For steel, cement and PVC, emission reductions in the range of 50-75% are achieved in 2020 if a CO2 emission penalty of 100 Euro/t is introduced. The model calculations indicate that the costeffectiveness of CO2 emission reduction through changes in materials use will significantly decrease, if the changing emissions in materials production are considered. Increased industrial energy efficiency, fuel substitution, and CO2 removal and underground storage (for steel and cement) are important strategies to achieve these emission reductions. Figure 7.3
Average Western European CO2 emissions in materials production, based on MARKAL calculations, 2020
CO2 EMISSION [T/T MATERIAL] STEEL BAR
1.5
CEMENT PVC
1
0.5
0
BASE CASE
100 ECU/T CO2
Factor 2 or Factor 10 ? The results from Table 4 are aggregated in Figure 7.4. The base case represents the averaged estimate for the current emission (see Table 7.3). Options have been arranged according to perceived feasibility. Barriers for introduction increase from the left to the right because of increasing costs, uncertainty regarding the technological feasibility, and the consequences for the existing production structure. For example increased wood use will face major competition from the producers of other materials. 137
The conclusion that can be derived from Figure 7.4 is that a factor 2 improvement can be achieved without any major changes in either lifestyle or industrial structure. This conclusion not consider the emission reductions in materials production, shown in Figure 7.7. A net CO2 storage can be achieved in the construction sector by large scale introduction of wood products as substitutes for concrete and bricks. The net carbon storage can exceed the net emissions in materials production. As a consequence, a net CO2 storage for the whole life cycle can be achieved. This represents even more than a ‘factor 10’ improvement. This analysis does not yet include any changes in lifestyle. This implies that further improvements are possible. Figure 7.4
Recommended sequence of emission reduction strategies
[MT CO2 PA] 300 250 200 150 100 50 0 -50 -100
. SE NT GS SCS IALS UAL THW BLD NGM ST. TER T. Q T RE TE M SIGN SUB . MA MEN E MA S E R E T A D C C U W IN RE ST. STIT OVE SUB SUB IMPR
E CA
BAS
138
ER
OTH
Secondary effects Apart from GHG emissions, many other environmental impacts are considered in assessment methods like life cycle analysis (LCA) or environmental impact studies. Changes in building materials use and production can also affect these secondary impacts. For example wood treated for enhanced durability can pose a serious environmental problem. It is important to prevent such negative side effects. On the other hand, options like increased materials efficiency result in a decrease of the total amount of waste and in a dematerialization of the economy, resulting in important secondary environmental benefits. Strategies with secondary benefits deserve special attention, strategies with secondary negative impacts should be carefully evaluated.
7.5
Conclusions
Significant CO2 emissions can be contributed to the production of building materials. The estimates range for Western Europe range from 215 to 315 Mt CO2 per year, representing 7-9% of the total CO2 emissions in this region. The most important materials from a CO2 point of view are cement, tropical hardwoods, steel, bricks, timber products, aluminium and plastics. Based on the analysis of CO2 emission reduction options and the current policy plans, it is recommended to include upstream emissions in future policy plans for the building sector. The sector constitutes the single largest product group from a materials/GHG emission point of view. As a consequence, more attention is warranted. Building construction is at this moment four times as high as building demolition. If the construction activity declines and the demolition activity increases in the next decades, the demand for bulk materials may decline. However the extent of this decline is uncertain. More high rise buildings and more underground building activities may increase the demand for building materials. The renovation activity will increase. These changing activities can have a significant impact on the building materials consumption.
139
A number of improvement options for the construction sector have been identified as important GHG emission reduction options for the next 10-25 years: For a factor 2 - replacement of non-renewable tropical timber by renewable substitutes, - improved cement production: increased use of clinker substitutes (slag, ashes, geoplymeric cement), - increased materials quality for steel, cement, and wood products, - re-design of buildings from a materials efficiency point of view, - enhanced building and construction waste recovery systems. Energy recovery from wood waste. For a factor 10 - substitution of concrete and ceramic products by wood products. Each strategy that affects the materials content of buildings cannot be generalised to the whole building market, but requires an analysis on a project basis. The model calculations have shown that the weight of buildings influences the thermal mass. The thermal mass influences the energy requirement for heating and cooling significantly. Preliminary MARKAL results show [Gielen 1997a] that the price increase for building parts due to significant CO2 taxes is for all structural elements below 10%. Such a limited cost impact poses probably insufficient incentive to switch from the current building practice to a completely different building practice. As a consequence, other policy instruments like legislation or covenants seem more attractive than the tax instrument.
140
141
8.
ROAD VEHICLES
Mirjan Bouwman and Henk Moll; IVEM
8.1
Introduction: Road vehicles and material use
The car fleet forms an important stock of steel in the society. The potential for recycling of car materials determines the extent to which the associated flow of steel can become a closed loop. After manufacturing, the use of cars by consumers is also connected to the material use for cars. Lightweight cars do consume less energy; and the weight of a car seems to be connected to the car safety and the average lifetime of cars. The analysis of these cross sections of the material production and recycling system and the consumption system may create new approaches for further environmental improvement. However in these cross-sections also possibilities for problem shifting may occur, because of unforeseen changes elsewhere in the system. In this chapter the analysis of one sub-system, as modelled in the MATTER3.0 MARKAL model, is described. Before going to the details of the passenger car sub-system, its position within the integral energy and material system is established. In addition, the most promising ways to reduce the greenhouse gas emissions by changes within this sub-system are discussed . The passenger car is the most important consumption item in present society, be it measured in terms of energy, materials consumed and costs. The energy requirement for driving passenger cars is very substantial: 15% of global energy consumption [Jepma et al. 1995]. Furthermore substantial amounts of energy are required to produce each year the cars required for replacement and expansion of the fleet. The associated volume of materials (especially metals) is also substantial, in the range of 2-10% of total material production. The average lifetime of a passenger car is 10 - 15 years. So the stock of car materials within the economic system is substantial. A large part of this material stock can be recycled after car disposal. The ownership and use of passenger cars in society is still growing in accordance to the general growth in the economic system. Notwithstanding technological improvements in car design and production, the lifecycle energy consumption by cars (expressed in MJ/km) does not decrease. The increase of car weight for safety and comfort purposes compensates fully the technological 142
improvements with regard to engine efficiency and aerodynamic properties. The functionality of the passenger car is upgraded gradually. In this regard the passenger car may also serve as a model for trends of consumption behaviour in a broader sense. For the future of the passenger car some potential trends are of importance: the possible introduction of new energy saving and environmentally friendly automotive technologies such as the fuel cell, improved engine and aerodynamic concepts; the optimisation of material composition of passenger cars with regard to energy conservation (e.g. light weight design), and with regard to material recycling and waste prevention. These options demonstrate the close interaction between energy consumption and CO2 emissions and the material cycles for the passenger cars. This chapter describes the passenger car system in more detail. Section 8.2 discusses the interactions that occur between the material and the energy subsystem in the case of passenger cars, and illustrates why passenger cars are of special interest when modelling both the energy and materials system. Section 8.3 illustrates the earlier mentioned process of a changing standard in defining passenger cars. Section 8.4 describes the method used for analysing material substitution options in passenger cars, which is described in more detail in (Bouwman and Moll 1997b). This method forms the basis of the figures used in sections 8.5 and 8.6. The first section shows the consequences of material substitution options in passenger cars on a national material flows level. This section is based on an earlier analysis (Bouwman and Moll 1997a). Section 8.6 indicates (based on the factor 2/factor 10 analysis of Bouwman and Moll 2000) how possible energy savings in the energy and materials system contribute to the total possible energy savings. In this section, not only technological, but also non-technological options are defined and included in the analysis. Finally, section 8.7 draws some conclusions on the contributions of the passenger cars in the MATTER- MARKAL analysis.
8.2
Material - energy interactions
Within the MATTER project, especially interactions between the energy and the material system receive special attention. A good example of such an interaction is the production of passenger cars. One of the important variables in determining the energy use of a passenger car is the weight of the vehicle. Heavy vehicles use more energy in accelerating and in driving than lighter vehicles. In general, it is assumed that a weight increase of 100 kg results in an increase of fuel consumption of 0.5 litre per 100 kilometre. This means that a weight increase of 1 kg results in a life143
time fuel use increase of ten litres of fuel. With a smart material choice, the weight of vehicles can be minimised, implying a minimal energy requirement. At present, steel is the most common material in vehicle construction. With 60% in the overall material composition, steel is the standard material. This is mainly due to its favourable properties is various aspects. Steel is cheap, and easy to form, coat, join and process. A wide variety of properties can be achieved by adding low percentages of other materials. Moreover, it has a good strength, stiffness and surface quality. However, compared to possible alternatives, steel is relatively heavy. Steel has a density of 7.8 ton per m3, compared to for example 2.7 ton per m3 for aluminium. This specific property has been the basis for the idea of using other materials to replace steel in order to reduce the weight of the vehicle. However, when searching for alternatives, the wide range of favourable steel properties should be competed by other materials. For example, the density of aluminium, compared to that of steel, suggests that replacing a steel part with same size aluminium part results in a weight reduction of 65%. However, the strength properties of aluminium are considerably less than those of steel. For this reason, aluminium parts with specific strength demands should be two to three times thicker than steel parts. In this way, the weight gains are almost completely nullified. However, by smart designing, only essential parts of an element are a bit thicker than in the steel version, allowing weight savings up to 50 per cent. Another option for light weight design is the use of plastics. Especially for parts without strength requirements this is an interesting option. At the moment, plastics are especially used in the car interior. New developments in plastics, for example, composite materials, can meet for strict strength requirements with a big weight advantage. In terms of the energy - material interactions, not only the weight advantage of new materials plays a role in the equation. Most of the replacing materials for steel have a production energy (GER value) that is considerably higher than that of steel. So, this energy investment in the production phase should be gained back during the use phase. The interaction between the two systems consists therefore in case of road vehicles of two parts: first there is in most cases an energy penalty for lightweight producing in the production phase. Second, there is an energy gain during the use phase, as light vehicle use less energy while driving. In lightweight vehicle design, one more aspect plays a role. Heavy vehicles require extra strengthening in the essential body parts, to make sure that the vehicle is solid enough. Also more engine and brake power is required to accelerate and stop the vehicle. This phenomenon of extra weight investments in heavier cars is called the weight factor (Kato and Shiroi). The weight factor for the 144
same vehicle performance is 1.47, which implies that a weight increase of 100 kg requires another 47 kg of body strengthening and engine and brake extensions. When a decrease in vehicle performance is accepted, the weight factor is 1.23. This means that another 23 kg is needed to keep the strength of the vehicle on the same level. However, with the heavier vehicle and no adjustments in the engine and brakes, the vehicle performance decreases. This phenomenon offers an extra advantage in reducing the vehicle weight. In case of a weight reduction by lightweight construction, an extra reduction is achieved by a reduced need of body strengthening and engine performance.
8.3
Changing standard
Within the MATTER project, various consumables are modelled, each with their own lifetime and accompanying specific policy aspects. The typical lifetime of a road vehicle amounts to ten to fifteen years. This implies five to seven generations of vehicles between 1990 and 2050, the lifetime of the MATTER model. This lifetime implies that changes in technology require a period of ten to twenty years between introduction and full implementation in all vehicles in the fleet. However, this lifetime does make considerable changes in technology possible, as at least five complete new generations of vehicles will be used during 1990 and 2050. Although the function of a passenger car seems to be easy to define - its main purpose is the transport of one or more persons over a road - in practice things are not as easy as they may seem. In the last decades, the appearance of the passenger cars changed considerably, while the function of the car did not change essentially. The changes in the passenger car are related to the addition of more and more gadgets and safety features. New gadgets in general become standard car parts within a few generations. The weight associated with these gadgets is considerable. Some typical examples are the introduction of power steering (15 kg), sound damping (30 kg), central door locking (3 kg), climate control (25 kg), and electric seat adjustments (10 kg). The introduction of new and extra safety features also cause a weight increase. Good examples are the introduction of airbags (9 kg), anti-lock brakes (10 kg), seat belts and head rests (15 kg) and extra body strengthening (36 kg) (Vermeer 1996, Nieuwenhuis et al. 1992). These extra weight additions require extra strengthening in the bodywork, as well as a more powerful engine and brakes, to keep the cars performance at the same level.
145
Besides the weight increase caused by extra gadgets, there is also a tendency to buy ever-larger cars. With the steady increase of personal incomes, while in the same time cars become relatively cheaper (Bennis et al. 1991), people can afford a larger car for the same part of their income. The combinations of these two effects, the acquisition of ever larger cars and the addition of new safety equipment, better instruments and new gadgets to existing models, is called the functional upgrading of passenger cars. Figure 8.1
Development of the average vehicle weight in the Netherlands
[kg]
Average vehicle weight in the Netherlands
1050 1000 950 900 850 800 1979
1984
1989 Fleet
1994
New
Within the Netherlands, this upgrading of passenger cars counteracted the efficiency improvements achieved in the last decade. According to Van den Brink and van Wee (1999), the overall energy use of passenger cars has not become more efficient between 1988 and 1997. In the contrary, new passenger cars in 1997 are slightly less efficient than new cars in 1990. The annual weight increase between 1991 and 1997 amounted to 1.8 percent (van den Brink and van Wee 1999). The weight increase between 1970 and 1995 is shown in Figure 8.1. The weight increase of new vehicles in the period 1985 - 1994 can clearly be noticed. The average fleet weight slowly follows this trend.
146
The steady increase of vehicle weight reflects the changing standard of the vehicle. It is clear that with the weight increase, cars not only become safer, but also more comfortable. Especially the latter influences the perceived function of the car. In modelling road vehicles, this process of a changing standard passenger car is included in the analysis. For freight transport, such a change is not relevant.
8.4
Applied methodology for assessing material substitution options
In order to analyse what possibilities there are for material substitution in passenger cars, it is useful to make a division in various functional areas, each with their own specific demand on material characteristics. Area I (in total about 350 kg) contains the engine and drive shaft parts of the vehicle which have to withstand high temperatures and friction. Area II contains the carrying structure of the vehicle, which implies high demands on strength. The total weight of this area is about 400 kg. Area III contains the functional interior parts. This small area (about 125 kg) contains a variety of materials, each with specific demands like strength, and looks. Area IV contains all gadgets and safety features that are added to cars. The material requirements in this area (125 kg) are very diverse. For each of these areas, substitution options are defined, which could be applied. The weights of these areas in the car are interrelated. Addition of extra gadgets in area IV increases the weight of area II in order to carry these gadgets, and the weight of area I, as a more powerfully engine is needed to move them. In this way, for each combination of substitution options for an area, the new vehicle weight and accompanying material composition can be calculated. Basic assumption in the finally defined options is that as much as possible, one general substitution line is followed. In this way, three substitution directions are defined: a high performance steel vehicle, an aluminium vehicle and a plastic vehicle.
8.5
Material flows associated with passenger cars
This section will show the consequences of the introduction of a modified vehicle on the material flows. The energy sources are assumed to remain equal in this analysis, and effects of changes are not included in the analysis in this section. The consequences of the full introduction of modified vehicles for the material flows in the society is calculated for the Dutch situation with the aid of a dynamical life cycle program DYMOS. 147
The model uses the Dutch car fleet. The size of this fleet is based on historical data until the year 1995. Supplementary assumptions are made for developments in the car fleet size after 1995. It is assumed that the Dutch car fleet will grow until 8 million vehicles in 2020 and will remain constant afterwards. This development is shown in Figure 8.2. This figure also shows the replacement of the current standard vehicle composition with an alternative model with alternative material composition. Within the model, three alternative material compositions are defined: a steel, an aluminium and a plastics model. Figure 8.2
Development of the Dutch car fleet size 1990 - 2050 Fleet size Dutch passenger cars 1990-2050
8 7
Fleet size [mln]
6 5 4 3 2 1 0 1990
2000
Total fleet
2010
2020 Year Model 1
2030
2040
2050
Model 2
Three scenarios represent the introduction of each of these models in the car fleet. This means that in the steel scenario, a new improved steel model slowly replaces a standard steel model. This also effects the new sales of passenger cars in the various scenarios. This is shown in Figure 8.3.
148
Figure 8.3
New sales various models in various scenarios
New sales 3 scenarios 1990-2050 1,000 800 600 400 200 0 1990
2000
2010
Steel - stand. Aluminium
2020 Year
2030
2040
2050
Steel - alt. Plastics
The continuous line in this figure represents the new sales of the standard model in the steel scenario. The other scenarios face decreasing sales of standard steel cars and higher sales of new cars with alternative material compositions. Within twenty years the sales of alternative cars is on the same level as the steel model in the steel scenario. Each of the modelled car types has another average lifetime. The standard steel car has a lifetime of eleven years, the current Dutch average. The aluminium car has with twelve years a slightly longer lifetime, the plastic model has a somewhat shorter lifetime (ten years). The absolute differences in the cars sales in Figure 8.3 are caused by these lifetime differences. The model uses an annual use of vehicles of 16.000 km. This implies a vehicle life of 176 000 kilometre for the steel car (192000 for the aluminium and 160000 for the plastic car). The annual use and the lifetime of the vehicles remain the same in the period 1990 - 2050. The increase in vehicle fleet between 1990 and 2020 thus implies an increased use of passenger cars. The composition of the cars does not remain the same during this period. The signalled trend of weight increase due to gadgets and safety features is extrapolated to future years. For this reason, the 2050 passenger car is considerably heavier than the 1990 car. This change in car weight and material composition is presented for three models in Figure 8.4. This figure shows clearly that the order in terms of weight of the three models does not change, because all three models face the same upgrading in time.
149
Figure 8.4
Material composition of the three models in 2000 and 2050
Material composition and total weight three models 1400
Weight [kg]
1200
1270 1111
1029 944
1000
933
817
800 600 400 200 0
Steel
Aluminium Plastics
Steel
2000 Other
Plastics
Aluminium
Aluminium Plastics
2050
Steel
Moreover, Figure 8.4 also shows that in the plastic model, steel is still the most common material in the passenger car. Compared to the steel model however, a large share of the material is plastic, which explains the name. Finally, the model uses supplementary assumptions on the development of the car efficiency. A weight decrease of 100 kg results in a decrease of fuel use of 0.5 litre per 100 km. Moreover, there is an autonomous annual efficiency of 1 per cent per year, which slowly decreases to 0.5 percent.
150
Figure 8.5
Energy use (direct and indirect) of total passenger car fleet for three scenarios
Total energy use passenger cars 3 scenarios 1990-2050 400
Energy use [PJ]
350
300
250
200 1990
2000
Steel
2010
2020 Year Aluminium
2030
2040
2050
Plastics
With these assumptions, results on the material use and energy use are calculated for each scenario. Figure 8.5 shows the energy use of the total car fleet for the three defined scenarios. The lines in this figure represent the total of the summed direct and indirect energy use. The figure shows clearly that the energy use in the reference scenario first increases, which is caused by the increase of vehicles. After 2020 the fleet size no longer increases, and the energy use slowly decreases, through the improved efficiency of the cars. In the substitution scenarios, the total energy use slightly decreases after 2010. In the first ten years after the introduction, the plastics scenario has a slight advantage over the aluminium scenario, because of a lower energy use in the production phase. After 2010, the aluminium scenario is the most favourable, as from that moment on, secondary aluminium can be used during the production phase. In all scenarios, the energy use in 2050 is higher than in 1990, caused by an increase in the mobility. With both substitution scenarios the difference between 1990 and 2050 can be limited. A reduction of nine percent in the plastic scenario and 17 percent in the aluminium scenario in 2050 compared to the steel scenario can be realised. The energy use shown in Figure 8.5 consists of both the direct and the indirect energy use. The direct energy use comprises the energy use associated with the fuel use of the car, the indirect en-
151
ergy use comprises the energy use associated with production, maintenance and waste of the vehicle. These two shares are shown in separate figures. Figure 8.6
Direct energy use of passenger cars Direct energy use passenger cars 3 scenarios 1990-2050
400
Energy use [PJ]
350 300 250 200 1990
2000
2010
Steel scen. Plastics scen.
2020 Year
2030
2040
2050
Alum inium scen.
Figure 8.6 shows the direct energy use of passenger cars, Figure 8.7 the indirect energy use. The latter clearly shows the effect of recycling on the energy use in the production phase. About ten years after the introduction, the energy use in the production phase in the aluminium scenario decreases by in the use of secondary aluminium. About twenty years after the introduction, the indirect energy use is even smaller than in the steel scenario. This favourable position is partly explained by the increased lifetime of the aluminium passenger car. In terms of the direct energy use, both the plastic and the aluminium model are better than the steel model.
152
Figure 8.7
100
Indirect energy use of passenger cars In d ire c t e n e rg y u s e p a s se n g e r c a rs 3 sce n a rio s 1 9 9 0 -2 0 5 0
E n e rg y u se [P J]
80 60 40 20 0 1990
2000
2010
2020
2030
2040
2050
Year S te e l s ce n . P la stics s c e n .
A lu m in iu m s ce n .
The indirect energy use can be further specified in a material and an assembly share. Figure 8.8 shows the situation without the option of energy gains by recycling for the standard steel scenario. Figure 8.9 shows the same situation with recycling. These figures make clear that that the energy use of assembly and materials are small compared to the total (each about ten percent). Recycling seems to have a limited effect on the results in terms of the total energy use, but it does cause a significant reduction in the energy use of the materials. Without recycling, materials have a share of almost 15% in the total energy use, with recycling this decreases to about 11 percent. Figure 8.8
Energy use of passenger cars without recycling
153
Figure 8.9
Energy use of passenger cars with recycling
DYMOS not only presents figures on the energy use of the various scenarios, but also on the material flows associated with the introduction of the various models. Three different material flows can be distinguished. At first, there is the primary material demand for the production of the vehicles. This is shown in Figure 8.10. Secondly, there is a material flow associated with the waste flow, which can be further specified in a share being recycled (Figure 8.11) and a share that is considered to be waste (Figure 8.12). Figure 8.10
Primary material use P rim a ry m a te ria l u s e p a s s e n g e r c a rs 3 s c e n a rio s 1 9 9 0 -2 0 5 0
M a te ria l u s e [k to n ]
700 600 500 400 300 200 100 0 1990
2000
2010
2020
2030
2040
2050
Year S te e l s c e n .
154
A lu m in iu m s c e n .
P la s tic s s c e n .
Figure 8.11
Recycling material flow R ec yclin g m aterial flo w s p ass eng er ca rs
M ate rial flo w [k ton]
3 sce na rios 19 90 -2 05 0 800 700 600 500 400 300 200 100 0 1990
2000
2010
2020
2030
2040
2050
Y e ar S teel s cen .
Figure 8.12
A lum inium sce n.
P lastics s cen .
Waste material flow W a s te flo w s p a s s e n g e r c a rs 3 s c e n a rio s 1 9 9 0 -2 0 5 0
W a s te flo w [k to n ]
500 400 300 200 100 0 1990
2000
2010
2020
2030
2040
2050
Year S te e l s c e n .
A lu m in iu m s c e n .
P la s tic s s c e n .
In all three figures, the full material consumption is shown, without a subdivision into type of material. The variations in material demand between 2000 en 2020 are caused by sudden changes in the produced number of vehicles. The total material demand is about equal in the steel and plastic scenario. The plastic car is lighter, but also has a shorter lifetime. The differences outweigh each other. In both the recycling and the waste picture, these variations cannot be noticed. This can be explained by the variation in lifetime of the cars. Not all cars are discarded at the same age, but with a normal distribution around the average age. In this way, the variations in the production cannot be seen while discarding. Figure 8.11 shows that amount of recycled material is the largest in the steel scenario. The high amount of recycling material in the plastic scenario is mainly caused by the high amount of steel and aluminium in the material composition of this vehicle. The
155
amount of recycling material is lower in the aluminium scenario, due to the lower overall material demand in this scenario. The figures shown above represent the total material requirement. This can be studied in some more detail. Figure 8.13 and Figure 8.14 show the aluminium requirements in the steel respectively the aluminium scenario. Figure 8.13
156
Aluminium demand in the steel scenario, 1990 - 2050
Figure 8.14
Aluminium demand in the aluminium scenario, 1990-2050
The comparison of the two figures makes clear that the demand in the aluminium scenario is about three times as high as in the steel scenario (mark the different axes!). The figures distinguish four possible origins. The upper stream represents the waste material. This material is contaminated in such a way that reuse is impossible in any way, and this material is therefore lost for the production process. The stream under this is the external recycling. This stream represents the material that has a quality that does not meet the requirements in the production process of passenger cars, but can be used in other applications. The third stream represents the net amount of added material. This is the material that needs to be added because either the share of aluminium in cars is increasing, or the number of new cars is increasing. If both the fleet size and the material composition of passenger cars remain equal, this flow equals zero. The upper three streams together form the amount of materials that needs to be added to the production process. The lower stream in the figures represents the internal recycling of the system. This concerns the amount of material that is collected from car wrecks and after operation can be reused in the production process. Figure 8.13 shows a considerable increase in net added aluminium between 1990 and 2010. This is caused by the changing material composition of the steel passenger car between 1990 and 1995, in which the share of aluminium slowly increases. By the increase of the car weight, this net addition never disappears, as each year more material is needed to produce a car. The amount of material in the internal recycling flow slowly increases in Figure 8.13, with a delay of about eleven 157
years after the introduction of the increased share of aluminium. After these eleven years, the aluminium is released from the discarded cars and reduces the amount of net material added. Both the amount of waste and the amount of external recycling form a fixed share of the material amount comprised in discarded vehicles. Figure 8.14 shows that the amount of added aluminium in the aluminium scenario increases mainly after the year 2005. The increase before this year is mainly caused by the increased aluminium share in the steel car, as is also shown in Figure 8.13. After 2005, the substitution to an aluminium car starts to be important. This causes a large increase in the amount of net added aluminium. This stabilises around 2020, as the internal recycling than can fulfil a large part of the extra demand for aluminium. Figure 8.14 also shows a net added material stream that will never be zero, as the weight of the cars are increasing. Figure 8.15
158
Plastics demand in the plastic scenario
Figure 8.16
Plastics demand in plastic scenario with increased recycling
A similar figure can also be made for the material requirements associated with the introduction of the plastic passenger car. Figure 8.15 shows the plastics demand in the case of the introduction of the plastics passenger car. This figure uses the recycling possibilities as they existed in 1990. At this moment that may seem a quite pessimistic view. The structure of the figure equals the structure of the former two figures. This figure also shows an increase in the plastics demand between 1990 and 2005 caused by an increase of the share of plastics in the material composition of the steel passenger car. After 2005 the plastics requirements increase even faster, because of the introduction of the plastic passenger car. However, the origin of the increased plastic flows, significantly changes from the aluminium situation. The amount of materials provided by internal recycling is very small. This creates a large waste flow of over 150 kton after 2010, that needs to be dumped. The amount of primary material that needs to be added to the system is a lot larger as well. However, keep in mind that the differences in waste streams among the various scenarios are smaller than the last figures might suggest. Figure 8.12 already showed quite small differences due to the large amount of good recyclable steel and aluminium in each of the scenarios. Figure 8.16 shows the situation with an increased recycling for plastics. The total demand for plastics does not change compared to Figure 8.15, but the origin of the materials does. Both the amount of internal and external recycling has increased in this figure. The amount of waste has
159
decreased with about 100 kton annually. Such an increased recycling scenario also effects the total energy use associated with the plastic scenario. The energy use in 2050 has decreased about 10 PJ compared to the situation with less recycling options. Better recycling of materials results in a saving of about 10 percent on the energy use of materials and of about 3 percent on the total energy use. An increase of the recycling options does not effect the order of the scenarios listed in Figure 8.5.
8.6
Reduction potential of energy and material use in passenger cars
Besides an analysis of the consequences of material substitution in passenger cars, also an analysis of the importance of material substitution options for reducing the energy requirements of passenger transport is made. This analysis focuses more on the energy implications of several improvement options and calculates the contributions of various improvement options to overall potential savings. A detailed description of this analysis is presented in (Bouwman and Moll 2000). This section will discuss the analysis in broad outlines. Basic line of reasoning in the analysis is that not all improvement options for passenger cars can be equally easily implemented. Some improvement options require large adaptations of one or more societal groups, while others do not (see Groenewegen et al. 1998). In the analysis, four categories of improvement options are defined with increasing implementation problems are defined. The options in these categories are based on earlier inventories (Binsbergen et al. 1994, Ybema et al. 1995, Bouwman and Moll 1997b) in addition to some non-technological options. The first category comprises technological options, like the improved combustion engine and adjustments in the bodywork. The second category comprises alternative drive systems, like the introduction of the electric of fuel cell passenger car. These options not only the technologies applied in the passenger car, but require also changes in the infrastructure for distributing other fuels and/or electricity. The third category of options comprises options that require a behavioural adaptation of the users. Examples of such options are an increase of the vehicle lifetime, an increase of the vehicle occupancy or the use of smaller passenger cars. Finally, a fourth category of options is defined, in which the overall mobility decreases. This last category may help to indicate necessary changes in order to achieve certain reduction percentages, but has no meaning in the analysis, which calculates the reduction potential per kilometre.
160
Technological options generally have the fewest implementation problems. Options in this category do not influence the functionality of the vehicle. The options here comprise the improved internal combustion engine (IIC), improved tyres and aerodynamics (ITA), continuous variable transmission (CVT) and modified frame (MF). The IIC includes many different options, such as lean-burn technology, valve steering management, turbo-charging, direct fuel injection, electronic engine control, etc. The term improved internal combustion engine combines the relevant options for both diesel and petrol vehicles. Improved tyres and aerodynamics offer small savings, but they are also relatively easy to implement. Continuous variable transmission offers the use of a continuous range of gears. In this way, engine use is optimised, resulting in higher fuel economy. The modified frame comprises all material substitution options in order to reduce the vehicle weight. The overall results of these options are shown in Table 8.1. Table 8.1
Energy reduction percentages compared to 1990 in 2020 and 2050 with category 1 improvement options
Passenger car type Petrol passenger car with MF, ITA, IIC, CVT18 Diesel passenger car with MF, ITA, IIC, CVT
2020 22% 30%
2050 29% 39%
The second category of improvement options comprises alternative fuel vehicles. The adaptations to be made in this situation are not individual, but require changes in the infrastructure resulting from the distribution of new fuels. This category includes the introduction of the electric vehicle, the hybrid vehicle and the fuel cell passenger car. An electric vehicle is powered by a large battery. The energy use of electric vehicles is very low compared to standard internal combustion vehicles. However, large ERE-values for the generation of electricity (1.7 MJ/MJ in Europe in 1990) cause a relatively large primary energy demand for electric vehicles. Electric vehicles are equipped with regenerative braking (RB), a system that stores braking energy. The hybrid passenger car combines the advantages of both an internal combustion engine (unlimited range) and electric propulsion (low emissions and noise). Hybrid passenger cars use the electric part in urban traffic and change to the standard engine when a long range is required. The disadvantage of this system is the relatively high vehicle weight due to the combination of the two systems. This results in higher energy use when driving in the internal combustion configuration compared to the standard vehicle. A fuel cell passenger car also runs on electricity, but uses fuel that is converted
18
Legend: MF = Modified frame, ITA = Improved tyres and aerodynamics, IIC = Improved internal combustion, CVT = Continuous variable transmission, RB = Regenerative braking
161
directly into electricity in the car. The technology is not yet mature; no vehicles with fuel cell technology are on the market yet. Large scale implementation before 2020 is uncertain, and at present the costs associated with this technology are very high. The efficiency improvements that can be achieved with the implementation of both category I and II improvement options are listed in Table 8.2. Table 8.2
Energy reduction percentages compared to 1990 in 2020 and 2050 with category 1 and 2 improvement options
Passenger car type Fuel cell passenger car with MF, ITA, RB Hybrid passenger car with MF, ITA, RB (high ERE value) Hybrid passenger car with MF, ITA, RB (low ERE value) Electric vehicle with MF, ITA, RB (high ERE value) Electric vehicle with MF, ITA, RB (low ERE value)
2020 Not yet available 31% 36% 35% 54%
2050 54% 32% 37% 44% 59%
The options in category III require important behavioural adaptations. Examples cannot be found in the databases used for the technological options. This category comprises a change in modal split (increased use of public transport), increased vehicle life, driving small passenger cars and increasing the average occupancy rate of passenger cars. These category III improvement options require societal adaptations. The category II options are assumed to be easier to implement, as the necessary changes can be influenced with policy more directly. For changing the modal split, it is assumed that the share of public transport in passenger mobility doubles from 14% to 28% by 2020. This implies that this option is only valid for a small share in the total mobility demand. Replacing a passenger car kilometre by a public transport kilometre has an average energy advantage of about 60% in 2020 and about 70% in 2050, compared to the 1990 value. Increasing vehicle life from 12.5 to 15 years affects the indirect energy component. Doing so requires major maintenance investments from the various users of a car. The effects of a longer vehicle lifetime are not very large. The gain from dividing the production energy of the vehicle -- 15% of the lifetime energy (Moll and Kramer 1996) -- over a larger number of kilometres is partly lost by the need for increased maintenance, which has an energy requirement of 2 GJ/year (Moll and Kramer 1996). A decrease in vehicle size may also contribute to energy savings, because lighter cars have higher fuel economy, especially for frequent stop and drive situations. Introducing small passenger cars 162
requires large behavioural adaptations, as this opposes the current trends in the development of vehicle weight. Driving an 850 kg passenger car instead of the standard 1000 kg passenger car increases fuel economy by 9 percent (Bouwman and Moll 1997b). For this small vehicle, no weight increases are assumed. As the weight difference in vehicle size between standard and 850 kg passenger cars increases over time, the advantage in fuel economy also increases over time. Another method of decreasing energy use per passenger kilometre is to increase the occupancy rate of a vehicle. By doubling the occupancy rate, the energy use per passenger kilometre halves. Since this option requires large adaptations from the individual user, this option will be hard to realise. An increased share for public transport, to cover the individual trips that cannot be combined with other individual trips by passenger car, should probably accompany the implementation of this option. Other behavioural options refer to the use of the car. Changing driving style, adjusting inflation pressure of tyres or changing maintenance patterns can also contribute to overall savings. The effects of the above mentioned options are calculated, in combination with the implementation of the category I and II option. Table 8.3 lists the results. Table 8.3
Effect of non-technological improvement options
Set of options Without non-technological options With increased vehicle life (+2.5 year) With 850 kg passenger car With average occupancy of 3 passengers Doubled public transport share With all non-technological options combined With all non-technological options except doubled public transport share
2020 37% 39% 46% 68% 40% 72% 74%
2050 54% 56% 60% 77% 57% 80% 81%
The effects of implementing each of the categories of options are summarised in Table 8.4. Table 8.4
Energy saving potential per passenger kilometre of categories of improvement options
Category Category I Category I + II Category I + II + III
Reduction 2020 25% 35% 75%
Reduction 2050 30% 50% 80%
163
The analysis shows an important role for non-technological improvement options, when aiming for high reduction percentages. These options are not included in the MATTER-MARKAL model. This implies that the largest saving possible in the energy use per unit of transport in 50%. With the expected increase in mobility an overall saving of only 20 percent can be achieved. When looking in more detail to the improvement options in the various categories, it shows that both material and energy options contribute to the savings listed in Table 8.4. Modifications in the car construction (originating from/affecting the material production sectors) like the modified frame of the small passenger car offer a saving potential of about 40% per passenger kilometre by 2050. Modifications in the automotive system (originating from/affecting the energy production system) have a saving potential of the same magnitude. Options which make more efficient use of the transportation system (like doubling the occupancy rate) have the largest saving potential with about 50%. In order to achieve the maximal saving potential in the transportation sector, both material and energy options should be included in the analysis. The efficiency options of the transportation system can also largely contribute to the saving potential, but are not implied in the scope of the MATTER MARKAL study.
8.7
Conclusions and considerations
This chapter showed in more detail some considerations regarding passenger cars; one of the consumer products modelled in the MATTER-MARKAL model. Passenger cars form a good example of the value of this model, where interactions between the energy and the material system play an important role. Besides standard technological improvement options, material substitution options may contribute to a reduction in the energy use of passenger cars, when the latter implies a reduction of the car weight. Such a change in the material composition may have large consequences, as passenger cars have an important share in the various material flows in the society. Section 8.5 showed that the implementation of material substitution options results in changes in material flows. The overall consequences of such changes can be analysed very well with the MATTER-MARKAL model. In this way, it can be analysed whether the mentioned external recycling material flows can actually be used in other production processes. Although passenger cars are a very interesting consumer product to include in the MATTERMARKAL model, Section 8.6 showed that this model may not be the most adequate way to model 164
all possible saving options associated with passenger cars. The improvement options that require a behavioural adaptation (category III), play an important role in the overall achievable savings. However, these options also face the largest implementation complications. For this reason, it could also be argued that not implying such options draws a realistic picture of possible energy savings in passenger transport.
165
9.
AGRICULTURE AND FORESTRY
Dolf Gielen, Sandra Bos, Marga de Feber and Timo Gerlagh; ECN
9.1
Introduction
Greenhouse gas (GHG) emission reduction is one of the most important environmental problems for the next decades. Carbon dioxide (CO2) is the most important greenhouse gas, representing approximately three quarters of the total greenhouse gas emissions. Biomass strategies19 pose an important option for reduction of CO2 emissions. CO2 is fixed during the growing of biomass. This biomass can subsequently be used as a renewable resource, without net CO2 emissions. This feature is the basis for all biomass strategies for GHG emission reduction. A number of biomass strategies can be discerned: − Carbon storage above ground in new forests, − Carbon storage below ground in soils, − Carbon storage in wood materials and products, − substitution of biomass for energy carriers, − substitution of biomass for materials, − energy recovery from process waste and post-consumer waste. These strategies compete with each other and with food and fodder production for the limited amount of biomass available. Moreover, these strategies must compete with other strategies for greenhouse gas (GHG) emission reduction. Many GHG emission reduction strategies influence each other’s efficiency. For example emission reductions in electricity production and emission reductions based on increased efficiency of household equipment. Strategies which are not related to biomass can also influence the efficiency of biomass strategies. A lot of attention has been paid to the carbon storage strategies, to the substitution of energy carriers and to materials substitution (e.g. Sikkema and Nabuurs, 1995; Kohlmaier et al, 1998; Marland and Schlamadinger, 1998). Little attention has been paid to the interaction of these strategies
19
Biomass strategies are defined as groups of activities concerning agriculture and forestry products for GHG emission mitigation with similar characteristics.
166
and to the cost-effectiveness of these strategies. The goal of this study is to identify cost-effective combinations of emission mitigation strategies on the basis of integrated analysis and to identify the role of biomass in such an integrated approach.
9.2
Agriculture, Forestry, and the GHG problem
Agriculture and forestry are closely linked to the GHG problem. On one hand, agriculture is an important source of methane CH4 emissions (225 Mt CO2 equivalents20) and nitrous oxide N2O emissions (175 Mt CO2 equivalents21) out of a total Western European emission of 4250 Mt CO2 equivalents (based on [Eurostat, 1995] and additional country information). On the other hand, both agriculture and forestry can be used for biomass production. Biomass constitutes a CO2neutral energy source or a materials source. However the availability of biomass is limited. This section will start with a brief overview of emission reduction options which are related to the current agricultural practice, focusing on CH4 and N2O. Next, the potential contribution of a changing product mix will be assessed. Reduction of emissions per unit of product The total Western European CH4 emissions from agriculture amounted to approximately 225 Mt CO2 equivalents in 1990 (based on [Gerlagh and Gielen, 1999; IEA Greenhouse Gas Programme, 1998]; uncertainty ±25%). 70% of this emission is accounted for by the enteric fermentation process, the remaining 30% is accounted for by the storage of manure. Enteric fermentation is limited to ruminants: cows and sheep are the main sources (85% cows). A number of strategies exist to reduce these emissions [Gerbens, 1999a]: − increase the conversion efficiency (e.g. optimisation of the level of feed intake), − substitute roughage by fodder, − change the fodder composition by addition of concentrates. These three options can reduce CH4 emissions from Western European dairy cows, non-dairy cattle and buffalo by 11% in 2010 and by 25% in 2020 [Gerbens, 1999a]. Moreover these options are even cost-effective in a situation without GHG emission reduction (average cost savings 100 Euro/t CO2 equivalent).
20 21
Based on a global warming potential of 21, according to the Kyoto protocol. Based on a global warming potential of 310, according to the Kyoto protocol.
167
Regarding manure, the storage of cattle and swine manure account for 80% of the total emission. The storage of liquid slurry accounts for 85% of the total emission. A number of alternatives exist to reduce these emissions [Gerbens, 1999b]: − prevention of anaerobic decomposition of manure, − controlled digestion of manure with recovery of gas, − direct application for fertilisation, − alternative manure treatment methods. Storage of manure at outdoor temperatures in the Northwest European climate will decrease the methane emissions by 60-100% compared to storage within the stable at 20°C. Complete emptying and cleaning of manure storage silos will prevent inoculation of new manure. This will slow down the methane production process and reduce emissions by 30-100%, depending on the regular storage period (6 or 2 months, respectively). Direct application of manure can reduce the emissions by 100%. However the costs for long range transportation pose a major obstacle. In conclusion, a reduction of CH4 emissions by 25-40% seems feasible. For N2O emissions, the main source is the use of natural and organic nitrogen fertilisers, which are partially converted into N2O by micro-organisms in the soil. The synthetic nitrogen fertiliser use in Western Europe amounted to 9 Mt nitrogen (N) -equivalents in 1993 [FAO1996]. The fraction of nitrogen which is converted into N2O depends on the groundwater level, the soil structure and many other variables. Values from literature range from 0.1% up to 10% of the nitrogen content. The default value according to IPCC guidelines is 1.25%. If this value is applied to the nitrogen fertiliser consumption, the emission is approximately 55 Mt CO2 equivalents. The nitrogen content of the total amount of manure which is produced in Western Europe is approximately 12 Mt N per year. Limited data sources suggest that organic nitrogen sources such as animal manure induce higher N2O emissions per unit of N added to the soil than mineral N [Watson1996]. Some of this nitrogen is converted into ammonia and subsequently converted into N2O. Another fraction is converted into nitrates and subsequently converted into N2O. Conversion values range from 0.1-0.7% for nitrogen in dung to 0.1-3.8% for nitrogen in the urine fraction. In conclusion the emission factors for N2O from manure are uncertain. Applying a default emission
168
factor of 2% [Smith and Taggart, 1997] suggests an emission of 120 Mt CO2 equivalents. In conclusion, total fertiliser use represents an emission of 175 Mt CO2 equivalents (uncertainty ± 50%). Strategies for the reduction of these emissions are based on: − increased efficiency of nitrogen fertiliser gifts − substitution of nitrogen fertiliser types − reduced fertiliser use (extensification) The use of nitrogen fertilisers is an inefficient process [Ayres and Ayres, 1996]. Approximately 25% of the nitrogen in fertiliser is not consumed by plants: 10% is lost through run-off, 15% is lost through conversion by denitrifying bacteria. Not all nitrogen that is actually consumed by plants is useful. 30% of the total nitrogen fertilisers return to the soil in organic root, stem or leaf material that actually decays. This nitrogen is also partially lost for fertilisation. As a consequence of these losses, the actual end-use efficiency of nitrogen fertiliser use is approximately 50%. However the situation differs significantly among European regions. Nitrogen fertiliser gifts are 5-10 times higher than the European average in the intensively farmed areas, mainly driven by regional manure surpluses and high land and labour costs (the latter two constitute an incentive to increase yield per hectare). These differences (in fertiliser gifts) have significant impacts on attractive emission mitigation strategies. At high fertilisation rates, it makes sense to reduce emissions through reduction of N fertilisation gifts. At lower N-fertilisation rates, the crop yield is proportional to the fertiliser gift. Reduced N2O emissions are in this case off-set by increased land requirements. Moreover, the product quality can deteriorate at lower nitrogen fertiliser gift rates, e.g. in the case of wheat [Charles et al, 1998]. Substitution of nitrogen fertiliser types can contribute up to a 20% emission reduction [Kuesters and Jenssen, 1998]. Literature suggests that emissions are lower for an urea based fertiliser system than for an ammonium nitrate based fertiliser system. Some sources suggest that the losses of synthetic fertiliser can be reduced by 20-40%, e.g. through the use of slow release fertilisers [Worrell, 1994]. However the application of such high saving factors to the wide range of fertiliser gifts in Western Europe seems rather optimistic. The use of fertiliser alternatives such as biological nitrogen fixation is appealing from a theoretical perspec-
169
tive. However the practical application is still far away [Vance, 1998]. Moreover, this is no alternative for the use of manure, the main agricultural N2O source. A number of authors propose extensification as a solution to agricultural environmental problems (e.g. [Geier and Köpke, 1998]). However in the case of GHG emissions, this is not valid. The total biomass production is a limiting factor. While extensification will result in decreased fertiliser use and thus result in decreased N2O emissions, it will simultaneously decreases the production capacity. The reduction of N2O emissions is small in comparison to the emission reductions which can be achieved through increased biomass use (see below and e.g. [Kaltschmitt and Reinhardt, 1996]). For this reason, it is not considered a sensible strategy from a GHG policy point of view. Off course other environmental considerations such as eutrophication can pose important incentives for an extensification strategy. Because of the GHG focus of the following analysis, it has not been considered in more detail. In conclusion an emission reduction of 20-40% seems feasible for synthetic fertilisers. For natural fertilisers, an emission reduction of 10-20% seems feasible. Total agricultural N2O emissions can be reduced by 15-25%, based on technological changes in the current production structure. Changing the product mix The bulk of the agricultural crops is used for animal products (see Figure 9.1). Total production of crops amounts to 765 Mt (dry matter), 630 Mt of which is used for animal breeding. The adjustment of the product mix, especially with regard to animal products, is another important strategy to reduce GHG emissions.
170
Figure 9.1
Material flows in Western European agriculture, 1994. All stream quantities are given in Mt dry matter per year. HCO2O refers to water for biochemical reactions (CO2 fixation). Accuracy ±20% [Gerlagh and Gielen, 1999].
Fertiliser 10
CO2 960
H2O 390
Crop growing
Export cereals 50
Loss N/CO2/H2O/O2 1015
Oil crops, sugarbeet,
Fodder crops 140
cereals, grapes 85 Residues 20
Food conversion
Fodder production Grass, silage, hay 370
Loss 20
Fodder 260
Import soy, tapioca 60
Residues 40 Manure 300
Animal breeding Milk 13
Loss 237
Dairy product processing Sugar, oil, flour 45
Vegetables, fruit 120
Meat, eggs wool,
Dairy products 13
leather 40
Demand for food and animal products
The emission reduction potential is illustrated in Table 9.1, where the GHG emissions per kg useful animal weight are calculated (excluding bones and non-consumable parts). The figures indicate the significant difference in GHG emissions between different animal types, or vegetarian alternatives. The substitution of 8 Mt beef which is consumed in Western Europe today by 8 Mt poultry would reduce GHG emissions by 200 Mt CO2 equivalents. Of course the substitution of food products would pose a very serious impact on the consumer lifestyle and current agricultural practice and is not a very popular policy option. However its potential should be kept in mind, especially if new animals are selected in order to supplement the existing animal stock. For example in recent years, salmon has made major inroads. The figures in Table 9.1 suggest that fish may pose an important alternative from a GHG emission reduction point of view.
171
Increased productivity is not only an important strategy to reduce CH4 emissions for cattle (see above). If this strategy is applied to all animals, it can increase the land availability for biomass crops substantially. However again other considerations, such as e.g. health considerations with regard to growth hormones, must be considered in order to avoid too optimistic scenarios with regard to productivity increase potentials. Table 9.1 Animal type Beef Pork Lamb/mutton Poultry Salmon Carp Soy
9.3
GHG emissions per kg useful animal weight (accuracy ± 25%) CH4 [kg CO2 equiv./kg] 8 2 25 1 -
N2O [kg CO2 equiv./kg] 5 2 4 1 -
CO222 [kg CO2 equiv./kg] 21 7 21 5 12 3 223
Total [kg CO2 equiv./kg] 34 11 50 7 12 3 2
The biomass supply and demand situation
It has been stated before that biomass can be used for GHG emission reduction. However, its potential is limited by the biomass availability. There is some additional potential for wood recovery from Western European forests (currently at 70% of the annual regrowth, approx. 200 Mt dry matter per year). Total actual production of agricultural crops amounts to 765 Mton (dry matter)24, 630 Mton of which is used for animal breeding. Western Europe has reached a status where its agricultural production potential exceeds food and fodder demand. This is largely accounted for by the steadily increasing agricultural productivity. If this trend continues, 10-20% of the agricultural land (both arable land and pastures) may become available for other purposes, yielding up to 500 Mt biomass per year. As a consequence, agricultural biomass crops can constitute an important option for GHG emission reduction. However current agricultural policies are aiming for extensification, which will reduce the potential for biomass production. A better co-ordination of agricultural policies and energy policies seems warranted. Residues from agricultural crops (200 Mt) and manure (300 Mt) can also be used for energy and materials production but the competition from other applications must be considered (manure for fertiliser, straw for soil improvement, etc.).
172
Current European energy/GHG policies with regard to biomass are aiming for bioenergy, especially large scale electricity production based on gasification technology (European Commission, 1999). Biomaterial strategies have received little attention as of yet from a GHG emission point of view. Meanwhile transportation fuel research activities have been reduced because of the negative and costly experiences during the last decades. Some reforestation activities represent a continuation of a trend which started decades ago. It is unclear whether the current biomass trends are really optimal. For this reason the MATTER MARKAL model has been used in order to analyse the optimal use of biomass from agriculture and biomass for energy and/or materials.
9.4
Agriculture and forestry model structure
Figure 9.1 provides a general model overview of the model structure for biomass, showing the close relation between food, energy and material crops. A detailed overview of the energy and materials model structure is provided in (Gielen et al, 1998b). Europe is split into a Northern region, a Middle region and a Southern region in order to account for different climates and soil types. The Southern region is further detailed in a high yield and a low yield area. All important agricultural crop types are covered (including so called energy crops like miscanthus and sweet sorghum). Afforestation (new forests planted after 1990) is considered as carbon storage strategy. A detailed overview of the food module and non-CO2 GHG emission reduction strategies for agriculture is provided in (Gerlagh and Gielen, 1999; Gielen et al, 1999). Model input data for biomass (production and consumption processes) have been reported in six separate volumes (Gerlagh, 1998; Koukios and Diamantidis, 1999; Scharai-Rad et al, 1998; Diamantidis and Koukios, in preparation; de Feber and Gielen, in preparation; Scharai-Rad and Welling, in preparation).
22
Calculated on the basis of the food intake expressed in biomass energy units, multiplied by the 2 emission coefficient for oil (because the biomass could also be used to substitute oil). 23 The figure is a factor 10 higher if land use is considered, soy yields are 2 t/ha/yr vs. 20-30 t/ha.yr for energy crops. 24 Excluding approximately 100 Mt straw which is utilised for soil improvement.
173
Figure 9.2
General biomass model structure
USE
PRODUCTION
WASTE HANDLING ANAEROBIC DIGESTION
FOOD CROPS
PROCESSING
FOOD CONSUMPTION
ENERGY RECOVERY
RESIDUALS DISPOSAL AGRICULTURE
ENERGY CROPS/WOOD
ENERGY
ENERGY
CONVERSION
USE LANDFILL GAS RECOVERY
RESIDUALS
FORESTRY
MATERIALS CROPS/WOOD
MATERIALS
MATERIALS
ENERGY
PRODUCTION
USE
RECOVERY
RECYCLING/REUSE DISPOSAL
The main markets are covered: − heating, − electricity, − transportation fuels, − feedstocks for plastics, solvents, elastomeres, etc., − wood products for constructions and furniture, − pulp and paper, − dairy products, − meat (split into beef, pork, chicken, lamb and mutton and other), − cereal products (flour, beer, etc.), − oil products, − fruits and vegetables. The level of detail in this model is determined by the process characteristics. For example regarding biofuels, the market has been split into:
174
− Diesel substitutes: RapeseedMethylEster (RME), DiMethylEster (DME), diesel from HydroThermal Upgrading (HTU), diesel from biomass pyrolysis oil, diesel from algae; − Gasoline substitutes and additives: Methanol, Ethanol (95%), dehydrated Ethanol (99%), MethylTertiaryButylEster (MTBE), EthylTertiaryButylEster (ETBE). Similar detailed modelling has been applied for other market segments.
9.5
Scenario characteristics
Three scenarios have been analysed: 1. A global optimistic market oriented growth scenario, based on rapid development of an energy extensive economic service economy and strong reliance on technological development (GLOBAL). 2. More moderate economic development in a closed European economic block according to existing pathways, with heavy reliance on transportation and the building sector (EUROPE). 3. A sustainability scenario initiated by cultural shock, resulting in environmental reorientation of society (SUSTAIN). The characteristics of the scenarios are illustrated in Table 9.2. The first four variables have been selected because of their relevance from a biomass strategy point of view. The relevance of meat production is its high land requirements for production, either directly for grazing or for fodder production. Imports of fodder crops (i.e. soy) and changing paper demand are other variables that will influence the biomass availability. The last eight variables have been selected because of their high relevance for future emissions and emission reduction potentials.
175
Table 9.2
Scenario characteristics, 2030
Parameter Meat/fish consumption [Mt/yr] Import soy [Mt/yr] Paper demand [Mt/yr] Meat export [Mt/yr] GDP growth 1990-2030 [%/yr] Dematerialization [%/yr] Physical demand growth [%] Discount rate [%/yr] Fossil fuel price growth [%] Nuclear [EJ electricity] Cheap PV [Euro/kw peak] CO2 storage [Mt/year]
9.6
Globalisation 45 75 90 15 2.0 1.5 0.5 8.0 + 35 2.5 1100 500
Europe 45 30 90 -? 1.5 0.5 1.0 5.0 + 75 0 500 500
Sustain 38 0 65 0 0.5 0.5 0.0 3.0 +0 0 500 0
Results
Figure 9.3 shows the changes in agricultural land use which are induced by GHG penalties. The figure shows the land use in the reference year 1990 and for the 50 Euro/t CO2 ,100 Euro/t CO2 and 200 Euro/t CO2 penalty level for the three scenarios EUROPE, GLOBALISATION and SUSTAIN. In the 50 Euro/t scenario, the use of biomass crops is negligible, but some afforestation is introduced (based on a lower bound which represents current policy plans). Figure 9.3
Agricultural land use change with increasing GHG emission penalties, 2030
[Mha] 150
100 50
EU EU R R /T /T EU G LO R O B PE A LI 50 SA EU TI R O /T N SU ST A IN 10 10 0 0 EU EU R R /T /T EU G LO R O B PE A 10 L 0 IS EU A TI R O /T N SU ST A IN 20 20 0 0 EU EU R R /T /T EU G LO R O B PE A 20 L 0 IS EU A TI R O /T N SU ST A IN
50
50
B A SE
C A SE
0
PASTURE
OTHER
E+M CROPS
AFFORESTATION
Land use for energy crops is introduced in the 100 Euro/t scenario in the GLOBALISATION scenario and the SUSTAIN scenario. In the 200 Euro/t scenario, the land use for energy/ materials crops increases further in all three scenarios, but the most remarkable growth occurs with regard 176
to afforestation. Total land use for afforestation and energy crops ranges at this penalty level from 15 to 25 million hectares. The results show that the full land area is not yet used at lower, more realistic penalty levels. This suggests that land availability should be no major issue in the biomass strategy discussion: the costs are the main driving force. The preference for afforestation is a major difference with earlier modelling studies. The mechanism is elaborated in Annex 1. It can be explained by the fact that costs are considered in this study and that discounting is applied (an 8% discount rate). The cost issue and the time preference overrule the CO2 mitigation potential, resulting in a selection of cheaper afforestation strategies in favour of high yield energy crops. Figure 9.4 shows a subdivision of biomass use (both from forestry and from agriculture) in the EUROPE scenario into materials crops, energy crops and food and fodder crops. This subdivision is related to the biomass use. The figure shows the dominance of the food crops at all penalty levels. Both biomass use for materials and biomass use for energy show a significant growth between the base case (0 Euro/t CO2) and the 200 Euro/t penalty level. The division between these two categories is generally 2/3 energy crops and 1/3 materials crops. Total biomass use for energy and materials increases to more than 500 Mt, an increase by 60% compared to base case. Figure 9.4
Biomass use in de EUROPE scenario, 2030, increasing GHG penalties
1750 [Mt BIOMASS/YR]
1500 1250 FOOD/FODDER ENERGY MATERIALS
1000 750 500 250 0 0 EUR/t 20 EUR/t 50 EUR/t CO2 CO2 CO2
100 EUR/t CO2
200 EUR/t CO2
Energy applications are detailed in Figure 9.5 for the 100 Euro/t penalty case. The figure shows that the biomass use for energy applications is approximately 300 Mt in all three scenarios. Elec177
tricity production dominates (wood/electricity, lignine/CHP and waste energy recovery in Figure 9.5). Heat applications take a second place, followed by the production of transportation fuels (HTU oil and methanol). Total biomass use of 300 Mt represents approximately 4.5 EJ primary energy (compared to a total primary energy use of approximately 70 EJ in the base case in 2030). Figure 9.5
Biomass use for energy applications, penalty 100 Euro/t CO2, 2030 450
[Mt BIOMASSA/YR]
400 350 WASTE LIGNINE/CHP HTU OIL METHANOL WOOD/ELECTRICITY STRAW/WOOD HEAT
300 250 200 150 100 50
SU ST A IN
PE O R EU
G LO B A LI SA TI O N
0
Biomass use for materials is detailed in Figure 9.6. The total ranges from 160 to 180 Mt biomass (approx. half of the quantity of the biomass use for energy in Figure 9.6). The main application is for construction materials. Other applications are pulp production and the use of biomass as a feedstock in the chemical industry. There is not much difference between the scenarios, except that charcoal for iron production is introduced in the SUSTAIN scenario. The use as a chemical feedstocks accounts for the grow of biomass use for materials applications (when comparing base case and 200 Euro/t case).
178
Figure 9.6
[M t B IO M A S S /Y R ]
Biomass use for materials applications, 100 Euro/t CO2, 2030
200
150 C O N S T R U C T IO N M A T E R IA L S PU LP
100
FEED ST O C K S CHARCOAL
50
IN
E
A
P
T
O
S U S
U E
G
L
O
B
A
LI S
A
R
T
19
IO
90
N
0
The impact of the scenario assumptions on the Western European GHG emissions is illustrated in Figure 9.7. Emissions decrease significantly in all three scenarios, but the base case emission (without GHG penalties) is much higher in the EUROPE scenario (6000 vs. 4800 Mt CO2 equivalents). The figure suggests that a 200 Euro/t penalty is required for a 50% emission reduction (compared to the case without penalty). The total reduction in GHG emissions is the result of many interacting emission reduction measures. A comparison of a GLOBAL model run with and without bioenergy and biomaterials shows a difference of 300 Mt CO2 equivalents which can be allocated to agriculture and forestry.
179
Figure 9.7
Total GHG emissions in the three scenarios, 2030
[Mt CO2/YEAR] 6000 5000 4000
EUROPE GLOBALISATION SUSTAIN
3000 2000 1000 0 0 EUR/t 20 CO2 EUR/t CO2
Table 9.3
50 EUR/t CO2
100 EUR/t CO2
200 EUR/t CO2
Changing shadow prices (index, base case = 1 for positive prices and -1 for negative prices)
Beef meat Pork meat Dairy products Wheat Straw Wood chips Roundwood Sawn timber Chemical pulp Newsprint Waste paper Demolition wood
Base Case 1.00 1.00 1.00 1.00 1.00 1.00 1.00 1.00 1.00 1.00 -1.00 -1.00
20 Euro/t 1.03 1.01 1.01 1.02 1.00 1.02 1.09 1.07 1.04 1.06 -0.60 -0.60
50 Euro/t 1.07 1.09 1.02 1.04 1.00 1.04 1.07 1.11 1.02 1.16 0.00 0.00
100 Euro/t 1.15 1.07 1.07 1.14 1.00 1.48 1.07 1.20 1.02 1.26 0.25 0.25
200 Euro/t 1.35 1.19 1.41 0.61 3.19 2.65 1.74 1.57 1.26 1.65 3.48 3.48
The model calculations indicate that the price impacts of GHG policies can be substantial, both for agricultural products and for forestry products (see Table 9.2). The price increase is substantial for many agricultural and forestry products. This includes both food and fodder and energy and materials, because of the increasing land prices which affect both product categories. In the case waste, prices change from negative (the consumer has to pay to get rid of his waste) to positive (the consumer gets paid for his waste). Because of these price increases, trade patterns can 180
change, and some production may be relocated to other regions, resulting in increased emissions in these other regions. Such undesirable effects must be considered in the development of GHG policies as they may pose a serious barrier to the introduction of any pricing policy.
9.7
Conclusions
A number of biomass strategies exist to reduce GHG emissions: − Carbon storage above ground in new forests, − Carbon storage below ground in soils, − Carbon storage in wood materials and products, − substitution of energy carriers with biomass, − substitution of materials with biomass, − energy recovery from process waste and post-consumer waste. The model calculations indicate that most important strategy (from a CO2 emission mitigation point of view) is bioenergy, followed by biomaterials (especially feedstocks for chemicals) and afforestation (carbon storage). Carbon storage in products is of secondary importance. Increased use of existing forestry products (building materials and paper) is also of secondary importance. Energy recovery from waste biomass increases significantly, even in a situation without GHG policies. These changes are based on strong GHG policies (i.e. high penalty levels of more than 100 Euro/t), which are based on a combination of pricing policy instruments and strong emphasis in new R&D. The main growth in biomass use is based on new processes which have not yet been proven on a commercial scale: HTU biodiesel production, methanol in the transportation market, gasification technology and co-combustion in the electricity market, and new production routes for biochemicals. As a consequence of the dominance of technologies which have not yet been proven on a commercial scale, the results are sensitive with regard to the success of commercialisation of these technologies. These results differ to some extent from earlier modelling studies: there is less emphasis on bioenergy crops for electricity production, there is more emphasis on afforestation, biochemicals and transportation fuels. These differences can be explained for three main reasons: costs have been
181
considered and competing emission mitigation options have been considered on the basis of costeffectiveness. Finally discounting has been applied, which favours afforestation as a biomass strategy. Regarding the biomass supply side, considerable flexibility exists in the agricultural production and in forestry in order to increase the biomass production. Yields of almost all agricultural crops are forecast to increase significantly over the next decades. Moreover, the efficiency of the agricultural system can be enhanced, e.g. in the production of animal products. This results in 15-25 million hectares available for energy and materials crops. Forest regrowth exceeds removals considerably, which allows for increased roundwood production. Finally agricultural residues from the food chain can be used more extensively. Because of the ample supply situation, cascading of wood products is of secondary importance from a resource supply and GHG emission mitigation point of view. However the energy recovery from waste will increase substantially, driven by waste policies and technological improvements. The contribution of all biomass strategies together amounts up to 300 Mt CO2 equivalents, approximately 7% of the 1990 GHG emissions. This contribution is substantial, but the figure shows also that a combination with many other strategies is required in order to achieve a significant emission reduction.
182
183
ANNEX 1 Selection of biomass strategies: the impact of the discount rate and the MARKAL cost optimisation algorithm The selection of emission reduction strategies in MARKAL is based on least-cost system optimisation with endogenised environmental costs (on the basis of the emission permit price). This approach has consequences for the selection procedure. This will be elaborated for biomass by comparison of three strategies on the basis of agricultural biomass crops: − afforestation, − production of transportation fuels, − production of electricity. These three strategies are compared because the MARKAL-MATTER results show remarkable differences compared to other studies. While the model results show a preference for afforestation and to a limited extent the production of transportation fuels, earlier studies have advocated the production of electricity. The difference can be explained on the basis of the assumptions and the scope of the study. The following comparison is based on a time period of 50 years, the rotation time for afforestation in the model. It will focus on high yield crops in Middle Europe. The optimal use of 1 ha of land will be elaborated. Afforestation with poplar The assumptions are: Afforestation costs: 1000 Euro/ha Life plantation: 50 years Yield after 50 years: 450 t roundwood Annual carbon storage: 14 t CO2/ha/year (incl. soil and litter) Release after 50 years: 700 t CO2/ha/year Value roundwood: 190 Euro/t CO2 emission reduction roundwood use via methanol production: 0.073 t CO2/GJ methanol (0.8 t CO2/t wood)
184
Methanol production from miscanthus The assumptions are: Plantation and harvesting costs: 1000 Euro/ha/year Annual yield: 500 GJ/ha Efficiency methanol production: 62.5% Average biomass transportation costs to the methanol plant+storage costs: 2.5 Euro/GJ CO2 emission reduction: 0.073 t CO2/GJ methanol (substitution of gasoline) Methanol production costs: 6 Euro/GJ methanol (excluding investments) Methanol plant investment: 30 Euro/GJ methanol capacity/year Value methanol: 4.5 Euro/GJ (diesel/gasoline production cost) Electricity production from miscanthus The assumptions are: Plantation and harvesting costs: 1000 Euro/ha/year Annual yield: 500 GJ/ha Average biomass transportation + storage costs: 2.5 Euro/GJ Efficiency of electricity production from biomass: 50% CO2 emissions reference electricity production: 0.1 t/GJ in base year, 3 and 7% reduction per year over the next 50 years Electricity plant investment costs: 75 Euro/GJ electricity/year Value electricity: 12 Euro/GJ The CO2 emissions related to the reference electricity production depend on the competing emission mitigation strategies. MARKAL model results show a very significant emission reduction in the electricity sector if GHG emission mitigation strategies are introduced. Other strategies such as CHP, new high efficiency gas fired power plants, renewables such as wind energy, CO2 removal and underground storage, and nuclear energy will reduce the emissions in electricity production by a factor 10, if permit prices from 100 Euro/t upward are introduced. This emission reduction is accounted for through the 3% and 7% annual emission reduction in electricity production from the West European average level of 0.1 GJ/t (comparable to the emission for a gas based modern power plant without CHP).
185
The net present value (NPV) of the projects is calculated through the conversion of all costs and all revenues into Euros of the year of investment. This is basically the same comparison which is made in the MARKAL algorithm. First the GHG impact is illustrated in Figure 9.A1. The figure shows that the emission reduction per hectare for methanol production is significantly higher than the emission reduction for afforestation (1275 vs. 350 Mt CO2/ha). Figure 9.A1
Aggregated impact on CO2 emissions over a period of 50 years
Emission reduction [Mt CO2/ha]
1400 1200 1000 800 600 400 200 0 Afforestation
Figure 9.A2
Methanol
Electricity e=7%
Electricity e=3%
Net present value of different land use options for GHG emission mitigation as a function of the discount rate. Project time span 50 years. Emission permit price 200 Euro/t
180000 160000 NPV [EURO/ha]
140000 120000
Afforestation
100000
Methanol Electricity e=7%
80000
Electricity e=3%
60000 40000 20000 0 0
1
2
3
4
5
6
7
8
Discount rate [%]
186
9
10 11 12
The cost-efficiency of these projects is shown in Figure 9.A2 for an emission permit price of 200 Euro/t CO2. The figure shows that: − the NPV can vary a factor 8, depending on the discount rate 0-12%, − afforestation is the worst project at 0% discount rate, but the best project at 12% discount rate, − the most significant differences in NPV occur at low discount rates. At 0% discount rate, the NPV of the best project is 2.2 times the NPV of the worst project. At 12% discount rate, the NPV of the best project is 1.5 times the NPV of the best project, − the NPV of electricity production depends critically on the rate of emission reduction in the reference system (the competing technologies). The neglect of this change in other analyses is not correct and can result in wrong conclusions, − the 7% improvement rate is more in line with MARKAL results than the 3% improvement rate. As a consequence, electricity production has a lower NPV than the production of transportation fuels, − the selection of transportation fuels (methanol) in the MARKAL model calculations will increase at lower discount rates in favour of afforestation, − financial data must be considered in the selection of GHG emission mitigation effects, emission mitigation data alone are not sufficient, − the difference between the MARKAL results and other studies with regard to optimal biomass strategies can to a large extent be explained by two factors: the consideration of the changing GHG intensity of the reference electricity production (considering all competing emission mitigation strategies) and the selection of strategies on the basis of cost-effectiveness.
187
10.
BARRIERS: TECHNICAL OPTIONS AND INNOVATIONS
Peter Groenewegen and, Tessa Goverse; Free University Henk Moll; IVEM Marko Hekkert; Utrecht University
10.1
Introduction
In MATTER conditions (except costs and technical feasibility that are considered in the MARKAL model input data) that prevent introduction of technical CO2 reduction options are regarded as barriers. Knowledge on existing barriers for the introduction of technical options has used three different ways in the MATTER project. First, the sector studies on developments in transport, steel, packaging, construction etc. described elsewhere in this report served to control for the validity and restrictions to the data that served as input for the modelling effort. The choice was made to start with these studies in the same phase in which the data for the MARKAL input was collected, and described. The limitations to the options that served as input for the modelling have been taken into account with the limitations embedded in the data format. Second, in the project team a number of other possibilities have been discussed to give more systematic analysis of the conditions that would influence the deployment of groups of options within MATTER. The discussions were based on only one part of the innovation literature that deals with (groups of) innovations, their technical as well as social characteristics as the focal point. This choice neglects other innovations theories, such as purely economic models of technical change, theories on analysis of innovative firm behaviour as well as the evolutionary theory. A narrow focus is legitimate because the starting position for an analysis of barriers to the full deployment of options was from the start considered to focus on the outcomes of the modelling and not at the centre of the modelling exercise. (cf. ECN, 1998) Also to apply such theories would require a more systematic sampling of quite detailed information across the complete model input that deviates from the facts necessary for MARKAL. We acknowledge that this is a limitation both to the model and with regard to the discussion of barriers.
188
Third, within the VU PhD project, the attention has been directed at investigating barriers to technical change that should be taken into consideration with regard to policy measures to reduce greenhouse gases in relation to construction. The choice for this sector was made on the basis of two considerations (1) production of building materials and the use in construction are a significant sector; (2) innovation studies have focussed more on energy and transport so relatively little is known about the process of technical change in construction. The activities conducted within the framework of the MATTER project, fit in a model that leads to a distinction of hurdles for technical change at three levels of complexity. The first level is that of the options themselves. In MATTER a mixed strategy has been followed in order to deal with barriers at this level. Known restrictions to options are included in the model. Thus, for input data where expert opinion literature of sector studies suggested it various bounds have been used that limit a full deployment of a specific technical option (product or process) examples are introduction dates of new technologies, the possibility to use specific materials for one product etc. In addition exploratory work has been done on other ways to deal with barriers to the introduction of technical options. The second level concerns the concomitant changes that are required in the relations between actors. At the third level other elements of the socio-technical system, including the knowledge and R&D infrastructure and cultural or political factors are considered. However, implementing technical changes in the economy can hardly be assessed at the level of specific changes in technology. Some of the conditions, which have a strong impact on technological change, do not occur at the level of a singular technological option, but affect groups of options, their interrelations or their fit within a specific industry. We have grouped these conditions into a third level of investigation. Figure 10.1 schematically represents the three interrelated levels which can be studied to understand barriers and opportunities for the implementation of options.
189
Figure 10.1
Framework for technological change
Technical option
Configuration of networks
Sectoral innovation systems
The discussion of barriers is divided into four sections: − adjustment of model input, − relevant theories about technical change, − ordering of technical change, − connections between options and broader technical development in the construction industry.
10.2
Adjustment of model input
Within the MARKAL model the following elements deal explicitly with barriers to technical change that can be handled within the model itself: learning effects and limits based on technical and economic possibilities (introduction dates etc.). Consideration of these barriers has been based on the sector studies and additional information where appropriate. Some examples of processes where introduction dates play an important role are displayed in Table 9.1. The table contains four processes modelled as technical options in MARKAL and the type of bound for each that has been incorporated in the model.
190
Table 10.1
Examples of bounds in MARKAL
Nr. MARKAL Process
Description
1
IGB Corex
Steel production with
2
IGC CCF
3
IGS BOF
4
IUD
Type of bound
Source
Introduction date: 50% Described in [Daniels in 2010; full availability and Moll 1998,Gielen in 2020 1999] Steel production Available after 2010 full Described in [Daniels availability 2030 and Moll 1998,Gielen 1999] Steel production Restriction of exit from traditional blast furnace production: residual capacity from 100% in 1990 to 50% in 2000 High strength concrete Bound on capacity [Gielen, 1997] cement available from 2000 full capacity 2030
The main choices to put bounds on data have to do with the implausibility of certain availability figures. Thus when a specific process is currently not yet deployed at full scale, it is not to be expected that a switch to such a process can occur in the short term. (examples 1,2 and 4) In those cases the upperbound on the process or material expresses this information. Also in some cases the local availability of raw materials limits production volumes. Lastly, for installed production capacity it can be expected that complete withdrawal from production of expensive installations will require a considerable period, because withdrawing such capacity within a very short period would be destruction of invested capital (example 3).
10.3
Theories of technical change
Analysis of barriers in MATTER is located in a framework derived from theories of technical change. These have an economic and sociological background with an emphasis on explaining change patterns, innovation and the role of social actors in these processes. The group of theories that is used (innovation theory) is relevant because of the relation between the barriers in achieving policy goals and established insights on the implementation process. Technical change is a continuous process; it also occurs when policy does not intervene. Therefore technical dynamics in themselves are interesting phenomena to take into account. While optimisation of the application of technical options on technical and economic merits is at the core of the model there is sufficient evidence that other factors than cost and efficiency play an important and sometimes determining role. Thus additional studies are required to determine whether new technological options are deployed or ‘older’ technologies are optimised. A conclusion on the likelihood of the in191
troduction of new technology requires more careful consideration of groups of technical options in the industrial and economic context. Such attention is warranted, also on theoretical grounds technical changes have been analysed as being explainable only to a limited extent by rational (classical) economic theory. Therefore we expanded our analysis beyond attempts to improve the rational economic model, which forms the basis of MARKAL. Existing theory can be grouped around three relevant subjects: typologies of innovation, the role of networks and sector developments. First, the central element consists of a change in technology (in MATTER these are process or product innovations, as service and organisational innovation are not included in the input of MARKAL). In addition to the description of the technical artefact, also the additional (technical) requirements are considered that need to be fulfilled for the technology to function. The combination of these factors can lead to the conclusion that an innovation is only possible in combination with changes outside the core change (Clark and Staunton, 1989). Second, technological change takes place in the wider context of acceptance of technology in the community of users. In our systems this will be mainly an interaction between different industrial organisations. It has been substantiated by studies in many different sectors that in such situations the technology diffusion requires a considerable active involvement of user and supplier firms (networks). Third, the innovation and its acceptance is embedded in sector dynamics that encompass aspects such as the relevant scale of the industry (regional, national or international), and the manner in which it is framed by national regulations and cultural preferences.
10.3.1 Innovation typology The success of implementing technologies depends on both the characteristics of the technology in terms of technical and economic factors - and the effect of it on the social organisation of production. (Teece, 1986). The major assumption in the analysis of barriers to technical options is that what at first glance appears, as a change in technique or materials only, also requires social and economic adjustments that not all can be reduced to either technical or cost differences. The typology presented in this section is based on an approach in which the character of the change in technology (technical option) is linked to the manner in which further implementation is perceived. We employ five concepts from the literature about innovation and technical change: incremental, radical, architectural, modular and system innovations (Henderson & Clark,
192
1990;Tushman and Anderson, 1986)025.These concepts are applied for analysing the socioeconomic characteristics of innovations, which would group the innovations in categories that are meaningful for different measures of materials and technology policy. In order to do this the differences in innovation characteristics are related to changes in the organisation of production and use processes. The two dimensions for technical change that can be distinguished in the literature are: a. the compatibility of the technical changes with the existing situation; to which incremental and radical are extremes on one axis. b. the amount of reconfiguration an innovation requires of other network components and in socio-economic processes. The first dimension is defined as the degree of change of the skills, expertise, organisations and firms involved in applying the technology. It is for instance quite difficult to apply any given technique without prior experience in using it or producing with it. Thus for a manufacturer of steel components for the car industry it requires hiring new personnel with prior experience or education or considerable learning of the current workforce to switch to manufacturing of plastic as basic material. In part these changes can be related to cost differences capital outlay etc. However, in any given situation considerable uncertainty with regard to costs of change remains. The second dimension concerns the change in relational structure around an innovation. For example, a shift from combustion powered to electrical vehicles requires in addition to the new engine components, also changes in fuel supply and in repair facilities. The major technical and socio-economic elements of the each type of innovation will be discussed below. Incremental & radical innovation Incremental innovations are technical changes that can be regarded as a refinement of previous technology. Continuous improvement of the technology on relevant technical aspects is a central 0 25
Recently Christensen has applied a different concept, which relates to the type of change that affects the firms that have to use the technology. He calls in this case incremental changes either disruptive or not depending on how the technology is deployed by existing firms and new comers. He shows that new technologies that underperform existing technologies still can effect the competitive position of existing firms. New entrants seek and are able to exploit new customers.
193
element of technological development. Incremental innovations are based upon experience and knowledge in the existing production and use system. In social and economic terms this leads to an entrenchment of ongoing tendencies in terms of relevant actors, their relations and skills required. In other words, the technological focal organisation (firm or firms that produce a product or use a process) and its relations with other organisations, basically remains the same. Typical incremental changes are those where technical improvement leads to greater production capacity by process change. Radical innovations on the contrary introduce changes that dramatically divert from the existing situation. The key technical requirements or firm capabilities change and the use of the new technology potentially affect both suppliers and users. Previous linkages and interactions may become irrelevant. Radical or altering innovations may be recognised by a new set of engineering and scientific principles and may create new businesses and destroy or transform existing ones by delivering dramatically better product performance or lower production costs. One well-known historical example is the introduction of float glass process by Pilkington. (Freeman and Soete, 1992) The experience and production facilities of the other glass producers became outdated immediately. Modular, architectural and system innovation A different distinction between innovations can be made in terms of the impact of the innovation on product components and the linkages between product components (the product architecture) (Henderson & Clark, 1990). This distinction is an important addition to the existing classification in incremental and radical innovations, because it explains why even minor technical changes sometimes do have a destroying effect on the ability of established firms to follow the innovation pattern. It also can be used as a first approximation of the social embeddedness of a technology. Modular innovation significantly changes the technological concept within a component. However, it only changes the elements (or modules) that constitute a product, whereas the linkage pattern between actors inside the firm or outside remains unchanged. Such changes still might be radical. An architectural innovation, however, changes the pattern of linkages between product components without changing its components. It demands major involvement, change and modification of the set of interacting components and systems, and the actors associated. Architectural innova194
tions destroy the usefulness of relational knowledge of established firms. Architectural changes reveal that the knowledge base is to a degree tacit. Because especially the tacit knowledge structures are embedded within the enterprise, established firms can have major difficulties in adapting architectural innovations. Henderson and Clark (1990) provide the example of the replacement of normal steel engine hoods by high-strength-low-alloy ones. The new material required redesign of joining and other elements of car construction before it could be applied properly. System innovations integrate multiple independent innovations that must work together to perform new functions or improve the facility performance as a whole. So it involves many changes at the same time. The innovations are explicitly linked together and require simultaneous action of many different actors. Such changes are best understood by attention to dynamics of networks.
10.3.2 The role of networks Technological change does not exist in isolation but is produced in a social and economic context around the innovation, therefore we introduce the role of networks. There are at least two elements that require attention. First, successful innovation requires a process of cooperation in all phases of the process. New products or processes need to be adopted by users of the technology. Such adoption is not always straightforward and sometimes considerable further development of the product or process (including changes in technical specifications) is needed for successful diffusion. Thus innovation occurs in a configuration where the producer and the consumer are both important (Von Hippel, 1988). Changes in the technical characteristics, even if they are minor from a purely functional point they still need to be changed quite often in other stages of the development process for complete acceptation by users.(Leonard-Barton, 1995) Also in the materials-product linkage, car production is an example, close cooperation in R&D between material users and producers is common. Attention to changes required by supportive actors is necessary. Sometimes such as the introduction of new fuels such actors need to invest considerable sums to accommodate their production to the new products. Including other relations into the picture nearly automatically lead to descriptions of innovations taking place in a network of actors (for an early example see Håkanson, 1989). This connects well to the role attributed to social networks with regard to the rate of adoption in the diffusion tradition. Rogers (1995) states that there are five attributes of innovation that are relevant to other actors: relative advantage (degree to which an innovation is perceived as a better idea than its supersedes); compatibility (the degree to which it is perceived as being consistent with the existing values, past experiences and needs of potential 195
adopters); complexity (degree to which it is perceived as difficult to understand and use); triability (degree to which an innovation may be experimented with on a limited basis) and observability (degree to which the results of an innovation are visible to others). The position of innovations can be assessed in network terms by inquiring what the actors are that are involved and also which actors may perceive the attributes of an innovation favourably compared to other technologies. The complexity of the introduction of most new technologies requires a broader set of actors to be included in the analysis. Some of the insights are relatively easy to derive when detailed information of a sector is available. However the challenge to evaluate changes in the (near) future benefits from conducting a broader analysis of innovation patterns at the sector level.
10.3.3 Sector developments and innovation The literature on technical change at the system level has concentrated on national innovation systems as well as what has been called ‘technical systems’. In the evolution of what we can call a family of theoretical frameworks, Breschi and Malerba recently introduced the concept of sectoral innovation systems (Breschi and Malerba, 1997). For national innovation systems, the geographical and political boundaries are taken as a starting point. In the national system of innovation the composition of variables that influence the innovation and diffusion of innovations is analysed. A wide variety of factors are used, examples are firms, university system, professional bodies, public research institutes and government. The boundaries around national systems of innovation are related to the question of national political influences on innovation and technology development. In the technical systems approach attention is paid to the actual networks of actors involved in particular innovations and technology development. One definition of technical systems is ‘ a network of agents interacting in a specific economic/industrial area under a particular institutional infrastructure.’ (Carlsson and Stankiewicz, 1991) Sectoral innovation systems take into account the large differences between industries. It is defined as a group (or system) of firms active in developing and making a sector’s product and in generating and utilising a sector’s technologies. (Breschi and Malerba, 1997: 131) There are two mechanisms that provide coherence in a sector. The first mechanism consists of the web of relations between the actors (also related to the networks discussed above in 2.2.) involved. The second consists of the pattern of competition between products, processes in markets that fulfil a specific need. The boundaries around such a sectoral innovation are determined by these two processes and are not necessarily subsumed under national systems of innovation. An example of a sectoral innovation system that cross cuts na196
tional boundaries is the chemical industry. In that sector production is dominated by a small number of global firms that develop new processes in cooperation with a small number of large engineering and construction firms. In contrast the production of paper is organised completely different; the paper industry shows local clusters where innovation takes place. Thus for various sectors the particular combinations of factors that affect innovative behaviour, adoption and diffusion can be specified but the results will vary with regard to the degree to which cultural, national and institutional factors shape it. Not all lessons learned from one sector can be applied to the next automatically. Pavitt for instance shows large differences in innovative activity between industry classes with different SIC codes. (Pavitt, 1984) The strategic innovative behaviour of firms is to some extent idiosyncratic as well, however we suggest that innovation system related factors force companies within a single industry to converge to similar patterns of innovation. (Edquist, 1997) Therefore, specific ideas about what the adoption potential might be can be supported, by empirical investigation of the history of national and sectoral aspects such as the relations between actors and analysis of trends and data patterns within one sector. A focus on sectors does not imply that the regularities at according to other principles are irrelevant. However, the main argument is that regularities make sense because innovation patterns, innovative behaviour, choice of technical criteria and adoption and diffusion processes are highly specific for individual industries.
10.3.4 Conclusion The brief summary given here leads to attention to three different levels at which theories about technical change may help in assessing options. The first level is an estimate of the degree of change a technical option exhibits. This level is sufficient for an ordering of options. A second level is an attempt to identify systematically the viability of an innovation within its narrowly defined socio-economic environment. By a simple analysis of the composition of the networks involved in a particular innovation, the degree of change in the network is interpreted as a barrier. This approach has been systematically applied in MATTER on consistent sets of options, for instance in packaging and construction. (Hekkert, 1999 and Hekkert, Goverse and Groenewegen, 2000) The third level is the level of (sectoral) innovation systems. This third level of analysis of the embeddedness of technology also relates to the need for additional macro level policies to overcome barriers for the introduction of GHG favourable options. The coherence of innovation practices, the type of actors involved an the possibility to have an overall picture of technical 197
trends makes it possible to assess the divergence between dynamics of technical change and the policy demands.
10.4
Implementation characteristics of options
Technical options have been judged with regard to the degree with which the changes can be related to innovation characteristics in the three categories. Extensive judging of all 750 processes and products involved has not been attempted. Instead of a comprehensive approach that would lead to uneven results, the sector studies were used to assess barriers ex ante in a variety of manners. These approaches show both different ways to assess ‘realistic’ reduction potentials as well as that they take into account a more detailed analysis of the sector. The conclusion may be reached either through following the quick scan or by detailed knowledge of the sector. In MATTER both pathways have been explored and can be used in future studies. Such comments however proved to be rather difficult to quantify in relation to a dynamic model.
10.4.1 Socio-economic characterisation of technological options: the quick-scan In MATTER the theoretical insights were used in one project broad effort to test the potential of various levels. For this purpose options can be classified as being more important to analyse at the level of sectors, requiring more information gathering, by a combination of scoring the most important level of change c.f. type of innovation, network of sector. The principle outlines in the following table (Table 10.2.) is used. Table 10.2
Outline of the basic elements in the quick-scan method
Option Level I) Innovation type II) Networks III) Sector level changes
Elements considered Incremental, radical vs. modular or architectural User-supplier involvement, role of other network actors Relevance and the broader context
Importance
In the proposed method all options can be judged on the basis of the sectoral and option knowledge that already is necessary in order to complete the input data for the modelling effort. For each level it can be determined whether attaching a weight to that level requires more information. For instance, 1 means that the essential information is included in the model, 5 that attention to this level would benefit both modelling and interpretation of the policy measures. Dependent on
198
lack of information or the strategic character of the option (or option groups) more detailed studies can be conducted around products, or process categories of options or in sectors. Outcomes of a quick scan of the technical options may lead to conclusions at two levels. First, conclusions with regard to the potential adoption barriers of the individual option. If a broad range of options is included in an extensive quick scan, relevant factors and points of attention for policy may be derived. Second, indication can be given at which level a further analysis of a specific sub set of options needs further study. On the basis of a limited quick scan three further exercises were done within the MATTER project that show the potential applications of this methods of grouping options. Supply curve: grouping of technologies according to ease of implementation op packaging options (level I) In energy efficiency studies, improvement measures are often evaluated by means of a supply curve. The supply curve depicts the individual improvement measures ordered by costeffectiveness. The measures with the lowest costs per ton CO2 saved are depicted first. The CO2 reduction potential and the costs per ton CO2 saved of the individual measures are calculated assuming a certain order of implementation, e.g. first end use measures and then measures influencing energy conversion (De Beer et al., 1994). Choices about the order of implementation are important because measures can influence the potential savings of each other, or even prevent the each other's application. The order of implementation is not shown in the supply curve as it shows the measures in order of cost-effectiveness; this shortcoming of the supply curve is often criticised. In relation to an assessment of barriers a different approach can be developed. In an application in the packaging sector the supply curve is drawn according to implementation difficulty (Hekkert et al. 1999). The reason for this choice is that the potential of 'easy to implement' options becomes visible apart from options that are more difficult to implement. For a first estimate 275 cases of changes in packaging technology were studied that were implemented in The Netherlands in the period 1992 - 1996. A vast majority of these cases (215 cases) involved small changes in the packaging system, e.g. thinner materials, removal of unnecessary material, increase of packed volume, etc. About 40 cases involved larger changes in the packaging system, e.g. use of recycled materials and material substitution. About 20 cases involved even more substantial changes in the packaging system. A typical example of a large change in the packaging
199
system is the introduction of reusable packaging, which involves new infrastructure as well as several new activities like collection and cleaning. Based on these cases a first assessment of the difficulty of implementation by is possible by assuming that the most critical factor that determines the difficulty of implementation is the required change in the entire packaging system. This means that measures that change only a small part of the packaging system are relatively easy to implement and factors that result in changes in the whole system are more difficult to implement. The number of life cycle stages that need to adapt to the improved package is the indicator used for the size of change in the packaging system. The measures with low implementation difficulty are implemented first and measures with high implementation difficulty are implemented later. When more than one measure within the same category can be taken to improve a reference package, implementation is based on costeffectiveness of the measures (Hekkert, 1999). Focusing on relevant actors (level II) Instead of trying to classify the options with a standard method suggesting a degree of difficulty, the analysis of networks surrounding a technology can help to identify crucial actors and the manner in which they interact. Difficulty of implementation can be related to the groups involved in its diffusion. In Gielen (1997) this application is described in relation to options in the building sector. Applications are require a considerable additional research effort to validate. Still it is certainly a viable approach in order to show in a quick way the relevant groups to approach. Such groups can than be included in more detailed discussions about potential policy measures that could support diffusion of the options. Innovation characterisation embedded in a sector analysis (level I en II, III) Hekkert et al (Hekkert, Goverse, Groenewegen, 2000) apply the innovation concepts of levels I and II incremental, radical, architectural, modular and system innovations to a couple of options for increasing the application of wood in construction. More wood in existing applications At the moment, the use of wood in Dutch buildings is limited to specific products such as roofing, doors and window frames. The reason for the relatively small wood use in the Dutch construction 200
sector is that the building sector traditionally focuses on other building materials like bricks and concrete. The wooden floor, which used to be common in Dutch house building at the beginning of last century, has largely disappeared from the stage. Instead the market share of prefab concrete floors became extremely high in Dutch residential buildings (80-85%). The residual market of 15-20% is practically not suitable for prefab concrete e.g. wooden floors in wood frame building (SBR, 1993). This means that wooden floors have almost completely disappeared in traditional residential building. The re-diffusion of wooden floors to the traditional segment would imply a reversal of a trend. This in itself is hard, because of competition from the now well-established supply structure for concrete floors. There are only a few companies specialised in wooden floors left in the Netherlands, and, in contrast to the timber floor industry, the 35 prefab concrete floor suppliers are well organised; almost 90% of the producing companies are member of the industry association for concrete flooring, a daughter of the Dutch precast concrete industry association. Other companies of the concrete industry also provide supply. In building the return of the wooden storey floor is well possible (in building construction terms). Wooden floors will not affect the other building components. However, together with the application of wooden floors, the knowledge of wood technology for flooring has gradually disappeared. Students are no longer educated in different materials as they in practice immediately enter a concrete building tradition. From the above we conclude that the substitution of concrete floors by wooden floors seems a modular (it involves only a part of the building concept), but radical innovation. To compete with other materials (substitution), the performances of wood applications must be enhanced and cost levels must be competitive. In a way this can be described as a re-diffusion of wood. Wood use in many applications is traditional practice in decline. In structural terms not in all cases discussed large changes are required, but to reverse a trend the available expertise and the interests of building organisations need to be re-focused on wood. It would also require numerous (small) improvements in existing practices and materials. Modular innovations come from the actors involved in that specific module, in our case the wood supply industry serving the construction market. Incremental innovations are based on existing 201
technologies and ongoing technological trajectories. The most important actors for innovation are therefore the existing manufacturers of wooden building components. Radical innovation on the other hand tends to be induced by newcomers on the market. The three examples discussed above suggests a way to conduct qualitative analysis at a more detailed level of groups of options at the level where the actors are combined in groupings on which policymakers can act. These implementation analyses has been shown by various efforts within MATTER can best be done on the basis of sector analysis.
10.5
Sector analysis of barriers
In the various sector analyses that were conducted in conjunction with data input for the MATTER model and that went beyond simple data delivery, attention to barriers has been directed in a variety of approaches. This choice has been made based on the strength of the research groups involved. In the previous chapters of this report a number of these sectoral analysis were presented on steel, packaging, construction and petrochemicals. In this chapter we will illustrate the barrier focused analysis on a summary of the extended study of innovation in materials in construction and a briefer summary of technical change in transport. Transport as example The transport system (passenger and freight) contributes about a quarter to total energy consumption and CO2 emissions. This figure comprises direct energy use and emissions during driving as well as the indirect energy consumption and emissions related to vehicle production and maintenance, and to infrastructure construction and maintenance. The indirect segment of the impacts of the transportation system is largely determined by materials use. The following exemplary strategies reduce the energy requirements and the related CO2 emissions of transport (Bouwman and Moll 1998): − increased efficiency of vehicle driving (expressed in units per vehicle kilometre), − fuel substitution, − behavioural and organisational change resulting in a reduced demand for personal mobility and freight transport.
202
Options based on the first two strategies have been defined for the MARKAL model and are elaborated here. Efficiency increase of vehicle performance The automotive producers are continuously trying to increase the performance of passenger cars and freight transport vehicles. Depending on public and political awareness of energy and environmental issues, innovation in this sector includes attention to an increase of the energy efficiency and reduction of the environmental impacts of transport. Many options are still available for a further increase in the environmental performance of vehicles (Ybema et al, 1995; Bouwman and Moll 1997a), including: − improved internal combustion engine (direct injection, lean-burn, electronic engine control, turbo-charging etc.), − improved aerodynamics and tyres, − modified vehicle frame (space frame, lightweight materials). The effects of the first two types of technological options on materials flow are unremarkable. The indirect energy use of transport may even increase slightly due to specific materials and technology (e.g. for electronics) that are required for the implementation of such options. The introduction of modified and/or lightweight frames would have a substantial impact on the materials production system and may affect significantly the indirect energy requirement and emissions for the production of cars. Dynamic lifecycle calculations (Bouwman and Moll 1997b) have demonstrated that lightweight strategies based on aluminium produce better results than strategies based on polymers as regards the reduction of lifecycle energy consumption by cars. The effects for the aluminium producers are very substantial: a 50% increase of the aluminium demand, and in the longer term, a doubling of the supply of secondary aluminium to be recycled. In addition the shift from direct energy consumption to indirect energy consumption in the aluminium-based strategy, would be considerable. The effects of aluminium on the CO2 emissions depend on developments in the electricity production sector. Fuel substitution The MATTER-project is considering a variety of fuel substitution options, aiming at reduction of the CO2 emissions: 203
− alternative liquid fuels such as methanol and ethanol for combustion engines, − electric vehicles driven by electricity stored in batteries, − vehicles driven by electricity produced by (hydrogen) fuel cells. The first type of substitution can be relatively simply introduced into the current infrastructure of fuel delivery to road vehicles. As regards energy efficiency however, these types of fuel offer only marginal advantages. The major environmental advantage of this option is the opportunity to introduce energy from biomass into the transport sector. Biomass is by nature a no-net-emitter of CO2. The production and conversion processes for biomass-based fuels require an amount of fossil inputs. If the fossil energy requirements are relatively low, a substantial reduction of CO2 emission could be obtained by introduction of these alternatives. The second and third options would result in substantial energy efficiency increases within the vehicles. The system efficiency of these options depends on two factors. One is the sources of electricity and hydrogen and the efficiency and emissions related to the production of these energy sources; the other is the infrastructure required for the delivery of these energy sources to the engines in the vehicles. For instance from a CO2 reduction perspective electricity and hydrogen production by photovoltaic cells are favourable options. Delivery of each of these carriers an alternative infrastructure has to be developed. Also in the vehicles itself heavy batteries or heavy hydrogen containers must be installed. Especially the required instalments in the vehicles will raise substantially the vehicle weight and the energy requirements for vehicle production. The effects on material consumption and for the material producers are equally considerable. The role of actors in effecting technical change in the transport system It is highly relevant to consider the position of the actors in the transport system with regard to the options discussed. In this analysis we consider as two main actors, the car producers and the fuel delivery sector, the other actors being treated implicitly. Car producers are accustomed to a gradual increase in the efficiency of vehicles (expressed in kilometres per litre) especially when they feel a public or political incentive in this direction. The option of ‘modified frame’ would raise more problems, because of the required changes in production technology and supply relations. The sector is also experiencing negative responses from their customers to the idea of weight reduction because of its association with loss of safety and comfort. 204
Though the introduction of alternative liquid fuels does not raise many problems for the car producers, they do fear the introduction of other energy sources on three grounds: they do not have control over the crucial technologies (batteries and fuel cells); there is as yet no infrastructure to deliver these energy sources to vehicles; and the functionality of the vehicles - as perceived by the customers - may decrease due to the use of these energy sources (driving range, acceleration etc.). The fuel delivery sector (currently the oil companies) only plays an important role with regard to the second set of options. While the introduction of alternative liquid fuels will not raise substantial problems, delivery of electricity and/or hydrogen will require substantial changes in production and infrastructure. Hydrogen production could be more easily integrated into the oil companies’ production processes than electricity production. This means that the long-term opportunities for hydrogen fuelled cars are more favourable than those for electric cars. It is important to realise that for some options only one actor would have to take the lead after which the others could follow easily, while for other options both actors would have to change together simultaneously. In these cases (i.e. the electric car and the fuel cell based car) a deadlock situation is probable.
10.6
Construction as extended example of a sector analysis of technical change
A comprehensive study of the construction sector26 was chosen for a number of reasons, the most important is that it contains a sizeable part of the MATTER model. The construction sector (building and infrastructure) includes important product groups from a CO2 emission point of view. For instance, materials like cement and tropical hardwood represent significant CO2 emissions and these materials are predominantly applied within the construction sector. A second reason for focusing more deeply on the construction sector is that the technical dynamics of this sector clearly deviates from other parts of the model. In the innovation literature not a lot of attention has been directed at this sector as yet, so more research was needed to clarify technology development in building materials.
26
Goverse, T., (forthcoming)
205
The central question in the study is to identify institutional barriers to implementation of changes in materials use in the European construction industry. ‘Changes in materials use’ are interpreted as innovations in building materials. The sectoral innovation system approach is used to analyse relevant conditions (barriers and chances) for building materials innovation. However, building practices in Europe vary widely, so generic measures for implementing CO2 optimal materials options are quite difficult. Therefore, the study included case studies in four different European countries. This section gives a brief overview of characteristics of the construction sector. We discuss barriers to implementation of CO2 optimal options for the building sector as a result of the specific characteristics of the European construction industry. The sector analysis of the construction industry starts with an overview of characteristics of sectoral innovation in construction, followed by a description of technical systems and pointing out the influence of national boundaries. Than some examples of CO2 improvement options in construction and their specific implementation problems will be given. The section concludes with a discussion of the results.
10.6.1 Sector innovation Options for CO2 reduction in the construction sector have to deal with a very differentiated sector. The group of firms in construction developing and making the building products consists of many small and heterogeneous companies. E.g. 97% of the European construction enterprises are small and medium sized firms, with less than 20 employees (DGIII 1996). The fragmentation of the construction sector is further increased by the rather strong distinction between the design and the realisation stage of the building process. Concerning the generation and utilisation of the sector’s technology, many firms specialise in one technology or a small group of related technologies. Technology development is mainly in the field of better construction methods and the manufacture of construction products. But the need to maintain and repair existing buildings makes that the industry needs to retain the old technologies as well. Technology development in this sector tends to be conservative and is local in character. Coherency in a sector seems to be important for successful implementation of changes in materials use. In all European countries, however, markets for contractors are local or regional with a few national firms and even fewer international firms. Co-operation is based on contracts to avoid 206
risks and the webs of relations between actors are mainly local configurations. This industry organisation reflects the demand structure of the building sector; the regional differences in specific building styles ask for different specialists.
10.6.2 Technological systems in construction The technological systems underlying technology development consist of networks of actors. Besides the construction industry, the supplying industries and the government play an important role in technology development. Research has shown that the majority of innovations in construction are developed by or in co-operation with the supplying industry (Pries, 1995). Suppliers of materials play an important role in technology development in building materials. The way the materials industries (strategically) interact with the construction industry differs however. For instance, the supply of ready mixed concrete consists of on-site delivery of the produced material on the building site, whereas steel frame building refers to subcontracting of steel construction firms to prefabricate and erect a building structure. Technology development takes place in conjunction with suppliers and building actors. For steel frame building the interaction with the construction engineer is essential, whereas important developments in building systems for concrete, like tunnelling, are developed in close co-operation with the contractors and equipment suppliers. Since much of the research in the construction sector is paid for by the government, technological knowledge is easy accessible and open to the public. This makes it hard to protect knowledge and patent innovations. As a result one of the well-known incentives to innovate (patenting) is to some extent lacking in construction. Technology development can be characterised as slow and incremental. According to the theory on industry life cycles (Klepper,1997) technological innovation is subjected to a cyclical character. Whereas most industries shows innovation cycles from less than one year up to 10 years, the long waves in technological changes in the construction industry shows periods of decades (Grübler, 1997) New developments are based on ongoing tendencies and knowledge and experiences existing within the technological system. Since construction practices tend to be conservative, barriers for implementing CO2 improvement options are related to tradition in existing building practice. 207
10.6.3 National influence on innovation & technology development Tradition in building practices for constructing works varies among the EU countries. Factors from outside the sector that create these distinct local construction industries are (industry) policies, regulations and market conditions, but also geographical circumstances and climate. For building materials innovation, the availability of resources also seems to play an important role. Within the building sector itself, national building practices can be explained from differences in building organisation, different building styles, standards and design criteria, as well as the relation between the building and the supplying industry, and the nature of the materials used. Although not always tangible for any form of policy intervention, the existence of such factors is conditional for the success of implementation (Goverse, 1998)
10.6.4 Implementing CO2 options in construction: three examples Three important emission reduction strategies are: − increased efficiency of materials use, − design for reuse, − substitution of materials and products. Three cases illustrate these strategies for the construction sector: the introduction of high strength concrete to increase efficiency of materials use, design for reuse in buildings, and the substitution of concrete/brick buildings with wood frame buildings. High strength concrete Several strategies have been developed that can increase the strength of concrete. High strength concrete reduces the concrete and the steel reinforcement demand. Both reductions can decrease the future carbondioxide emissions in relation to reinforced concrete. Originally, high strength concrete has been developed for offshore platforms and high-rise buildings. In recent years, its application is gradually moving into the more conventional concrete market segments. High strength concrete is an innovation that has effect on both the concrete production and the building process. Potential barriers for increased implementation of high strength
208
concrete in the building industry are located at the concrete industry and in the building industry. They are summarised below: − Technology is not yet fully optimised. Both concrete producers and builders hesitate to switch towards the production and use of high strength concrete. The building sector, that heavily relies on tradition and experience and that shows risk avoiding behaviour, is a difficult sector for new materials. Clarity about the behaviour of a new product seems to be a prerequisite for large-scale implementation, and the current demand for the material is low. − Application of high strength concrete changes the building cycle, thereby affecting the planning and organisation of the building process. − In the traditional model of the building organisation, a gap exists between design and construct. Interaction between the concrete supplier and the building process occurs mainly at the building site. Decisions for using high strength concrete, however, need to be made early in the building process, during the design stage in order to profit from the beneficial characteristics of high strength concrete. − Building regulations are adjusted to existing methods and general used materials types. This creates barriers for the application of new materials, such as high strength concrete. Apart from the beneficial effects on CO2 emission reduction, there is no strong demand for high strength concrete in the regular building market. Although even in normal mortar higher strength classes are available, still the lower classes are most commonly used. It appears that the use of high strength concrete will remain restricted to particular niche markets, such as high rise buildings and bridges, as long as there are no reasons to change existing building practices and barriers exist for new materials such as those within building regulation. Design for reuse The building preferences of clients change over time: the changing composition of the population in Europe will increase the demand for single-households and elderly-houses in the next decades, whereas the increasing role of information and communication technology (ICT) put new requirement on office buildings. Such developments in the society combined with the inflexibility of buildings to adapt cause an increase in demolition activities and abolition of buildings before the end of their technical life. Design for reuse is a concept that anticipates on the changing requirement of building and the early demolition of buildings. Reuse of building parts not only indirectly prevent green house gas emissions by saving production related CO2 emissions but also provides an answer to the (increasing) construction and demolition waste (CDW) problem. The 209
Dutch government directs its policies at the moment on the so-called IDF-concept of innovative, disassembly and flexible building. However, similar efforts in the past, like modular industrial building (Russel,1981), have shown a number of barriers related to such concepts aiming at design for reuse. − In the design stage explicit choices should be made about the use of particular materials product and building methods. These decisions should not be changed during the building process, therefore close interaction between design and construct stages are needed. However, in the present situation a rather strong distinction exists between the design stage and the realisation stage in the building process. − Design for reuse asks for prefabrication, thereby shifting responsibility form the building sector towards the materials supplying sectors. This conflicts with the existing distribution of responsibilities in the building process which are now mainly in the hands of the actors in the building process (the client, the architect and main contractor). − New ways of fixing and fitting of building parts are needed to ease deconstruction, as well as better demolition methods. − Successful, widely adopted building methods, such as casting reinforced concrete are unsuitable for design for reuse. An exception is ‘reuse in the work’: stripping a building and reconstructing it at the same place using the old structural work. − During the design stage, incentives to put extra efforts in the design to enable future reuse are lacking. The time-span between the design stage and the actual reuse of a building part is long. There are no guarantees that indeed a market will develop for such reusable building parts. − So far, the driving forces for developments in building technology have been predominantly safety and durability. Design for reuse therefore requires a shift of focus of the complete building industry and the underlying knowledge infrastructure (education, R&D). The relevance of these potential barriers for a ‘design for reuse’ strategy can be illustrated by the fact that only a few example are known in which indeed building parts of an old building are reused in new building projects. There is a lack of incentives in the network of designers, builders and materials suppliers to invest at present in measures that will not guarantee business or only has a late pay-off. Substitution of concrete/brick buildings by wood frame buildings Wood frame buildings are a viable alternative for single-family residences. Their use is well es-
210
tablished in regions with sufficient wood resources, like North America and Scandinavia. Wood can also be applied in other building types like apartments, commercial- and office buildings. Due to minimal wood resources in Central and Southern Europe, construction firms rely to a much larger extent on ceramic materials in their building practice. Substitution of these ceramic materials with wood poses an option to reduce CO2 emissions. The effect is three-fold: the emissions in the production of the wood frame buildings are lower than for the conventional buildings, carbon is stored in the wood (CO2-sink), and beyond the product life the wood can be recycled or used for energy recovery. Wooden buildings are even more attractive because their level of insulation is generally well above the insulation level of other buildings. The energy savings during the building life can exceed the savings due to materials substitution. As an example of materials substitution, wood frame building as a substitute for concrete/brick building is studied for the Netherlands. Only recently, wood frame building was introduced in the Netherlands. The new building method originates from regions where wood supply was easy available. The building context in these countries is quite different from the Dutch situation, where the geographical situation (river delta) largely favoured the development of the concrete and the brick industry. This has two effects on the development of materials within the building industry. − First, there is lack of knowledge about wood frame building in the Netherlands compared to for example Scandinavia. Wood frame building requires not only a different building material, but also other equipment and methods than used for brick/concrete buildings. Knowledge of wood frame building is sparse and the limited experience with it in the Dutch building industry poses a problem for the spreading of this technology. − Second, frame building requires a completely different organisation of the building process. Whereas the contractor has large responsibility for the selection and application of the proper type of concrete or bricks and the best building methods, the choice for wood frame buildings shift the responsibility of the contractor from building activity towards purchasing material and assembly on the building site. The option to shift materials use towards wood frame building requires technical competencies as well as knowledge and control combined with organisational authority to ensure collaboration and integration. Moreover, it can be doubted whether sawn wood supply and the wood frame supplying industry which is currently very fragmented in most European countries will have enough innovation potential to deal with more than niche markets. 211
10.6.5 Future modeling and technical change efforts The discussion of the building sector above shows how building practices are entrenched in the (national) socio-economic context. It is unclear which actors will be able to take a lead in changing materials use. On a European scale, there are no dominant construction firms; the largest firms have less than 5% of their home market. By nature a large part of the construction industry will remain a local or regional industry. The geographical distribution of raw materials for the industry as well as the historical developments in the use of these materials created regional pools of (tacit) knowledge and set out building preferences. Internationalisation will only include some high value products and the export of specialists and capital, because of the low value/weight ratio of the major building materials. This makes the construction sector a heterogeneous sector consisting of many small players, none of them able to orchestrate technological change at the scale of one Europe. The examples of design for reuse and wood frame building show that the fragmented organisational form of the building process constitutes a barrier for change in materials use. Temporary networks work together during different stages of the building project in order to create a building. Sometimes, general contractors are hired to create an overall design and management framework for individual projects. This organisational form is better able to deal with more complex building projects and building methods. In addition, this organisational form provide within the building project a central actor who co-ordinates the activities. Next to organisational forms, two other developments have the same unifying effect. Firstly, the trend of using CAD systems is gradually integrating the traditionally fragmented process. Secondly, there is a significant increase of construction firms working regularly with the same sub-contractors, and clients developing a group of consultants and contractors that undertake all their work on a regular base in Europe. These long-term networks of firms or quasi firms, which are very important in Japan, are decreasing the fragmented nature of the building process and are better able to integrate the different steps of the building process. This provides better opportunities for materials innovation in general. Barriers related to the implementation of wood frame building as a substitute for concrete/brick building face different problems compared to high strength concrete or design for reuse. Whereas 212
high strength concrete mainly has an effect on the concrete production and the application in the building process, and design for reuse on the organisation of the building process, substitution of materials assumes a shift in existing relationships between supplying industries and the building industry. Barriers for implementation are related to the changes needed in the configuration of building-materials networks. Such supply networks differ amongst countries in Europe. The example of substitution of concrete/brick buildings by wood also clearly shows the importance of existing building traditions. Within these traditions, knowledge and experience with building materials are embedded. In some countries, like Spain, knowledge of the structural use of timber is simply lacking in all layers of the society relevant for wood frame building: there is hardly specialised knowledge (only one small institute for structural timber use), structural wood technology is highly omitted in the schools for engineers and there is no proper use of labels or standards so builders need to work with a variety of qualities. The cement and concrete industry on the other hand is a well-organised and supported by research and education, and natural resources for the production are easily available, in contrast to wood. The emergence of this situation has to do with several factors including a less favourable climate for wood27. Possibilities of design for reuse show great differences amongst the type of material. Prefabricated structures of steel and timber allow better for reuse than heavy, concrete elements, which face a high risk of damage. For wood, several trends are supporting more efficient use of wood resources (the attention towards tropical rain forest and European primeval forest as well as the emergence of sustainable building). Concrete is increasingly recycled and reused in road construction, but reuse of concrete building component is very rare. This has to do with the unfavourable weight/value ratio of concrete and the existing alternative routes for concrete waste: recycling in road construction. Particular differences per country also tend to play a role. In the Netherlands space is becoming scarce. As a result, landfill costs have enormously increased and law has restricted the landfill of combustible waste. This means that alternatives for old building materials become more attractive and even necessary for timber product (combustible waste). In Spain, on the other hand, there are no significant pressures to stop landfill. Landfill costs are low and regulation is applied in only a few autonomies.
27
More on this subject in: Goverse, T. (forthcoming)
213
Optimal use of the characteristics of high strength concrete asks for changes by the different actors in the building organisation. Designs can be adjusted because of the high strength and new methods for construction calculations are needed. Moreover, high strength concrete reduces the length of the building cycle, thereby saving building time and labour costs. This has major consequences for the complete organisation and planning of the building process, including changes in agreements between actors. Good control over the building process is essential to benefit from the characteristics of high strength concrete. A shift from the use of stony materials towards wood frames requires an even stronger co-ordination. Increasing the amount of sawn wood used implies a different organisation of building practices, different skills for the builders, and at the same time attention need to be paid to the standards as well as the information exchange structures (Barker and Street 1996). In conclusion we can state that an analysis of sectoral innovation provide substantial additional information to understand barriers and incentives to materials innovations. Studying relevant conditions for materials use and technology development in the building and building materials sectors provides relevant information for assessing implementation possibilities of CO2 optimal materials options ex ante. From the sector characterisation and the examples of material innovation discussed above, the following can be concluded: -
The success of implementation depends on a complex of relevant condition, rather than on one single barrier.
-
Many of the determining factors are embedded within a sectoral or a national innovation system.
-
Historical development as well as ongoing trends are important tools for assessing the implementation possibilities of new technologies.
-
Such factors and trends are only to a limited extent included in the MARKAL model.
Because of the complexity of the factors influencing the implementation of materials innovation in the building sector and the importance of factors with a local, national character, it does not seem to be feasible to model these in MARKAL, nor desirable because of the level of detail and the need for regular adjustment. The sectoral innovation system approach, as followed in the MATTER sub-project ‘Institutional barriers for shifts in materials use’ seem however suitable to understand innovation processes within sectors and provides keys for understanding technology development. Specific CO2 improvement options, such as the examples discussed in this para214
graph, can subsequently be regarded in the light of the processes driving innovation and the direction of technology development within a sector, as in this case construction. Based on the findings in the construction industry, we expect that the national system in which the building sector operates will remain of great importance for future developments and need to be taken into account for successful implementation of materials policies.
10.7
Conclusions and discussion
MATTER is uniquely capable of dealing with questions of time related cost effectiveness calculation. However, it fails to address questions of major systems shifts on the demand side, exogenous technical change and non-economic actor behaviour. While some of it probably can be repaired within the constraints of the model more attention should be paid to other methods of reaching the same goals in more transparent and cost effective manner. MATTER has contributed to it by the design of a cluster of projects and their outcomes. While appropriate for the purpose of modelling, the handling of discrete options in the way done in MATTER also limits the precision to the system level choices for individual reduction options. In industry such options are rarely independent of each other. In order to work around this limitation inputs, limits and bounds can be adjusted when more specific scenarios are used. Still noncost or technical interdependencies only can be introduced to a limited degree. In the case study of the steel industry the alternative route has been taken of the development of an industry specific model. Such specialised models might be warranted for other segments of the complete model. Thus interdependency of options might require additional study. Technical transformation that might occur such as the development of completely different classes of material technologies, changing traffic patterns, innovative ways of material use and substitution, and perhaps totally new classes of materials, are not taken into account. Such changes do not fit in the currently used limits and criteria of the MARKAL model. Such possibilities of course are not excluded or not bounded by the inability of either R&D economic or social processes to deliver results as the time frame is long enough. The introduction and penetration of plastics from near zero around 1940 until the sizeable (and modelable) amounts in the 1960s act as a visible example. Similarly, engineering ceramics where projected to grow to a considerable market share in the 1980s, but this was not realised. Assessing such changes can be done by developing scenarios in addition to the model. In such an approach the question whether taxation of carbon dioxide or 215
other GHG gases or measures could trigger a technological transformation could be introduced in future projects incorporating the results of the MATTER project. The social embeddedness of technical change can also be filled in close to the model by an early use of a quick-scan for the grouping of options (bottom-up). One logical continuation would be to pay more systematic attention to the further integration of external condition regarding technical change into MARKAL. The detailed sector studies that not all were focused on innovation or technical change in itself demonstrate that barrier is a contextual concept that only acquires meaning when a clear-cut policy or strategic purpose is at stake. The different perspectives on innovation and technical change have not any simple consequences for the design of policy instruments. For instance the literature is quite specific with regard to the large differences between sectors, technologies and countries. Empirical evidence and sufficient historical research to test assumptions that would make it possible to choose between the various, technology actor and system focussed approaches for particular technologies or technological options is difficult to find. There are 3 different aspects that lead to this situation, (1) instruments in technology policy are unevenly developed (2) instruments are usually derived from either paradigmatic examples or idealtype relations, and (3) there is scarce evidence of the specific effect on targeted technology or effect specific interventions. Sector studies can help the policy maker to understand the technical dynamics on which influence needs to be exerted. In conclusion the choice how to apply empirical findings and theoretical insights to the analysis of implementation problems or barriers relevant to climate policy is a difficult one. In addition to the factors mentioned above it requires a transition from firstly ex post to ex ante understanding and secondly the manipulation of sometimes only weakly understood causal relations. In the MATTER study we therefore have limited the analysis of technological dynamics and formulation of possibilities to well understood sectors.
216
217
11.
CONCLUSIONS
Tom Kram; ECN
11.1
Conclusions
This project has contributed to an improved understanding of the relationship between the materials/product life cycles and the associated anthropogenic GHG emissions. A quantitative modelling approach is required to make a proper assessment of emission reduction strategies for the next decades. It has also shown that the dynamic systems analysis approach can be used successfully for this purpose. GHG emissions have been analysed in the life cycle of materials in Western Europe. Important materials and important product groups have been identified, emission reduction strategies have been characterised and their cost-effective potential quantified in a number of case studies.
11.1.1 Methodological Contributions Significant GHG emission reduction will take decades and because of this long time horizon, consideration must be given to technological development, changing product service demand and materials storage during product life. The analysis of these changes requires a dynamic approach. The interaction of GHG emission reduction options requires an integrated energy and materials systems approach. Sectoral interactions in the materials life cycle, and interactions between different materials life cycles, require a regional systems approach. Costs must be considered because they are a key issue for decision-making. Some scientists argue that complexity is a major obstacle for proper analysis. However the results prove that an integrated analysis suggests very different optimal GHG emission strategies than the earlier analyses which were based on a partial perspective. A number of reasons can be given for this difference, related to the model characteristics: − MATTER MARKAL considers the changing reference system. For example in electricity production, a significant number of competing options exist for CO2 emission reduction.
218
Many static analyses compare biomass to outdated coal fired power plants. The picture changes dramatically if e.g. other renewables are considered as alternatives. − MARKAL is based on cost minimisation, a parameter which is not considered in many environmental analyses. − MARKAL MATTER considers market volumes, information which is generally neglected in LCA type of studies. − Changing technology parameters, e.g. future cost reductions, are considered. Future new technologies are explicitly considered in the analysis. − Interactions between emission reduction strategies are considered, for example bio-electricity vs. electricity savings in the residential sector. − Each strategy is compared to all other possible strategies (e.g. bioenergy vs. biomaterials); − Strategies and options are evaluated on the basis of cost-effectiveness. − The results can be used on the technology level as well as on the policy strategy level. Improvement options regarding material flows (excluding energy efficiency, fuel switch and endof-pipe technology in materials production, and emission reductions in electricity production) can be broken down into four separate categories: 1. substitute fossil fuel feedstocks by biomass feedstocks, 2. increase the efficiency of materials use, 3. recycle/reuse materials and products, 4. substitute materials. Changing lifestyle has not been considered as an improvement strategy in the calculations.
11.1.2 Materials Strategies for Greenhouse Gas Emission Mitigation Three quarters of the GHG emissions in the materials life cycle are CO2 emissions. Compared to the reduction of CO2 emissions, the reduction of non-CO2 greenhouse gas emissions is relatively easy and straightforward. Their reduction is a major strategy for fulfilling the emission reduction targets of the Kyoto protocol in the next decade. Beyond 2010, the reduction of CO2 emissions will dominate the GHG emission reduction policy agenda. CO2 emissions pose a difficult environmental policy problem because the alternatives for fossil fuels are few and the alternatives are costly (as yet). For this reason, all options that can reduce GHG emissions must be considered.
219
The production of a limited number of materials from natural resources constitutes the major part of the CO2 emissions that can be allocated to materials production. Materials with CO2 relevance can be split into three groups, based on the origin of the emission. The most important group is bulk materials with a high energy intensity and synthetic organic materials based on fossil fuel feedstocks. The second most important group is materials with a high process emission due to calcination of limestone (mainly cement). The third is wood products derived from forests which are not (yet) managed in a sustainable way (mainly timber from old growth rainforests). Steel, cement clinker and plastics constitute the major part of the CO2 emissions in the Dutch and the West European manufacturing industry. A number of other bulk materials are of similar importance. The production of these materials constitutes the bulk of the total industrial CO2 emissions. Apart from CO2, CH4 emissions from landfill sites, N2O emissions in the chemical industry and from agricultural biomaterial production, and PFC emissions from aluminium smelting must be considered in the life cycle of materials. Emissions in most parts of the energy and materials system will be reduced in a scenario with strong GHG emission reduction policies. The results show that it is necessary to consider interactions between improvement options in the long-term strategy development in order to avoid overestimating emission reduction potentials. Many cases of interaction have been encountered. For example: both the reduction of emissions in materials production, and the reduction of the emissions in electricity production reduce the cost-effectiveness of emission reduction at a later stage in the materials life cycle. The changing availability of fly ash from coal-fired power plants affects fly ash cement production. The choice for lightweight cars reduces the demand for transportation fuel; the selection of building materials affects the heating and cooling energy demand in the building use stage. Several industries compete for energy recovery from waste. If such interactions are not considered, emission reduction potentials are overestimated. Greenhouse gas emission penalties will have a far greater impact on materials production and waste handling than on materials consumption. The case studies for the building sector, iron and steel, and biomass, are clear examples of materials production and waste handling being much more affected than materials consumption. Aluminium production and wood production can benefit from GHG emission reduction (aluminium in the transport sector and wood in the building sector, wood for paper production and as a substitute for oil feedstocks).
220
The results also show a moderate decline in the production of cement. For other materials, the impact is rather limited. Technological development is one of the key driving forces that determine the system configuration in the first half of the next century, both in the energy system and in the materials system. Both the autonomous technology improvements and the potential of R&D policy as an instrument for further emission reduction must be considered for the assessment of future GHG emissions. Materials strategies can contribute significantly to the reduction GHG emissions. The West European materials system can contribute up to 800 Mt CO2 equivalents of emission reduction if consideration is given to the interactions between improvement strategies. In the base case, in 2030 the materials system constitutes an emission of 1200 Mt CO2 equivalents (out of a total emission of 5100 Mt for the integrated energy and materials system). This suggests a 67% emission reduction potential. This emission reduction is achieved at emission penalties above 100 Euro/t CO2 (Section 6.2). The case studies for buildings and infrastructure, steel and biomass show significant emission reduction potentials. Even for these mature products and materials, the improvement potential is considerable. Higher emission reduction potentials can be expected for newer products and materials. However, such improvements can only be achieved through massive R&D operations funded by industry and the government. In conclusion, the materials system can make a significant contribution to the total GHG emission reduction. A factor 4 reduction of the emissions from the materials system seems feasible in 2030, compared to the emissions from the materials system in the base case, if it is taken into account that the modelling of emission reduction options (such as product re-design, increased product life, improved materials quality, and changing lifestyles) is not exhaustive. A factor 10 emission reduction seems unlikely with the improvement options and demand growth paths considered in this study. Emission reductions in the materials system make a contribution of up to 35% in the total emission reduction for a fixed emission penalty. This figure shows that the costs are certainly in line with the costs for emission reduction options in the energy system (Section 6.1, 6.2). Many materials efficiency improvement options are already cost-effective in the base case (such as many energy efficiency improvement options), while end-of-pipe technology, renewable feedstocks, recycling/reuse and materials substitution options, are only cost-effective in the emission penalty 221
cases. Especially at higher emission reduction goals (above 50%), are the emission reduction options in the materials system able to help avoid costly emission reduction strategies based on energy system optimisation. The materials efficiency improvement potential of an industrialised economy for GHG emission mitigation in the long term is independent of the energy system configuration. A comparison of the results in Sections 6.1 and 6.2 shows in both cases a significant cost reduction if materials strategies are considered for GHG emission reduction. The GHG emissions in the energy system are significantly reduced, e.g. electricity becomes virtually CO2 free. The structure of the materials system and the related GHG emissions is similar for both systems if the end-use system boundary approach is applied. This is because the materials, products and waste handling processes are similar for both regions and the per capita consumption is on a similar level. The conclusion regarding the significant emission reduction potential in the materials system can also be reversed: GHG penalties can have a significant impact on the materials system configuration. The material and energy flows will be significantly affected and this can have major consequences for all bulk transport activities, e.g. activity in the Rotterdam harbour. A major problem with regard to GHG policy-making in the materials system is carbon leakage (Section 6.6). GHG penalties that reduce West European emissions by 50% and more can only be achieved if penalties above 50 Euro/t CO2 are introduced. However, such penalties result in an increase in the materials production costs in Western Europe and, in turn, this can result in the large-scale relocation of materials producing industries to regions with more relaxed policy goals. Such effects require special policy attention. International industrial emission reduction targets are one way to handle this problem, the regulation of imports could be another way to resolve this problem. Finally, industrial emission reductions could be subsidised in order to prevent carbon leakage. It is recommended that solutions should be developed for this problem in the short term.
11.1.3 The Consequences and the Limits of the MARKAL Modelling Approach for the Conclusions MARKAL imposes certain limitations with regard to the conclusions that can be drawn from the modelling results. The model is based on an assumed ideal market, rational behaviour, perfect foresight, a fixed demand, and a closed system. All five conditions are only valid to a certain extent. This is probably a better representation for most energy conversion and materials producing 222
industries (the first part of the life cycle) than for household consumption and waste handling (the middle and end parts of the life cycle). Consequently, the results may underestimate certain barriers for emission reduction. For example: car sales are price driven to a limited extent only. Because of the assumed shift towards GHG extensive products and services, the demand growth for GHG intensive products and services is limited in the model calculations. The validity of this assumption for the next half century could be disputed because some new products may also be GHG intensive. As a consequence, the emission growth in the base case may be underestimated. However, the potential for emission reduction is simultaneously underestimated and this mitigates the consequences of this assumption for the calculation results. Specific local conditions (e.g. in terms of waste handling or regional resource availability) are not considered in the analysis. Global competition for certain materials such as aluminium and steel cannot be analysed in detail in a West European model. An overview of factors that influence the conclusions regarding GHG emission reduction, the materials system, and their roughly estimated impact is given in Table Table 11.1. The emissions in the base case may be significantly higher (by 5-75%), but the emission reduction potential will increase simultaneously (by 5-75%)28. In conclusion, both effects balance each other to a certain extent. Table 11.1
The estimated impact of factors not considered in this study in the emission reduction potential in the materials system at penalties of 100-200 Euro/t CO2
Factor Changing lifestyle/new products/demand elasticities Non-ideal market barriers Materials efficiency/increased product life Increased CO2 storage/nuclear energy Breakthrough technology Imports of biofuels Optimise transportation distances Global competition (carbon leakage) Rebound effect/recycling tax revenues Local conditions Total
Impact on BC emissions [% GHG emissions] - 20 - + 50 + 25
+ 5 - + 75
Impact on emission reduction potential [% BC GHG emissions] + 25 - + 50 - 25 + 10 + 10 - + 25 + 10 + 10 + 5 - + 10 - 25 - - 10 -5- 0 - 10 - - 5 + 5 - + 75
223
As a consequence of the limited data availability and limited computer capacity, the model is a simplified representation of reality and emission reduction potentials. Thousands of products and millions of product parts are represented in less than 100 product service categories. Labour and capital productivity improvements may be much more substantial outside the core industrial production processes considered in this study. These autonomous trends can affect sectoral competition substantially. A comparison of the West European and the Dutch model from the EMS study allows some conclusions regarding the validity of the conclusions based on MARKAL. The West European model was developed five years after the model for the Netherlands had been developed. The data was collected by a new group of researchers; the research effort (measured in man-years) was comparable for both studies. The West European model is more detailed than the Dutch model. More detail and a more thorough analysis resulted in the identification of new types of improvement options and also in more substantial improvement potentials. Comparison of model input data for both studies shows little change of input data for some model sections, and significant differences for others. The set of technologies differs significantly for certain parts of the model. These differences can be attributed in part to a more thorough search for data, more expertise, and easier data accessibility though the Internet and new literature databases. This development is hardly surprising: the Dutch model data served as the starting point for further elaboration. However, another part of the differences can be attributed to new R&D results and R&D trends during the last five years. In some sectors, such as iron production and biomaterials, the research emphasis has shifted, in other sectors, primary aluminium production, for instance, there seems to be little change. If the insights can change significantly in a period of five years, this raises questions concerning the sense of a model for a period of 50 years. It also raises the question how the modelling process can be improved. More attention should be devoted to the compilation process for model parameters. Experience has shown that publications tend to emphasise the positive aspects of new technologies. Publications focusing on problems or disadvantages are much harder to come by. The lesson to be learned is to treat reports regarding technological breakthroughs with caution if the modelling results are used for planning purposes. One important advantage of quantitative models is the increased ratio in the R&D funding allocation process that considers many aspects
28
The total in Table 7.1 does not consider interactions between what could be substantial effects (see e.g. Section 6.2)
224
that are not considered in more simple assessment methods. Another advantage is the forced process data description in a standard format, allowing comparison of very different types of technologies. The use of optimisation models has the advantage that a single solution is found and a selection is made from the broad range of emission reduction options. The disadvantage is the application of one criterion (cost-effectiveness). Decision-making generally involves a much wider range of criteria. While the current model is suited for decision-making by government, it may be less suited for decision-making procedures in specific industries. In practice, different sectors show different system characteristics and require different model structures. Competition for certain materials takes place on a global level, for others on a regional level. Barriers for improvements in the building industry are quite different from the barriers in the iron and steel industry. The profitability does differ greatly from one sector to another. Decision-making is based on varying criteria. The gain in terms of helicopter view results simultaneously in a loss of detail regarding system configuration and decision-making practice. Because of the pervasive materials use within the economy, this poses an obstacle for the model use in specific applications. Materials production and waste handling are generally better represented because these processes are characterised by fairly uniform and centralised industries. The current modelling approach seems especially suited to study the impact on these industries.
11.2
Recommendations
11.2.1 Recommendations for policy-makers Non-energy use of fossil fuels (feedstocks), and the relationship between materials and GHG emissions is not yet considered widely in GHG policies. More attention should be devoted to feedstock substitution in the petrochemical industry, to improved materials quality, the development of new materials, materials substitution/product re-design, and to waste management strategies that can reduce GHG emissions. The potential for emission reduction in the materials system seems to be of a similar magnitude as the emission reduction potential in the energy system. With regard to their potential savings in cost, these options are similar to industrial energy efficiency gains. Cost-effective efficiency improvement options in the materials system can be considered as 225
hedging options in a situation where the need for substantial GHG emission reduction has not yet been fully accepted. Design for the environment, materials sciences and materials engineering should be promoted in order to increase materials efficiency. End-of-pipe strategies, many waste management options, feedstock substitution, and materials substitution, become cost-effective in a situation with GHG penalties. The potential for cost reduction compared to stand-alone energy policies for GHG emission reduction should in any case generate considerable interest. Specific technology data can be disputed and may be incorrect. A critical review of the input data, in cooperation with industry, is recommended. The main message for policy-making is that there is a significant improvement potential in the materials system that should certainly be considered. The model calculations show that a long-term policy perspective must be provided in order to avoid short-term optimisation with undesirable long-term consequences. Policy-makers are (as yet) unable to provide more insight into the GHG emission reduction goals beyond the period 2008-2012. Industry is not willing to take future emission reduction into account in their current investment decisions if governments are unable to specify such goals. Because of the long-term consequences of investment decisions, this is a major barrier standing in the way of a significant move towards sustainable development. Especially CO2 emission reduction will result in major changes in our economy. Many of these changes will also increase the sustainability of the economy. GHG emission reduction strategies can be used as an operationalisation for sustainability concepts and should be considered and supported from this point of view. The model calculations show that penalties above 100 Euro/t CO2 are required for a factor 4 emission reduction. This penalty level is significantly higher than the tax levels currently under discussion for policymaking. Industry should be given clear guidelines regarding emission targets to be considered for current investments with a lifespan of 2-3 decades. GHG emission reduction will have a limited impact on consumer product prices. The price increase for products is limited because of the low fraction of materials costs in the ultimate price of the product. The limited product price increases due to the significant GHG penalties discussed in Sections 6.3 and 6.4 suggest that pricing instruments are insufficient to achieve significant changes in materials consumption. It seems unlikely that emission penalties will steer product designers and consumers into environmentally-favourable decision-making in terms of material choices. Consequently, other policy 226
instruments must be developed in order to guide materials consumption into a sustainable direction (such as legislation and covenants for industry, improved information aimed at industrial designers, and R&D programmes geared towards the materials consuming industries, especially small and medium-size enterprises). For the other actors upstream and downstream in the materials/product chain (materials producers and waste handling companies), emission penalties will have a significant impact. Financial instruments are likely to affect their decision-making. Increased materials efficiency and materials substitution will require substantial R&D, an adjustment of the existing capital equipment, and an adjustment of labour skills in many cases. These are areas in which government policies can help to establish new practices. In a situation with uncertain long-term policy goals, limited investments made in R&D can assist in achieving a rapid transition if the policy climate, or global climate, requires significant emission reduction. Countries and companies who are prepared for such changes can thus obtain a decisive competitive advantage.
227
It is not possible to categorise ‘good’ and ‘bad’ materials from a GHG emissions point of view. Each material must be analysed within the context of a certain application. Technological change in the materials life cycle can significantly change the environmental performance. The whole life cycle of this material/product combination must be considered for proper analysis given that emission strategies in the product/materials life cycle interact. The emissions for most materials will decline significantly if GHG penalties are introduced. The case studies in Chapter 6 showed that this life cycle cannot be analysed properly without taking into consideration the surrounding energy and materials systems configuration. An integrated approach is required for proper analysis. The calculations have shown that it is of absolute importance to account for interactions on the level of the whole economy in order to prevent the selection of sub-optimal emission reduction strategies. No generic strategies can be recommended. Each material and each product group requires a detailed analysis. Such strategies can be developed on the basis of the MATTER model output which can be found on the Internet site [http://www.ecn.nl/unit_bs/ etsap/MARKAL/ MATTER/main.html]. It has been mentioned before that a comparison of the results for the Netherlands and Western Europe suggests that the attractiveness of emission reductions in the materials system is not influenced by the initial energy system configuration. In both of these case studies the GHG intensity of the energy supply system declines rapidly with increasing GHG penalties. As a consequence, international RD&D efforts for development of materials options can be combined. The analysis suggests that the GHG emission problem can be solved without affecting consumer lifestyles (apart from the significant autonomous changes in product demand). A combination of technological developments and endogenised environmental impacts, combined with declining fossil fuel reserves, will result in a reorientation of the economy from a fossil fuel basis towards a renewable basis. Energy and materials efficiency will simultaneously increase. The materials strategies can help fill the time gap between the long-term transition to a sustainable society in the 21st century and the need for significant GHG emission reduction over the next two to three decades. Materials policies should be initiated within the next few years. Many improvement options based on new technology require at least five to ten years before they can be applied on a commercial scale. The time lag caused by the lifespan of standing capital equipment and the time lag due to materials storage in products (relevant for options in waste management) further increase the delay of the system reaction to new policies.
228
The results place an emphasis on technological solutions. However, this implicit bias should not be considered as a policy recommendation to focus on technological solutions alone. Governments should develop non-technological strategies, e.g. through education, research and international exchange of expertise, and actively promote a service economy. Other stakeholders, such as industry and the general public, will react to such policies. While individual non-governmental actors may be very active and willing to reduce their emissions, national governments and the EU should take a leading role in order to create a ‘level playing field’ for globally operating industry, and to ensure participation throughout society. Especially the carbon leakage problem should be dealt with. In the short term, the European Union may be a more attractive platform for materials policies than the Netherlands because of the much more closed character of its economy. The economic projects of the Dutch government for the next few decades focus on infrastructure: new harbour facilities, new airports and new rail connections. Another important focus is heavy industry. All these economic activities are characterised by comparatively high GHG emissions. Economic policies focusing on a change in the economic structure are no viable option in the current Dutch economic and political climate (apart from for the stimulation policies mentioned above). Some argue that the open character of the Dutch economy defies any structural policies. The resulting economic structure with comparatively high GHG emissions per unit of value added increases the Netherlands’ vulnerability for future GHG emission reduction. Cornerstones of the Dutch economy such as the Rotterdam harbour, based on bulk material and energy transportation, may be significantly affected by GHG emission reduction because energy and material flows will change. It is recommended that the government should include GHG aspects more seriously in its economic policy-making. A strong growth of the materials producing industry should be coupled to more attention for materials policies for GHG emission reduction.
229
11.2.2 Recommendations for Further Greenhouse Gas Emission Reduction Studies Model Improvements and modelling recommendations: − No comparable model has been encountered for the same regions or for other regions that can be used to validate the results. It is recommended to develop similar models for other regions in order to allow quality control and to enhance the reliability and credibility of the conclusions. Such activities are currently planned for MARKAL models for countries such as Belgium, Italy and South Korea. Other important models than MARKAL used for the analysis of GHG emission reduction strategies should also be extended with a materials systems module (such as the NEMS model, New Earth 21 and Primes, for example). It is recommended for key players such as the European Union and the United States Government to consider such extensions for their strategy analysis. − It is recommended to compare the results of MATTER analysis with other physical flow models for Western Europe. A comparison of MATTER results and results from the CPB-RIVM STREAM model is planned. − The issue of carbon leakage deserves more attention. The model must be extended to a regionalised global model in order to analyse carbon leakage. A comparison of MATTER results and results from econometric models regarding carbon leakage should be considered in the framework of NOP. Here lies also an important role for international bodies such as the OECD. − MARKAL results cannot be compared to LCA results because environmental impacts for individual chains in the system are not reported in MARKAL. The results are more open to discussion if such chain analysis can be performed on the basis of the model results in order to quantify the environmental impacts and life cycle costs of individual products and materials. It is recommended to enhance the MARKAL chain analysis possibilities (e.g. an option to select process chains and to account the emissions in this chain, based on MARKAL input and output). − The current model structure does not comply with the economic subdivision into standard industrial classifications and product classifications (e.g. NSTR, ISIC). If the model is structured according to the same subdivisions, a dynamic I/O model could be created that should appeal to economists and that would simultaneously benefit from the economic databases. It is recommended to develop such a model. − All material flows are in mass units, while all energy flows are in energy units. The model consistency and its transparency can be enhanced if the energy flows in the model input can
230
simultaneously be displayed in mass units. This will allow the generation of mass balances for technologies where energy carriers are used as feedstock. − Model building requires a broad field of expertise. The use of model results for policy making requires even wider support from industry, government and the scientific community. The dissemination of a standard model (including a database) and feedback from different actors can significantly enhance the quality of the databases and the ultimate use of model results. Given the fact that the MATTER Internet site [http://www.ecn.nl/ unit_bs/etsap/ MARKAL/MATTER/ main.html] with detailed information regarding the model input and output gets currently over 500 visitors per month, this seems a viable instrument for dissemination and data exchange that should be further developed. Sub-regional and global models must be developed for specific sectors, depending on the market structure of resources and products (e.g. for aluminium, waste, and the building sector). − An enhanced biomass module is developed in the framework of the BRED project for the Environment and Climate Programme for the European Union [Gerlagh and Gielen 1999]. − More environmental impacts can be included. Topics such as acidic emissions, waste, resource depletion and dematerialization can be added to the existing model structure. The synergies and antagonisms between different environmental policy fields can be analysed. This research area is, for example, relevant for the EEA integrated assessment studies. − The potential for optimisation of energy and materials transportation should be analysed in more detail. − Within the energy system, the MATTER transportation module needs further enhancement with regard to the technology characterisation and the demand forecasts. Such a project is currently planned at ECN. The building module deserves more attention with regard to delivery costs and the simulation of decision making. Such a project should be considered in the 5th framework programme of the European Union in the Cities of the Future Programme. − Input data for key technologies should be validated through in-depth reviews by industry experts and academics. − Current energy and materials systems models pay little attention to the interaction with changing economic parameters that may influence the systems configuration on the long term. For example the issue of long-term labour productivity trends deserves more attention in both energy and materials modelling. − The missing GHG emissions (HFCs, SF6) should be added to the MARKAL model.
231
− More research and policies should focus on the promotion of new materials extensive economic activities, resulting in materials and energy extensive products and services. Future trends towards dematerialization and the decoupling of GHG emissions and economic growth should be analysed in greater detail in order to improve the model and to identify new promising policy strategies. Such a project is currently planned at ECN. − Transportation distance optimisation in the materials system should be analysed in more detail as a strategy for GHG emission reduction. Analysis of Materials Options Further research is required regarding the potentials for increased materials efficiency. This study provides only some initial insight into the emission reduction potentials. The research should focus on new product design methods, improved materials processing technologies and systematic methods for materials design. The most rewarding research areas seem to be new materials and processes based on biomass feedstocks, new metal production technologies, plastic recycling and metals recycling technologies that preserve the materials quality, and the development of new sorts of concrete. The analysis of the materials quality improvement strategy for GHG emission reduction requires more research. The model development has shown that few statistical data are available regarding the final use of materials in products. More research is also warranted regarding the increasing materials stock in products and regarding product life. These issues should be tackled within the framework of material flow analysis studies.
232
REFERENCES Abbott, R., 1995, The ultimate can, Packaging Today, June 1996. Adalberth, K., 1997: Energy use during the life cycle of single-unit dwellings: Examples. Building and environment, Vol. 32, no. 4, pp. 321-329. Allenby, B.: Products to services. Presentation at the conference ‘Towards Sustainable Product Design’. DTI conference centre, London, 26 October 1998. Anonymous, 1995, The role of PET, Plastics Bulletin. Anonymous, 1996, European Glass Recycling in 1995, Glass Gazette, September 1996. Anonymous, 1997, Licht maar stijf vouwkarton van Enso, Verpakkingsmanagement, March 1997. AOO, 1995, Ontwerp Tienjarenprogramma afval 1995-2005. APME, 1992, Information system on plastic waste management in Western Europe; 1990 data, Brussels, Belgium. APME, 1996, Information system on plastic waste management in Western Europe; European overview; 1994 data, Brussels, Belgium. Ayres, R.U., Ayres, L.: Industrial ecology: towards closing the materials cycle. Edward Elgar Publishing, Cheltenham, UK, 1996. Barker, K. and P. Street, Technology transfer and innovative behaviour in the construction industry: the influence of public policy'. In: C.E. Garcia and L. Sanz-Menendez (eds.). Management and technology, p. 291-303 European Commission, Cost A3 Volume 5. Luxembourg, 1998 Bennis, M. J., Hopstaken, P., & Roest, F. M. (1991), De kosten van de auto en het openbaar vervoer vergeleken, 1962-1990, Amsterdam: SEO / PbIVVS Binsbergen, A. J. v., A. Erkens and B. Hamel (1994), Long-term energy efficiency improvement for transport, technology assessments, TU-Delft, Department of Infrastructure Blonk, T.J., Duin, R. van, 1992: CO2-Emissies Vanwege Nederlands Materiaalverbruik. (CO2 emissions caused by Dutch materials consumption). Bureau Fuels and Resources, Rotterdam, the Netherlands. Bouwman, M.E., 2000: Tracking transport systems, an environmental perspective on passenger transport modes. Ph.D. thesis, Geo Press, Groningen. Bouwman, M. E. and H. C. Moll (1997a), Dynamische levenscyclusanalyse van personenauto's: de betekenis van materiaalgebruik, In: Colloquium verkeer, milieu en techniek. J. A. Annema and R. M. M. van den Brink, Bilthoven, RIVM
233
Bouwman, M. E. and H. C. Moll (1997b), Status quo and expectations concerning the material composition of road vehicles and consequences for energy use, Groningen, the Netherlands: RuG/IVEM Bouwman, M. E. and H. C. Moll (1999), Energy use reduction potential of passenger transport in Europe, Transport Reviews 20: 191-203 Bouwman, M.E., Moll, H.C., 1997: Status quo and expectations concerning the material composition of road vehicles and consequences for energy use. Rep. no. 91. IVEM, Groningen. Bringezu, S., Fischer-Kowalski, M., Kleijn, R., Palm, V., 1998: The ConAccount Agenda: The Concerted Action on Material Flow Analysis and its Research & Development Agenda. Wuppertal Special 8. Wuppertal Institut, Germany. Brink, R. M. M. van den, & Wee, G. P. van (1999), Waarom wordt het personenauto-park niet meer zuiniger? De ontwikkeling van het brandstofgebruik van het personenauto-park, In: Verkeerskunde, april 1999. Buelens, M., 1997, Tetra Pak: Verpakking en Milieu, Energie en Milieu, May 1997. BUWAL, 1991, Oekobilanz von Packstoffen, Stand 1990, Schriftenreihe Umwelt Nr. 132, Bundesamt für Umwelt, Wald und landschaft, Bern, Switzerland. BUWAL, 1996, Okoinventare für Verpackungen, Band 2, Schriftenreihe umwelt n. 250/II, Bundesambt für Umwelt, Wald und Landschaft, Bern, Switzerland. Capros, P., E. Kokkolakis, S. Makris, L. Mantzos, Y. Antoniou, J.F. Guilmot, 1995, Energy scenarios 2020 for European Union, report to European Commission, DG XVII/A2, Volume 1 Results for European Union Carlsson, B. and R. Stankiewicz, 1991: Functions and composition of technological systems. . Journal of Evolutionary Economics 1: 93-118 CBS, 1997, Statistiek van de buitenlandse handel, CBS, Voorburg/Heerlen, The Netherlands. CBS, 1998, Statistisch Jaarboek 1998, Centraal Bureau voor de Statistiek, Voorburg/Heerlen, The Netherlands. CE, 1994, Verwijdering van huishoudelijk kunststofafval: analyse van milieu-effecten en kosten, Centrum voor Energiebesparing en schone technologie, Delft, The Netherlands. Charles, R., Jolliet, O., Gaillard, G.: Taking into account quality in the definition of functional unit and influence on the environmental optimisation of fertiliser level. In: D. Ceuterick (ed.): International conference on life cycle assessment in agriculture, agro-industry and forestry. Proceedings 3-4 December 1998, Brussels. Vito, Mol, Belgium. Christensen, C.M., 1997: The inoovator's dilemma. When new technologies cause great firms to fail. Harvard Business School Press, Boston MA.
234
Chorinsky, E. 1989: Experiences with steel fibres in concrete floor slabs. In: Fibre Reinforced Cements and Concretes. Conference Proceedings, Elseviers Science, New York, pp. 274283. Civieltechnisch Centrum Uitvoering Research en Regelgeving 1996: Kunststof wapeningselementen in beton. Preadvies. Report no. 96-9. Gouda, the Netherlands. Clark,P. and N.Staunton, 1989: Innovation in Technology and Organisation, London: Routledge Clauss, J., Mitchell, K., 1996, Polyethylenterephthalat (PET), Kunststoffe 86 (10), October 1996. Couwenhoven, E., 1996, Innovaties in melk- en vruchtensapverpakkingen nog niet ten einde, verpakkingsManagement, December, 1996. Dael, K. van., W.F. Blom, O.P. Geurts, H.J. Miedema, J. Vorrink, 1996, Afvalverwerking in Nederland, gegevens 1995, Afval Overleg Orgaan, Utrecht, The Netherlands. Damberger, B.F., 1995: Vergleich von ‘Ziegelbauten’ mit ‘Holzbauten’ in bezug auf den globalen und regionalen CO2-Haushalt und die Erzeugten Güter und Energieströme. Technical University Vienna. Daniels, B.W., Moll, H.C., 1998: The Base Metal Industry: Technological Descriptions of Processes and Production Routes; Status Quo and Prospects. Report no. 92. IVEM, Groningen. Davidovits, J., 1993: CO2 greenhouse warming ! What future for Portland cement ? Paper presented at ‘Emerging Technologies on Cement and Concretes in the Global Environment’, March 10-11. Portland Cement Association, Skokie, Illinois. Depijper, J., 1996, Milieu vriendelijke succesproducten, packaging 2000. Diamantidis, N., Koukios E.G., 1999: Biomass for Greenhouse Gas Emission Reduction. Agriculture as a Source of Biomass in Western Europe. NTUA, Athens. Doorn, P.C. van: Staal: Een ijzersterk materiaal. PT werktuigbouw no. 4, april 1989, pp. 35-39. Duin, R. van, 1997: Production and consumption of materials in Western Europe in the year 2000. An overview of materials with CO2-relevance. Bureau B&G, Emst, the Netherlands. EC, 1996, Panorama of EU industry 96, European Commission DG III, Brussels, Belgium. EC, 1997, Panorama of EU industry 97, European Commission DG III, Brussels, Belgium. Edquist, C., 1997, Systems of Innovation.Technologies, Institutions and Organisations. London, Pinter Ent, J. van der, 1995, Glas niet stuk te krijgen, Missets pakblad, Juni 1995. Ent, L. van der, 1995a, Metalen verpakkingen lichter en lichter, Missets pakblad, December 1995.
235
Ent, L. van der, 1995b, Europese doorbraak SiOx lijkt in aantocht, Missets Pakblad, October 1995. European Commission, 1999: See e.g. the 5th framework programme Eurostat: Europe’s environment: Statistical compendium for the Dobris Assessment. Official publications of the EC, Luxemburg, 1995. FAO, 1996: Yearbook fertilizers 1995. Rome. FCCC, 1996, Tables of Inventories of Anthropogenic Emissions and Removals and Projections for 2000, Second Compilation and Synthesis of First National Communications from Annex I Parties, UN-FCCC. Feber, M.A.P.C. de, Gielen, D.J.: Biomass for greenhouse gas emission reduction. Task 7: Energy Technology Characterisation. ECN-C--99-078 ECN, Petten, The Netherlands. Franssen, S., 1999: MATTER 3.0: Relaxing the demand in the MATTER model. ECN/Wageningen University. Freeman, C. and L. Soete, 1997: The economics of industrial innovation. Pinter, London. Gartner, E., Smith, M. 1976: Energy costs of house construction. Energy Policy, June, pp. 144157. Geier, U., Köpke, U., 1998: Comparison of Conventional and Organic Farming by Process-Life Cycle Assessment. A Case Study for Agriculture in Hamburg. In: D. Ceuterick (ed.): International conference on life cycle assessment in agriculture, agro-industry and forestry. Proceedings 3-4 December, Brussels. Vito, Mol, Belgium. Gerbens, S., 1999a: Cost-effectiveness of methane emission reduction from enteric fermentation of cattle and buffalo. Draft report, 22 January 1999. Agricultural University Wageningen, AEST. Gerbens, S., 1999b: Cost-effective Methane and Nitrous Oxide emission reduction technologies for animal waste. Draft report, 22 January 1999. Agricultural University Wageningen, AEST. Gerlagh, T. 1998: Biomass for greenhouse gas emission reduction: Western European Land availability. ECN-C-98-109. ECN, Petten. Gerlagh, T., Gielen, D.J., 1999: MATTER 2.0. A module characterisation for the agriculture and food sector. ECN-C--99-048. ECN, Petten. Gielen, D.J., 1995, Toward integrated energy and materials policies? A case study on CO2 reduction in the Neteherlands. Energy Policy 23:1049-1062 Gielen, D.J., 1997a: Building materials and CO2. Western European emission reduction strategies. ECN-C--97-065. Petten. Gielen, D.J., 1997b: Technology Characterisation for Ceramic and Inorganic Materials. Input data for Western European MARKAL. ECN-C--97-064. Petten.
236
Gielen, D.J., 1998a: Western European Materials as Sources and Sinks of CO2: an MFA Perspective. Journal of Industrial Ecology, vol. 2, no. 2, pp. 43-62. Gielen, D.J., 1998b: The MARKAL systems engineering model for waste management. In: J. Sundberg, T. Nybrandt, Å. Sivertun (eds.): Systems Engineering Models for Waste Management. Workshop Proceedings 25-26 February 1998, Göteborg. Swedish Environmental Protection Agency AFR, Stockholm, Sweden. Gielen, D.J., 1998c: The future of the European aluminum industry: a MARKAL energy and material flow analysis. Paper prepared for the workshop ‘Methodological aspects of resource-oriented analysis of material flows’. Bergisch Gladbach, Germany, 23-24 April. Gielen, D.J., 1999a: Materialising dematerialization. Integrated energy and materials systems engineering for greenhouse gas emission mitigation. PhD Thesis. Design for Sustainability Program, Technical University Delft. Gielen, D.J. (ed), 1999b: Workshop factor 2/factor 10 proceedings. Utrecht, April 1998. NOP/MLK, Bilthoven. Gielen, D.J., A.J.M. van Dril, 1997, The Basic Metal Industry and its Energy Use, ECN-C--97019. Petten, March 1997. Gielen, D.J., A.J.M. Bos, M.A.P.C. de Feber, T. Gerlagh, 2000: Biomass for greenhouse gas emissions reductionsBRED. Task 8: Optimal emission reduction for Western Europe.ECN-C--00-001, Petten, The Netherlands. Gielen, D.J., Bos, A.J.M., Feber, M.A.P.C, de, Gerlagh, T., 1999d: Reduction de l’emission de gaz a effet de serre en agriculture et forestiere. C.R. Acad. Agric. Fr., 85, no. 6, Séance du 18 mai 1999. Gielen, D.J., Bos, A.J.M., Gerlagh, T., 1998g: The MARKAL Systems Optimisation Model for Dynamic Life Cycle Analysis of Biomass Strategies for GHG Emission Reduction. Paper presented at the conference ‘LCA in Agriculture, Agro-Industry and Forestry’, 3-4 December. Brussels. Gielen, D.J., Dril, A.J.M. van, 1997a: Long-term energy and materials strategies for reduction of industrial CO2 emissions - A case study for the iron and steel industry. In: M. Olszewski: 1997 ACEEE summer study on energy efficiency in industry, Saratoga Springs. AC3E, Washington DC. Gielen, D.J., Dril, A.W.N. van, 1997b: The basic metal industry and its energy use. Prospects for the Dutch energy intensive industry. ECN-C--97-019, Petten. Gielen, D.J., Dril, T. van, 1999: CO2 reduction in the basic metals industry: a systems approach. In: B. Mishra (ed.): 1999 EPD congress. San Diego, 28 February - 4 March. Gielen, D.J., Gerlagh, T., Bos, A.J.M., 1998d: MATTER 1.0. A MARKAL energy and materials system model characterisation. ECN-C—98-065, Petten.
237
Gielen, D.J., Gerlagh, T., Bos, A.J.M., 1998e: Biomass for energy or materials ? A Western European MARKAL MATTER 1.0 model characterisation. ECN-C-98-066, Petten. Gielen, D.J., Gerlagh, T., Bos, A.J.M., 1998f: Biomass for greenhouse gas emission reduction BRED. Paper presented at the Conaccount meeting, 21 November, Amsterdam. Gielen, D.J., Kram, T., 1998a: MARKAL: Lessons from MFA Experiences in the Netherlands. In: Bringezu, S. et. al. (eds.): Analysis for action: Support for policy towards sustainability by material flow accounting. Conaccount conference proceedings, 11-12 September 1997, Wuppertal, Germany. Wuppertal Institute, Wuppertal, Germany, Wuppertal special no. 6. Gielen, D.J., Kram, T., 1998b: The MATTER project on integrated energy/materials strategies for Western Europe. Paper presented at the ETSAP workshop, 6-7 May, Berlin. Gielen, D.J., Kram, T., 1998c: Integral energy and materials policy for cheaper greenhouse gas reduction. Paper presented at the NOP-MLK symposium, 29-30 October, Garderen. Gielen, D.J., Kram, T., 1998d: Western European integrated energy and materials scenarios for sustainable development. Paper presented at the NWO conference ‘beyond sustainability’, Amsterdam, 19-20 November. Gielen, D.J., Kram, T., 1998e: The role of non-CO2 greenhouse gases in meeting Kyoto targets. Paper presented at the OECD experts workshop ‘Economic modelling of climate change’. Paris, 17-18 September, Paris. Gielen, D.J., Kram, T., Brezet, J.C., 1999c: Integrated energy and materials scenarios for GHG emission mitigation. Paper prepared for the IEA/DOE workshop, 5/5-7/5, Washington DC. Gielen, D.J., Okken, P.A. 1994: Optimisation of integrated energy and materials systems. Compilation of materials processes. ECN-C-94-011. Petten. Gielen, D.J., S. Franssen, A. Seebregts, T. Kram: MARKAL for policy instrument assessment. The OECD TOG project. Paper presented at the IEA ETSAP Annex VII workshop, 29/4-4/5 1999, Washington DC. Goddard, R., 1994, Refined approach to loosing weight, packaging week, nov 10 1994. Goverse, T., 1997: The context for transfer of CO2 optimal materials technologies in the building industry . 6th International Conference of the Greening Industry Network, Rome Goverse, T., Groenewegen, P. 1997: Materials innovation in the construction sector: the role of production networks, standards and information. Paper prepared for the GIN conference ‘Developing Sustainability: New Dialogue. New Approaches’. University of California, November 16-19, Santa Barbara. Goverse, T., (forthcoming): Building a climate for change, environmental materials innovation in the European building industry, PhD thesis.
238
Groenendaal, B.J., Gielen, D.J., 1999: The Future of petrochemicals. A MATTER5.0 model analysis. ECN-C--99-052, Petten. Groenewegen, P., Gielen, D.J., Goverse, T., Moll, H.C., 1998: Barriers for reduction of carbon dioxide emissions from materials. Milieu, vol. 5, pp. 255-263.
Grübler, A., 1997: Time for a change: on the patterns of diffusion of innovation. In: Technical trajectories and the human environment, J.H. Ausubel and H.D. Langford. National Academic Press: 14-32, Washington DC. Hamilton, L.D., G. Goldstein, J.C. Lee, A. Manne, W. Marcuse, S.C. Morris, C.-O. Wene: MARKAL-MACRO: An overview. Brookhaven National Laboratories #48377, November 1992. Heijnungs, R., J.B. Guinée, G. Huppes, R.M. Lankreijer, H. A. Udo de Haes, A. Wegener Sleeswijk, A.M.M. Ansems, P.G. Eggels, R. van Duin, H.P. de Goede, 1992, Environmental Life Cycle Assessment of Products, Centre of Environmental Sciences, Leiden, The Netherlands. Heineken, 1998, oral communication dd. 4 August 1998, with Heineken consumer services, Heineken Zoeterwoude, The Netherlands. Hekkert, M.P., 1998, Weighing experiments of several packaging types in The Netherlands. Hekkert, M.P., 2000, Improving material management to reduce greenhouse gas emissions. Department of Science, Technology and Society, Utrecht University, Ph.D. thesis: 216. Hekkert, M.P., and D.J. Gielen e al., 2001, Wrapping Up GHG emissions, An Integrated Assessment of Greenhouse Gas Emission reduction Related to packaging, forthcoming. Hekkert, M.P., L.A.J. Joosten, E. Worrell, 1998, Packaging Tomorrow, Modelling the material Input for European Packaging in the 21st Century, department of Science, technology and Society, Utrecht University, report no. 98001. Hekkert, M.P., L.A.J. Joosten, E. Worrell, 2000a, Reduction of CO2 emissions by improved management of material and product use, the case of primary packaging, Resources, Conservation and Recycling, 29: 33-64. Hekkert, M.P., L.A.J. Joosten, E. Worrell, 2000b, Reduction of CO2 emissions by improved management of material and product use, the case of transport packaging, Resources, Conservation and Recycling, 30: 1-27. Hekkert, M.P., Worrell, E., 1997: Technology Characterisation for Natural Organic Materials. Input data for Western European MARKAL. Rep. no. 98002. NW&S, University Utrecht.
239
Hekkert, M.P., T. Goverse, P. Groenewegen and R. Smits (forthcoming): Wood in the residential construction sector: possibilities, potentials and constraints, Resources, Conservation and Recycling Henderson, R. and K. Clark, 1990: Architectural innovation, the reconfiguration of existing product technologies and the failure of established firms. Administrative Science Quarterly 35: 9-30 Hentzepeter, V., 1996, Einde successtory PET nog lang niet in zicht, Foodmanagement, 14/10. Hillemeier, B. 1997: Innovations in the building material market. Concrete Precasting and Technology, no. 3, pp. 74-81. Http:\\www.ecn.nl\unit_bs\etsap\MARKAL\MATTER\ Hunt, J., 1994, Has the fizz gone out of the PET market for methanolysis?, Packaging Week, April 7, 1994. Håkansson, H., 1989: Corporate technological behaviour, co-operation and networks. Routledge, London. IEA Greenhouse Gas R&D Programme, 1998: Abatement of Methane Emissions. IEA Greenhouse Gas programme, Stoke Orchard, Cheltenham, UK. IEA, 1995: Energy balances of OECD-countries 1992-1993. Paris. IPCC 1995: Guidelines for National Greenhouse Gas Inventories. Volume 1-3. IPCC WG !. Technical Support Unit, Hadley Centre, Bracknell, UK. IPCC: Guidelines for National Greenhouse Gas Inventories. Volume 1-3. IPCC WG !. Technical Support Unit, Hadley Centre, Bracknell, UK, 1995. Jepma, C. J., M. Asaduzzaman, I. Mintzer, R. S. Maya and M. Al-Moneef (1995), A generic assessment of response options, In: Climate change 1995. Economic and social dimensions of climate change. J. P. Bruce, H. Lee and E. F. Haites.Cambridge, Cambridge university press Johansen, J, 1995, Glascoating verdubbelt houdbaarheid vruchtesappen, Verpakkingsmanagement, November 1995. Joosten, L.A.J., 1998: Process Data Description for the Production of Synthetic Organic Materials. Input data for the MATTER study. Rep. no. 98028. NW&S, State University Utrecht. Kaltschmitt, M., Reinhardt G.A. (eds.), 1996: Ganzheitliche Bilanzierung von nachwachsenden Energieträgern unter verschiedenen ökologischen Aspekten. Vieweg, Braunschweig. Kato, K. and Y. Shiroi, The effect of the growth factor on weight reduction. Klepper, S., 1997: Industry life cycles. Industrial and Corporate Change: 6(1): 145-182 Klok, 1997, AMCOR Haarlem, The Netherlands, Personal communication, 11 December 1997.
240
Kohler, N. 1987: Global energy cost of building construction and operation. IABSE Proceedings P-120/87, pp. 193-204. Kohlmaier, G.H., Weber, M., Houghton, R.A. (eds.) 1998: Carbon dioxide mitigation in forestry and wood industry. Springer Verlag, Berlin. Kort, T. van der, 1992, Kartonnen blister goed alternatief, Verpakken, September, 1992. Kort, T. van der, 1996, Coca Cola maakt kort metten met Scuffing, Verpakken December 1996. Kort, T. van der, 1997, Laminated worden steeds dunner, Verpakken, December 1997. Koudijs, H.G. and C.E. Dutilh, 1993, Milieu-Analyse Rapport: Onderzoek voor de produktgroepen Broodsmeerbeleg en Olie, Saus & Azijn. Koukios, E.G., Diamantidis, N., in preparation: Biomass for greenhouse gas emission reduction Task 4-6. Techno-economic characterisation of biomaterials production. NTUA, Athens. Kuesters, J., Jenssen, T.: Life cycle analysis of different fertilisers. In: D. Ceuterick (ed.): International conference on life cycle assessment in agriculture, agro-industry and forestry. Proceedings 3-4 December 1998, Brussels. Vito, Mol, Belgium. Kunststof en Rubber, 1998. Lako, P., Ybema, J.R., 1997: CO2 abatement in Western European power generation. ECN-C-97-053, Petten. Leonard-Barton, D., 1995: Wellsprings of knowledge. Building and sustaining the sources of innovation. Harvard Business School Press, Boston. London Metal Exchange, 1998.
Loulou, R., D. Lavigne: MARKAL model with Elastic Demands: Application to Greenhouse Gas Emission Control. In: C. Carraro, A. Haurie (eds.): Operations reserach and environmental management. Kluwer Academic Publishers, the Netherlands, 1996, pp. 201-220. Malherba, F. and L. Orsenigo, 1997: Technological regimes and sectoral patterns of innovative activities. Industry and Corporate Change 6(1): 83-118. Marland, G., Schlamadinger, B. 1998: Does the Kyoto protocol make a difference for the optimal forest-based C strategy? Some results from GORCAM. In: B. Schlamadinger, R. Madlener (eds.): IEA bioenergy workshop proceedings ‘Effects of the Kyoto protocol on forestry amd bioenergy projects for mitigation of net carbon emissions’ 9-13 March 1998. Rotorua, New Zealand, pp. 43-60. Meert, B., 1995, het honingraatblik, Intermediair, September. 1995. Moll, H. C. and K. J. Kramer (1996), Naar een optimale levensduur van de personenauto. Technische factfinding in het kader van het project ‘Levensduurverlenging Personenauto's’, Groningen: IVEM. 241
Nielsen, P. 1995: Energi- og miljoanalyse af bygninger. SBI Meddelse 108. Statens Biggeforskningsinstitut, Horsholm, Denmark. Nieuwenhuis, P., Cope, P., & Armstrong, J. (1992), The green car guide, London: Green Print. OECD, 1992: Technology and the economy: the key relationships. OECD, Paris. OECD, 1997: CO2 emissions from fuel combustion, A new basis for comparing emissions of a major greenhouse gas, 1972 - 1995, OECD, IEA, Paris, France OECD, 1999: Instruments and Technologies for Climate Change Policy. An Integrated Energy and Materials Systems Modelling Approach. ENV/EPOC/GEEI(99)15, OECD, Paris, October 1999. Olivier, D. 1994: Insulation and air sealing: Current and emerging trends in European masonry buildings. In: Innovative housing '93 proceedings, vol. 1: technology innovation. Natural Resources Canada, Ottawa. Paauw, K.F.B. de, Perrels, A.H., 1993: De Energie-Intensiteit van Consumptiepakketten. (The energy intensity of lifestyles). ECN-C--93-043, Petten. Packaging Week 1992-1997, many issues of Packaging Week in the period 1992-1997, especially the machinery review section. Pavitt, K., 1984: Sectoral patterns of tyechnical change: towards a taxonomy and a theory. Research Policy 13: 343-373 Phylipsen, G.J.M., 1993, Functiegerichte optimalisatie van kunststof gebruik, Een voorstudie voor een computer model, Report no. 93047. Department of Science, Technology and Society, Utrecht University, The Netherlands. PPI, 1996, Liquid Packaging: Land of milk and money, Pulp and Paper International, August 1996. PPI, 1997. International Fact & Price Book 1997, Pulp & Paper International, Miller Freeman Inc., San Francisco, US. Price, L., L. Michaelis, E. Worrell, M. Khrushch, 1999, ‘Sectoral Trends and driving Forces of Glabal Energy use and Greenhouse Gas Emissions’, Mitigation and Adaption Strategies fort Global Change, forthcoming. Pries, F.F., 1995: Innovatie in de bouwnijverheid. Faculteit Bouwkunde, Erasmus Universiteit: 222, Rotterdam Pulp and Paper Week, 1997, Price watch in Pulp and Paper Week, Oct. 20, 1997. Rieckman, T., J. Brown, 1995, Recycling of PET Food grade Quality on a commercial scale, Chem. Fibers Int. 45, 1995. Rogers, E.M., 1995: Diffusion of innovation. The Free Press, New York. Russell, B., 1981: Building systems industrialization and architecture. John Wiley and sons, London.
242
Scharai-Rad, M., Sasse, V., Welling, J. 1999: Biomass for Greenhouse Gas Emission Reduction. Forestry and Forest Products Use in Western Europe. BFH, Hamburg. Scharai-Rad, M., Welling, J., 1999: Biomass for greenhouse gas emission reduction. Sawn Timber and Wood Based Products as Building Materials. BFH, Hamburg. Schot, J., Brand, E., Fischer, K., 1997: The Greening of Industry for a Sustainable Future. Advisory Council for Nature and Environment RMNO, rep. no. 123. Rijswijk, the Netherlands. Sikkema, R., Nabuurs, G.J. 1995: Forest and forest products: the challenge for a better carbon balance. In: A. Frühwald, B. Solberg: Life Cycle analysis - a challenge for forestry and forest industry. EFI proceedings No. 8, pp. 169-175. Smith, K.A., Mc Taggart, I.P., Tsuruta, H., 1997: Emissions of N2O and NO associated with nitrogen fertilization in intensive agriculture, and the potential for mitigation. Soil use and management 13, pp. 297-304. SVM, 1992, Packaging developments ‘92, Implementation of the packaging covenant illustrated, Stichting Verpakking en Milieu. SVM, 1992a, Verslag stichting verpakking en milieu, Stichting verpakking en milieu. SVM, 1993, Packaging developments ‘93, Implementation of the packaging covenant illustrated, Stichting Verpakking en Milieu. SVM, 1993a, Verslag van Stichting Verpakking en Milieu aan de Commissie Verpakkingen, July 1993. SVM, 1994, Packaging developments ‘94, Implementation of the packaging covenant illustrated, Stichting Verpakking en Milieu. SVM, 1995, Packaging developments ‘95, Implementation of the packaging covenant illustrated, Stichting Verpakking en Milieu. SVM, 1996, Packaging developments ‘96, Implementation of the packaging covenant illustrated, Stichting Verpakking en Milieu. Tuschman, M.L. and P. Anderson: Technologicakl discontinuities and organisational environments. Administartive Science Quarterly 31: 439-465. United Nations Framework Convention on ClimateChange 1997: Kyoto Protocol to the United Nations Framework Convention on Climate Change. Van Deijck, 1994, Revival of the all steel can, Foodmanagement, October 1994. Van Stijn, 1996, Blik(vangers) in topvorm, Missets pakblad, August 1996. Vance, C.P., 1997: Enhanced agricultural sustainability through biological nitrogen fixation. In: A. Legocki, H. Bothe, A. Pührler: Biological fixation of nitrogen for ecology and sustainable agriculture. NATO ASI series, Vol. 39. Springer Verlag, Heidelberg.
243
Vellinga, P., et al, 1996: Industrial transformation. Towards a Research Agenda for the Human Dimensions Programme on Global Change. Institute for Environmental Studies IVM, Amsterdam, March. Vermeer, B. (1996, 31 augustus 1996). Een zeepkist van één op dertig. De kunst is de koper te interesseren, in: NRC Handelsblad, Wetenschap & Onderwijs p. 6. VNC, 1996: Beton en milieu. Stichting BetonPrisma, 's-Hertogenbosch. Von Hippel, E., 1987: Cooperation between rivals: informal know-how trading. Research Policy 16: 291-302 Vugt, H.H.A. van, 1992, Nieuwe bottellijn voor PET-flessen bij Coca Cola Dongen, VMT, August 1992. Vugt, H.H.A. van, 1993, Nieuwe bussenafvullijn voor Heineken Zoeterwoude, VMT, March 1993. Watson, B., et al, 1996: Climate change 1995. Impacts, Adaptions and Mitigfation of Climate Change: Scientific -Technical Analyses. Contribution of WG II to the Second Assessment Report of the IPCC. Oxford University Press, pp. 762. Weijnen, M.P.C., 1998: Factor 4 als drijvende kracht voor technologische innovatie in procesindustrie en energiesector. (Factor 4 as a driving force for technological innovation in the process industry and in the energy sector). Advisory Council for Nature and Environment RMNO, rep. 134, pp. 47-87. Rijswijk, the Netherlands. Weizsäcker, E.U. von, Lovins, A.B., Lovins, L.H., 1994: Faktor Vier. Doppelter Wohlstand halbierter Naturverbrauch. Droemer Knaur Publishers, Munich, Germany. Williamson, O. E., 1985, The economic institutions of capitalism: firms, markets, relational contracting, Free Press, New York. Worrell, E., 1994: Potentials for improved use of industrial energy and materials. PhD thesis, Utrecht University, the Netherlands. Worrell, E., A.P.C. Faaij, G.J.M. Phylipsen and K. Blok, ‘An Approach for Analysing the Potential for Material Efficiency Improvement’, Resources, Conservation & Recycling 3/4 13 pp.215-232 (1995). Worrell, E., et al 1995: International comparison of energy efficiency improvement in the cement industry. Paper presented at the ACEEE summer study. Grand Island, NY. Worrell, E., R.J.J. van Heijningen, J.F.M. de Castro, J.H.O. Hazewinkel, J.G. de Beer, A.P.C. Faaij and K. Vringer, ‘New Gross Energy-Requirement Figures for Materials Production’, Energy, the International Journal 6 19 pp.627-640 (1994). Ybema, J. R., P. Lako, D. J. Gielen, R. J. Oosterheert and T. Kram (1995), Prospects for energy technologies in the Netherlands. Volume 2 Technology characterizations and technology results, Petten: ECN.
244
Ybema, J.R., Lako, P., Kok, I., Schol, E., Gielen, D.J., Kram, T., 1997: Scenarios for Western Europe on Long Term Abatement of CO2 Emissions. ECN-C--97-051, Petten.
245