R. D. K. Reye, G. Morgan, J. Baral, Lancet. 1963-II, 749 (1963). 2. J. S. Haller, in Reye's Syndrome, J. D. Pol- lack, Ed. (Grune & Stratton, New York, 1974), p. 3.
JUNE R. APRILLE*
Children's Services, Shriners Burns Institute at the
Massachusetts General Hospital, and Department of Pediatrics, Harvard Medical School, Boston 02114 910
References and Notes 1. R. D. K. Reye, G. Morgan, J. Baral, Lancet 1963-II, 749 (1963). 2. J. S. Haller, in Reye's Syndrome, J. D. Pollack, Ed. (Grune & Stratton, New York, 1974), p. 3. 3. F. H. Lovejoy, A. L. Smith, M. J. Bresman, J. N. Wood, D. I. Victor, P. C. Adams, Am. J. Dis. Child. 128, 36 (1974). 4. L. Corey and R. J. Rubin, in Reye's Syndrome, J. D. Pollack, Ed. (Grune & Stratton, New York, 1974), p. 179. 5. P. R. Huttenlocher, J. Pediatr. 80, 845 (1972). 6. J. C. Partin, W. K. Schubert, J. S. Partin, N. Engi. J. Med. 285, 1339 (1971). 7. M. S. Cooperstock, R. P. Tucker, J. V. Baubler, Lancet 1975-I, 1272 (1975). 8. Serums were from Massachusetts General Hospital and the Shriners Burns Institute, Boston; the University of Kansas Medical Center, Kansas City; and Denver General Hospital, Denver, Colo. 9. J. R. Aprille, J. A. Hom, J. Rulfs, J. Trauma, 17, 279 (1977). Briefly, mitochondria were isolated from liver homogenates in 0.225M mannitol, 0.075M sucrose, 0.1 mM EDTA, and 10 mM tris-HCl (pH 7.5) by centrifuging at 50(g for 5 minutes; the supernatant was centrifuged at 8000g for 10 minutes. The pellet was washed three times and suspended in the same buffer. 10. B. Chance and G. R. Williams, Nature (London) 176, 250 (1955); J. Biol. Chem. 217, 383 (1955). 11. P. Bjorntorp, H. A. Ells, R. H. Bradford, J. Biol. Chem. 239, 339 (1964). 12. W. H. J. Summerskill, Gastroenterology 66, 450
(1974).
13. L. L. Lansky, M. Fixley, D. A. Romig, P. W. Keitges, M. Boggan, R. L. Reis, Lancet 1974-II, 1019 (1974).
14. R. C. Bobo, W. K. Schubert, J. C. Partin, J. S. Partin, J. Pediatr. 87, 881 (1975). 15. D. E. Green and H. Baum, Energy and the Mitochondrion (Academic Press, New York, 1970), pp. 195-198. 16. J. C. Partin, J. S. Partin, W. K. Schubert, R. L. McLaurin,J. Neuropathol. Exp. Neurol. 34, 425 (1975). 17. R. J. Kessler, C. A. Tyson, D. E. Green, Proc. Natl. Acad. Sci. U.S.A. 73, 3141 (1976); D. R. Hunter, R. A. Haworth, J. H. Southard, J. Biol. Chem. 251, 5069 (1976). 18. I. Boime, E. E. Smith, F. E. Hunter, Arch. Biochem. Biophys. 139, 425 (1970); R. G. Briggs and J. L. Glenn, Lipids 11, 791 (1976). 19. D. M. Woodbury, in The Pharmacological Basis of Therapeutics, L. S. Goodman and A. Gilman, Eds. (Macmillan, New York, ed. 3, 1965), p. 322; W. G. Hanstein, Trends Biochem. 1, 65 (1976). 20. D. W. Reynolds et al., J. Pediatr. 80, 429 (1972). 21. R. G. Rosenfeld and M. I. Liebhaber, Am. J. Dis. Child. 130, 295 (1976). 22. A. M. Glasgow and H. P. Chase, Pediatr. Res. 9, 133 (1975); Biochem. J. 156, 301 (1976). 23. I thank J. Rulfs for technical assistance; J. D. Crawford, W. A. Walker, and R. Sanadi for editing and encouragement; L. Lansky, A. Silverman, W. A. Walker, J. Fisher, and J. Escouru for providing serums and clinical reports; and R. Trelstad and B. Feldman for the electron microscopy. A preliminary report of a portion of these results was presented at the annual meeting of the Americal Association for the Study of Liver Diseases [Gastroenterology 71, 894 (abstr.) (1976)]. Supported by HD 08600. * Present address: Department of Biology, Tufts University, Medford, Mass. 02155. 4 March 1977; revised 22 April 1977
Alcohol Tolerance in a Cholinergic Nerve Terminal: Relation to the Membrane Expansion-Fluidization Theory of Ethanol Action Abstract. Phrenic nerve terminals from rats subjected to long-term ethanol treatment were more resistant to ethanol (in vitro) than terminals from sucrose-fed rats, as measured by the effect of ethanol on the frequency of miniature end plate potentials. Long-term ethanol exposure may thus induce the synthesis of more rigid membrane lipids, reducing membrane "fluidizability." This may provide a neurocellular basis for ethanol tolerance and cross-tolerance with anesthetics and barbiturates.
Although many behavioral and biochemical changes have been found in alcohol-tolerant animals (1), the neurocellular basis of alcohol tolerance and dependence is unclear. Since there have been no reports on the possible development of ethanol tolerance in a single nerve cell, we decided to investigate this by using the phrenic nerve-muscle diaphragm preparation. Of the many direct and acute effects of ethanol and other alcohols on nerve cells (2), one of the more sensitive is the enhancement of spontaneous release of acetylcholine from the cholinergic motoneuron terminal (3, 4). It has been proposed that the cellular basis of this alcohol-induced enhancement (of neurotransmitter release) stems from the membrane-fluidizing action of the drug (5) in association with its membrane-expanding actions (6). Our working hypothesis, therefore, was that the motoneuron terminals of animals subjected to long-term ethanol treatment would ul-
timately become less responsive to ethanol in vitro, on the basis that the "fluidizability" of the terminals would have been altered. The effect of ethanol on the spontaneous release of acetylcholine was measured by monitoring the frequency of miniature end plate potentials (MEPP's) in the rat phrenic nerve-diaphragm preparation, using standard methods (3, 4, 7). The results, shown in Fig. 1, indicate that the phrenic nerve terminals from ethanol-tolerant rats were more resistant to the in vitro application of ethanol than the terminals from sucrose-fed rats. The results are graphed in accordance with the known semilogarithmic relation between ethanol concentration and MEPP frequency (4). Quastel et al. (4) have established that the logarithm of the frequency is linearly related to ethanol concentration; this has been confirmed by others (3) as well as by work in this laboratory, which provides the basis for drawing straight lines SCIENCE, VOL. 197
Downloaded from www.sciencemag.org on January 6, 2008
to those seen in RS. Concentrations of ammonia might be elevated for at least three reasons: urea synthesis is dependent on ATP, two of the urea cycle enzymes are intramitochondrial, and the nitrogen load is augmented because of increased protein catabolism. The results of this study point to a probable RS serum uncoupling factor other than fatty acids that directly affects mitochondrial organization and function. Since the clinical course of RS is consistent with a general disruption of energylinked functions that may be primary in several tissues, it is proposed that the as yet unidentified factor may have an important role in the pathogenesis of RS. This hypothesis immediately suggests three corollaries. (i) Since a typical cell may have several thousand mitochondria, a fairly large or very specific insult may be needed to cause serious impairment of energy-linked functions. Any factor that will affect mitochondrial function may thus be synergistically important in the development of this illness. In some cases, salicylates may have such a role, since they are often given during the prodrome illness and since salicylate metabolites are known uncouplers of oxidative phosphorylation (19). Only 0.1 percent of children contracting the typical viral prodrome develop RS (20), so the possibility of a genetic susceptibility (for example, to the effects or metabolism of uncoupling factors) also must be considered. (ii) A high serum concentration of any cell-permeable uncoupling factor might be expected to initiate the cascade of events leading to an array of symptoms that mimic those seen in RS. In view of this, it should not be surprising that salicylate poisoning per se is often confused with RS (21). Similarly, large doses of free fatty acids, which are known to disrupt mitochondrial energy metabolism (11), will produce RS-like features in animals (22). (iii) Although clinical treatment to remove toxic factors as well as to correct serum ammonia concentrations is indicated, these measures may not result in immediate improvement. Unlike encephalopathies that are secondary to hepatic failure, recovery of the central nervous system from RS will certainly require additional time for mitochondrial regeneration and cell repair.
26 AUGUST 1977
"
_
3 20 _ @
Control
Xr
~~~~~~~41/ /5
X 10 -2/
Ethanol
0-
,5
5
4
0
0.2
-L 0.4
L 0.6
0.8
1.0
1.2
Ethanol (M)
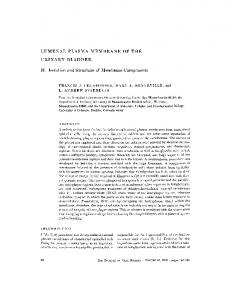
Fig. 1. Ethanol tolerance at a ch olinergicjunction. Ethanol in vitro is less effective in increasing the miniature end p )late potential (MEPP) frequency in phrenic nterve terminals from rats subjected to long-term ethanol treatment. The number next to each data point inisclejunctions junctions dicates the number of nerve-mu sclSe tested at that ethanol concentra tion. The relative MEPP frequency was obtamned by dividing the absolute MEPP frequenIcy by the frequency in the absence of ethan( 1 for that particular fiber. The vertical bars sshow standard error of the mean. The slope (of the control curve is significantly different fr 'om that Of the ethanol curve at P < .005.
Ca2+ (12). With either hyp othesis, one would also expect that the ti me course of the end plate current (13) uvould exhibit tolerance. These results may also b e compatible with the observation (14) thait brain slices from ethanol-tolerant animz lls are more resistant to the actions of aLlcohol in vitro. In such slices, howeverr, the normal action of ethanol is to redu(ce release of acetylcholine rather than to increase it as in the present study; the slice experiments are further complic ated by the presence of nerve impulses Nwhich can be inhibited by ethanol. Finally, since anesthetics and barbiturates also increase the MEF'P frequency (15), and since chronic alcol iolic individuals are known to be toler'ant to anesthetics (16), these present re sults may also provide a neurocellular t asis of such
cross-tolerance.
M. CURRAN
P. SEEMAN
Pharmacology Department, University of Toronto, Toronto, Ontario, Canada AVSS IA8
References and Note s 1. R. D. Hawkins and H. Kalant, P'harmacol. Rev. 24, 67 (1972); H. Kalant, A. E. LeBlanc, R. J. Gibbins, ibid. 23, 135 (1971); r). B. Goldstein, Life Sci. 18, 553 (1976); A. E. L_eBlanc, H. Kalant, R. J. Gibbins, Psychopharnnacologia 41, 43 (1975); J. Engel and S. Liljequi ist, ibid. 49, 253 (1976); S. W. French, D. S. Pal Imer, M. E. Narod, P. E. Reid, C. W. Ramey J. Pharmacol. Exp. Ther. 194, 319 (1975); Y. Issrael, L. Videla, J. Bernstein, Fed. Proc. Fed. Am. Soc. Exp. Biol. 34, 2052 (1975); C. S. Li eber and L. M. DeCarli, Science 162, 917 (1968) ,Res. Commun. Chem. Pathol. Pharmacol. 6, 9183 (1973).
2. H. Kalant, Fed. Proc. Fed. Am. Soc. Exp. Biol. 34, 1930 (1975). 3. K. Okada,Jpn. J. Physiol. 17, 245 (1967); P. W. Gage, J. Pharmacol. Exp. Ther. 150, 236 (1965); K. Kuba, Jpn. J. Physiol. 19, 762 (1969); J. P. Gallagher and L. C. Blaber, J. Pharmacol. Exp. Ther. 184, 129 (1973). 4. D. M. J. Quastel, J. T. Hackett, J. D. Cooke, Science 172, 1034 (1971). 5. J. C. Metcalfe, P. Seeman, A. S. V. Burgen, Mol. Pharmacol. 4, 87 (1968); J. C. Metcalfe and A. S. V. Burgen, Nature (London) 220, 587 (1968); W. L. Hubbell and H. M. McConnell, Proc. Natl. Acad. Sci. U.S.A. 61, 12 (1968); S. J. Paterson, K. W. Butler, P. Huang, J. Labelle, 1. C. P Smith, H. Schneider, Biochim. Biophys. Acta 266, 597 (1972); J. E. Trudell, W. L. Hubbell, E. N. Cohen, ibid. 291, 321 (1973); M. W. Hill, ibid. 356, 117 (1974); P. Seeman and T. Lee, J. Pharmacol. Exp. Ther. 190, 131 (1974); M. W. Hill and A. D. Bangham, Adv. Exp. Med. Biol. 59, 1 (1975). 6. P. Seeman, Int. Rev. Neurobiol. 9, 145 (1966);
and S. Roth, Biochim. Biophys. Acta
255, (1972); 171 (1972); P. Seeman, 24, 583 Experientia 30, Pharmacol. 759 (1974); I.Rev. Ueda, D. D. Shah, H. Eyring, Anesthesiology 41, 217
(1974); J. J. Kendig, J. E. Trudell, E. N. Cohen,
J.
Pharmacol. Exp.(100Ther. 195, fed 216 a(1975). 7. Male Wistar rats g) were limited Purina Chow diet with unlimited access to water.
Ethanol-treated rats were intubated at 10- to 12hour intervals, starting with 5 g of ethanol per kilogramwith per12day (25 day-' percentafter by 4volume) ending g kg-' weeks. and Su-
crose-control rats were matched in weight gain with the ethanol-treated rats and intubated with an isocaloric amount of sucrose. were almost at the start of treatment all animalsSpecifically, identical in weight. The ethanol-fed animals gained weight, but less than would be seen on a diet provided ad libitum. Since nutrition could influence the results, all animals were weighed every day and the average weight of each group was calculated. The diet given to the sucrose-fed rats was thus adjusted so that the average weights of both sets of animals were always the
same. Animals were killed 4 hours after the last
intubation. The hemidiaphragm was perfused at approximately 21°C [S. D. Cooke and D. M. J. Quastel, J. Physiol. (London) 238, 377 (1973)] with oxygenated Krebs solution modified by isosmotically raising Mg2+ to 12 mM and reducCa2+ to 1.2 mM. Before the electrical meaing surements were begun, the tissue was perfused for at least 45 minutes to ensure that absolutely no residual ethanol remained; in general, equilibration of ethanol only requires less than I min-
ute (3,glass 4). microelectrodes Surface muscle with fibersresistances were impaled with of 5
to 15 megohms. The MEPP's were fed through a
Grass amplifier andorcounted withona HewlettP165301 Packard counter recorded film and counted manually. That such ethanol treatment did in fact produce physical dependence was
confirmed in separate experiments where it was observed that the rats convulsed on withdrawal of the ethanol. 8. J. H. Chin and D. B. Goldstein, Fed. Proc. Fed.
Am. Soc. Exp. Biol. 35, 707 (1976).
9. D. Chapman, Q. Rev. Biophys. 8, 185 (1975). 10. M. Chau-Wong and P. Seeman, Biochim.
241, J.473T.(1971). 11. Biophys. D. M. J. Acta Hackett, K. Ikamoto, Quastel, Can. J. Physiol. Pharmacol. 50, 279 (1972). 12. P. Seeman, M. Chau, M. Goldberg, T. Sauks, L. Sax, Biochim. Biophys. Acta 225, 185 (1971); M. Kondo and M. Kasai, ibid. 311, 391 (1973); T.-C Peng and H. J. Gitelman, Endocrinology 94, 608 (1974).
13. J.P. Quastel W. Gage,andPhysiol. Rev. 56, 177 (1976); D. M. T. M. Linder, Prog. Anesthesiol.
1, 157 (1975); P. B. J. Woodson, M. E. Traynor, W. T. Schlapfer, S. H. Barondes, Nature (London) 260, 797 (1976).
14. H. Kalant and W. Grose, J. Pharmacol. Exp. Ther. 158, 386 (1967). 15. B. F. Westmoreland, D. Ward, T. R. Johns, Brain Res. 26, 465 (1971); S. A. Turkanis and T. D. Thomson, Proceedings of the Fifth International Congress of Pharmacology (1974), p. 238. 16. Y. H. Han, Anesthesiology 30, 341 (1969). 17. We thank H. Atwood, H. Kalant, and L. Endrenyi for their expert advice and for the loan of equipment. Supported by the Alcohol and Drug Addiction Research Foundation of Ontario, the Medical Research Council of Canada (MT2951), and the Ontario Mental Health Foundation. 11 February 1977; revised 19 April 1977 911
Downloaded from www.sciencemag.org on January 6, 2008
in Fig. 1. This straight line monotonic relation ranges from very low ("physiological") to very high concentrations of ethanol and is generally thought to represent a single process (such as promotion of fusion of presynaptic vesicles to the presynaptic membrane). Thus, the general assumption (3, 4) is that what one measures at high ethanol concentrations may pertain to the lower physiological ethanol concentrations. There are values missing at 0.2M (ethanol group) and at 1.2M (controls) in Fig. 1; insufficient measurements were made at these two points, and drifts of the resting potentials by more than 10 mv artifactually altered the MEPP frequency. Since different nerve terminals had different control MEPP frequencies (that is, in the absence of ethanol), it was necessary to express the MEPP frequency (in the presence of ethanol) relative to the control value by simply dividing the two frequencies. In Fig. 1, the slope for the sucrose-fed controls is 1.46, while that for the ethanol-treated animals is 1.16; using Student's t-test, these are significantly different (P < .005). The absolute MEPP frequency for all the control junctions of the sucrose-fed rats was 1.21 + 0.10 sec-' (mean ± standard error of the mean), while that for the junctions of the ethanol-tolerant rats (but in the absence of ethanol in vitro) was 1.09 + 0.08 sec-'. Although this 10 percent reduction is suggestive of a "dependence" on ethanol, this difference was not statistically significant. A significant difference between control and ethanol-tolerant junctions was only brought out on addition of ethanol. The results reported here are in accordance with the finding that erythrocyte and brain synaptosome membranes from ethanol-tolerant animals are more resistant to the fluidizing action of ethanol, as monitored by the electron paramagnetic resonance technique (8). The natural fluidity of biomembranes primarily depends on the membrane lipid composition (9), which is under metabolic control. Since alcohols are known to increase membrane fluidity, the long-term ethanol exposure might cause the cell's metabolism to produce "stiffer" membrane lipids. Such inflexible lipids might be less fluidizable by ethanol. If this hypothesis is true, such lipids should be detectable in a wide variety of body tissues. Since Ca2+ is critical both for membrane rigidity (2, 10) and for the process which releases the acetylcholine from the vesicles (I1), an alternative hypothesis is that the long-term ethanol treatment modulated the membrane-bound