The Missing Links Uganda’s Economic Reforms and Pro-Poor Growth Report commissioned by Deutsche Gesellschaft für Technische Zusammenarbeit (GTZ) By Robert Kappel, Jann Lay, Susan Steiner
February 2004
Abstract: This report analyses the direct and the indirect channels of achieving pro-poor growth for the case of Uganda where high economic growth rates and remarkable poverty reduction have coincided since the late 1980s. We find that the Ugandan population experienced important broad-based welfare gains in terms of consumption during the 1990s. Yet, this trend does not appear to be sustainable, as large parts of the population saw their welfare levels decline recently. Despite overall growth, poverty increased between 2000 and 2003. In other words, growth has been pro-poor in the 1990s, whereas growth in recent years has been accompanied by a substantial increase in inequality and has hence not led to further poverty reduction. We first examine the direct way of pro-poor growth, which implies that growth will be pro-poor if it takes place in those sectors of the economy where the poor are employed. In Uganda, these are predominantly the agricultural and the micro and small enterprises sectors. We observe that the success in terms of reduced poverty in the 1990s can to a large extent be traced back to high growth in agriculture. However, the recent decline in agricultural growth and the related increase in poverty suggest that the agricultural sector is struggling with a number of important constraints. The sector as a whole as well as individual households have not sufficiently diversified in order to bolster external price shocks or adverse climatic conditions. Besides, farmers lack access to productive infrastructure, to financial markets and, most importantly, to land. With regard to micro and small enterprises, we find that employment in this sector can be key for escaping poverty. However, many enterprises face a number of institutional distortions and capacity constraints that undermine profit seeking entrepreneurial behaviour and the growth of small firms. We then turn to the indirect way of pro-poor growth, which is achieved if the gains from growth are redistributed by the public sector in such a way that the welfare of the poor is increased and/or they are given the opportunity to move out of poverty permanently. This implies the adoption of a progressive tax system and targeted government spending on the poor. It turns out that Uganda has made several steps in order to realize pro-poor growth in the indirect way over the past decade. It has increased expenditures for poverty-reducing programs, and has employed a progressive tax system. However, serious problems in terms of targeting public spending, improving the quality of public services and increasing tax revenues prevail.
Keywords: Growth, Poverty, Uganda JEL Classification: I32, I38, O4, O10
2 Authors: Robert Kappel, Economist, Prof. Dr., University of Leipzig, head of post-graduate programme „small enterprise promotion and training“ (sept) and Department of African Studies, Beethovenstr. 15, 04107 Leipzig, Germany Email:
[email protected]
Jann Lay, Economist, Kiel Institute for World Economics, Düsternbrooker Weg 120, 24105 Kiel, Germany Email:
[email protected]
Susan Steiner, Economist, Institute of African Affairs, Neuer Jungfernstieg 21, 20354 Hamburg, Germany Email:
[email protected]
3
Contents 1
OBJECTIVES OF THE STUDY AND MAJOR FINDINGS ........................................................... 8
2
UGANDA’S ECONOMIC PERFORMANCE SINCE 1987 ........................................................ 11
3
GROWTH AND POVERTY REDUCTION IN UGANDA........................................................... 19
4
3.1
Findings from the Uganda participatory poverty assessment process ..................... 21
3.2
Household survey based evidence............................................................................ 23
3.3
Reconciling household survey based and participatory approaches ........................ 33
CHANNELS OF PRO-POOR GROWTH IN UGANDA ............................................................. 36 4.1
The direct way: Poverty reduction through growth in the private sector................. 36
4.1.1
The financial framework for the private sector................................................ 41
4.1.2
Agriculture ....................................................................................................... 43
4.1.3
Policy recommendations for the agricultural sector........................................ 49
4.1.4
Micro and small enterprises............................................................................. 51
4.1.5
Policy recommendations for MSE.................................................................... 69
4.2
The indirect way: Poverty reduction through redistribution .................................... 71
4.2.1
Public expenditure............................................................................................ 71
4.2.2
Access and quality concerns of public services ............................................... 75
4.2.3
Public revenue.................................................................................................. 87
4.2.4
Policy recommendations .................................................................................. 91
5
CONCLUSION .................................................................................................................... 92
6
BIBLIOGRAPHY ................................................................................................................ 95
4
Tables Table 1: Sectoral growth, 1997/98-2001/02 (percent) ............................................................. 13 Table 2: Trade balance, 1997/98 – 2002/2003 (million US$).................................................. 16 Table 3: Trade balance without coffee, 1997/98 – 2002/2003 (million US$) ......................... 16 Table 4: Poverty reduction and growth in an international perspective................................... 20 Table 5: Poverty and inequality indicators............................................................................... 24 Table 6: Contribution to national poverty and population shares ............................................ 25 Table 7: Rural-urban disparities............................................................................................... 25 Table 8: Regional disparities.................................................................................................... 26 Table 9: Regional disparities, changes in decomposed Theil index ........................................ 26 Table 10: Inequality within regions, 1992/93 – 2002/03 ......................................................... 27 Table 11: Decomposition of poverty reduction into growth and distribution components, 1992/93 – 1999/00............................................................................................................ 31 Table 12: Decomposition of poverty reduction into growth and distribution components, 1992/93 – 2002/03............................................................................................................ 32 Table 13: Sectoral poverty profile and decomposition of poverty changes, 1992/93-1999/00 36 Table 14: Sectoral poverty profile and decomposition of poverty changes, national level, 1999/00-2002/03 .............................................................................................................. 38 Table 15: Sectoral poverty profile and decomposition of poverty changes, rural areas, 1999/00-2002/03 .............................................................................................................. 39 Table 16: Sectoral poverty profile and decomposition of poverty changes, urban areas, 1999/00-2002/03 .............................................................................................................. 40 Table 17: Definition of micro and small enterprises in business register ................................ 52 Table 18: Number of businesses registered.............................................................................. 52 Table 19: Branches and number of enterprises surveyed......................................................... 55 Table 20: Monthly turnover by urban and rural MSE (percentage shares).............................. 56 Table 21: Type of expansion.................................................................................................... 57 Table 22: Increases in income over past five years per branch (percent of surveyed enterprises) ....................................................................................................................... 58 Table 23: Increases in employment per branch over past five years (percent of surveyed enterprises) ....................................................................................................................... 59 Table 24: Rural – urban gap of perception of constraints (Percent of surveyed enterprises) .. 61 Table 25: Perception of constraints per branch (Percent of surveyed enterprises) .................. 61 Table 26: Relevance of vocational training.............................................................................. 65 Table 27: Social embeddedness: where to meet people who are important for the business (percent) ........................................................................................................................... 67 Table 28: Reactions to contract breaching ............................................................................... 67
5 Table 29: PAF expenditures (billions of USh)......................................................................... 74 Table 30: Share of PAF programs in sectoral expenditure ...................................................... 75 Table 31: Share of children between 7 and 13 not enrolled in school, by sex and consumption quintiles ............................................................................................................................ 77 Table 32: Number of students in primary, secondary, and tertiary school, 2002/03 ............... 78 Table 33: Benefit incidence of public spending on education, 2002/03 .................................. 79 Table 34: Selected health indicators, 1995 and 2000/01.......................................................... 81 Table 35: Share of people without treatment in case of illness, by consumption quintiles ..... 81 Table 36: Reasons why people did not seek medical treatment, by consumption quintiles .... 82 Table 37: Type of attended health facility, 2002/03 ................................................................ 83 Table 38: Benefit incidence of public spending on health, 2002/03........................................ 84 Table 39: Type of main water source, 2002/03 (percent) ........................................................ 86 Table 40: Sources of PAF resources (share of total resources)................................................ 90
6
Figures Figure 1: Annual GDP growth, 1983-2001 (percent) .............................................................. 12 Figure 2: Annual GDP growth per capita, 1983-2001 (percent).............................................. 13 Figure 3: Gross domestic and gross private investment, 1990-2001 (percent of GDP)........... 14 Figure 4: Net foreign direct investment, 1990-2001 (current prices) ...................................... 15 Figure 5: Composition of main agricultural exports, 1992/93-2001/02 (value in USh) .......... 15 Figure 6: Export and import unit value indices and terms of trade (1995=100)...................... 16 Figure 7: Current account balance, 1990-2001 (percent of GDP) ........................................... 17 Figure 8: Budget deficit, public revenue and expenditure, 1992-2001 (percent of GDP) ....... 17 Figure 9: Net official development aid, 1990-2001 (percent of GDP) .................................... 18 Figure 10: Consumption changes by percentile, national ........................................................ 28 Figure 11: Consumption changes by percentile, rural.............................................................. 29 Figure 12: Consumption changes by percentile, urban ............................................................ 30 Figure 13: Annual production growth rates in agriculture, 1992/93-2000/01 (percent).......... 44 Figure 14: Average producer prices for coffee and cotton, 1993-2001 (USh) ........................ 46 Figure 15: Year of establishment ............................................................................................. 55 Figure 16: Distribution of monthly turnover, 2003.................................................................. 56 Figure 17: Monthly turnover per branch (percentage share).................................................... 56 Figure 18: Income growth during the last five years ............................................................... 57 Figure 19: Employment growth during the last five years....................................................... 58 Figure 20: Ranking of perception of constraints to investment ............................................... 60 Figure 21: Main obstacles when business was started and when it was running..................... 62 Figure 22: Subcontractor with a larger company ..................................................................... 63 Figure 23: Educational level of entrepreneurs ......................................................................... 64 Figure 24: Sources of start-up capital ...................................................................................... 66 Figure 25: Public expenditure per GDP, 1992/93-2001/02 (Expenditure and GDP in billion Ush) .................................................................................................................................. 73 Figure 26: Tax revenue as share of total tax revenue, 1992/93 and 2001/02........................... 88
7
Acknowledgements This work has been commissioned by the GTZ. We thank the GTZ office in Kampala for their organisational support during our research in Uganda, the Uganda Bureau of Statistics for the provision of household survey data, John Okidi (Economic and Policy Research Centre), Sudharshan Canagarajah (World Bank, Uganda Country Office), John MacKinnon (Ministry of Finance, Planning and Economic Development) and all our interview partners for their openness and friendliness. We appreciated the fruitful cooperation with Peter Otim, David Lameck Kibikyo and their colleagues at the Centre for Basic Research in Kampala. In particular, we thank Charity Kyomugisha, Claire Kyasimire, John Muloki, Juliet Kanyesigye, Jennifer Nalugonda, Ms. Ariko, and Felicitas Mukurarinda, who carried out the survey of micro and small enterprises. We are grateful to Hans Hoogeveen, Martin Ravallion, Michael Lokshin, and William Steel at the World Bank for helping with the data and comments, and Stephan Klasen at the University of Munich who made suggestions and commented parts of this study. We also benefited from comments by Ulrike Männer, Hartmut Janus, and Achim Blume of the GTZ as well as several participants of workshops at the GTZ in Eschborn, at the German Ministry of Cooperation and Development (BMZ) in Bonn, and at workshops in Kampala (amongst others Peter Rode, Gabriela Braun, Dorothee Hutter, H. Günter Schröter, and Matthias Giersche). Besides, we thank the participants of the international workshop “Attacking Poverty: What Makes Growth Pro-poor?” at the HWWA in Hamburg (7-9 May 2003), where the authors presented the paper “Solving the Puzzle – How the Poor Benefit from Growth in Uganda”, for their comments and suggestions. We acknowledge with appreciation the people who supported us in various forms while writing this study, amongst others Andreas Mehler and Rolf Hofmeier (Institute of African Affairs, Hamburg), Ute Rietdorf, Karin Jansen, Michaela Meier and Anja Schrödter (Department of African Studies, University of Leipzig), Gernot Klepper and Toman Omar Mahmoud (Kiel Institute for World Economics).
8
1
Objectives of the study and major findings
In the second half of the 1990s, poverty reduction became the superior objective of all development efforts. With the introduction of poverty reduction strategy papers (PRSP) in 1999, donors found a way to institutionalise the approach in their dealings with developing countries. PRSP describe a country's macroeconomic, structural and social policies and programs to promote growth and reduce poverty, as well as associated external financing needs. PRSPs are prepared by the respective governments through a participatory process involving civil society and development partners. The academic world on the other hand has focused on an intensive debate about the theoretical and empirical aspects of poverty. Different operational approaches to measure poverty have been discussed; experiences of numerous countries as well as lessons learnt have been evaluated. In assessing the relationship between economic growth, inequality and poverty, pro-poor growth has turned out to be one of the principal research topics. As is well known, the most important condition for poverty reduction is economic growth. Despite the fact that growth is in most cases good for the poor the degree of poverty reduction following growth differs remarkably across countries1 and across time, as the Ugandan example shows. It is important to understand how growth translates into poverty reduction, and why growth has differential effects on poverty. This is why pro-poor growth can be a useful concept in devising policies that foster growth and reduce poverty. Kakwani and Pernia (2000) define pro-poor growth as growth that “enables the poor to actively participate in and significantly benefit from economic activity”. Klasen (2003) suggests that there are two possible ways to achieve pro-poor growth. The socalled direct way implies that growth is pro-poor if it immediately raises the incomes of the poor, or in other words, growth that favours those sectors and/or regions where the poor are employed, and that uses the factors of production they possess. It is widely accepted that growth has to be strong in agriculture, non-farm rural, and informal sector activities to be propoor. It must be labour-intensive and land-intensive, and it must be concentrated in localities with high poverty rates. The indirect way refers to a situation, in which the gains from overall economic growth are redistributed via progressive taxation and targeted government spending on the poor. This spending can take the form of financial transfers, or investment in the assets of the poor. Financial transfers immediately increase the poor’s disposable income and thus welfare. Nevertheless, investments in the assets of the poor are clearly preferable as they durably enable the poor to better participate in and benefit from economic activities without making them dependent on welfare programs. This report analyses these two channels of achieving pro-poor growth for the case of Uganda where high economic growth rates and remarkable poverty reduction coincided during the 1
See Ravallion (2001) for cross-country differences and Ravallion (1999) for differences between India’s states.
9 past decade. The analysis is based on an evaluation of local and international sources, interviews with experts, researchers, government officials, professionals of NGOs and the donor community, an in depth analysis of household survey data2, plus a survey of 260 micro and small enterprises (MSE) in Kampala and other major urban centres.3 The report is structured as follows. In Chapter 2, we review Uganda’s overall economic performance since the mid-1980s. We find that Uganda is an exceptionally successful African country. Post-war recovery was associated with reactivating existing capacities, and economic and institutional reforms have triggered high growth rates. The most important reforms include the liberalisation of the trade regime, and the elimination of marketing boards. For a considerable time, Uganda enjoyed a supportive external environment with stable or rising prices of the main export products and received high inflows of flight capital and official development aid (ODA). However, the terms of trade have been deteriorating and growth rates have been declining in recent years. In Chapter 3, we assess recent trends in poverty and inequality. During the 1990s, high economic growth rates have been associated with a strong reduction in poverty. Our findings indicate that this growth can clearly be classified as pro-poor based on consumption-based household survey evidence. However, recently released evidence from household survey reveals that poverty has been rising since 2000 despite overall economic growth, which implies that inequality has increased considerably. Yet, from a long-term perspective, growth in Uganda can still be considered as pro-poor. Divergence between regions that could already be observed during the 1990s has continued in recent years. Rural-urban disparities are widening, as urban growth has been stronger than rural growth, and the North is lagging far behind the rest of the country. Even before the publication of the recent poverty trends, participatory poverty assessments had shown that the consumption gains of the 1990s rest on fragile foundations. People feel more vulnerable and insecure than before, as they have not been able to accumulate productive assets to sustain higher consumption levels. Additionally, natural resource degradation and environmental shocks threaten food security. Gender inequality also remains a major problem, and the situation of women has not improved significantly in the 1990s. Chapter 4 forms the core part of this report. There, we analyse how pro-poor growth has been generated in Uganda and shed some light on the possible causes of the recent setback in 2
Household survey data of the Uganda Bureau of Statistics (UBOS) from 1992/93 – 2002/03 were evaluated. With regard to the survey data, the reader should note that the results, in particular of the most recent 2002/03 survey, may be subject to changes. In addition, the consumption (expenditure) data for 1999/2000 has been adjusted recently. These adjustments are not taken into account in our analysis. In addition, some further investigation into appropiate deflation factors is needed. Although some results of the study are therefore of a preliminary character, we are, however, confident that the principal findings that emerge from our analysis are robust with regard to these possible sources of error. 3
The MSE survey was run in March and April 2003 by the authors and researchers of the Centre for Basic Research (CBR), Kampala.
10 poverty reduction. We examine the constraints to pro-poor growth and consider future challenges in order to derive policy conclusions relevant to public authorities as well as to donors. In addressing these issues, we consider the direct and the indirect way of pro-poor growth. We start with an overview of the financial sector as the framework for private sector activities. Then, we examine the evolution of the agricultural and the micro and small enterprises sectors over the past decade because these are the sectors where most of the poor are employed in Uganda. In order to achieve pro-poor growth in the direct way, economic growth has to take place in these sectors. The sectoral analysis of poverty and poverty trends illustrates that the successes in poverty reduction in the 1990s had indeed been due to high growth in agriculture. High growth rates had been a result of the restoration of peace, economic liberalization, rising world commodity prices, and increasing domestic and foreign demand, but not a result of a direct pro-poor growth strategy. The recent decline in agricultural growth casts doubts on whether the economic reforms have provided a basis for sustained agricultural growth. Negative price shocks in the agricultural sector and the related bad performance of the sector may be the major cause of the recent deterioration of the poverty situation. Our analysis shows that rising poverty among agricultural households has significantly contributed to the recent poverty increase. The impact of slower agricultural growth and declining prices could have been worse, had people not switched from agriculture into other activities. Another problem of the agricultural sector is its lack of diversification, which leaves Uganda and its farmers vulnerable to external shocks. Until now, there is no breakthrough with regard to the diversification of agriculture, except for the successful performance of the fish sector and a few other strategic export products (beans, flowers, Irish potatoes). However, the effect on poverty reduction is limited because of small size of these sectors in terms of employment. Household income diversification is not deep enough and many farmers live in remote areas, are still engaged in subsistence agriculture, lack access to productive infrastructure and to markets. In addition, agricultural households face important constraints on capital and land markets. Land shortage is a problem in particular for large households and women. The survey of micro and small enterprises (MSE) shows how they contribute to growth and poverty reduction. We argue that the key to poverty reduction is creating productive jobs there where poor people live. Finding a job or establishing a small enterprise, or even microenterprise can be key for escaping poverty. The survey of 260 MSE in Uganda demonstrates that pro-poor growth should not only centre on means to provide opportunities to poor people (by providing access to health and education systems, access to land and credit), but to employ policy interventions of other types as well. For poor people, the accumulation of physical and human capital is a necessary but not a sufficient condition. What are also needed are capable institutions, markets, incentive systems, support programs and an industrial policy.
11 With regard to the indirect way of pro-poor growth, we find that the Ugandan government targets public expenditures relatively well on previously identified poverty priority areas. Primary education, primary health care, feeder roads, protected water sources, and agricultural extension services have received increasing resources over time. As a consequence, poor people’s access to most of these public services has improved. Access to primary health care and extension services is still insufficient. However, serious quality concerns prevail for all these five areas. Despite having a progressive tax system, Uganda’s performance with regard to tax revenue collection is rather poor. The country is not able to collect sufficient tax revenue in order to provide the financial resources required for maintaining its expenditure level. Therefore, it depends heavily on foreign aid. For this reason, we deduce that indirect pro-poor growth is currently only achieved to a very limited extent. Chapter 5 provides a conclusion of the whole study.
2
Uganda’s economic performance since 1987
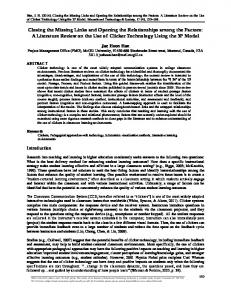
Uganda is regarded to be one of Africa’s best reformers; the country is considered a showcase or even a model (Financial Times 15 April 2003). Its overall positive perception indicates that Uganda is performing better than many of its African counterparts although the country is land-locked and has been confronted with many obstacles during the post-war period. Uganda realised high economic growth rates during the past 16 years, and its growth record can be roughly divided into two periods: post-war recovery and economic reforms (Bigsten and Kayizzi-Mugerwa 2001, Collier and Reinikka 2001, Dijkstra and van Donge 2001, Hansen and Twaddle 1998). After the predations of Idi Amin and three other transient presidents as well as a civil war, the mass emigration of skilled workers, and mass murder, Uganda’s economy recovered quickly and achieved considerable growth rates (Figure 1). According to World Bank figures, Ugandan GDP grew by 6.1 percent annually between 1986 and 1990. GDP per capita growth during that period was at 3.0 percent, as the population grew quickly. However, there was little capital accumulation, and growth stemmed mainly from productivity growth. The rise in productivity was due to the reactivation of production capacities that had been unused during the years of war and to the return of flight capital of Ugandan-Asian entrepreneurs (Berthélemy and Söderling 2001). After this period of recovery, it was Uganda’s reform program starting at the turn of the decade that triggered high GDP growth. The annual GDP growth rate between 1990 and 2000 was 6.3 percent, hence even slightly higher than growth in the late 1980s. As Figure 1 shows, growth however slowed down somewhat during the second half of the 1990s. Economic reforms of all types were adopted with a high commitment by the Ugandan government. The economy was stabilised and liberalised, thereby improving the incentive structure such that Uganda was able to sustain high growth rates throughout the 1990s. Inflation was reduced from more than 100 percent in 1987 to single-digit figures. Another outcome of the reform
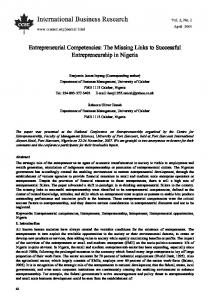
12 period was the shift of production from the public to the private sector. The share of private capital formation increased from 7 percent of GDP in 1989/19904 to 13 percent in 1998/1999 whereas the public capital formation declined from 7 percent of GDP to 5 percent during the same period (Devarajan, Dollar, and Holmgren 2001). In addition, the banking sector was restructured in order to make it more efficient. Other sectoral reforms contributed to the liberalisation and stabilisation of the economy. These included budget reforms, and the elaboration of the Plan of Modernisation of Agriculture (PMA), of the Medium-Term Competitive Strategy for the Private Sector (MTCS), of the Strategic Export Programme (STRATEX), and of the Strategic Export Intervention Programme (SEIP). Economic reforms were accompanied by important institutional reforms, such as decentralisation efforts, abolishing of state-owned marketing boards, and a restructuring of the public administration. Beside these internal factors, favourable world market prices for coffee and high inflows of official development aid (ODA) played an equally important role in achieving growth rates above the Sub-Saharan average. Figure 1: Annual GDP growth, 1983-2001 (percent) 14 12 10 8 6 Uganda
4
Sub-Saharan Africa
2 0 -2
1983
1987
1991
1995
1999
-4 -6
Source: African Development Indicators 2003, World Bank.
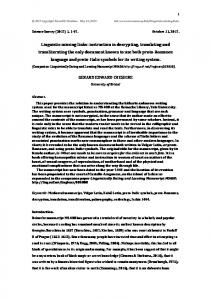
Due to high population growth GDP per capita grew at 3.3 percent on average during the 1990s (Figure 2). In the second half of the 1990s, however, per capita growth decreased somewhat due to the declining GDP growth. As Uganda’s population grows at an extraordinarily high rate of 3.4 percent, sustained GDP per capita growth requires economic growth rates well above this level.
4
The fiscal year in Uganda starts on July 1.
13
Figure 2: Annual GDP growth per capita, 1983-2001 (percent) 10 8 6 4 2 0 -2 1983
1987
1991
1995
1999
-4 -6
Source: Own calculations based on data from African Development Indicators 2003, World Bank.
More recent figures on the Ugandan growth performance indicate that the declining trend in growth rates appears to continue. According to the Ugandan Bureau of Statistics (UBOS), the economy grew at 5.3 percent annually between 1999/00 and 2002/03 (Ugandan fiscal years). Combined with population growth still at very high levels, this results in per capita growth slightly below 2 percent during the same period. As the analysis of the link between growth and poverty below will show, per capita growth rates of around 2 percent will not lead to significant poverty reduction without exceptionally pro-poor distributional shifts, i.e. the overall income increases would result exclusively from increases in the incomes of the poor. Table 1 shows sectoral growth rates for the period 1997-2002. In all years, both the monetary and the non-monetary agricultural sectors grew less than the industrial and the service sectors. This is alarming because the Ugandan economy depends heavily on the agricultural sector, and the overwhelming majority of the population lives in rural areas and is employed in agriculture. Table 1: Sectoral growth, 1997/98-2001/02 (percent)
Sector Monetary agriculture Non-monetary agriculture Industry Services Total GDP at factor costs
1997/98 2.5 1.2 11.5 8.4 5.2
1998/99 6.6 4.9 12.0 6.9 7.4
1999/00 5.2 6.1 5.3 6.3 5.8
2000/01 4.3 5.0 6.1 7.2 5.9
2001/02 6.1 3.8 7.0 6.8 6.2
Source: Bank of Uganda, IMF.
Surprisingly, Uganda achieved high growth that is well above the Sub-Saharan average with an investment rate that is below the regional average. Between 1990 and 2001, gross domestic investment in Uganda amounted to an annual average of 16.5 percent compared to 17 percent in Sub-Sahara Africa. Gross private investment adds up to only 10.4 percent compared to 11.5 percent, which reflects Uganda’s unfavourable investment climate. Low market integration, insecurity problems, landlockedness, poor public infrastructure, and insufficient institutional
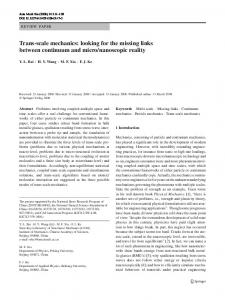
14 reforms discourage investors from operating there (Keefer 2000). Nevertheless, as Figure 3 shows the situation seems to be improving as both gross domestic investment and private investment constantly increased during the past few years. A large part of this investment took place in the construction sector in order to restore the infrastructure, which had been heavily destroyed during the war. It was mainly concentrated in the country’s capital. With a relatively low investment rate, high growth has to be attributable to productivity increases to a large extent. In fact, capital productivity was very high, with an average ICOR of 2.2 in the 1980s, 2.5 in the 1990s, and 3.7 in 2000-02. On the one hand, this reflects the excess capacity that existed and could be used right after the end of the war. It indicates a period of fast catching-up and increased capacity utilisation (Bigsten and Kayizzi-Mugerwa 2001). On the other hand, however, a rising ICOR is an indication of rising inefficiency of investment (Easterly 2003). Due to low incomes, poor access to financial services, and a low savings propensity, the savings rate was very low. Between 1990 and 2001, average gross domestic savings amounted to only 4.4 percent of GDP annually, compared to 16.2 percent in Sub-Sahara Africa. In the same period, gross national savings amounted to 8.9 percent of GDP, which points out high flows of remittances, of returning capital, and of donor aid (White and Dijkstra 2003, IMF 2003b).
Figure 3: Gross domestic and gross private investment, 1990-2001 (percent of GDP) 25 20 15
Gross domestic investment
10
Gross private investment
5 0 1990
1992
1994
1996
1998
2000
Source: African Development Indicators 2003, World Bank.
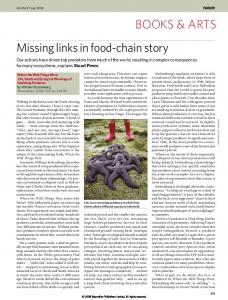
As mentioned above, Uganda launched a comprehensive economic reform program in the course of the 1990s. These reforms have induced supply side incentives, and Uganda has attracted an increasing number of foreign investors since 1996 (Figure 4). Similarly, the economy has been opened up to foreign trade. At the beginning of the 1990s, the marketing boards’ monopoly on coffee, tea and cotton were abolished, which caused a rise in producer prices and a surge in production. Thereby, Uganda regained its position as Africa’s leading coffee exporter. In addition, the number and the level of import and export tariffs were significantly reduced making Uganda one of the most open economies of the Common Market for Eastern and Southern Africa (COMESA). Consequently, trade in all kinds of
15 goods increased but the export sector has not yet diversified sufficiently in order to become less vulnerable to sharp price fluctuations.
Million US$
Figure 4: Net foreign direct investment, 1990-2001 (current prices) 200 180 160 140 120 100 80 60 40 20 0 1990
1995
2000
Year
Source: African Development Indicators 2003, World Bank. Figure 5: Composition of main agricultural exports, 1992/93-2001/02 (value in USh) 800 700 600
Total exports
500
Coffee
400
Cotton
300
Tea Fish
200 100 0 1992/93 1993/94 1994/95 1995/96 1996/97 1997/98 1998/99 1999/00 2000/01 2001/02
Source: Uganda Bureau of Statistics, 2003; Bank of Uganda.
Ugandan exports are mainly composed by agricultural products, like coffee, cotton, tea, and fish. Uganda’s economy is exposed to external shocks, as world prices for agricultural products tend to be volatile. Until 1994/95, coffee accounted for almost all Ugandan exports but its share declined dramatically thereafter. This was due to falling world coffee prices, whereas the quantity of exported coffee hardly diminished. In contrast, non-traditional exports like fish and fish products, tobacco, flowers, beans, hides & skins, and maize gained more and more weight in Ugandan exports, and fish might even become the country’s future main export product. Export shares of cotton and tea grew only slightly in the same period. Generally spoken, the share of traditional agricultural products in Ugandan exports decreased sharply during the 1990s (figure 5), while non-traditional exports gained higher share. Non-
16 agricultural exports of merchandise are oil re-expors, gold, electricity, and textiles. Of high importance is also the export of services, incl. tourism, with a share of 32 percent of total exports. By comparing the export unit value index with the import unit value index, the unfavourable development of the terms of trade in Uganda can be seen (Figure 6). Since 1997, the export unit value index has been falling, particularly because of the sharp price fall of coffee, whereas the import unit value remained almost constant. As a result, the terms of trade have constantly deteriorated. Figure 6: Export and import unit value indices and terms of trade (1995=100) 120 100 80
export unit value index
60
import unit value index
40
Terms of Trade
20 0 97/98
98/99
99/00
00/01
01/02
Source: IMF 2003.
Not surprisingly, Uganda’s trade balance was negative. Table 2 shows that the deficit of the trade balance has even increased over the past years. Table 3 suggests that, by excluding coffee as the main export product, this deficit appears to be bigger but relatively constant. It therefore seems that the price reduction for coffee was the principal cause for the deterioration of the deficit. Table 2: Trade balance, 1997/98 – 2002/2003 (million US$)
Exports Imports Deficit
1997/98 458.4 966.1 -507.7
1998/99 549.1 1039.4 -490.3
1999/00 454 977.8 -523.8
2000/01 441.8 973.3 -531.5
2001/02 456.4 1084.7 -628.3
2002/03 540.2 1208.6 -668.4
Source: IMF 2002. 2002/03 estimated figures. Table 3: Trade balance without coffee, 1997/98 – 2002/2003 (million US$)
Non-coffee exports Imports Deficit (without coffee)
1997/98 189.5 966.1 -776.6
Source: IMF 2002. 2002/03 estimated figures.
1998/99 242.4 1039.4 -797
1999/00 267.1 977.8 -710.7
2000/01 332.1 973.3 -641.2
2001/02 372.4 1084.7 -712.3
2002/03 433.8 1208.6 -774.8
17 Consequently, the current account was negative in the past years (Figure 7). This deficit was financed by high capital inflows, in particular foreign aid inflows, which is why aid dependence increased dramatically. In recent years, private capital inflows also played a role (White and Dijkstra 2003). In order to reduce the current account deficit, Ugandan exports are required to increase considerably in the coming years. Several strategies, like the PMA, the MTCS and the SEIP, have been elaborated to promote the structural change necessary for this. It is yet unclear whether the improved market access offered by the European Union (Everything But Arms), the United States (African Growth and Opportunity Act) and the East African Community will allow Ugandan exports to grow. Figure 7: Current account balance, 1990-2001 (percent of GDP) 1990
1992
1994
1996
1998
2000
0,00 -4,00 -8,00 -12,00 -16,00
Source: World Development Indicators 2003, World Bank.
Beside the high current account deficit, Uganda also exhibited a high and persistent budget deficit (Figure 8). This resulted from the low tax ratio, which amounted to only 9.4 percent of GDP between 1990 and 2001. Until 1992/93, the government had financed parts of its spending from excessive borrowing from the Bank of Uganda. After that year, it changed its policy, improved the budget discipline and thus managed to reduce the deficit from 14.4 percent in 1992 to 6.3 percent in 1999. In recent years, the deficit has, however, increased again, which might be due to the combination of growing expenditures under the PEAP and a remaining level of tax revenues. Figure 8: Budget deficit, public revenue and expenditure, 1992-2001 (percent of GDP) 30 25 20 15 10 5 0 -5 1990 -10 -15 -20
Revenue Expenditure Deficit (excl. grants) 1992
1994
1996
1998
2000
Source: African Development Indicators 2003, World Bank.
18 In order to sustain its public expenditures, Uganda received high inflows of foreign aid (Figure 9). As can be seen by comparing this figure with the previous one, total aid exceeded total tax revenues in most years. Foreign aid in its various forms played an important role in the generation and implementation of economic reforms. When the government started to launch the first reforms at the end of the 1980s, policy dialogue, advisory services, and training provided by donors had a tremendous influence on the reform process. In addition, the conditionality for financial aid was used by reformers within the government to push reforms through (Devarajan, Dollar and Holmgren 2001). Figure 9: Net official development aid, 1990-2001 (percent of GDP) 30 25 20 15 10 5 0 1990 1991 1992 1993 1994 1995 1996 1997 1998 1999 2000 2001
Source: African Development Indicators 2003, World Bank.
In recognition of Uganda’s reform policy, the country was the first to receive support through the Heavily Indebted Poor Countries (HIPC) Debt Initiative, but recent figures show that Uganda's external debt sustainability has deteriorated. In 2002/03, the ratio of net present value of external debt to exports stood at 209 percent, which is much higher than the HIPCtarget of 150 percent. In additon, the debt service ratio to exports is about 10 percent, which is below the HIPC target range of 15-20 percent. The IMF expects the debt sustainability situation to deteriorate further over the near term but it still considers Uganda’s debt situation to remain manageable (IMF 2002). In conclusion, Uganda is indeed a successful African country in terms of its economic performance. Post-war recovery and following economic and institutional reforms led to high growth rates. The liberalisation of the trade regime, the elimination of marketing boards, the supportive external environment with stable or rising prices of the main export products, the return of flight capital, and high inflows of ODA played a significant role. After several years of high growth, however, growth rates have started to decline. Slower growth as well as political and economic instability, social fragmentation, high population growth, high aid dependency, low savings and investment rates and lost momentum in policy and economic reforms represent enormous challenges for the country and its ambitious goal to reduce poverty to 10 percent by 2017.
19
3
Growth and poverty reduction in Uganda
Pro-poor growth is about how the poor benefit from economic growth. As was shown in the previous chapter, the Ugandan economy has experienced relatively high growth rates in the past decade although growth rates have declined somewhat in recent years. In the following, we are concerned with the question whether and how growth translated into improvements of the living conditions of the poor. Household survey data evidence reveals that growth has been accompanied by a substantial reduction in poverty during the 1990s. Yet, recently published results from the 2002/03 household survey suggest that the poor have not benefited from growth between 1999/00 and 2002/03 and that poverty has increased in that period. The results were not completely unexpected, as even before the publication of these new figures on poverty, participatory poverty assessments indicated that the situation of the poor may not have improved as much as the survey-based evidence suggested and that the successes in poverty reduction are based on fragile foundations. In order to judge Uganda’s performance in terms of achieving pro-poor growth, we may first dare a look across the borders. The following international comparison, shown in Table 4, is of an illustrative character but it draws our attention to some important issues when we consider the relationship between growth, distribution, and poverty. The countries chosen for this comparison are Malaysia, Thailand, Indonesia, Vietnam, El Salvador, Honduras, Nicaragua, Botswana, and Uganda. GDP per capita growth exceeded three percent in the respective period chosen in all of the Asian and African countries. Their good macroeconomic record contrasts with the mediocre performance of the Central American economies during the 1990s. Poverty reduction has been substantial in the selected Asian and African countries. Most remarkable is the Vietnamese annual reduction in the headcount index by 9 percent. Botswana reduced poverty by an annual rate of 4.5 percent, while Uganda’s annual 6.6 percent reduction in the headcount came close to the one achieved in Vietnam. Achievements in Central America are less spectacular. In Honduras, poverty had been virtually stagnant. If the relationship between growth and poverty reduction was now to be condensed into a single indicator, caution should prevail. An often-used indicator of pro-poor growth, i.e. a measure for illustrating how well growth translates into poverty reduction, is the poverty elasticity of growth. This elasticity tells by how much poverty falls when the economy grows by one percent. For example, in the Malaysian case the headcount would have been reduced by 1.15 percent had the economy grown by 1 percent. However, this indicator entails an important deficiency, which we intend to explain in the following. Comparing the poverty elasticities of the Central American and the Asian countries, it seems that El Salvador, Honduras, and Nicaragua had achieved higher pro-poor growth than Malaysia, Thailand, and Indonesia. Were they more successful? Certainly they were not. In a low growth economy, annual poverty reduction does not need to be impressive for the poverty elasticity to assume
20 values lower than –1.0. This is why Nicaragua has the highest (negative) poverty elasticity of growth. In a high growth economy, however, a poverty elasticity of less than –1.0 means that poverty is reduced at a considerable pace. Such a situation is what we label pro-poor growth. This example illustrates that we should be aware of the drawbacks of the indicators we use in order to measure pro-poor growth. Nevertheless, in conjunction with the information on GDP per capita growth the poverty elasticity gives a broad notion how growth has translated into poverty reduction. Table 4: Poverty reduction and growth in an international perspective
GDP per capita Annual poverty growth reduction 5.2 -5.9 4.0 -5.3 5.2 -3.6 3.3 -9.0
Poverty elasticity -1.15 -1.34 -0.69 -2.71
Malaysia 1970-80 Thailand 1970-80 Indonesia 1970-80 Vietnam 1992-97
Headcount 52.4 29.0 39.0 23.0 57.1 39.8 58.0 37.0
El Salvador 1991-96 Honduras 1990-95 Nicaragua 1993-98
59.7 67.8 73.6
51.7 65.6 64.0
1.8 0.3 0.7
-2.9 -0.7 -2.8
-1.64 -2.21 -3.97
Botswana 1984-94
59.0
47.0
4.0
-4.5
-1.14
Uganda 1993-2000 Uganda 1993-2003
55.7 55.7
35.2 37.7
3.1 2.9
-6.6 -3.9
-2.14 -1.35
Source: Authors’ calculations. Notes: Headcounts for Asian countries from Jomo (2001), El Salvador and Honduras from Lustig and Deutsch (1998), Nicaragua from CEPAL (2001), Botswana from UNDP (1995). GDP per capita growth is from the World Development Indicators 2001 (recent years for Uganda from UBOS).
The figures reported for Uganda indicate that growth in Uganda has been pro-poor during the 1990s with a poverty elasticity of -2.14 between 1993 and 2000 in a high growth economy with per capita GDP increasing by more than 3 percent per annum. Yet, when the information from the most recent survey is taken into account, the results in terms of poverty reduction during the last decade are far less impressive. Had Uganda kept a per capita growth rate of 3.1 since 2000 and had the poverty elasticity remained constant, the headcount would have declined to 28.9 percent, i.e. almost a ten percentage points difference from what was observed. The recently published results of the 2002/03 household survey are thus not only disappointing. They are dramatic, as growth no longer appears to translate into poverty reduction. All in all, the figures suggest that the poor have benefited from economic growth during the 1990s, but growth in recent years has not been “good for the poor”. The analysis of the growth poverty nexus so far uses a very rough indicator on an aggregate (national) level that may be misleading. Later, we will therefore assess the growth-poverty link in more detail using more sophisticated indicators at more disaggregated level. In doing so, we focus on the income dimension of poverty. Poverty, however, is a multi-dimensional
21 phenomenon and in examining whether growth qualifies as pro-poor, other dimensions of poverty should also be scrutinised. People in Uganda agree that poverty is the inability to cover basic needs and services such as food, clothing, bedding, shelter, basic health care, and education. Additional aspects of poverty include powerlessness and social status (MFPED 2002b). Below, we will lay out the principal trends in poverty and inequality in these dimensions during the last decade and how they relate to growth.5 6 As already indicated above, different approaches to assess poverty may lead to different results. This is also the case for Uganda, although a closer look at the results helps to reconcile them. For the Ugandan case, two main sources are available for examining poverty changes that occurred in the 1990s and beyond. The first source is the Uganda Participatory Poverty Assessment Process (UPPAP). Two rounds of participatory poverty assessments have been carried out under this process, and the results have been published in two reports (MFPED 2000a and 2002b). The second source are household survey based poverty assessments, which mainly rely on consumption as a measure of welfare. These assessments are based on seven comparable household surveys that have been carried out between 1992/93 and 2002/03. 3.1 Findings from the Uganda participatory poverty assessment process
The UPPAP aims at better understanding poverty and its causes, and at giving a voice to the poor. Its participatory approach7 allows for digging deep into the causes of poverty and exploring dimensions of poverty that cannot be easily captured in household surveys, such as insecurity and gender inequality. The UPPAP results reflect the multidimensionality of poverty. Most communities identified aspects of their livelihood that have worsened and others that have improved. This is why no clear trend in poverty throughout the 1990s could be detected. From a historical perspective, the 1990s are perceived by most people as a decade of improvement compared to the previous decade, although they feel they have not yet regained the well-being levels of the 1960s (MFPED 2000a).8 The first UPPAP report (MFPED 2000a) emphasises regional differences in long-term poverty trends. In the Eastern region, food security is seen as a major problem, partly caused 5
Note that the following sections are not meant as a full account of the poverty situation. We rather point out important changes in the course of the 1990s. For more details see the UPPAP reports (MFPED 2000a and 2002b). Okurut et al. (1999) provide descriptive statistics for some poverty-related variables based on the 1992/93 survey. Appleton (2001a and 2001b) and Okidi et al. (2000) focus on consumption poverty. 6
The results of the recent 2002/03 survey are of a preliminary character. We very much appreciate that UBOS has granted access to this new database. 7 8
For details of the research process see MFPED (2002b).
Such historical perceptions should be interpreted with caution. People may judge their present welfare against expected welfare, which is why slight improvement may well be considered as worsening. Additionally, elder people may “romanticize” the past.
22 by the land fragmentation due to excessive population growth. Furthermore, the region still appears to suffer from the serious depletion of household assets, including cattle, due to civil strife in the 1980s. In the Northern region, food security is considered a major threat as well. This is related to environmental factors, such as draughts, as well as to continuing insecurity, replacement, and residence in camps due to the ongoing conflict. Health problems appear to have become more serious and disease prevalence increased. People in the Central region stressed that despite improving coverage the access to services, including basic services such as the provision of toilets, worsens. They report that incomes do not suffice to cover the costs of commoditised services. The Western region suffers from less predictable agricultural livelihoods and resulting food insecurity, which is mainly due to natural resource degradation and a higher frequency of natural disasters. Diminishing civil strife has contributed to improvements in the general poverty situation in some areas, although increasing wants and demands relativise these improvements. The second round of the UPPAP concentrated on trends between 1990 and 2002. The respective report (MFPED 2002b) identifies five areas with more or less clear trends relevant to poverty. Access to social services, in particular education, water, and health, seems to have improved substantially, while the quality of these services has deteriorated. Income poverty has also been addressed, and the productive sectors, cash crops, food crops, livestock, and fish farming, appear to “fare badly”. Fishing communities in particular report increasing poverty due to declining fish catch. However, rising living standards are also reported from those who benefited from the development of the fish processing industry after the lift of the fish export ban. In pastoral communities, rising average living standards have not been shared by the very poor, as they lost land to richer farmers. Cattle raids threaten the livelihoods of some communities in the East. Furthermore, persistent poverty and worsening living conditions are reported from insecure areas. In the 2000/01 village census that was part of the UPPAP people were asked about the evolution of asset ownership during the 1990s. Most households appear to have been able to accumulate some assets during the past decade. However, the evolution of asset ownership by socio-economic strata shows that the better-off own much more today than they did a decade ago, whereas asset ownership of the middle class and the poor has been virtually stagnant (MFPED 2002b). Besides, the second round of the UPPAP put special emphasis on the gender dimension of poverty. Okurut et al. (1999) find the poverty incidence measured in terms of consumption to be slightly lower among female-headed households. The gender dimension of poverty thus does not lie between female and male-headed households. It is within household gender inequality that makes gender aspects important in addressing poverty issues. The exploitation and oppression of women by their spouses is a key cause of poverty among women (MFPED 2002b). The situation of poor women, who traditionally bear a much heavier work burden than men, has even worsened during the 1990s. Women increasingly engage in productive activities without any of the domestic work and other traditional responsibilities being taken
23 on by men. However, the affirmative action introduced with the 1995 constitution has led to increased political rights for women. 3.2 Household survey based evidence
Household survey data show that the good macroeconomic performance of Uganda has been translated into broad-based growth of consumption in the course of the 1990s. Despite continued growth, the first years of the new decade have not led to further poverty reduction. Thus, when measured in terms of consumption, poverty has decreased considerably throughout the 1990s (Appleton 2001a and 2001b, Deininger and Okidi 2002, Okidi et al. 2000), but has risen slightly, but significantly, between 1999/00 and 2002/03. Table 5 shows trends in poverty and inequality from 1992/93 to 2002/03. National poverty measured by the headcount (P0) declined from 55.7 percent to 37.6 percent.9 The poverty gap (P1), which gives a notion about the resources needed to lift the poor out of poverty by perfectly targeted transfers, also decreased substantially from 20.3 percent to 11.3 percent. The same holds for the poverty severity index (P2). The poverty severity index puts more emphasis on the poorer of the poor, as it weighs the poverty gap with itself. Poverty reduction has not been a steady but a rather volatile process with little change between 1993/94 and 1995/96, much of the increases in consumption occurring in the second half of the 1990s, and the recent setback. On the national level, inequality fell slightly initially and increased by the end of the 1990s. The Gini-coefficient10 increased from 0.384 in 1999/00 to 0.451 in 2002/03. This extraordinarily high increase in inequality reflects that only the rich have gained from economic growth during that period.
9
All reported poverty figures as well as own calculations are based on the official (per adult equivalent) consumption aggregate provided by UBOS. See the technical appendix in Appleton (2001a) for details. The poverty lines used are also the official ones. See Appleton (2002) for details. Note again that the 2002/03 results are of a preliminary character. 10
The Gini-coefficient is a measure of inequality that assumes values between 0, which reflects complete equality, and 1, which implies complete inequality. Highly unequal distributions of income/consumption, as in some Latin American countries, result in a Gini of around 0.60, very low Ginis below 0.4 can be observed in some African and European countries.
24
Table 5: Poverty and inequality indicators
National IHS (92/93) MS-1 (93/94) MS-2 (94/95) MS-3 (95/96) MS-4 (97/98) UNHS (99/00) UNHS II (2002/03)
P0 55.7 51.2 50.2 49.1 44.4 35.2 37.6
Poverty indicators P1 20.3 16.9 16.3 16.4 13.7 10.5 11.3
P2 9.90 7.48 7.25 7.64 5.91 4.50 4.90
Inequality Gini 0.364 0.354 0.365 0.366 0.347 0.384 0.451
Rural IHS (92/93) MS-1 (93/94) MS-2 (94/95) MS-3 (95/96) MS-4 (97/98) UNHS (99/00) UNHS II (2002/03)
59.7 55.6 54.3 53.7 48.7 39.1 41.8
22.0 18.6 17.7 18.1 15.2 11.8 12.7
10.81 8.27 7.90 8.49 6.56 5.09 5.50
0.326 0.291 0.321 0.326 0.311 0.322 0.379
Urban IHS (92/93) MS-1 (93/94) MS-2 (94/95) MS-3 (95/96) MS-4 (97/98) UNHS (99/00) UNHS II (2002/03)
27.8 21.0 21.5 19.8 16.7 10.3 12.9
8.3 5.5 6.3 5.6 4.3 2.2 3.1
3.48 2.02 2.69 2.23 1.65 0.72 1.17
0.395 0.394 0.398 0.375 0.347 0.406 0.495
Source: Appleton (2001a), for 2002/03: Authors’ calculations based on UBOS household survey data.
Over the entire period covered by the surveys, substantial improvements in the poverty situation can be observed in both rural and urban areas. In rural areas the headcount index declined from 59.7 percent in 1992/93 to 41.8 in 2002/03. The reduction in urban poverty was even more dramatic, from 27.8 percent to 12.9 percent. It is important to point out that about 85 percent of the Ugandan population live in rural areas (Table 6). This concentration of the population in rural areas in conjunction with the high poverty incidence explains why rural poverty contributed 94 percent to national poverty in 1992/93 and 95 percent in 2002/03. The contribution of urban poverty to national poverty decreased by 2 percentage points to 4 percent in 1999/00 despite increasing urbanization (from 12.91 percent in 1992/93 to 13.46 percent in 1999/00). Between 1999/00 and 2002/03, the urban contribution to poverty increased. This is due to the relatively strong increase in urban poverty combined with a growing urban population. There may of course be a causal link between increasing urbanization and higher urban poverty. Its exploration, however, goes beyond the scope of this report.
25 Table 6: Contribution to national poverty and population shares
IHS (92/93) UNHS (99/00) UNHS II (02/03)
Poverty contribution Urban Rural 0.06 0.94 0.04 0.96 0.05 0.95
Population share Urban Rural 0.1291 0.8709 0.1346 0.8654 0.1431 0.8569
Source: Authors’ calculations based on UBOS household survey data.
A more disaggregated look at the data yields worrying insights about the growing disparities in Uganda, which are hidden by the aggregate measures presented up to this point. As could be seen in Table 5, inequality within rural areas remained fairly stable throughout the 1990s, but we observe a sharp increase recently. Urban inequality appears to have decreased quite substantially until 1997/98. By the end of the 1990s, however, inequality in urban areas has been slightly higher than in 1992/93. The increase in urban inequality between 1999/00 and 2002/03 is even more pronounced than in rural areas. The data shows that rural-urban disparities had widened during the 1990s. As the decomposition of the Theil11 inequality index reveals, the proportion of inequality that can be attributed to the inequality between rural and urban areas (as opposed to the inequality within rural respectively urban areas) increased from 16 percent in 1992/93 to 24 percent in 1999/00 (Table 7). The sharp increases of inequality of both within rural and urban areas, however, resulted in an increasing contribution of within inequality to overall inequality in recent years. Table 7: Rural-urban disparities
IHS (92/93) UNHS (99/00) UNHS II (02/03)
Contribution to Theil index Within Between 0.84 0.16 0.76 0.24 0.79 0.21
Source: Authors’ calculations based on UBOS household survey data.
Growing disparities can also be observed between regions. As Table 8 illustrates, disparities between the four major regions in Uganda had already been high in the early 1990s. People in the Central region, which accounted for 33 percent of the Ugandan population, consumed 1.29 times the Ugandan average, thereby consuming 42 percent of national consumption. The North was the poorest region with a consumption mean relative to the national consumption mean of only 78 percent. By 1999/00, this relation had fallen to 58 percent. The Central region was still by far the richest region. The East held its relative position, while the West
11
The Theil index is a measure of inequality that can be decomposed into within- and between components of inequality that sum to total inequality. Within-group inequality refers to the inequality between people within a certain group, for example within urban areas. Between-group inequality is the inequality that is due to disparities between people of different groups, for example between people in urban and rural areas.
26 had been able to catch up. The 2002/03 figures show that the Central region has even become richer, and especially the North has further lost relative to the other regions. Table 8: Regional disparities
IHS (92/93) Mean relative to Population share overall mean Central East West North
0.33 0.30 0.18 0.19
1.29 0.89 0.90 0.78
Consumption share 0.42 0.27 0.16 0.15
UNHS (99/00) Central East West North
0.29 0.27 0.25 0.19
1.41 0.89 0.96 0.58
0.41 0.24 0.24 0.11
UNHS II (02/03) Central East West North
0.32 0.30 0.23 0.15
1.47 0.78 0.92 0.55
0.47 0.23 0.21 0.08
Source: Authors’ calculations based on UBOS household survey data.
These trends are confirmed by the decomposed Theil index presented in Table 9. Again, the proportion of inequality attributable to the between component rose dramatically from a share of 8 percent to a share of 15 percent. As in the case of rural-urban disparities, the contribution of the within component has risen between 1999/00 and 2002/03. Again, this is due to increasing inequalities within regions, as Table 10 illustrates. Inequality within regions has remained more or less constant during the 1990s, but increased sharply since 2000. Table 9: Regional disparities, changes in decomposed Theil index
IHS (92/93) UNHS (99/00) UNHS II (02/03)
Contribution to Theil index Within Between 0.92 0.08 0.85 0.15 0.87 0.13
Source: Authors’ calculations based on UBOS household survey data.
27 Table 10: Inequality within regions, 1992/93 – 2002/03
Gini
Central East West North
IHS 1992/93 0.39473 0.32694 0.32526 0.34164
Central East West North
UNHS 1999/00 0.40374 0.33649 0.31154 0.32940
Central East West North
UNHS II 2002/03 0.48228 0.39197 0.37040 0.35027
Source: Authors’ calculations based on UBOS household survey data.
To sum up, the 1990s were a period of growing disparities between rural and urban areas and between different regions of Uganda. Inequality within regions and within rural and urban areas stayed more or less constant. Since 2000, however, within-inequality appears to have increased substantially. Up to this point, we dedicated quite some space to the evolution of inequality, as it represents a crucial link between growth and poverty reduction. Only when inequality increases it is possible that growth does not translate into poverty reduction. In the following, we intend to shed some more light on the relationship between consumption growth, distribution, and poverty during the 1990s. An adequate tool to illustrate this relationship is to plot (annual) mean consumption growth by percentiles.12 Figure 10 shows consumption changes by percentile for three periods: From 1992/93 to 1999/00, from 1992/93 to 2002/03, and from 1999/00 to 2002/03. As the figure suggests, growth was broad-based between 1992/93 and 2002/03 from a national perspective because all parts of the population experienced positive growth in consumption. However, increases for the highest percentiles have been much more pronounced than for lower percentiles. The consumption changes by percentile between 1999/00 and 2002/03 explain the disappointing results in terms of poverty reduction. Large parts of the population have seen their consumption decline. Positive consumption growth can 12
The absolute consumption growth rates from 1992/93 to 2002/03 and 1999/2000 to 2002/03 that are calculated by the authors based on the survey information should be treated with caution, as we are not too confident with regard to the deflator we use for the 1999/00 – 2002/03 period. However, using a different deflator would only shift the curves in Figures 10 to 12 vertically.
28 only be observed for the 20 upper percentiles. The richer people were the more they appear to have gained. As should be clear from the above discussion, a more disaggregated view might yield valuable insights. Figure 10: Consumption changes by percentile, national
Consumption Growth
12
8
Growth 92/93 - 99/00 Growth 92/93 - 02/03
4
Growth 99/00 - 02/03
0
-4 0
10
20
30
40
50
60
70
80
90
100
Percentiles
Source: Authors’ calculations based on UBOS household survey data.
Figure 11 shows that rural growth between 1992/93 and 1999/00 has been broad-based with the poorer parts of the rural population even benefiting more from growth than the rich (except for the very rich). This finding is in line with the observation that rural inequality had somewhat declined during that period. In recent years, only the richest 15 percent have benefited from growth. Consumption growth has been negative for most of the people including the poor. At least, the poorest of the poor appear to have lost less than people between the 10th and the 40th percentile.
29
Figure 11: Consumption changes by percentile, rural
Consumption Growth
12
8
Growth 92/93 -99/00 Growth 92/93 - 02/03
4
Growth 99/00 - 02/03
0
-4 0
10
20
30
40
50
60
70
80
90
100
Percentiles
Source: Authors’ calculations based on UBOS household survey data.
In urban areas, the upper tails of the distribution had already gained slightly more during the 1990s (Figure 12). Still, the poor had experienced important increases in consumption that explained the strong decrease in urban poverty rates. The growth rates by percentiles for the latest period, however, reveal a dismay picture. On average people below the 80th percentile have experienced negative consumption growth rates. The poorer the people are the lower their consumption growth rate between 1999/00 and 2002/03. The poorest of the poor have experienced negative growth rates below –8 percent annually. Only within three years this amounts to a cumulative loss of approximately a quarter of initial consumption for these low income groups. At the top of the distribution there appears to be an upper income class between the 80th and the 90th percentile that has seen its consumption levels increase moderately. The highest percentiles have gained substantially and most of the increases in mean consumption can be attributed to the few households at the top of the income distribution.
30
Figure 12: Consumption changes by percentile, urban
Consumption Growth
12
8
Growth 92/93 -99/00 4
Growth 92/93 - 02/03 0
Growth 99/00 - 02/03
-4
-8 0
10
20
30
40
50
60
70
80
90
100
Percentiles Source: Author’s calculations based on UBOS household survey data.
Another way to measure pro-poor growth is the decomposition of poverty reduction into growth and inequality effects. Table 11 and Table 12 show the decomposition of poverty reduction into growth and inequality components between 1992/93 and 1999/00 and 1992/93 and 2002/03, respectively, as well as measures of pro-poor growth based on this decomposition. The first two columns provide annual growth rates in consumption and annual poverty reduction respectively, and the third column reports the resulting poverty elasticity of growth. The following two columns decompose the changes in poverty into a growth and an inequality component. The growth component is the poverty elasticity that would have been achieved had all incomes grown at the same rate. It is thus always negative, which implies that equally distributed growth reduces poverty. The inequality component is calculated as a residual resulting from the difference between the observed poverty elasticity and the hypothetical “pure growth” elasticity. The pro-poor growth index stated in the second last column, as proposed by Kakwani and Pernia (2000), is the ratio of the hypothetical poverty elasticity that would have been obtained with a constant Lorenz curve and the actual poverty elasticity. Kakwani and Pernia (2000) define growth as being pro-poor if that index lies between 0.66 and 1, and as being highly pro-poor if it exceeds 1. This “pro-poor growth index”, which can be applied to different poverty measures, such as the headcount, the poverty gap, and the squared poverty gap, illustrates whether distributional shifts have been in favour of or against the poor. It does, however, not tell much about the reduction of poverty induced by growth. In a more recent publication, Kakwani et al. (2003) therefore advocate the poverty equivalent growth rate, which is the product of the pro-poor growth index and the
31 growth rate in the mean. This poverty equivalent growth rate can also be calculated for different poverty measures. It is a growth rate that is adjusted for how the poor have benefited from growth and is shown in the last column of the tables below.13 Table 11: Decomposition of poverty reduction into growth and distribution components, 1992/93 – 1999/00
Explained by Annual per Annual capita Poverty consumption poverty reduction elasticity growth
Poverty Pro-poor equivalent growth growth rate Growth Inequality index
National P0 P1 P2
4.7 4.7 4.7
-6.6 -9.4 -11.3
-1.40 -2.01 -2.41
-1.49 -2.04 -2.43
0.08 0.03 0.02
0.94 0.99 0.99
4.41 4.62 4.64
Rural P0 P1 P2
4.1 4.1 4.1
-6.0 -8.9 -10.7
-1.47 -2.17 -2.61
-1.40 -1.94 -2.33
-0.07 -0.23 -0.28
1.05 1.12 1.12
4.31 4.58 4.59
Urban P0 P1 P2
6.1 6.1 6.1
-14.2 -19.0 -22.5
-2.33 -3.11 -3.69
-2.47 -3.12 -3.38
0.15 0.01 -0.31
0.94 1.00 1.09
5.74 6.09 6.67
Source: Author’s calculations based on UBOS household survey data.
First, we will analyse the growth poverty link during the 1990s (Table 11). From the consumption growth rates by percentile above we can already infer that the inequality effect must have been negative in rural areas, as inequality decreased, whereas it must have been positive in urban areas. At all levels, the inequality component played a negligible role, and the growth component clearly dominated. At the national level, the annual increase in per capita consumption of almost 5 percent between 1992/93 and 1999/00 was accompanied by an annual reduction in the headcount of 6.6 percent. The resulting headcount elasticity of –1.4 would have even been higher, if inequality had not worsened. However, as the pro-poor growth index with values close to 1 indicates and as shown above, the distributional shifts were not very large. The poverty equivalent growth rate applied to P0, P1, and P2 reflect high broad-based growth and substantial poverty reduction. Poverty reduction achievements are only slightly hampered by increasing inequality. From this national perspective, Uganda clearly experienced pro-poor growth in the 1990s. 13
The literature has proposed different measures of pro-poor growth. The “rate of pro-poor growth” proposed by Ravallion and Chen (2003), which has the advantage of a nice graphical interpretation (see Ravallion and Chen (2003) for details), corresponds to the “poverty equivalent growth rate” for the Watts measure, as shown by Kakwani et al. (2003). It is not shown here, as the Watts measure is not a commonly used poverty measure.
32 This overall positive assessment also holds if rural and urban areas are examined separately. As the decomposition exercises show, distributional shifts had an additional poverty reducing effect in rural areas, whereas the urban headcount would have declined somewhat more had the distribution remained unchanged. The results for the poverty gap and the poverty severity index, however, indicate that distributional shifts in urban areas have worked in favour of the poorer of poor. In rural areas, per capita consumption grew by 4.1 percent annually, which coincided with an annual reduction of 6 percent in the headcount, 8.9 percent for the poverty gap, and 10.7 percent for the poverty severity index. This compares to an annual per capita consumption growth rate in urban areas of 6.1 percent, a poverty reduction of annually 14.2 percent in the headcount, 19 percent in the poverty gap, and 22.5 percent in the poverty severity. It appears that the latter case is clearly more pro-poor despite the fact that inequality increased somewhat. This is illustrated by the poverty equivalent growth rates for P0, P1, and P2, which take the level of growth into account. Hence, the more disaggregated view supports the results that Uganda’s growth pattern in the 1990s had been highly pro-poor. Table 12: Decomposition of poverty reduction into growth and distribution components, 1992/93 – 2002/03
Explained by Annual per Annual capita consumption poverty Poverty reduction elasticity growth
Poverty Pro-poor equivalent growth growth rate Growth Inequality index
National P0 P1 P2
3.8 3.8 3.8
-3.9 -5.9 -7.0
-1.02 -1.53 -1.83
-1.53 -2.08 -2.47
0.51 0.56 0.63
0.67 0.73 0.74
2.56 2.81 2.85
Rural P0 P1 P2
3.1 3.1 3.1
-3.6 -5.5 -6.7
-1.15 -1.77 -2.18
-1.41 -1.96 -2.35
0.27 0.19 0.18
0.81 0.90 0.93
2.52 2.80 2.87
Urban P0 P1 P2
5.2 5.2 5.2
-8.2 -9.8 -10.6
-1.57 -1.89 -2.05
-2.58 -3.18 -3.36
1.01 1.28 1.31
0.61 0.60 0.61
3.16 3.10 3.17
Source: Author’s calculations based on UBOS household survey data.14
If our analysis is extended to include the past three years, the results change astonishingly sharply (Table 12). Especially in urban areas, the worsening income distribution has 14
It should be noted again that the figures reported here suffer from the possible drawback that the deflator chosen by the authors may not be correct. The growth rates in the mean, however, indicate that our choice produces reasonable results.
33 prevented growth from reducing poverty more effectively. For the future, higher inequality levels imply that higher growth is needed to achieve a specific poverty reduction target. Still, we would classify the Ugandan growth pattern over the entire last decade as pro-poor. The pro-poor growth index shows that the distributional shifts that we observe comparing the income distributions of 1992/93 and 2002/03 all worked against the poor. However, the antipoor shifts have been much stronger in urban than in rural areas. In addition, the bias in favour of the poorer of the poor in urban areas has vanished. The poverty equivalent growth rates in urban areas are therefore much closer to the rural rates than in the previously examined period. The rural pro-poor growth indices reflect the fact that consumption levels of the poorer of the poor have not decreased as much as those of other groups between 1999/00 and 2002/03. It should be borne in mind that all these measures are still quite broad indicators of whether growth should be considered pro-poor. The above analysis does not identify winners and losers. Even positive consumption growth rates of all percentiles do by no means imply that each individual in Uganda has benefited from economic growth. Aggregate figures based on two cross-sections may well hide winners and losers. The above regional disaggregation enabled us to discover at least some groups who have not seen their situation improve although the national aggregation suggested so. Before we turn to the issue of reconciling household survey data with the UPPAP findings, we shortly review some evidence on the distribution of household assets. Such knowledge is important as it gives a notion about the economic vulnerability of the household. Based on data from the 1999/00 survey, the evolution of household assets during the 1990s can be assessed. Households were asked in 1999 whether they possessed nothing, much less, less, equally much, more, or much more of a specific asset than in 1992. Assets include livestock, land, tools, transport equipment, and other enterprise assets. Using this information, Deininger and Okidi (2002) find that the poor have virtually not accumulated assets during the 1990s, while the non-poor were able to do so with a rate of 4 percent. This might be taken as an indication that asset inequality is increasing. The authors, however, claim that asset inequality has fallen significantly during this period, when measured by the Theil index. We cannot reestablish their result and suspect that it is very much driven by the data generation method.15 3.3 Reconciling household survey based and participatory approaches
Before the publication of the new findings on poverty in November 2003, there had been a discussion about how to reconcile the UPPAP and survey-based findings, which at first sight seemed to contradict each other. Whereas the survey-based findings suggested that consumption had increased considerably in the course of the 1990s leading to a substantial
15
Deiniger and Okidi (2002) use factors ranging from 0 to 1.5 according to the assessment of asset change (1.5 for example corresponds to much more).
34 reduction in (consumption) poverty, the UPPAP findings were at best mixed. The following arguments were raised in this debate. Deininger and Okidi (2002) argue that this contradiction could be caused by people’s emphasis on relative rather than absolute welfare. Despite absolute improvements in living standards people feel that they have lost in relative terms, which is why they are dissatisfied with their current situation. McGee (2000) on the other hand finds that there is no contradiction but that the two approaches complement each other well. She claims that together they provide more and better information about poverty in Uganda than either does on its own. For example, the breadth of the household survey, which covers all regions and all socio-economic strata, is complemented by the depth of the information on poverty dynamics that can be found in the UPPAP reports. McGee (2000) considers the findings to be compatible for the following reasons. First, she notes that households respond to the increasing pressure on income due to the commoditisation of services by selling household assets, thereby deepening poverty while increasing consumption. Although we agree that this may be a phenomenon that can be observed in some poor households, we doubt that poor households can sustain such a process of selling assets for consumption purposes over a decade. Second, perverse activities, such as increasing alcohol consumption, may contribute to poverty while increasing consumption. Third, McGee (2000) argues that fuel wood, water, and medicines that could previously be gathered for free have now often to be paid for, thereby increasing consumption. It remains to be clarified whether the latter two trends can be confirmed by the survey data. A detailed assessment of these issues, however, goes beyond the scope of this study. Fourth, the surveys may be biased in the sense that they show higher consumption for food-insecure households, which sell food for cash in order to purchase other goods, than for food-secure households, which store food over longer periods. According to the UPPAP there appears to be a rising number of households, which sell more and store less due to a lack of secure storage facilities and not due to growing surpluses. Although there might be a tendency of underreporting for auto-consumers, our analysis of the survey data suggests that the trends over time should not be affected too much by such a bias. Fifth, gender issues are not reflected in the findings based on consumption data. Some dimensions of gender inequality, such as education of girls compared to boys, can be explored by an examination of survey data. However, gender issues within households are of great importance and not assessable through the information given by the household surveys at hand. Taking the above arguments into consideration, we also think that the participatory and the household survey-based poverty assessments complement each other well. This judgment is validated by the results of the 2002/03 household survey, as they confirm that the gains of the late 1990s are based on fragile foundations. Keeping the UPPAP results in mind, the recent poverty figures are thus not too surprising. Across time, the household surveys very well reflect the economic vulnerability of large parts of the Ugandan population and the related
35 volatility in living conditions. Taken together, we draw the following main conclusions from the above assessment of poverty and poverty changes: 1. The Ugandan population experienced important broad-based welfare gains in terms of consumption increases during the 1990s. In recent years, however, only the rich have benefited from growth and large parts of the population have experienced drastic declines in welfare levels. 2. The consumption gains were not equally distributed across the country. Average growth was higher in urban than in rural areas, thereby increasing already existing disparities. Even more striking is regional divergence with the Central region as the clear leader and the North lagging far behind. 3. The gains in consumption are, however, based on very fragile foundations. This is why people feel more vulnerable and insecure, which ultimately leads to the perception that their situation has not improved considerably. Two main reasons seem to be behind this increased vulnerability. First, as we have seen, poor households were not able to accumulate productive assets, which could sustain higher consumption levels. Many households apparently had to sell off some of their assets. Second, natural resource degradation and environmental shocks threaten food security for many households. 4. Despite some progress in the public domain, gender inequality is a persistent phenomenon. As economic changes put even more workload on women, their situation becomes worse. Do these conclusions allow for classifying growth in Uganda as pro-poor? Seen from a longterm perspective, the Ugandan growth pattern still qualifies as pro-poor – despite the recent setback. Recent growth has not been good for the poor and this does not signal good prospects for further poverty reduction. Disparities had already been increasing during the 1990s and this process appears to have accelerated. Whereas inequality in the 1990s increased due to increasing disparities between rural and urban areas and between regions, the recent evolution of inequality also results from rising within inequality. People feel more vulnerable and insecure. The lack of asset accumulation may be one of the major reasons why the poor have not been able to sustain growth. Therefore, investment in the assets of the poor will play an essential role in this regard.
36
4 4.1
Channels of pro-poor growth in Uganda The direct way: Poverty reduction through growth in the private sector
The private sector, which encompasses businesses, firms, and farms, is considered the engine of growth.16 By employing people and securing their income, it plays a key role in reducing income poverty. As will be emphasised below, the public sector has the potential to contribute considerably to the development of the private sector by setting a favourable institutional framework and intervening in areas, such as export diversification or the adoption of new technologies in the agricultural sector. Pro-poor growth requires the sectoral and regional pattern of private sector growth to be biased in favour of the poor. Growth thus has to take place in the sectors where the poor work and the regions where they live. In Uganda, the majority of the poor population lives in rural areas and is engaged in agricultural activities, as urbanisation occurs only slowly. In urban areas, most of the poor work in the informal sector. Table 13: Sectoral poverty profile and decomposition of poverty changes, 1992/93-1999/00
Population share
National Food crop Cash crop Non-crop agriculture Mining Manufacturing Public utilities Construction Trade Hotels Transport/communications Miscellaneous services Government services Not working Total intra-sectoral Total inter-sectoral Total interaction
1992/93 100.0 47.4 19.2 3.0 0.1 4.0 0.1 1.4 7.4 0.6 1.7 1.9 8.0 5.3
Intrasectoral contribution to overall Poverty headcount (P0) P0 change 1992/93- 1992/931992/93 1995/96 1999/00 1995/96 1999/00 55.7 49.1 35.2 64.1 62.1 45.4 14.1 43.1 62.6 46.1 34.3 48.0 26.5 55.1 40.0 41.4 6.9 2.0 31.5 74.5 43.2 -0.5 0.0 44.4 33.7 25.3 6.3 3.7 28.3 11.3 0.0 0.3 0.2 36.8 35.0 22.9 0.4 1.0 26.5 20.7 12.8 6.4 4.9 26.2 19.3 16.5 0.6 0.3 34.5 20.6 15.2 3.5 1.5 30.5 31.7 17.8 -0.3 1.2 36.8 31.8 17.4 6.0 7.6 59.1 59.8 43.7 -0.6 4.0 91.1 95.8 5.8 1.3 3.1 2.9
Source: Appleton (2001a). Note: People are assigned to sectors based on the main industry in which the household head works. For details of the sectoral decomposition of poverty changes, see Appleton (2001b).
16 Yet, as indicated above, growth in Uganda is also aid-driven. According to Collier and Reinikka (2001b), aid accounts approximately for a third of the actual growth rate.
37 The tables in this section provide sectoral poverty profiles as well as decompositions of poverty changes.17 As can be observed, in the course of the past decade important shifts in the sectoral composition of the Ugandan workforce have taken place, which have had an important impact on poverty. These sectoral shifts, differential income gains across sectors, and how these changes are related to poverty will be analysed in the following.18 In 1992/93, approximately 70 percent of the population lived in households where the household head was engaged in agricultural activities (see Table 13). As can be seen from the first column in Table 14, this was still the case in 1999/00. According to the 2002/03 survey, this share has declined to less than 60 percent by today. At the beginning of the 1990s, almost every second household in Uganda grew food crops and every fifth household cash crops, with coffee being the major cash crop.19 Only a very small fraction of the agricultural households was mainly engaged in non-crop agriculture, including livestock production, although the share of the population living in households headed by someone engaged in this activity has risen to more than 5 percent in 2002/03. The poverty incidence was high among agricultural households in the early 1990s. 64.1 percent of food-crop households were poor in 1992/93 and their situation did not change much until 1995/96. Only between 1995/96 and 1999/00, they started catching up. The cashcrop households started from equally high levels of poverty in the early 1990s. However, the poverty incidence among these households was significantly reduced until 1995/96. A further, although less impressive, reduction followed thereafter. As indicated in the last two columns of Table 13, these two agricultural sectors were the most important contributors to poverty reduction in the 1990s, i.e. the reduction of poverty within these sectors was the main contributor to overall poverty reduction in the 1990s (intrasectoral contribution). In contrast, between 1999/00 and 2002/03 crop agriculture has been by far the most important contributor to the observed increase in poverty, as the headcount in this sector has increased by more than 10 percentage points. Yet, as its population share has gone down by more than 10 percentage points, the intersectoral contribution works into the opposite direction (illustrated by the negative sign in Table 14), i.e. it decreases poverty. The explanation is straightforward: By moving out of crop agriculture, people moved out of a sector with a high poverty incidence. The interaction component is also negative, which is due to the fact that people moved out of a sector where poverty was rising. With regard to non-crop agriculture, the picture is 17
For technical details see Appleton (2001a) and the refernces there. Note that Tables 14, 15, and 16 exclude the category “not working” due to changes in the survey design between 1999/00 and 2002/03.
18
It should be noted again that these results are of a preliminary character and maybe subject to changes after further and deeper analysis of the data. We stress this point here, as the sectoral shifts that seem to have occurred since 2000 are very large, which casts doubt on the reliability of the data. Furthermore, changes in the sector classification may have contributed to some of the sectoral shifts, in particular in the service sector.
19
Unfortunately, we do not have the information from the agricultural module of the UNHS II that would allow us to differentiate between food and cash crops. This is why in Tables 14, 15 and 16, we only distinguish between crop and non-crop agricultural activities.
38 somewhat different. Between 1992/93 and 1995/96, poverty in this sector was reduced remarkably. In contrast to poverty in the cash crop and food crop sectors, it slightly increased between 1995/96 and 1999/00, but has decreased significantly since 2000. Yet, non-crop agriculture still exhibits a relatively high poverty incidence of 35 percent, and since this coincides with a rising population share, the intersectoral contribution of this sector is positive, i.e. it has contributed to the poverty increases. Activities other than agriculture are gaining importance in the Ugandan economy. In particular, the manufacturing and the trade sectors together employ household heads that represent more than a fifth of the population at present (see Table 14). Between 1992/93 and 1999/00, households whose household head worked in manufacturing, trade, and government services, which were the most important non-agricultural activities, contributed significantly to poverty reduction. Among trade and government services households, the poverty incidence was more than halved in this period. Manufacturing households started from higher poverty levels, and poverty declined somewhat less. Since 2000, the poverty incidence among manufacturing households has remained more or less constant, the positive intersectoral contribution has resulted from the higher share in employment. The trade households account for almost 15 percent of the Ugandan population by today, which implies that their share has almost doubled in recent years. The poverty incidence among these households has remained fairly low, although it has risen somewhat recently. These factors explain the sector’s relatively low contribution to the recent poverty increases. Table 14: Sectoral poverty profile and decomposition of poverty changes, national level, 1999/00-2002/03
1999/00 Pop. share All sectors Crop agriculture Non-crop agriculture Fishing and hunting Mining Manufacturing Public utilities Construction Trade Hotels Transport /comm. Misc. services Gov. services Total effect
68.85 2.89 0.98 0.51 3.74 0.21 1.67 8.56 1.14 2.24 7.45 1.76
P0 34.30 39.99 42.83 31.83 38.78 27.81 0.00 27.40 13.92 14.18 15.06 18.93 23.64
Contr. Pop. to P0 share 80.29 3.61 0.91 0.58 3.03 0.00 1.34 3.48 0.47 0.98 4.11 1.21
55.75 5.21 0.33 0.23 7.58 0.14 1.89 14.87 2.44 2.61 2.52 6.43
P0 38.07 50.72 35.39 36.33 29.41 28.41 9.91 22.98 17.57 20.28 20.59 28.60 12.36
2002/03 Contr. IntraInterto P0 sectoral sectoral 74.28 4.85 0.32 0.18 5.66 0.04 1.14 6.86 1.30 1.41 1.89 2.09
7.39 -0.21 0.04 -0.05 0.02 0.02 -0.07 0.31 0.07 0.12 0.72 -0.20 8.16
-5.24 1.00 -0.21 -0.11 1.07 0.00 0.06 0.88 0.18 0.06 -0.93 1.10 -2.14
Interaction -1.41 -0.17 -0.03 0.03 0.02 -0.01 -0.01 0.23 0.08 0.02 -0.48 -0.53 -2.25
Source: Authors’ calculation based on UBOS household survey data.
A breakdown of the recent sectoral shifts into rural and urban areas yields additional important insights. As in the above statistics, the results from rural areas drive the national results. Therefore, the sectoral developments just described are reflected in Table 15. The
39 intersectoral contributions of both manufacturing and trade are more pronounced in rural areas, which is due to the fact that the population shares in both sectors have more than doubled. In general, poor rural families rely on different activities, including farming, farm work on larger farms, and trade activities (Dinner and Oxide 2002). Table 15: Sectoral poverty profile and decomposition of poverty changes, rural areas, 1999/00-2002/03
1999/00 Pop. share All sectors Crop agriculture Non-crop agriculture Fishing and hunting Mining Manufacturing Public utilities Construction Trade Hotels Transport /comm. Misc. services Gov. services Total effect
77.11 3.10 1.03 0.50 2.94 0.13 1.28 5.42 0.61 1.08 5.46 1.35
P0 37.97 40.43 45.77 34.86 44.77 37.78 0.00 33.70 18.68 19.65 25.29 26.00 31.48
Contr. to Pop. P0 share 82.11 3.73 0.95 0.59 2.93 0.00 1.13 2.67 0.32 0.72 3.74 1.12
62.55 5.70 0.34 0.22 6.52 0.05 1.57 11.86 2.08 1.85 1.64 5.62
P0 41.94 51.04 36.75 39.32 25.28 32.67 28.21 26.65 21.54 24.06 27.89 45.01 15.30
2002/03 Contr. Intra- Inter- Interto P0 sectoral sectoral action 76.12 5.00 0.32 0.13 5.08 0.04 1.00 6.09 1.19 1.23 1.76 2.05
8.18 -0.28 0.05 -0.10 -0.15 0.04 -0.09 0.15 0.03 0.03 1.04 -0.22 8.68
-5.89 1.19 -0.24 -0.13 1.35 0.00 0.10 1.20 0.29 0.19 -0.99 1.34 -1.57
-1.55 -0.24 -0.03 0.06 -0.18 -0.02 -0.02 0.18 0.06 0.02 -0.73 -0.69 -3.13
Source: Authors’ calculation based on UBOS household survey data.
In urban areas, most of the poor are engaged in agricultural activities despite their low population share, which has decreased somewhat recently (Table 16).20 The increasing poverty incidence among agricultural households has contributed significantly to the rise in urban poverty, although some people switched out of this sector, indicated by the negative intersectoral and interaction terms. Manufacturing households account for a much larger population share today than only 3 years ago. The contribution of this sector to the urban headcount has risen from approx. 6 percent to more than 18 percent, which is also due to an increasing poverty incidence among these households. Most of the people in urban areas live in trade or other service households. The population share of this sector has risen to almost 35 percent by 2002/03. Poverty within this group has only risen slightly, and the sector’s contribution to overall poverty has even declined.
20
There are some urban areas in Uganda, as e.g. Kisoro on the border to DR Congo, that are composed of farms and have a small urban centre. The contribution of agriculture to urban poverty should vary significantly across regions.
40
Table 16: Sectoral poverty profile and decomposition of poverty changes, urban areas, 1999/00-2002/03
1999/00 Pop. share All sectors Crop agriculture Non-crop agriculture Fishing and hunting Mining Manufacturing Public utilities Construction Trade Hotels Transport /comm. Misc. services Gov. services Total effect
13.80 1.49 0.68 0.59 9.05 0.72 4.30 29.51 4.71 9.98 20.69 4.50
P0 9.84 23.74 1.95 1.42 4.84 6.17 0.00 14.91 8.11 9.45 7.68 6.48 7.93
Contr. Pop. to P0 share 33.27 0.30 0.10 0.29 5.67 0.00 6.51 24.31 4.52 7.79 13.63 3.62
10.99 2.00 0.27 0.30 14.57 0.70 3.97 34.71 4.83 7.62 8.27 11.78
P0 12.58 38.65 9.73 11.71 48.77 15.87 0.75 13.42 8.67 9.56 8.94 7.15 3.11
2002/03 Contr. IntraInterto P0 sectoral sectoral 33.77 1.54 0.25 1.18 18.37 0.04 4.24 23.91 3.67 5.42 4.70 2.91
2.06 0.12 0.07 0.26 0.88 0.01 -0.06 0.17 0.01 0.13 0.14 -0.22 3.54
-0.67 0.01 -0.01 -0.01 0.34 0.00 -0.05 0.42 0.01 -0.18 -0.81 0.58 -0.36
Interaction -0.42 0.04 -0.04 -0.13 0.54 0.00 0.00 0.03 0.00 -0.03 -0.08 -0.35 -0.44
Source: Authors’ calculation based on UBOS household survey data.
The decomposition analysis above suffers from the possibly important drawback that it does not take into account the composition of household income. Households are classified according to the industry of the main occupation of the household head. Had poverty been reduced due to intersectoral changes of other household members, including possible increased labour market participation by women, it would not be taken into account. Such a detailed analysis of changes in household income generation goes beyond the scope of this report. There is, however, some evidence that households started diversifying their income sources after 1988. Deininger and Okidi (2002) report that almost 50 percent of all households, and almost one third in rural areas, started a non-agricultural enterprise between 1988 and 1992/93, most of them in the trade sector (petty traders). This holds in particular for the Central and Western regions. The figures from the 2002/03 survey demonstrate that activities other than agriculture gain in importance even if only the head’s main occupation is taken into account. To sum up, the sectoral decompositions illustrate that the poverty changes in the 1990s were almost entirely due to intra-sectoral gains, in particular in agriculture, whereas since 2000 movements between sectors have played an important role in determining poverty outcomes. Between 1999/00 and 2002/03, the overall intersectoral as well as the overall interaction effects are positive, i.e. people have been moving out of sectors with relatively high poverty incidence, and out of sectors where poverty was rising. This finding might be interpreted in the way that poverty outcomes would have been a lot worse, if people had stayed in agriculture. A possible policy implication for the period of the 1990s alone might have been the following: Concentrate on agriculture, as this is where the poor are and where poverty reduction efforts will be most effective. In light of the above results from the recent household
41 survey together with what we have learnt from the UPPAP, this conclusion does not hold any more for current and future years. We showed that agriculture is still by far the most important sector and thus it will have to be the major focus of policy interventions directed towards the productive sectors. However, the poor are increasingly found in trade and manufacturing activities. The Ugandan economy appears to experience a major transformation in its employment structure with an important impact on poverty. Therefore, policies have to prevent that switching from agricultural into other activities does not result in a switch from one type of subsistence activity into another.21 Activities that become increasingly important for the poor parts of the population are dominated by MSE. These enterprises generate low-wage employment that can be very effective in reducing poverty by decreasing the dependency ratio, i.e. the number of people per income earner in a household. In the following, we address the performance of the agricultural sector and MSE in recent years as well as the constraints they face. In addition, we analyse whether the Ugandan authorities promoted the private sector in those segments, where the poor are employed. Before we examine agriculture and MSE in more detail, we shortly review reforms in the financial sector, as these reforms are key to private sector development and of equal relevance to both farms and MSE. 4.1.1 The financial framework for the private sector
Economic reforms that were implemented in Uganda over the past years aimed at stimulating long-term growth, and pro-poor growth (Bigsten and Kayizzi-Mugerwa 2001). Beside trade reforms, and investment in infrastructure and human capital, strengthening the financial system was seen as one of the most important measures in order to achieve this. Access to credit and the provision of financial services to the poor play a catalytic role in encouraging growth of farms and non-farm activities. The economic growth target of 7 percent can only be attained if there are substantial increases in the domestic investment system. Investments are needed to make firms and farms competitive in the medium-term and to enable them to help in reducing trade deficits, debt, and dependence on foreign aid flows. Sufficient investment will only be achieved with a functioning financial sector that channels domestic and foreign savings into investment. As the financial sector was characterised by a number of inefficiencies, the government started to reform it in 1992 (Brownbridge 2002). As Bigsten and Kayizzi-Mugerwa (2001) noted, the poor performance of the financial sector threatened the progress made in other sectors. There was a strong need for the development of a new bank culture to match the increasingly market-oriented nature of the economy. On the basis of comprehensive reforms, Uganda has made considerable progress in strengthening and deepening the financial system,
21
Not much is known about rural industry, village industrialisation, linkages and clusters, and rural trade and transport activities.
42 and reducing its vulnerability during the past decade (IMF and World Bank 2001, IMF 2003a). Progress was also made in creating a better institutional environment with satisfactory financial regulations, i.e. the Financial Institutions Bill, and the Microfinance Bill. These brought Uganda’s legislation in line with international best practices. Despite these improvements, the financial sector is still underperforming as some essential obstacles remain (Diehl and Marpmann 2003, IMF 2003a). First, financial depth is low with broad money’s share of only 13 percent of GDP. Second, the financial system provides domestic credit of only about 13 percent of GDP (compared to the African average of 56 percent). It is dominated by commercial banks (currently 15 in numbers and mostly foreignowned), while other financial intermediaries are limited in numbers, small and ineffective. Banks invest heavily in Treasury Bills issued by the Bank of Uganda. These carry very attractive interest rates, so that banks are able to earn high returns. In that sense, they provide a strong disincentive for banks to extend their activities (advances and loans) to the private sector. This is reflected in the large spread between deposit and lending rates.22 Third, banks play a very limited role in financing rural investment and growth. As they are concentrated in Kampala and a few other towns, they hardly operate in the countryside. Thus, 50 percent of commercial bank loans to the private sector are given to the trade and service sectors with import financing being the most important lending activity. The size of lending to the agricultural sector is very small, accounting for about 10 percent of total lending only. Fourth, there is a chronic shortage of long-term finance. Most bank loans are short-term in tenure, thereby discouraging long-term investment. Fifth, other unfavourable factors like a poor credit discipline of the population, a narrow range of assets acceptable as collateral, contract enforcement problems, high risks of lending to rural areas, high transaction costs and information asymmetries prevail. Taken together, these obstacles prevent the financial system from supporting higher investment rates and from providing financial services to all parts of the population. Even though access to credit at the household level has been expanded in recent years, and 57 percent of Ugandans have access to financial services by today, the vast majority of these are people living in or close to urban areas. The urban bias in financial service provision has not been eliminated. Recognising this, Microfinance Institutions (MFI) have been trying to step in where the existing financial institutions ceased to operate. MFI have received substantial donor support, and there are now more than 500 branches of different institutions serving about 550,000 clients. Most of these are NGO-type organizations. As microfinance can play an important role in alleviating poverty, the government supported and pressed the microfinance industry to augment its outreach (UCAP 2001). The Uganda 22
In 2001, for example, the weighted average deposit rate was 3.14 percent, whereas the weighted average lending rate was 22.66 percent.
43 Microfinance Outreach Plan (2001) envisages that MFI serve about 1.3 million clients in 2005. To date, outreach is rather limited and similar to the case of commercial banks there are a number of serious setbacks. Most MFI dispose of a small deposit base and a small loan portfolio, and charge high interest rates. The average loan size has amounted to about 260,000 USh (approx. US$ 140-150). They are therefore not well equipped to address the needs of farmers and micro and small enterprises, which typically have an interest in higher amounts and medium- to long-term finance (Mugume and Obwona 2001). Many MFI are located in urban areas and there is a regional imbalance with the Northern and the Eastern regions being least served. The rural poor are disadvantaged in their access to loans and financial services. Most MFI customers are traders, only some are farmers or manufacturers. Many of the poorest do not have access to financial services because they do not meet the minimum requirements for collateral. For these reasons, microfinance has so far not contributed sufficiently to improving the living standards of the poor. As will be shown below, farm production, rural non-farm, and urban informal activities are constrained by the lack of access to credit. As of now, MFI play only a limited role for smallholders and MSE, and there seems to be a great unused potential. Yet, before taking up the intricate task of further expanding microfinance services, it would be appropriate to conduct a study on whether they indeed can help to improve the production and living conditions of the rural poor. 4.1.2 Agriculture
As mentioned above, the agricultural sector accounts for about 40 per cent of GDP and 60 percent of total employment. Even though agricultural output may have grown less than output in the industry and service sectors in recent years, it did exhibit positive growth rates throughout the 1990s. And as Figure 13 reveals, in some years it grew quite considerably. In particular, cash crops achieved high annual growth, reaching a maximum of 23 percent in 1995/96. However, growth was negative in some years. Thus, agricultural growth rates have been extremely volatile.
44
Figure 13: Annual production growth rates in agriculture, 1992/93-2000/01 (percent) 25 20 15 Agriculture 10
Cash Crops Monetary Food Crops
5 0 92/93 93/94 94/95 95/96 96/97 97/98 98/99 99/00 00/01 -5 Source: IMF, MFPED.
There are a number of factors that have jointly contributed to the good performance of the agricultural sector. The restoration of peace, the rehabilitation of traditional export products, a reversal of the retreat to subsistence, the restoration of the public sector, and finally the liberalisation of the agricultural markets have been identified as key factors (Appleton 2001a, Dijkstra and van Donge 2003). Bigsten and Kayizzi-Mugerwa (2001) claim that the success in agriculture has been a result of the restoration of peace and policy reform but not of higher investment rates, as rural investment is lower than urban investment. The market liberalization lifted many regulations and restrictions in the agricultural sector and brought an end to the related rent-seeking activities. The deregulation of the coffee market, which was dominated by the state owned Coffee Marketing Board (CMB) until the beginning of the 1990s, can be considered as one of the key reforms. The exploitative and monopolistic CMB was abolished, which guaranteed farmers better prices and free marketing. The literature on the results of the liberalisation of agriculture allows for the following conclusions (Belshaw, Lawrence and Hubbard 1999, Kasekende and Atingo-Ego 1999, and Dijkstra and van Donge 2003). There have been important supply responses, as both production and profits of the farmers have increased although there has been a setback in recent years. In addition, an increasing diversification of production can be observed. Deininger and Okidi (2002) find that many farmers started growing non-traditional crops, such as vanilla, tomatoes, cabbage, and fruit. Some agricultural products are internationally competitive, in particular coffee, flowers, fish, and cotton (Dijkstra and van Donge 2003). In particular in these sectors, the opening-up of the agricultural sector has led to increased FDI, improved access to advanced technology, and managerial know how (Ponte 2001a and 2001b). Some of these producers are integrated in global value chains. In these chains global players govern subcontractors, which are forced to
45 upgrade amongst others health and quality standards. The following promising tendencies can be observed in agriculture. In the coffee sector, some farmers act in niche markets, where low labour costs and specific agro-ecological conditions weigh more heavily than modern technology and scale economies. Besides traditional coffee varieties like robusta and arabica, Ugandan farmers increasingly produce organic and fair trade, speciality, and gourmet coffees (Ponte 2001a and 2001b). The production of these coffees needs quality standards that include e.g. environmental parameters. Diversification within the agricultural sector contributes significantly to the diversification of exports. Fish is becoming Uganda’s main export product, as production has increased considerably. Further important exports include flowers, beans, cotton, tea, tobacco, Irish potatoes, and vanilla. These non-traditional exports have a higher value added, because most of the traditional export products are exported in raw form. They need a good infrastructure at the production level, competent management, in some cases high investment, and a short distance to the international airport of Entebbe, because most are shipped by air, mostly to Europe.23 Through STRATEX and SEIP, the government tries to foster further export diversification through diversification within the agricultural sector, as “strategic exports” include coffee, tea, livestock, fish, cotton, horticulture and Irish potatoes. The most prominent example for a successful integration of a non-traditional export product from Uganda in world market is fish (Nile perch). The value of fish production and employment has increased in the fishing communities around Lake Victoria. Fish processors are reliant on exporters, and the Ugandan fishers are hence not directly integrated in global value chains (supermarket chains, direct marketing). Limits of the sector’s export expansion are the continued depletion of stocks (overfishing at unsustainable levels), a lack of regional commitment (Tanzania and Kenya), a lack of development of aquaculture, a lack of diversification within the sector (products with more value-added, such as ready or semiprepared meals), the loss of harvest because of poor handling, storage, and a general lack of infrastructure. The strategic as well as the more traditional export products are partly produced by smallscale farmers (vanilla, cocoa, papaya). Coffee production, especially for the mentioned niche markets, and fish production are mostly small scale. Vanilla e.g. is grown by more than 10,000 smallholders.24 Other export products, such as cut roses and chrysanthemum plant cuttings (Floriculture), and fruits and vegetables, are mainly produced by large farmers. The production of the latter generally requires significant capital investment. Therefore, there are less than 3,000 small farmers, who sell fruits to export traders. Also in floriculture, large firms 23
See for further information the following studies, which deal with the strategic exports: Kaelin and Cowx (2002) for fisheries, IDEA-Project (2001) for horticulture sector, COMPETE-Project and Gowa (2001) for the coffee sector; IITA-Foodnet (2001) for Irish potatoes and others.
24
The figures in this paragraph are from IDEA Project (2001).
46 prevail (20 firms in floriculture employ 4,000 workers). Typically, these farms offer higher quality employment and, in addition, they may subcontract small farmers. Unfortunately, we know very little about the link between the performance of these dynamic agricultural subsectors and poverty. The information in the employment modules of the household surveys is not disaggregated enough to extract information on the evolution of employment in these sectors, on the incomes earned, and, hence, the impact on household welfare. Maybe the analysis of the agricultural module of the UNHS II can contribute to a better understanding of these developments, at least with regard to the question how smallholders have benefited from the above positive developments in agriculture. The anecdotal evidence presented so far suggests that diversification has partly benefited smallholders. Figure 14: Average producer prices for coffee and cotton, 1993-2001 (USh) 2000 1800 1600 1400 1200
Coffee Robusta
1000
Coffee Arabica Cotton AR
800 600 400 200 0 1993
1994
1995
1996
1997
1998
1999
2000
2001
Source: IMF.
Despite these positive aspects of agricultural development, lower growth rates of agricultural production have been observed during the past few years: The decline in international commodity prices had adversely affected export receipts. The collapse of the coffee price (robusta) and the fall in export earnings of cotton, tea and tobacco had adverse effects on real GDP growth and on the income situation of both large-scale farmers and small-holders. Coffee prices fell by about 70 %, leading to a $ 220 million decline in coffee export earnings (Figure 14). Prices for cotton, tobacco, and tea also fell between 1998/99 and 2001/02 (MFPED 2003a). In addition, food crop prices declined from 2000 to 2003 while food production has only risen slightly. Hence, the farmers were not able to compensate for the negative price developments. “As a result, the nominal earnings from agriculture remained unchanged, whilst nominal earnings in all other sectors increased” (MFPED 2003a). Agricultural households are vulnerable to agricultural commodity price shocks, as household income diversification is still low. Appleton (2001a) argues that the increase in export prices
47 and the liberalisation of the coffee sector (leading to higher prices for the farmers) allowed farmer households to benefit directly from the increase in world prices. Since the coffee price boom ended consumption growth amongst cash crop farmers has continued, but growth rates were lower (Appleton 2001a). Along the same lines, Deininger and Okidi (2002) simulated price changes and their effects on poverty: A price change of 10% for the main tradable, coffee, results in a reduction of the headcount by 6 percentage points, thus illustrating the high elasticity of poverty with respect to prices. A downward shift of coffee prices of 10 percent, in view of the linear character of the regression, leads to poverty increases of slightly more than 6 percent. The cited studies thus suggest that the decline in poverty during the nineties was largely influenced by liberalisation of the coffee market and better producer prices. This, however, implies that the price decreases that occurred since 1998 may have had the opposite effect. The recent trends in agricultural prices may thus be the driving force behind the poverty changes observed between 1999/00 and 2002/03. Income diversification in terms of diversifying into non-agricultural activities as well as, in particular, diversifying the portfolio of cultivated products, may not have been as far reaching as some of the reviewed literature assumes. The results of the above sectoral poverty assessment taking the recent agricultural performance into consideration rather suggest that the rural poor are not diversified and thus remain extremely vulnerable to the type of price shocks observed recently. Possibly, declining incomes in agricultural activities have induced the sectoral shifts that we have observed above. These hypotheses, however, need to be subject to further research on the employment and income dynamics in rural areas. In light of the importance of agricultural performance for poverty, the lack of sustained agricultural growth and the apparently slow process of diversification in agriculture pose a serious threat to poverty reduction efforts. The implementation of an effective incentive system through liberalization may have brought high growth rates only for a decade until the static efficiency gains had been exploited. These gains had been equally shared by the population engaged in agricultural activities. The dynamic efficiency gains from increased competition, increased FDI, and better access to technology that have been realized to date appear to have benefited only a small fraction of farmers. In addition, it is possibly only the richer and better-educated farmers who have been able to diversify their agricultural production. Even today, only 50 percent of agricultural production is sold on markets. Most smallholders, except coffee farmers, and those engaged in other tradables or niche markets (vanilla, fruit, tomatoes), are still engaged in subsistence farming. 80 percent of the households that were chronically poor are found to be peasants engaged in self-employment and subsistence activities. Bevan, Adam et al. (2003) state: “These results strongly suggest that selfemployment in agriculture is not only the main source of livelihood of the poor…, but it is also one of the major characteristics of failure to grow out of poverty”. The majority of
48 farmers cannot take advantage of open markets in the US and EU (Cotonou Agreement and AGOA), and fail to participate in export platforms (horticulture linkages), as they do not succeed in fulfilling the standards, for example for fruit or flowers (The New Vision, Kampala, 3 April 2003). Growth is therefore concentrated in enclaves of larger commercial farms. How farm households, in particular subsistence farmers, respond to changing conditions and whether they can benefit from the opportunities offered by the liberalized agricultural markets depends on a number of factors. The identification of these factors is instrumental for broadbased agricultural growth. Farm households need access to productive infrastructure that also gives them access to markets. In addition, they may be constrained by imperfections in the factor markets, especially in the capital and the land market.25 Limited access to productive infrastructure remains a major obstacle to rural development. There appears to be a new urban bias, as delivery of public services is much weaker in rural than in urban areas. There is no powerful farmers association and participation of farmers in political processes is low, which contributes to the urban bias. Despite some progress, the improvements in infrastructure and public service delivery in rural areas are very modest, with no improvements in Northern Uganda (Deininger and Okidi 2002). In particular, access to electricity remains a major problem. Grid access is limited and only 5 percent of the whole country and less than 2 percent of the rural population have access to electricity. 72 percent of total grid supplied electricity is consumed in Kampala (MFPED 2003a). The neglect of farmers has contributed to low market integration, because poor farmers continued to face problems in processing and storing. The lack of electricity forces farmers to concentrate on production for local markets. Although the situation of the road systems has improved, poor roads continue to be a major problem in many rural areas (MFPED 2003c, Deininger and Okidi 2002). The poor situation of the feeder roads poses a considerable barrier to farmers wishing to sell their products on local and urban markets (MFPED 2000a). Additionally, transport costs are very high because of high fuel prices, which particularly affects households in remote areas. Despite these difficulties market access has improved somewhat over the last decade, because of some improvements in infrastructure and better institutions that have reduced transaction costs. The Ugandan government abolished monopsonistic crop marketing parastatals, and started improving extension services, but the institutional environment still has important weaknesses. These weaknesses are often to be found on the local level, such as inadequate local support services (extension services), local tax systems and licenses, insecure property rights, and weak local administrations.26 In addition, market access is complicated by a lack of storage capacities, a lack of information on markets, and high market dues and license fees. 25 26
We will concentrate on the land market here, as we have convered the capital market above.
See Deininger and Okidi (2001), Ellis and Bahiigwa (2003), and Larson and Deininger (2001) for details on these institutional aspects.
49 Besides market access, factor market constraints are a major problem in rural areas. Poor families face severe constraints in getting access to credit in order to buy inputs (labour, seeds, fertilizer). Even MFI do not reach the poor rural population, although the number of finance institutions developed considerably, and commercial banks do not have any rural branches. The land market remains underdeveloped and the shortage of land may become one of the most pressing problems in face of Uganda’s population growth. 96 percent of arable land in Uganda is under cultivation by small-holders (only the remaining 4% is under large-scale agriculture). Despite improvements in land rental transactions recent findings indicate that access to land is increasingly becoming a problem for poor people: “Shortage of land was the second most frequently cited cause of poverty after health” (MFPED 2003c). As indicated in the above analysis of poverty trends, landownership among poor households decreases and also the size of the holdings of poor households declines. In particular, large and often poor families are not able to increase their land holdings, while large farmers accumulate land. Land conflicts are already widespread and with increasing population pressure the situation may aggravate. Land shortage will lead to rising rural-urban migration, but also to higher rural poverty and increasing inequality between women and men. “While women provide most agricultural labour, their lack of ownership and control of land means that the returns from this key asset (land) tend to accrue largely to men in the household” (MFPED 2003c). As land shortage will increase its value, this process will strengthen the position of men. This will reinforce the already existing gender inequalities. One of the major reasons behind the pressure on land is Uganda’s population growth. The current growth rate is at 3.4 percent (MFPED 2003c). Population growth is higher in rural areas, especially in those regions where poverty is widespread. From 1990 to 2002 Uganda’s population increased by about 8 million people and is now about 25 million. If Uganda maintains a population growth rate of 3.4 percent annually, the population will increase to about 54 million in 2025. High population growth is mainly due to the persistent high fertility levels (7 children per woman) and is also related to poverty, as studies show that persistent poverty is a phenomenon of large households. These households often lack sufficient access to land, which is why too much pressure is put on already cultivated land leading to land degradation and a further worsening of the situation of the household. 4.1.3 Policy recommendations for the agricultural sector
In a recent paper on pro-poor agricultural growth, Dorward et al. (2004) stated an “agricultural investment dilemma”: “Even where the importance of agriculture is recognized it is difficult for donors and governments to design and gain approval for specific agricultural investment programs”. This holds for Uganda as well, as agricultural investment does not generate the expected high growth rates.
50 The problems and constraints in the agricultural sector have been addressed in the Plan of Modernisation of Agriculture (PMA) (MFPED 2000b). In 2000, the PMA, which is related to the PEAP, was developed in order to boost agricultural production and diversification, because the resources invested in this sector were not yielding the desired results. The implementation of PMA is seen as crucial to improve the performance of agriculture. The PMA is intended to be the central mechanism to directly increase the ability of the poor to raise their incomes. A modernised agriculture will contribute to raising incomes by increasing farm productivity, increasing the share of agricultural production that is marketed, and creating farm and non-farm employment. Access to markets is seen as the major condition for increased income opportunities. The PMA addresses two types of obstacles: First, productivity-related constraints including the lack of inputs, skills, knowledge, and credit, the lack of rural infrastructure, and insecurity. Second, governance-related constraints including the insecurity of property, corruption, the lack of transparency, the weak judicial system, poor public services, regulatory burdens, insufficient local leadership and the lack of representation of farmers’ interests. The PMA is a sign that the importance of rural development through growth and diversification in agriculture as well as a number of obstacles that we have identified above have been recognized by the Ugandan authorities. It is, however, too early to evaluate the impact of the PMA. In order to foster production and export diversification, the Ugandan authorities formulated – in addition to the PMA – with the SEIP an intervention strategy for the agricultural subsectors coffee, cotton, livestock, fish, tea, horticulture, and Irish potatoes. The SEIP targets envision a doubling of non-traditional exports. Bevan, Adam et al. (2003) are very critical regarding the costs and benefits of the intervention strategy. In their view, it is not clear that these subsector wide interventions lead to efficient outcomes. In our view agricultural development needs to be a future policy priority with emphasis on the following measures: 1. Continuation of reforms with focus on diversification. Emphasis should be put on reaching subsistence farmers, as it appears that they are still little diversified and therefore vulnerable to agricultural price shocks. This process of diversification within agriculture needs to be accompanied by a diversification of household income sources through creating off-farm employment in rural areas. 2. Higher investment in infrastructure (electricity and roads), foremost in those areas where most of the poor rural population lives (Northern Uganda), in order to better integrate poor people in local, regional and national markets. 3. Export-led growth and linking local farmers to global buyers is necessary, because the domestic market is small. The potential of rural industrialization, and agricultural demand led industrialisation has not been exhausted (Adelmann and Vogel 1992, Bevan, Adam et al. 2003).
51 4. Reduction of fertility rate and population growth, in order to break the vicious circle of poverty, low productivity, and social degradation and conflict. A concept of family planning should be developed as soon as possible. Policy-relevant research activities should focus on: - the changes of the Ugandan employment structure (depeasantisation and deagrarianisation), its causes, and its impact on poverty. This will require the analysis of the character and the role of non-farm activities, intra-household income diversification, and rural-urban migration. - the link between agricultural performance and poverty. Two aspects would be worthwhile considering: a) the link between growth in dynamic export sectors and poverty and b) the vulnerability of cash-crop households to commodity price shocks and mechanisms to deal with it. - the repercussions of integration of agriculture in global value chains for poverty reduction (fish and horticulture sector). 4.1.4 Micro and small enterprises
Uganda is an agrarian and rural society, with the majority of the population engaged in farm or farm-related activities, agriculture makes up for only 40.5 percent of domestic output. 40.6 percent are produced in services, and 18.9 percent in industry (Bevan, Adam et al. 2003). This structure of production might shift even further towards services and industry in the future. It is likely that the currently low level of urbanisation will increase, and that labour will more and more move out of agriculture. The poorer parts of the population will then, at least in a first stage, look for employment in micro or small enterprises (MSE). MSE will play an essential role for generating employment and income for a substantial part of the Ugandan population, and they will thereby be crucial for poverty reduction. Already today, MSE constitute an important source of employment for the Ugandan population. It is estimated that around 800,000 enterprises employ 1.5 million people, which constitutes 90 percent of the total non-farming active population (UBOS 2003). The division between the informal and the formal sector is made at the limit of 5 employees (Table 17). Enterprises with up to 5 workers are considered to be informal and are called micro enterprises. Enterprises with more than 5 employees are thought to be operating in the formal sector. If they employ between 6 and 50 workers, they are called small enterprises. The value of assets of micro firms may not exceed USh 2.5 million, and the annual turnover must be below USh 10 million. Small firms have a value of assets of up to USh 50 million and an annual turnover of USh 10 to 15 million (UBOS 2003).
52
Table 17: Definition of micro and small enterprises in business register
Small enterprises (formal sector) Micro enterprises (informal sector)
Number of employees
Value of assets
Annual turnover
6 – 50
USh 2.5 - 80 million
USh 10 – 15 million
1-5
USh 0 - 2.5 million
USh 0 - 10 million
Percent of total enterprises registered approx. 15% approx. 85%
Source: UBOS (2003).
The recently elaborated business register by UBOS (2003)27 provides information on a selection of both formal and informal enterprises in Uganda. It lists over 160,000 business establishments, which employ about 444,000 people (Table 18). Of these, around 150,000 businesses (87 percent) can be counted to the informal sector, only slightly more than 10,000 to the formal sector. The registered businesses employ only 3.7 percent of the total working population of about 12.1 million people. This makes clear that the Ugandan private sector (excluding agriculture) is very small, smaller than in any comparative African country. The majority of registered businesses are located in Kampala district (35 percent of businesses and 40 percent of employees). The Central region, which includes Kampala district, had the highest share of the working population being employed in the private sector (8.6 percent). In the poorer Northern and Eastern regions, this share amounted to only 0.9 percent and 2.1 percent, respectively. Table 18: Number of businesses registered
Region
Informal (≤ 5 employees)
Formal (> 5 employees)
Central Eastern
90,209 28,365
6,699 1,431
96,991 29,839
281,456 65,830
9,019 22,545 150,138
721 1,718 10,569
9,763 24,290 160,883
23,206 73,626 444,118
Northern Western Total
Total number of businesses
Total employment
Source: UBOS (2003). Note: Some of the registered businesses did not state total employment.
Most of the registered private sector employees are engaged in wholesale and retail trade, the manufacturing sector is second largest. There are about 12,000 businesses carrying out different manufacturing activities, employing about 87,000 workers. The tea processing 27
The report brings together for the first time basic structural data about Uganda’s businesses, and it covers formal and informal businesses, thus filling a gap on the informal sector, where data has been lacking.
53 industry had the highest employment share (over 22 percent of the total registered labour force in manufacturing). Besides, large-scale manufacturing can be found in the manufacturing of sugar, tobacco products, basic metals, in the processing of fish and fish products, and in the refinement of petroleum products. Yet, the vast majority of manufacturing enterprises are small scale. In many cases, they operate in the manufacturing of grain mill products, starches, wearing apparel (with tailoring as the main activity), fabricated metal products, and furniture. Most of these small-scale activities are “Jua Kali”28 industries. The economic reforms of the 1990s have led to rapid growth of the communication sector, which now employs over 3,300 workers (in 25 enterprises). Over 90 percent of the registered businesses are owned by individuals (sole proprietor), and there are only 4,300 private limited companies, which employ less than 108,000 persons, an average of 25 persons per company. How do the currently existing Ugandan enterprises perform with regard to generating growth, creating employment and reducing poverty? There are only few empirical studies on this subject, of which the most detailed one was conducted by Reinikka and Svensson (2002) in 1999.29 This study, however, focuses on medium and large manufacturing enterprises only. The authors find that investment rates of Ugandan firms average only about 10 percent annually, with a median value of below 1 percent. Obviously, such a low level of investment is a severe growth constraint, and the authors identify four major reasons for it.30 First, high transport and transaction costs make capital goods relatively expensive. Second, investment in complementary capital, such as power generators, is necessary in order to stay in operation. Larger enterprises report that limited and unreliable access to electricity is their most important constraint to productive investment and growth. Third, corruption is high, especially for those enterprises with high investment and employment, and a high trade orientation. Fourth, enterprises face erratic infrastructure services, an arbitrary tax administration, and a relatively high incidence of crime. All these factors lead them to invest only in short-term instead of long-term activities. Besides, Ruderahanwa (2000) emphasises that high domestic and regional transport costs do not only increase the price for capital goods; they also provide a disincentive for investing in goods that require to be transported long distances. High telephone costs represent an important constraint for some enterprises, and they might even be a barrier to successful integration into the world market. Furthermore, the current industrial policy followed by the government entails an anti-export bias. For all these reasons, it becomes evident that at present Ugandan enterprises are not in a position to invest and thereby generate economic growth, generate employment and reduce poverty. 28
“Jua Kali” is Swahili for informal sector.
29
Others include Svensson (2002), Gauthier (2001), Chen, Matovu and Reinikka (2001). An World Bank team of researchers recently carried out an “investment climate assessment”, which also focussed on medium and large enterprises (Cotton et al. 2003). This report gives a concise overview of strengths and weaknesses of private sector development in Uganda. Very few studies on the informal sector exist and most of them lack an empirical basis (Krasemann 1996, Kyomugisha 2001, Sengendo et al. 2001).
30
Further studies explaining low investment rates are Wood and Jordan (2000), and Lall (2002).
54 Yet, everything that has been said refers to medium and large enterprises. It is not clear whether it holds for MSE as well. A study conducted by the MFPED (2003b) identifies a number of constraints for smaller enterprises. These include insufficient infrastructure (water, power, roads, telecommunications, premises), legal and regulatory constraints, like inefficient commercial laws, a lack of law enforcement, and business registration, marketing problems, poorly developed financial services, as well as inadequate finance, a lack of coordination between business entities and between business entities and the policy level, a lack of linkages between MSE and large manufacturing enterprises, poor information flows, scanty information on markets and new technologies, unskilled and illiterate entrepreneurs, insufficient training, a limited capacity within districts to promote MSE, and a poor business culture. The MFPED study provides useful but insufficient information as MSE themselves were not interviewed.31 We conducted a survey in March and April 2003, which was aimed at filling this gap. In total, 265 MSE were included and questioned about their history, development, employees, investment behaviour, and obstacles they had to face. The surveyed enterprises operated in 10 different sectors: metal works, furniture/carpenter, restaurants/shops, pharmacies, clothes/textiles, leather works, builders yards, transport, communication/electrical services, and others (Table19).32 This division is in line with the UBOS division code (UBOS 2003). The enterprises were interviewed on the basis of a stratified random sample. The majority was located in urban centres, i.e. Kampala, Jinja, Masaka, Mbarara and Katwe. About ten percent of all surveyed enterprises were situated in rural areas. Included were informal sector micro and small enterprises with less than twenty employees. Nevertheless, the vast majority had less then five employees and can thus be considered to be informal micro enterprises. In the following, we provide the main findings of the survey, predominantly using descriptive statistics in most cases.
31
The study is based on a survey conducted in 2000, in which district officials, private sector representatives, business support organizations, business associations, technical institutions, MFI, and NGOs were interviewed.
32
The survey focused on the manufacturing sector. Thus, wholesale and retail traders were excluded.
55
Table 19: Branches and number of enterprises surveyed
Division Code (UBOS) 27 36 55 24 17 18 45 60 64
Branch
Number of enterprises 25 49 35 9 13 9 17 5 16 87 265
Metal works Furniture/carpenter Restaurant/shop Pharmacy Clothes/textiles Leather works Builders yard Transport Communication/electrical services Other Total
Percent 9.4 18.5 13.2 3.4 4.9 3.4 6.4 1.9 6.4 32.9 100.0
Source: Authors’ calculations based on MSE survey 2003.
It turned out that most MSE were very young. Almost 55 percent of the firms had been founded seven or less years ago (Figure 15). About 50 percent of all enterprises reported a monthly turnover between 100,000 USh and 500,000 USh, with an average of USh 250,000 (approx. US$ 1,500 per year).33 Only a minority realized monthly turnovers of more than 500,000 USh (Figure 16). There were only slight differences between urban and rural MSE, but it appears that rural MSE are more likely to have very low turnovers and few employees (Table 20). The highest turnovers (more than 500,000 USh) were reported in the builders yard and the leather sectors (Figure 17). Figure 15: Year of establishment 30
Number of enterprises
25 20 15 10 5 0 1952
1957
1962
1967
1972
1977
1982
1986
1991
1996
2001
Source: Authors’ calculations based on MSE survey 2003. 33
There are no data available on capital, profits, investment etc. Most enterprises do not keep books, or if they do, data is insufficient (see also Cotton et al. 2003, Weder 2003). The data of our survey are comparable with those of Krasemann (1996), who found that capitalization was very low: The majority of enterprises (60 percent) in his analysis had an equity base of less than 50,000 USh. Only 20 percent had one of more than 200,000 USh. This is another indication that the majority of MSE are poor.
56 Figure 16: Distribution of monthly turnover, 2003
Number of Enterprises
60 50 40 30 20 10 0 < 30K USH
30K-50K USH
50K100K USH
100K200K USH
200K500K USH
500K1m USH
> 1m USH
Source: Authors’ calculations based on MSE survey 2003. Figure 17: Monthly turnover per branch (percentage share) 1
More than 1,000,000 500,000-1,000,000
0,8
200,000-500,000
0,6
100,000-200,000
0,4
50,000-100,000
0,2
Less than 30,000
30,000-50,000
Other
Communication
Transport
Builders yard
Leather
Clothes
Pharmacy/Drugs
Restaurant/Shop
Furniture
Metal
0
Source: Authors’ calculations based on MSE survey 2003. Table 20: Monthly turnover by urban and rural MSE (percentage shares)
Monthly turnover
Less than USh 100,000
USh 100,000 to 200,000
USh 200,000 to 500,000
USh 500,000 to 1,000,000
More than USh 1 million
Urban
28
22
24
15
10
Rural
29
29
21
7
14
Source: Authors’ calculations based on MSE survey 2003.
Even though the surveyed MSE were operating in very competitive markets, 60 percent of them were able to grow. About 50 percent characterized their actual income situation as good or very good, and only a minority mentioned serious concerns. This holds for all MSE regardless of their location. Most enterprises realized some kind of expansion or improvement of the business in the recent past. They invested mainly in employment, machines, and
57 equipment. Some of them even saved for future investments (Table 21).34 Indicating a favourable climate and entrepreneurial optimism, the majority of MSE emphasised their plans to invest in order to expand their business in the near future. Table 21: Type of expansion
Investing in Employment Machines/equipment Plot Savings for future investment Other Total
Percentage 27.5 23.2 9.6 21.7 18.0 100.0
Source: Authors’ calculations based on MSE survey 2003.
A considerable 60 percent of MSE reported an increase in their incomes during the past five years, while only 12 percent stated a decrease (Figure 18). Surprisingly, 90 percent of rural enterprises saw their incomes grow. This might be an indication that MSE expansion is not related to export growth, but mostly due to the upswing of domestic incomes in the 1990s (Jamal and Weeks 1993). The majority of consumers for products from MSE are local consumers. Their incomes and consumption level increased in the recent past as is reflected in the falling poverty incidence until 2000. Two branches (transport and builders yard) are outstanding as more than two thirds of these MSE realized higher income growth during the past five years (Table 22). Figure 18: Income growth during the last five years fluctuated 13%
decreased 12%
remained 15%
increased 60%
Source: Authors’ calculations based on MSE survey 2003.
34
Little investment in research and development is undertaken both by large or small enterprises in Uganda. Rather, time and resources are spent for importing foreign technologies and adapting them to local conditions. The principal mechanism for technology transfer is imitation. This situation reflects the low level of enterprise development in the country.
58 Table 22: Increases in income over past five years per branch (percent of surveyed enterprises)
Branch
Percentage
Transport Builders yard Pharmacy Clothes/textiles Leather works Restaurant/shop Other Metal works Communication/electrical services Furniture/carpenter
75 69 67 67 67 64 62 61 56 52
Total
61
Source: Authors’ calculations based on MSE survey 2003.
With regard to employment, it turns out that 56 percent of MSE were able to employ more workers in the past five years, while 35 percent kept their employment level constant (Figure 19). In particular, enterprises in the metal and leather works and the transport sectors saw their work force increase above average (Table 23). It was especially those enterprises with higher educated owners or better-trained employees that were able to increase the number of employees, turnover, and profits. Figure 19: Employment growth during the last five years fluctuated decreased 4% 5%
remained 35%
increased 56%
Source: Authors’ calculations based on MSE survey 2003.
59 Table 23: Increases in employment per branch over past five years (percent of surveyed enterprises)
Branch
Percentage
Metal works Leather works Transport Other Furniture/carpenter Pharmacy Clothes/textiles Restaurant/shop Builders yard Communication/electrical services
84 66 60 59 56 56 56 53 50 37
Total
57
Source: Authors’ calculations based on MSE survey 2003.
We calculated correlation coefficients in order to find out whether there is any statistical relationship between branch and investment, but our results were not significant. Nevertheless, we were able to draw some interesting conclusions on investment behaviour. First, most MSE do not invest in new technology and communication, except for enterprises in the transport and communication sector. Second, many MSE, in particular enterprises in the pharmacy and transport sectors, invest in product and service development. Third, the highest investment in machinery and equipment is done in the communication, transport and builders yard sectors. Fourth, improving marketing is of minor interest to the majority of entrepreneurs, and there is no remarkable activity with regard to investment in shops and pickups. Fifth, slightly higher investment can be found in buying plots, and expenditure for training. At this point, the question may be raised whether the above positive developments are an indication for endogenous growth of MSE in Uganda, or whether they merely reflect the overall growth of the Ugandan economy. Sarris and van den Brink (1993) argue that endogenous growth can take place if MSE export and/or if they succeed in expanding their local market shares. Although there are no data available, at least the first point of this argument is not very strong in Uganda. Only very few of the surveyed enterprises export; no more than 8 percent, most of them in the furniture sector, had customers outside Uganda.35 Reasons can be found in the low productivity of MSE, exceedingly high transaction costs for engaging themselves at the international market, high transport costs and the Ugandan business culture (Cotton et al. 2003).
35
MSE in other African countries have much higher export shares.
60 Part of our survey was focused on this question, i.e. which constraints and barriers MSE had to face. Figure 20 reveals about which matters MSE had serious concerns.36 Most important obstacles were the expansion and the cost of a plot, access to and cost of finance, the cost of machinery and equipment, inflation, taxes, and the cost of electricity. Access to and reliability of electric power supply and other public utilities played a minor role. Figure 20: Ranking of perception of constraints to investment Obstacles (1 no obstacle, 5 severe obstacle) 1
2
3
4
5
expanding the plot cost of plot access to finance cost of machines/equipment inflation taxes cost of electricity cost of finance/loan access to business support services cost of licence/registration cost of transport market/local competition cost of maintenance and repair/spare parts access to utility services cost of telephone getting raw material competition from import products property rights power cuts skills/know-how: skilled labour skills/know-how: unskilled labour getting information political instability crime and insecurity bribes (nguzi)
Source: Authors’ calculations based on MSE survey 2003.
For urban and rural enterprises equally, insufficient access to finance, high costs of finance, high costs of a plot and limitations for expanding the existing plot represented the most important constraint (Table 24Table 24). As could have been expected, urban enterprises faced much higher competition both from local actors and importers. Rural markets were relatively protected by their physical distance and the related high transaction and transport
36
On the basis of 1999 data, Reinikka and Svensson (2002) ranked high utility prices, high taxes, poor utility services, high interest rates, corruption and an arbitrary tax administration as major or severe obstacles.
61 costs. Additionally, rural enterprises had fewer problems with property rights, cost and expanding of land. Table 24: Rural – urban gap of perception of constraints (Percent of surveyed enterprises)
Cost of plot Access to finance Expanding plot Cost of finance Cost of electricity Cost of registration Local competition Cost of transport Competition from import products Property rights Crime Skilled labour
Urban 85 81 80 75 72 60 57 54 44 22 20 17
Rural 60 78 60 41 56 52 40 54 27 6 22 20
Source: Authors’ calculations based on MSE survey 2003.
The data demonstrate that different branches were faced with different constraints (Table 25). Even though all enterprises had difficulties regarding plot, finance, transport (except for restaurants and shops, which did not seem to be much affected by transport costs), and electricity, import competition hurt communication enterprises most. Power cuts appeared to be the biggest hurdle for restaurants, shops, and communication enterprises. Table 25: Perception of constraints per branch (Percent of surveyed enterprises)
Expanding Plot Access to Finance Cost of Electricity Cost of Transport Cost of Finance Power Cuts Competition from imports
Metal works 80 87 83 58 74 24 54
Furniture/ carpenter 73 81 71 65 72 31 42
Restaurants/ shops 78 81 70 45 72 65 30
Construction 56 73 67 67 80 45 21
Communication 93 87 88 50 64 62 72
Source: Authors’ calculations based on MSE survey 2003.
These findings are partly in line with a World Bank study (Cotton et al. 2003) on larger enterprises. Like medium and large enterprises, MSE have to struggle with costly transport, costly finance, and costly electricity. Yet, access to finance is much more limited for smaller enterprises as they lack collateral and are on average younger. In principal, larger enterprises have easier access to banks, but as shown above there might be crowding out effects. Corruption is less severe for MSE.
62 In our study, it appeared that the constraints with which MSE were faced had been changing over the past few years (Figure 21). Competition was perceived to have been lower when enterprises were started than it was now, which might be traced back to further internal and external liberalisation, opening up of markets, and resulting higher imports of consumer goods. A large number of uncompetitive MSE had to leave the market in the past years.37 Higher taxes as well as higher costs of electricity, transport, and raw materials were also mentioned to be substantial problems today. Licences and registration were bigger problems when businesses were started. In fact, enterprises have to fulfil 17 different procedural requirements, and it takes about 36 days to get a business started (GoU 2003). An intransparent and highly bureaucratic framework puts a high burden on MSE and causes costs. This is partly why micro enterprises intend to avoid registration and prefer to remain informal. Figure 21: Main obstacles when business was started and when it was running Taxes Electricity/transport Raw material Licence/registration Machines/equipment
starting
Labour/skills
running
Capital/land Premises/rent Customers/market/competition Other 0
20
40
60
80
100 120 140 160
Number of enterprises
Source: Authors’ calculations based on MSE survey 2003.
The majority of MSE operate in local markets (local production for local consumers). Many customers are by-passers, neighbours, or family members. Most enterprises are not engaged in any formal relationship with other enterprises. 65 percent of all surveyed enterprises reported that they have never had any formal link with other enterprises. 80 percent have never had a sub-contracting arrangement with medium or large enterprises (Figure 22). Yet, this does not hold for all sectors equally. 42 percent of furniture producers and 45 percent of restaurants and shops did have formal arrangements with other enterprises, and 45 percent of furniture producers were subcontractors of large enterprises. This indicates that a certain type of enterprises is able to upgrade, to adapt to quality standards and technology, and to meet 37
This was stated by a USSIA managere in an interview held in March 2003.
63 delivery deadlines. In their own view, these enterprises produced good quality, which enabled them to act as subcontractors. It is worth mentioning that 83 percent of MSE in the furniture sector stressed the importance of subcontracting with large enterprises, while only 57 percent of enterprises of the other sectors did so. It turned out that Ugandan MSE were “clustered”. Enterprises producing the same type of goods were typically located very close to each other. According to Sengendo et al. (2001), the physical closeness functions as a seedbed for exchange of ideas and promotes the development of appropriate technological and other innovations, like marketing opportunities and the availability of capital. Yet, enterprises have not yet succeeded in creating competitive niches outside their local markets. It has been explained by many that the ability to develop competitive industrial clusters is highly dependent on family-based social networks. Often, firms are not able to take advantage of profitable opportunities outside their local networks of personal relations because they face informational disadvantages and enforcement problems, high transaction costs, and a culture of localised learning and local orientation. Figure 22: Subcontractor with a larger company yes 20%
no 80%
Source: Authors’ calculations based on MSE survey 2003.
With regard to the educational level of the surveyed entrepreneurs, we found out that most of them had finished secondary school, some of them even university (Figure 23). However, they stated that they had set up their businesses without good management knowledge, and organisational capabilities. Many interviewees complained that the formal school education did not teach any employment relevant skills or capabilities. It turned out that Ugandan entrepreneurs were hardly capable of adapting to new technology, of using it and of adjusting it to suit their working procedures. This led to low dynamism and weak competitiveness of many MSE. Most goods produced for the local market were inferior in quality compared to internationally traded goods.
64
Number of Entrepreneurss
Figure 23: Educational level of entrepreneurs 90 80 70 60 50 40 30 20 10 0 No formal education
Primary education
Secondary '0' level
Secondary education
University
Other
Source: Authors’ calculations based on MSE survey 2003.
Even though the entrepreneurs’ educational level appeared to be relatively high and higher than expected (and also above the African average)38, the entrepreneurial competence level was nevertheless very low.39 24 percent of the entrepreneurs were trained through family apprenticeship, 14 percent did a traditional apprenticeship. Only about 30 percent of entrepreneurs participated in some sort of vocational training, thereof 9 percent in short duration courses (Table 26). Family apprenticeship was of most relevance in metal works, and restaurants and shops (40 percent) and of least relevance in the furniture sector (20 percent). Vocational training centres played the most important role for furniture producers and carpenters (35 percent). Appreciation for education and training varied between the different sectors, with furniture and metal enterprises valuing training most. This implies that in those businesses where quality standards are high training is of highest relevance. The other sectors explained that training, compared with other constraints, was of minor importance for them (72 percent of restaurants and shops, and 68 percent of construction enterprises). The number of engineers in the surveyed enterprises is negligible, only 10 percent employ technicians. In some sectors, for example metal works, this share is higher (one third here). Only few MSE employ skilled labour and apprentices. Taken together, this suggests that an advanced business culture has not yet developed. It also points to the prevailing low level of industrialisation, and the dominance of a rural culture. It is puzzling to us that these problems do not find their way into most of the official publications.40
38
In contrast to our findings, the study done by Krasemann (1996) found that about 67 percent of employees in Ugandan MSE do not have any formal education. See also Cotton et al. (2003).
39
Training is in general done only in the formal sector. Training capacity is almost exclusively devoted to preemployment training for those employees, who are supposed to enter large enterprises or public administration. Naturally, most Ugandans do not find employment there (Nel and Shapiro 2003). 40
For a conceptional view, see Nalumansi, Oluka et al. (2002). Training is clearly biased against small and in favour of larger firms.
65 Table 26: Relevance of vocational training
Training Family apprenticeship Traditional apprenticeship Vocational training centre Farm school Short duration course Other Total
Percentage 24.0 14.2 21.5 0.8 8.9 30.5 100.0
Source: Authors’ calculations based on MSE survey 2003.
With regard to investment capital, 70 percent of the surveyed MSE stated that their capital stemmed from own savings (Figure 24). In the case of rural enterprises, this was more than 80 percent. As we saw above, one of the most important difficulties in setting up a business is lack of capital, or limited access to capital. 95 percent of the enterprises covered in our survey have never had any bank loan. 98 percent have never received finances from development banks. 86 percent have not even had access to microfinance institutions. Only 3.6 percent had access to bank loans.41 99 percent of rural MSE did not have access to bank finance, some were beneficiaries of MFI. Notwithstanding the progress in strengthening the financial system and the improved health of the banking sector, there are long-standing weaknesses in the operation of banks, small banks and also of MFI as was shown above. Therefore, most MSE start and expand their business and invest by lending from relatives and friends, which is mostly short-term capital. In some cases, new investment is funded by internal funds. As a consequence of this disadvantageous access to finance, the growth potential of MSE remains limited.42
41
Cotton et al. (2003) compared the financial situation of enterprises in Kenya, Uganda and other countries, and found out that Ugandan enterprises had comparative financial disadvantages.
42
As was shown above, cost of land was one of the major obstacles when starting a business but also when expanding it. Some authors report that creditors (money lenders) refuse to provide finances for the acquisition of land because they consider this type of investment to earn very low returns. Its insignificant positive implication on the performance of an enterprise is not accepted as a guarantee to service the loan (Biggs 2003).
66
Figure 24: Sources of start-up capital 200 180 160 140 120 Number of enterprises 100 80 60 40 20 0 Personal savings
Family sources
Friends
Bank loan
Other business
Micro-finance institutions
Other source
Source: Authors’ calculations based on MSE survey 2003.
As was noted above, except for some furniture producers MSE typically operate on markets inside their local communities. Currently, their consumers as well as their competitors are from the local area or even the neighbourhood. Competitors are in most cases micro or small enterprises as well. In that sense, MSE operate in a highly localised way with a very limited spatial distribution of their output. There is a variety of reasons for this, and some have been mentioned above. Beside them, insecurity plays a role, and a lack of knowledge about external markets keeps them from leaving the familiar terrain. A poor quality of infrastructure services, and high transport costs contribute to low market integration. All monetary transactions are subject to local market fees, local licenses and taxes. These taxes are collected by private individuals, who have the right to collect taxes from MSE on behalf of the local community. Many economic activities and transactions, as was analysed by Ellis and Bahiigwa (2003), are subject to multiple taxation. Local taxation and local institutions undermine or discourage business activities, investment, risk-taking and entrepreneurial engagement. The majority of local inhabitants has the feeling that local institutions are not seen as helpful, which also contributes to less market orientation. Information is diffused locally. On average, MSE’s access to external information is of minor importance as they mainly operate locally. Therefore access to new technology, new products, access to secondhand machines, or to export-traders and importers is limited. Many economic transactions rely on trust and reciprocity, often within informal kinship networks. But even local trust relations are not well developed in Uganda (Sørensen 2001). Cooperation of enterprises seems to be non-existent. Most entrepreneurs are not using “social capital” in their neighbourhood, church activities, sports clubs, etc. They lack specifically business-oriented networks. Only one fifth of MSE is in contact with business associations, and about 15 percent try to establish contacts at social gatherings, like weddings or funerals (Table 27).
67 Table 27: Social embeddedness: where to meet people who are important for the business (percent)
Weddings Funerals Sports clubs Business association Religious communities, churches Neighbourhood Other social gatherings
Yes 9.7 4.7 8.6 21.0 11.3 27.6 55.3
No 90.3 95.3 91.4 79.0 88.7 72.4 44.7
Source: Authors’ calculations based on MSE survey 2003.
Social embeddedness in families, clan structures, local networks of churches, and associations is seen as problematic. Keeping contracts with family members is perceived to be difficult, although the “extended family” is viewed as some kind of safety network and most MSE have access to family funds (Figure 24). On the one hand, the family guarantees support and a minimum of security in risk situations, but on the other hand, it demands reciprocal redistribution of acquired wealth. As such, individual progress and re-investing profits and consequently entrepreneurial growth are hindered. Therefore, friends and neighbours turn out to be more important for enterprise development than family members. Poor legal and contract enforcement prevails. Our results indicate that Ugandan MSE make very little use of the judicial system (Table 28). They state that they rarely go to court. Instead, they choose trading practices that minimise their risk for contract breaching. We assume that there is no trust in the judicial system, and that the cost of using it is very high (MFPED 2003b). Table 28: Reactions to contract breaching
Activities Go to court Do no more business with this customer Try to negotiate with the customer Never do business with unknown customers Always minimizing risk Other Total
Percentage 13.0 10.9 41.1 0.7 17.5 16.8 100.0
Source: Authors’ calculations based on MSE survey 2003.
Wages for MSE employees are on average low. They amount to about 80,000 USh per month (US$ 40). About 80 percent of all Ugandan MSE employ workers with very low wages, i.e. less than 50,000 USh per month. Family workers often do not receive any payment at all (Cotton et al. 2003, Krasemann 1996). Low wages are an indication of low productivity as well as a low level of technology and skills. Compared with other African countries, value added per worker is also low. All these factors taken together inhibit Ugandan enterprises to take advantage of their low wage level.
68 It can be summarized: Weak institutions, inadequate economic promotion and business development services, insecure property rights, poor technical competence, a low level of technological learning as well as low external economies of scale due to small local markets are the most decisive problems faced by MSE in Uganda. MSE are also constrained by underdeveloped financial systems, deficient public infrastructure, limited access to skilled manpower and competent training facilities, and inadequate or insufficient macro-economic policies. These factors have been mentioned by several studies published during the past years. Yet, in our view, an additional part of the problem is that the smallest enterprises, which are the ones facing most obstacles, are ignored by Ugandan policy making. Recent strategies, like MTCS, STRATEX and SEIP, concentrate on medium and large enterprises only.43 Notwithstanding the fact that these enterprises play a vital role for overall GDP and export growth, for technological diffusion, and for a higher competitiveness of the Ugandan economy, they are hardly the ones employing the majority of poor people in the country. Even though the Poverty Status Report for 2003 (MFPED 2003c) stresses that sustained economic growth can only be delivered by the private sector, it lacks any detailed information about the MSE sector, and does not provide any recommendations on how enterprises might achieve growth and create employment successfully. It is also short of a clear vision for a business support system, or a comprehensive concept for vocational training. International best practices have not sufficiently been evaluated. In consequence, MSE cannot but act in the described way. They employ cheap (but unproductive) labour, intend to train employees on the job, receive financial resources from family members, avoid registration and taxes, act locally, and network locally. Ugandan businesses manage small-scale, loosely structured, and low-capital operations. In general, minimalist firms of this type perform poorly, innovate rarely and are subsistence-oriented. Such deep-rooted risk-minimizing strategies are the result of a long-term neglect or of a politically motivated bias against small entrepreneurs. As noted above, under these circumstances, the contribution of MSE to pro-poor growth is limited due to several constraints. As our survey showed, MSE grow because the market as such grows, but they themselves are not the engine of growth. There is no indication that enterprises with fewer than 10 workers will ever grow to a size of 50 workers, but there is evidence that size-related irregularities in the distribution of firms influence the insufficient growth dynamic of the private sector. In some cases, action is taken by business associations or private sector organisations in order to set standards for product quality, or promote training for entrepreneurs. However, globalisation bringing about increased competitive pressure demands even more than that from MSE. They have to be dynamic and innovative in order to be able to operate locally, nationally, and internationally. Ugandan MSE are still to adapt to the requirements of the global market. Until now, they rely on traditional, deeply 43
STRATEX and SEIP, both strategies aiming at the development and expansion of export activities, are obviously inadequate strategies for the MSE sector. As our survey showed, MSE do not have the propensity to export as they are too small, unproductive and focused on the local market.
69 rooted practices, which can only be transformed in the long run. Institutions, attitudes, norms as well as organisational forms, the public administration, educational levels, and technology have to adjust to international standards. Most importantly, a culture of learning and knowledge acquisition and the creation of domestic absorptive capacity for successful inward transfer of technology and own R&D activities have to develop. This has only just started to evolve in small niches of the Ugandan society. Enterprises have no sustainable alternative to participating in global value chains (GVC). These can play an essential role for the transfer of technologies, inducing innovation processes, and providing access to world markets. In Uganda, a first few MSE, mostly producing textiles and furniture, and some farmers producing horticultural goods, coffee, fish, and cotton, have begun to integrate in GVC (Gibbon 2001, Ponte 2001a). Yet, there is a “missing middle”, which is symptomatic of persistent policy distortions.44 There are relatively few enterprises with more than 20 workers. Medium and large firms represent a minority of some 1000 enterprises, including foreign investors. Some of these get preferential policy support, incl. subsidies45 (Bevan, Adam et al. 2003, Cotton et al. 2003). Most of them are innovative, utilise modern technology, export, and satisfy the growing demand in urban agglomerations. They have hitherto been able to assert themselves against foreign imports due to their close contact to customers (Bass 1997, Liedholm and Mead 1999, Kappel et al. 2003). Yet, there are too few of these, and the lack of medium and large sized firms, which are competent, have the capacity to grow, thus employing unemployed, young, non-trained and inexperienced workers, is one of the most serious obstacle for future growth in Uganda. Under the current circumstances, informal micro and small enterprises will most likely stay poor, will not be able to grow to a critical size, and will therefore always play an extremely limited role for pro-poor growth. 4.1.5 Policy recommendations for MSE
First and foremost, it is crucial that the government recognises the importance of the MSE sector for achieving pro-poor growth.46 Even though the MTCS acknowledges that MSE face specific constraints that limit the sector’s potential for achieving growth and reducing poverty, not much has been done to overcome some of the most essential obstacles. As the 44
For general remarks, see Weder (2003).
45
Some of these interventions are firm specific, not sector specific. A number of large firms in the garments inductry, including Tri-Star Apparel, received subsidies, thus inducing a lobbying and rent-seeking culture, displacing or delaying the emergence of a proper profit seeking entrepreneurial culture.
46
Compared to the Ugandan government, international donors have directed more attention to promoting MSE in a bid to upgrade and improve their competitiveness. From among the private sector, business associations, chambers of commerce, and others have emerged in order to stimulate enterprise co-operation, improve information flows, and reduce transaction costs. Examples for these types of institutions are the Private Sector Foundation, Uganda Small Scale Industries Association (USSIA), or Uganda Manufacturers Association (UMA).
70 government states itself, there is a lack of effectiveness, little implementation, and insufficiently defined and operationalised programmes for the sector. “There is still a long way to go before Uganda’s business environment creates a positive incentive for informal companies to become part of the formal sector, and gains a reputation amongst investors as being fair and transparent” (GoU 2003). The most important task ahead is to stimulate private investment. We therefore recommend to take the following steps: 1. Remove constraints and institutional distortions (e.g. regulations, taxes, rent-seeking and bureaucratic red-tape) that undermine profit seeking entrepreneurial behaviour and the growth of small firms. 2. Adress market failures, particularly in the areas of technology transfer, training, and finance. 3. Create appropriate institutions to prosper. 4. Improve the business culture. 5. Establish or improve MSE-related innovation and research activities at universities, polytechnic institutions, and national or regional innovation systems (entrepreneurship, startup entrepreneurs, incubators, etc.). These are still underdeveloped or not available at all. Innovative industrial clusters and integration of MSE in global value chains might help to overcome localisation and risk minimisation. So far, there are no studies, which have analysed the impact of relationships between large and small enterprises, subcontracting, integration into long-term contracts in demand driven value chains, localized and globalised networks. The importance of these factors should be taken into consideration, because the Ugandan manufacturing enterprise sector is not the engine of (endogenous) growth.47 6. Elaborate a comprehensive support program for MSE, which could include measures like establishing entrepreneurship, and professional training programs, consulting services, and fostering micro-credit institutions. Research institutes, laboratories, technical universities, and colleges could provide a significant impetus to the development of start-up enterprises and already existing firms in the above sense. As such an institutional arena is not yet sufficiently developed in Uganda, the government as well as donors can play a crucial role in creating it. 7. Strengthen vocational training. There is no adequate concept for vocational training, although skilled, competent, and innovative entrepreneurs are extremely important for generating growth. 8. Beside efforts to diversify the export sector48, the MSE sector must be promoted. Given that the competition from imports will increase in the near future, in particular with further 47
On the other hand, manufacturing has no comparative advantage so that Uganda could become an export platform for manufactured goods. This is why it must rely on other engines of growth: agriculture, mining, tourism.
48
Doubtlessly, exports are important for the development of Uganda’s private sector. Exporting forces enterprises to adapt to international technological standards, reduce costs, raise productivity, improve quality standards, secure supply reliability, etc. In their study, Wood and Jordan (2001) explain that Uganda’s low level of manfacturing exports is due to high transport costs. They state that Uganda is better placed to export
71 trade liberalisation and reduction of tariffs and of non-tariff barriers in the East African Community, it is crucial to elaborate a strategy how MSE can improve their competitiveness, raise productivity, and strengthen their overall performance. If this is not done, Ugandan enterprises and especially MSE will loose further market shares. Enterprises of all sizes as well as private sector associations already fear being adversely affected by the new customs union. Kenyan enterprises are thought to be more competitive.49 9. Evaluate the potential for rural industrialisation (agricultural demand-led industrialisation). 4.2 The indirect way: Poverty reduction through redistribution
In this section, we examine Uganda’s experience with the indirect linkage between economic growth and poverty reduction. As we pointed out above, high economic growth provides opportunities for dynamic redistribution, i.e. the gains from growth can be redistributed in such a way that the welfare of the poor is increased and/or they are given the opportunity to move out of poverty permanently. The indirect way implies the adoption of a progressive tax system and targeted government spending on the poor. Taxes have the potential to directly correct an unequal distribution of market incomes, immediately increasing the welfare of the poor. Additionally, they provide the resources needed for public expenditures. These can either take the form of financial transfers or public services. Transfers can again immediately benefit the poor by increasing their disposable incomes. Public services, on the other hand, can increase the welfare of the poor by improving their living conditions. Maybe more importantly, they represent an investment in the assets of the poor and can thus increase their earning capacities, which might change the distribution of incomes over time. This effect will, however, only set in in the medium to long run. 4.2.1 Public expenditure
In the following, we address the question to what extent the Ugandan government spends on programs that are targeted towards the poor and whether these increase their welfare potentially. As noted above, such expenditures can either take the form of financial transfers (social security payments) or of public services. In the case of financial transfers, measuring the distribution of benefits is not problematic as the recipients and the monetary value are straightforward. Yet, there is no public social security net in Uganda that reaches the poor. The government does not provide any kind of welfare payments; it only provides pension payments for civil servants and army officials. The private National Social Security Fund offers pension, invalidity, and survivor’s benefits to qualified private sector employees. But even though this fund is open to informal sector workers, the vast majority of members, if not processed primary products, based on local raw materials. With a higher level of education, its comparative advantage might lie in exporting services. 49
In fact, a study on the implications of the EAC customs union for trade, industry, and economic welfare states that Uganda is particularly at risk (DeRosa, Obwona and Roningen 2002).
72 all members, are employed in the formal sector.50 Therefore, our analysis will be concerned with the provision of public services. In a first step, we examine the composition of the public budget and draw conclusions on whether the government spends on the poor. As Figure 25 reveals, absolute total government spending steadily increased over the past decade, except in the year 2000/01.51 In relative terms, it accounted for 18.6 percent of GDP in 1992/93, declined to a minimum of 16.2 percent in 1995/96, but then increased again and reached 24.9 percent in 2001/02. This development very well reflects the changes in economic policy that took place throughout the past decade. In the first half of the 1990s, the government’s emphasis was to restore macroeconomic stability, keeping public spending rather low. In the second half, policy has become more and more focused on poverty reduction and the delivery of basic social services. In 1995, a national seminar on poverty was held, which triggered the process of widespread consultation in order to compile the Poverty Eradication Action Plan (PEAP) (MFPED 2001). In the course of this process, several poverty priority areas for public spending were identified. These were primary education, primary health care, road rehabilitation and maintenance, agricultural modernisation, and water and sanitation. It was assumed that providing these public services would help reduce poverty in others than its income dimension and would additionally represent an investment in the assets of the poor enabling them to better participate in economic activities. It was determined that expenditure for each of these priorities should increase at least as much as nominal GDP (Kempaka and Obwona 2000).
50 51
For more details, see McDonald et al. (1999).
The fact that absolute total expenditure decreased in 2000/01 was not due to a decline in recurrent or development spending, but to the unexceptionally high net lending in the previous year.
73
Figure 25: Public expenditure per GDP, 1992/93-2001/02 (Expenditure and GDP in billion Ush) 12000
30
10000
25
8000
20
6000
15
4000
10
2000
5
0 1992/93 1994/95 1996/97 1998/99 2000/01
Total expenditure GDP Expenditure/GDP
0
Source: Authors’ calculations based on IMF data.
In 1997, Uganda qualified for the HIPC-I initiative52, and one year later, the Poverty Action Fund (PAF) was introduced. This fund had the aim to channel savings from debt relief, as well as donor contributions and government’s own resources, towards priority areas of spending. In the course of time, more than the five original priority areas were included in the PAF. HIV/AIDS treatment and prevention, micro-finance, cattle restocking, adult literacy, environmental protection, and accountability measures have been added to date. Local governments implement most of PAF programs, and about three quarters of PAF resources are transferred to district authorities as conditional grants. In order to emphasise the priority of these areas, all PAF funds came to be protected from potential cuts in the budget (Williamson and Canagarajah 2003). Over time, PAF expenditures increased from USh 231.5 billion in 1998/1999 to USh 676.2 billion in 2002/03, which points to an increasing commitment of the government to poverty eradication (Table 29).53 A better assessment than absolute expenditure numbers is given by the share of the PAF in total public expenditure. As can be seen from the last row, the share of PAF spending has risen over time from 15 percent in 1998/99 to 25 percent in 2002/03.54 The PAF has become a substantial component of total public expenditures and we can thus conclude that the government is targeting a good share of its expenditures towards the poor.
52
Uganda was the first country worldwide that was declared eligible for HIPC-I. In 1999, it was also the first country to qualify for HIPC-II.
53 54
The pre-PAF year 1997/98 is included because comparable data was available.
In other publications, the share of PAF spending in total public spending is reported to be higher. This is due to the fact that there total public spending includes recurrent and domestic development expenditures only. As the budget depends heavily on external development resources, we don’t see a reason for excluding them.
74 Table 29: PAF expenditures (billions of USh)
1997/98
1998/99
1999/00
2000/01
2001/02
2002/03
8.4
20.2
24.6
30.8
36.1
41.7
120.2
169.8
211.6
254.2
292.7
313.7
Primary health care
4.4
20.8
21.4
56.4
100.4
133.9
Water and sanitation
3.9
12.3
17.6
35.3
43.0
47.8
Agriculture
0.5
0.2
4.5
4.0
11.1
26.5
Accountability
3.7
7.7
10.6
17.6
21.8
28.4
Restocking and micro-finance
0.5
0.5
7.3
11.6
7.7
9.0
Land Act
-
-
2.7
3.0
6.3
9.4
Adult literacy
-
-
-
1.5
3.1
4.0
Environment
-
-
-
0.3
0.4
0.7
Other district grants
-
-
2.0
24.5
43.5
61.1
141.6
231.5
302.3
439.2
566.1
676.2
1,281.0
1,579.0
2,298.0
2,141.0
2,565.0
2,695.8
11.0
14.7
13.1
20.5
22.1
25.08
Rural roads Primary education
TOTAL Total public expenditure Share (percent)
Note: Figures for 2001/02 are projected outturn, for 2002/03 projections. Source: Authors’ calculations based on data from USAID, and MFPED (2002a).
An alternative way of looking at this issue is provided by Table 30 which illustrates how much of total sectoral spending has been financed through the PAF. For all sectors, the share of PAF spending has increased from the pre-PAF year 1997/98 to 2002/03. As noted by Williamson and Canagarajah (2003), the PAF has contributed to a significant reorientation of intra-sectoral budget allocations towards pro-poor service delivery. The increase is very pronounced in the agriculture, health, and economic functions and social services sectors, and moderate in the public administration55 sector. The PAF shares for roads and works and for education did not rise as much as the shares for other sectors because the government had increased its poverty spending on these sectors before the PAF was introduced. In 1997, it had introduced Universal Primary Education and it had elaborated a Road Sector Development Program (see below).
55
About 5 percent of PAF resources are earmarked for measures to improve monitoring of and accountability in PAF programs.
75
Table 30: Share of PAF programs in sectoral expenditure
1997/98
1998/99
1999/00
2000/01
2001/02
2002/03
Roads
21.1
32.0
24.3
22.1
22.5
22.9
Agriculture
5.9
2.2
24.3
34.3
34.8
35.4
Education
56.6
61.8
65.6
68.2
67.0
66.9
Health
8.0
30.4
27.0
53.5
59.3
67.0
Economic functions and social
11.5
31.5
36.7
50.6
57.5
60.9
1.8
3.5
5.1
7.6
8.5
10.5
services Public administration
Note: Figures for 2000/01 are budget allocations, for 2001/02 and 2002/03 projections in the Medium-Term Expenditure Framework. Source: Bevan (2001).
It needs to be mentioned at this point that all figures presented so far have to be treated with caution, in particular those that are reported as budget allocations or projections. Actual allocations can differ greatly from these. Carrying out a survey of 250 primary schools and 100 health clinics, Ablo and Reinikka (1998) found that the public sector was not well able to translate budgetary allocations into actual spending. Only 2 percent of public non-wage spending on education reached the intended schools in 1991, which increased to 20 percent in 1995. In reaction to these findings, the government adopted a number of measures in order to increase transparency and accountability. For example, monthly transfers of public funds had to be published in newspapers and broadcasted on radio, and subsequently, the share of spending reaching the intended schools amounted to 90 percent in 2000 (Reinikka 2001). Bevan (2001) reports that the PAF expenditure outturn in 1999/00 amounted to only 89 percent of the budgeted expenditure. Yet, he explains that this shortfall must be considered acceptable as it was not caused by targeting failures, corruption, or lack of available funds, but by implementation delays. So far, we have shown that the Ugandan government is committed to poverty eradication, which it proved with the elaboration of the PEAP and the introduction of the PAF in particular. It is increasingly spending on public services, from which the poor are likely to benefit. Having said this, it is important to note that increased spending does not necessarily translate into improvements in the impact of spending. We have not seen so far whether poor people actually have access to public services and whether these services are of a good or bad quality. It is the effectiveness of spending, and not merely the amount, which is crucial for poverty reduction. We will address the issues of access and quality in the following section by examining the information provided in household surveys and the UPPAP. 4.2.2 Access and quality concerns of public services
Unlike in the case of financial transfers, measuring the benefits of public spending that accrue to individual households is more difficult. The best method of doing so is carrying out benefit
76 incidence analyses as these generate distributions of the benefits of public spending. They indicate who gains from public services and describe the welfare impact on different groups of people or individual households. These analyses combine information about the unit cost of providing a service with information on the use of this service. In other words, they impute to those households using a particular service the cost of providing it, therefore considering the amount by which household income would have to increase if it had to pay the service itself (Lanjouw et al. 2001). A limitation of benefit incidence analyses is that they can only be applied to assignable public expenditures, i.e. to the public provision of private goods and services. Therefore, it is impossible to undertake an analysis for the roads sector. The water sector has to be excluded as well because the main type of water source in Uganda are public wells or pumps, for which we do not know when they have been built. There may be a discrepancy between the time of financing and the time of use. Incidence analyses require disaggregated data on government spending in a particular sector and data on the number of users by percentiles. The first type of information can be taken from the Medium-Term Expenditure Framework, while the latter type can be obtained from the household surveys, with which we have worked above. With regard to the provision of agricultural extension services, the household survey did not cover the question of whether people had access to those services. Therefore, our analysis will be confined to the education and health sectors. Nevertheless, we provide a qualitative evaluation of public sector performance in the roads, water, and agricultural sectors. Education
Before providing our findings from the benefit incidence analysis for education, we would like to point out that one achievement of public spending on this sector could be observed even without such analysis. Access to primary education in Uganda is today relatively high for all parts of the population, which can be attributed to the introduction of Universal Primary Education in 1997. This made education in public primary schools and textbooks free of charge. Since many families were relieved from the financial burden, which had previously kept them from sending their children to school, primary school enrolment increased dramatically from 2.7 million children in 1997 to 7.2 million in 2002 (Pfaffe et al. 2003). Table 31 demonstrates the same effect in a different way. Using household survey data, it can be seen that the share of 7 to 13-year old children who were not enrolled in school decreased dramatically between 1992/93 and 2002/03.56 The poor who were previously over-represented among those who did not attend school benefited significantly from the policy.57 However, the gains of the poorest of the poor were less than those of the rest of the population. It is still 15 56
It has to be noted here that the level of attendance has not increased as much in the Northern region as in other regions, which is due to the prevailing low security and limited employment opportunities.
57
Even though this analysis does not consider increases in private vs. public enrolment, we assume that the great jump in primary enrolment for poor people resulted mainly from making public education free of charge.
77 percent of all 7 to 13-year old children from the lowest quintile who have never attended or already left school. This suggests that the poorest might not be able to take advantage of public services unless their economic opportunities improve (Lentz 2002). With regard to gender inequality, Table 31 reveals that on average a gender bias existed before UPE was introduced but has been eliminated thereafter. In 1992/93, considerably less female than male children were enrolled in school, regardless of their socio-economic background. In 2002/03, there was no such clear-cut division any more. Table 31: Share of children between 7 and 13 not enrolled in school, by sex and consumption quintiles
Quintile 1 2 3 4 5
Total 1992/93 2002/03 0.34 0.15 0.23 0.07 0.19 0.04 0.15 0.03 0.09 0.03
Female children 1992/93 2002/03 0.34 0.15 0.17 0.08 0.09 0.04 0.11 0.03 0.08 0.04
Male children 1992/93 2002/03 0.25 0.16 0.09 0.06 0.06 0.04 0.07 0.04 0.04 0.02
Source: Authors’ calculations based on UBOS household survey data.
As Table 33 indicates, enrolment numbers in primary schools are equally high for all consumption quintiles in 2002/03. In fact, enrolment is even higher in lower quintiles, which might be due to higher fertility. Yet, enrolment in public primary schools decreases with increasing consumption levels, while enrolment in private schools increases. Enrolment in other school types is nearly equally distributed. As there is no universal secondary and tertiary education, enrolment is much lower for lower consumption quintiles. Students from poorer households are less likely to continue their education after primary school. If they do, the share of those who visit private institutions is much higher than during primary education. Except for the first quintile, students are equally enrolled in public and private secondary schools. Surprisingly, enrolment in public tertiary schools is again higher than enrolment in private tertiary schools. This might be due to the fact that people consider universities public institutions. In any case, enrolment in tertiary education is much higher in higher consumption quintiles.
78
Table 32: Number of students in primary, secondary, and tertiary school, 2002/03
Quintile 1 2 3 4 5
Public 1,591,272 1,512,241 1,399,229 1,190,822 744,062
Primary Private 36,715 111,205 181,815 278,854 478,294
1 2 3 4 5
Public 31,772 62,475 112,281 143,710 243,638
Secondary Private 19,888 66,635 108,078 149,338 245,565
Public 1 2 3 4 5
5,004 5,694 10,402 21,535 69,073
Tertiary Private 207 1,202 2,139 4,250 36,805
Other 44,162 39,416 59,859 30,731 35,687 Other 2,443 9,211 3,398 5,581 26,363 Other 1,522 1,984 2,204 2,388 6,302
Source: Authors’ calculations based on UBOS household survey data. Note: Other refers to religious, NGO, community and other institutions.
These enrolment numbers are matched with data on public education spending taken from the Medium-Term Expenditure Framework. In 2002/03, total outlays by level of education were USh 280,490 million for primary, USh 65,980 million for secondary, and USh 55,950 million for tertiary. Combining these expenditures with enrolment numbers results in a unit transfer amount of USh 43,570 per student per year in public primary schools, USh 111,101 in secondary schools, and USh 500,859 in tertiary schools. The distribution of government spending on education is presented in Table 33.58 Public spending on primary education has a pro-poor distribution in the sense that children from poorer households benefit more than children from richer households. For secondary and tertiary education, this does not hold. Benefits accrue clearly to children from richer households. Public spending on tertiary education is most pro-rich, as the richest 20 percent of the population receive about 60 percent of public subsidies. Looking at all educational levels, it turns out that public spending on 58
As noted several times earlier in this study, it has to be kept in mind that these results are of a very preliminary character. On the one hand, they are based on recent 2002/03 household survey data, whose analysis is still subject to change. On the other hand, figures as provided in the Medium-Term Expenditure Framework were used, which are of a very aggregated nature. It would be advisable to repeat the benefit incidence analyses with more disaggregated figures for public spending.
79 education does not have a pro-poor distribution, an equal one at best. Yet, the bias towards higher consumption quintiles cannot be ignored. In order to secure that indirect pro-poor growth is taking place the conclusion suggests itself that this bias should be reduced in future. Taking into consideration that primary education alone does not seem sufficient to enable the poor to improve their (self) employment situation, this would be even more important. Yet, it remains unclear which level of education plays the most essential role for pro-poor growth. Is it primary education leading to an improvement in the basic knowledge level of the population at large? Or is it tertiary education forming a highly educated but small part of the population that can form a capable and innovative leadership group in economic and political terms? It is beyond the scope of this study to answer this question but further research might focus on this issue. Table 33: Benefit incidence of public spending on education, 2002/03
Quintile 1 2 3 4 5 Total
Primary Secondary Tertiary Per capita Share of Per capita Share of Per capita Share of transfer subsidy transfer subsidy transfer subsidy 13,282.79 24.72 676.26 5.35 480.16 4.48 12,623.10 23.49 1,329.77 10.52 546.37 5.10 11,679.75 21.74 2,389.88 18.91 998.13 9.31 9,940.12 18.50 3,058.84 24.20 2,066.40 19.28 6,210.89 11.56 5,185.79 41.03 6,627.92 61.83 10,747.33 100.00 2,528.11 100.00 2,143.80 100.00
All education Per capita Share of transfer subsidy 14,439.21 18.73 14,499.23 18.81 15,067.76 19.54 15,065.36 19.54 18,024.60 23.38 15,419.23 100.00
Government spending (million USh) 280,490 65,980 55,950 402.420 Share 69.70 16.40 13.90 100.00 Note: Per capita subsidies are defined as the unit transfer times the number of students enrolled in school divided by the population in each quintile. Source: Authors’ calculations based on UBOS household survey data.
Before evaluating public performance in the education sector in a negative way, we have to call to mind that the government had defined primary education as one of its poverty priority areas, not secondary or tertiary education.59 We should therefore focus on this first school type only. Doing so, we can affirm that the government is targeting its public spending well and reaches the intended target group. However, even if access to schools has improved considerably for the poor the quality in public schools is reported to be unsatisfactory. This is mainly due to the fact that the recent increase in enrolment rates has not been accompanied by a similar increase in the number of teachers, classrooms, and textbooks. Uganda is said to have some of the largest class sizes in the world today, in some rural places with teacher-pupil 59
It is currently being discussed in Uganda whether universal secondary education should be introduced as well. There are concerns that a majority of students leave primary school without any perspective for continuing education. As there are not sufficient employment opportunities either, free secondary schools and more opportunities for vocational training might absorb these students.
80 ratios of 1:100. Likewise, textbook-pupil ratios are 1:5 on average. Many schools are equipped with poor infrastructure, e.g. there are too few and no separate latrines for girls and boys, and there is a lack of accommodation facilities for teachers coming from other localities. Not able to cope with the situation at large, many teachers lose their motivation and some do not come to school at all. On top of that, teachers’ salaries, which are low anyway, are often paid with long delays. Consequently, it becomes very difficult for many districts, in particular those in remote areas, to recruit teachers. Some have to employ unqualified, and in the worst case, illiterate staff (MFPED 2000a, Opolot 2001). Not surprisingly, there are serious concerns that these circumstances negatively affect the quality of education. In overcrowded classes, children’s concentration and discipline as well as teachers’ ability to pay attention to underperforming children are very likely to suffer. Foster and Mijumbi (2001) state that the primary education system is even struggling to impart basic literacy and numeracy. Otim (2001) raises another concern with regard to the primary school curriculum. He claims that it does not teach any practical skills, neither for informal employment nor for the formal job market. It therefore does not prepare those children who do not manage to go beyond the primary level to lead a life different from those who do not go to school at all. As was shown above, vocational training for the youth does not represent an alternative as it is of minor relevance to the Ugandan authorities. Health As could be seen above, the health sector has always received less financial support than the education sector. It seems that health has traditionally not been as much a priority for the government. Only in August 2000, a Health Sector Strategic Plan was launched, which aims at ensuring the provision of minimum health care packages, targeting the rural poor in particular. For this reason, it is not surprising that most health indicators did not improve much or even worsened throughout the 1990s. With the exception of the number of underweight children, all indicators reported in Table 34 deteriorated between 1995 and 200060, and the respective figures for low income groups are much worse than these averages. Having said that, Uganda stands out in terms of its success in controlling HIV/AIDS. According to UNAIDS data61, HIV prevalence among antenatal clinic attendees tested in Kampala amounted to 29.4% in 1992 but was reduced to 11.25% in 2000. Outside of the major urban areas, HIV prevalence declined from 13% in 1992 to 5.9% in 2000.62 This 60
It is puzzling that health indicators had improved in the first half of the 1990s. For example, infant mortality was determined at 122 in the 1991 census.
61
The data was obtained from the UNAIDS website http://www.unaids.org. As Schoepf (2003) reports, it is assumed that HIV levels in the Northern region are much higher because of the violence that the LRA is resorting to there. Rape, abductions of children, and use of girls and women as sex slaves are doubtlessly representing high risk factors for HIV infections. 62
Even if the reliability of these numbers may be doubted, they do indicate a trend of declining prevalence.
81 achievement is largely attributed to the aggressive information and education campaign that was initiated by the government in the early 1990s. Besides, it is recognised that sexual behaviour changed during the 1990s. Delayed sexual debut among young people, reductions in partner numbers, increased marital fidelity, and increased condom use are considered to be some of these crucial changes (Schoepf 2003). Table 34: Selected health indicators, 1995 and 2000/01
Infant mortality Under-five mortality Full immunisation coverage Underweight children under five Female adult mortality Male adult mortality
UDHS 1995 81 147 47% 25.5% 7.9 9.5
UDHS 2000/01 88 152 37% 23% 8.6 9.7
Source: MFEP (1995) and UBOS (2001).
Overall, however, achievements in the health sector have been rather weak. Access to health services is limited, in particular for poor people. Table 35 gives an indication of the trends in access to health services. The share of ill or injured people who did not receive any medical treatment decreased in the past ten years but still amounts to 14 percent in the poorest quintile today. Clearly, access to health services decreases with decreasing consumption levels. Table 35: Share of people without treatment in case of illness, by consumption quintiles
Quintile 1 2 3 4 5
1992/93 14.7 11.1 11.2 12.0 6.4
2002/03 13.7 7.7 6.0 5.5 3.8
Source: Authors’ calculations based on UBOS household survey data.
Of interest is the question why people did not receive any medical treatment when they were ill or injured, and the household survey data allows for a very valuable insight (Table 36). In 1992/93, most people not seeking treatment did so because they thought their illness or injury was mild and did not require any attention. Although this was the case for many in 1999/00 as well, the majority did not seek any treatment because health care was now considered to be too costly. The gap between poorer and richer households was remarkable. This is in accordance with the participatory poverty assessment, which found that all over the country, people complained about high medical costs. They said that consultation fees, treatment charges, drug costs and other charges prohibited many poor people from obtaining care in health facilities (MFPED 2000a). In an attempt to remove financial barriers to access health services, the government abolished cost-sharing in all public health facilities at the subdistrict level and below in March 2001. Accordingly, treatment and drugs are now to be
82 provided free of charge. Local people as well as health workers confirm that utilisation has increased since then and that the majority of new patients are drawn from the poor (Foster and Mackintosh-Walker 2001, MFPED 2002b). This is confirmed by the last part of Table 36. Table 36: Reasons why people did not seek medical treatment, by consumption quintiles
Quintile 1 2 3 4 5
Illness mild, no need 40.9 52.0 60.4 60.6 68.2
1992/93 Treatment Treatment too far too costly 20.0 29.8 15.7 27.5 12.8 21.4 11.3 24.1 10.0 19.0
Quintile 1 2 3 4 5
Illness mild, no need 24.6 30.7 34.8 38.1 53.6
1999/00 Treatment Treatment too far too costly 13.2 56.8 14.8 50.7 13.2 47.8 15.4 43.5 6.8 34.4
Illness mild, no need 33.6 30.7 38.0 43.7 54.5
2002/03 Treatment Treatment too far too costly 19.8 39.3 23.1 36.9 20.4 34.2 14.3 35.7 12.6 23.0
Quintile 1 2 3 4 5
Others 9.3 4.9 5.4 4.0 2.8
Others 5.4 3.8 4.1 3.0 5.2
Others 7.3 0.1 0.0 0.4 0.4
Source: Authors’ calculations based on UBOS household survey data.
Nevertheless, as Table 37 reveals, most people, poor and rich, prefer private over public health facilities. The richer people, the more likely they are to attend private facilities. The reason for this can be found in the poor quality of public health services. People refrain from consulting public facilities because inadequately qualified and motivated staff offers few services, while drugs and other materials are diverted to private practice. In general, the country is short of trained staff, and doctors and nurses prefer to work in urban areas. Consequently, rural areas have difficulties in recruiting workers, and in some cases positions remain vacant. The situation is aggravated when local governments, who are responsible for the recruitment of health workers and for the allocation of resources, lack the capacity to keep up to their assignments. Delays in appointing staff and payroll cleaning, problems with tendering and procurement, failures to meet the demand for equipment and transport facilities are often-cited concerns. Besides, it is reported that women in particular do not use public
83 health services because they have been discriminated or even embarrassed by health workers (Foster and Mijumbi 2001, Hutchinson 2001, World Bank 2002). Table 37: Type of attended health facility, 2002/03
Quintile 1 2 3 4 5
Public
Private
435,920 393,840 352,783 295,495 278,515
531,775 683,076 756,615 901,485 967,292
Religious/ NGO 39,012 44,603 55,175 72,704 91,897
Other 5,847 6,939 4,046 11,697 15,150
Source: Authors’ calculations based on UBOS household survey data. Note: Other refers to drug shop, traditional doctor and others.
As poor people are more likely than rich people to attend public health facilities, the question arises whether public spending on health care is distributed in a pro-poor way. Table 38 provides the findings from our benefit incidence analysis. In 2002/03, public spending amounted to USh 48,770 million for hospitals, and USh 71,100 million for primary health care. It has to be noted that health services in hospitals were heterogeneous as both inpatient and outpatient services were provided. Obviously, the costs of an inpatient day must have been substantially higher than that of an outpatient visit. In accordance with Lanjouw et al. (2001), we assume that the costs of an inpatient day are equivalent to 10 outpatient visits. The 2002/03 household survey recorded about 529,000 outdoor and 100,000 indoor patients in public hospitals per month. The number of patients in public primary health facilities was 1.12 million.63 These numbers have to be multiplied by 12 in order to match public spending per year. The resulting unit transfer for hospital patients amounts to USh 2,658 and for primary health facility patients to USh 5,283.64
63 64
Primary health patients are those visiting clinics, dispensaries, and health centers.
It might seem surprising that the unit costs for hospital patients are lower than for primary health patients. This result can be explained by considering the costs for an inpatient day to be ten times the costs of an outpatient day. If inpatients were treated like outpatients, the unit costs would amount to USh 6,465.
84
Table 38: Benefit incidence of public spending on health, 2002/03
Quintile
1 2 3 4 5 Total
Number outdoor patients 1,190,208 1,415,472 1,129,248 1,391,940 1,216,200 6,343,068
Government spending (million USh) Share
Hospitals Number Per indoor capita patients transfer 170,304 1,472.28 163,632 1,552.96 347,124 2,341.04 169,776 1,572.25 349,380 2,396.77 1,200,216 1,867.06
Share of subsidy 15.77 16.64 25.08 16.84 25.67 100.00
Primary health care Number Per Share patients capita of transfer subsidy 3,864,048 3,907.71 28.71 3,133,500 3,168.91 23.28 2,733,324 2,764.21 20.31 1,970,760 1,993.03 14.64 1,755,900 1,775.74 13.05 13,457,532 2,721.92 100.00
48,770
71,100
40.69
59.31
Source: Authors’ calculations based on UBOS household survey data.
It turns out that public spending on hospitals is not distributed in a pro-poor way. It is households from the third and fifth quintiles that benefit most. Obviously, this is due to the fact that the number of indoor patients from these households is for some reason much higher than from households from the other quintiles. Among the first, second and fourth quintiles, the benefits are distributed rather evenly. In contrast, public spending on primary health care does have a pro-poor distribution. On average, most benefits accrue to households from the poorest quintile. Benefits are decreasing with increasing consumption levels. Roads
Improving the road infrastructure has been a third poverty priority area of the government. As early as in 1997, a 10-year Road Sector Development Programme was initiated, which focuses on the rehabilitation, maintenance, and selective upgrading of existing roads. Special emphasis is to be placed on the rehabilitation of feeder roads because the majority of poor people live at great distance from main roads. To date, the programme has brought about substantial achievements. 60 percent of feeder roads have been rehabilitated and improved, and 50 percent are considered to be in fair to good condition. At present, the average community lives within 2 km of all-season feeder roads (Foster and Mijumbi 2001). According to the 2000 National Service Delivery Survey, 78 percent of households are within a distance of 5 km from these roads, and 24 percent at zero distance. Local people confirm that roads and public transport have improved since the late 1980s as a consequence of better road maintenance. But they also report that access is not yet fully equitable. Hilly landslides are disadvantaged as construction costs are relatively higher. Also, road conditions get worse the further one travels from urban centres. Problems arise above all in the rainy season, when roads become completely impassable (MFPED 2000a). This points out that there are quality concerns in this sector as well. On the one hand, even though it is an important progress that 60 percent of all feeder roads have been rehabilitated,
85 the remaining 40 percent still require improvement. On the other hand, those roads that have already been rehabilitated need to be maintained. As maintenance costs are relatively high and districts tend to prioritise spending on roads that are in the worst condition, there is a serious risk that rehabilitated roads fall back into an inferior state (Foster and Mijumbi 2001). Furthermore, the participatory poverty assessment reveals that there is a general lack of local involvement in the monitoring of tender awards, which results in poor road construction and supervision, and that funds are found to be misused or allocated to favoured regions within districts because of ethnic reasons (MFPED 2000a). As it appears to be an ever recurring issue that service provision at the local level does not turn out to be as effective and satisfactory as was envisaged in the decentralisation reform, further research on the role of local governments for achieving poverty reduction and pro-poor growth is inevitable. Water
The water sector was identified as a fourth priority area. Similar to the health sector, it has until recently received relatively little attention from the government. After the first UPPAP revealed that a lack of safe water was a key problem for poor people, public spending on the water sector increased remarkably (World Bank 2002). Nevertheless, results in terms of safe water provision have remained below target. The key sector goal that 75 percent of the rural population should have easy reach of safe water has not been achieved by today (Foster and Mijumbi 2001). The UPPAP found that local people had to travel between 1.5 and 16 km to collect safe water. A recent increase in the number of safe water points is reported in only few districts, which is why many people have no alternative to using unsafe water sources. The same holds in some urban centres where safe water is available but has to be purchased at a price between USh 50 and 200 for 20 litres (MFPED 2000a and 2002b). According to household survey data as reported in Table 39, around two thirds of households have access to drinking water, i.e. tap or piped water, water from bore-holes and protected wells. Yet, it is evident that households from different quintiles have access to different types of water sources. The richer the household the more likely it is to use tap or piped water and the less likely it is to use water from boreholes. Besides, poorer households are more likely to access unprotected water sources, like rain water or open waters. If our findings divided between rural and urban areas, the differences would be even more striking. In Uganda, rural areas clearly lack behind in terms of access to safe water.
86
Table 39: Type of main water source, 2002/03 (percent)
Quintile 1 2 3 4 5
Tap/ piped water 0.03 0.05 0.07 0.13 0.37
Bore-hole Protected Open or well rain water source 0.34 0.21 0.38 0.29 0.25 0.37 0.30 0.22 0.33 0.28 0.23 0.29 0.21 0.15 0.19
Others 0.04 0.04 0.08 0.07 0.08
Source: Authors’ calculations based on UBOS household survey data.
Not only access but also quality seems to be poor in this sector. A “value for money analysis” has brought to light that the government has not efficiently transformed inputs into outputs over the past few years. In fact, unit costs of water provision have substantially increased (World Bank 2002). On the one hand, this might be due to a lack of capacity in the district administration, understaffing, lack of funds, and missing equipment, all of which results in poor planning, management and implementation at the local level. Besides, there are concerns about central government interference in tendering procedures at the district level as well as misuse of office equipment. On the other hand, it might be due to the fact that several recent investments did not result in increasing the number of water points but in building capacity. Similar to the case in the road sector, communities are more oriented towards constructing new water sources and are less keen on maintaining and protecting existing ones. Because of this, between 30 and 40 percent of boreholes are non-operational (Foster and Mijumbi 2001). Agriculture
Among the five priority areas, agriculture is the one receiving the least amount of public resources (only 4 percent of PAF resources in 2002/03). Therefore, it is not surprising that only few farmers are in contact with extension services. Many community members report that they do not obtain, and in fact have never obtained, any assistance from extension workers (MFPED 2002b). As in the education and health sectors, local governments have failed to recruit sufficient staff. It turns out that where extension workers are active, they often prefer to deal with farmers that are better off and they thereby discriminate the poor. According to their own statement, this is because the government wants to see positive results and they expect richer farmers to do better. For this reason, extension workers are held in rather low esteem in rural areas and are not seen as being helpful for enabling people to gain a better living (MFPED 2002b, Ellis and Bahiigwa 2003). Obviously, quality in the agriculture sector improved only to a very limited extent. As elaborated in detail above, no major progress in terms of increased productivity and diversification has been made. Implementation of the PMA, which is an innovative but challenging strategy for resolving
87 some of the deficiencies in the sector, calls for a substantial increase of agricultural funds in the annual budget. 4.2.3 Public revenue
In the following, we examine the progressivity of Uganda’s tax system, or in other words, whether taxes are designed in such a way that they do not hurt the poor relatively more than the rich. Besides, we intend to answer the question whether dynamic redistribution in the above sense takes place. Like in the case of public expenditure, a tax incidence analysis is the best approach to measure the progressive or regressive nature of the tax system. We draw on the conclusions of Chen, Matovu and Reinikka (2001), who carried out such an analysis. They compared the progressivity of taxes before and after tax reforms, which had been implemented over the past decade. These reforms were very comprehensive and substantial, and changed the composition of tax revenue considerably.65 First, taxes on international trade experienced a switch from export to import taxation. At the beginning of the 1990s, all export taxes were eliminated except for one tariff, which is levied on raw animal hides and skins.66 Instead, import taxes were introduced at initially high levels, but they were subject to a prolonged tariff reform over time, gradually simplifying the structure and lowering rates. As import taxes were lowered, ad valorem excise taxes were imposed on selected imports in order to compensate parts of the revenue loss. Of most significance was the 1995 introduction of an excise duty on petroleum, which was converted into a specific excise tax in 1998.
65
It has to be noted that we concentrate on central government tax revenue only. At the local government level, a graduated personal tax, a property tax as well as different market dues and licenses are collected. As these revenues account for only 10 percent or less of total funds available to local governments, we concentrate on the quantitatively more important central government taxes. However, the local tax system is highly arbitrary and capricious, working as a disincentive for engaging in monetised economic activities and clearly hurting the poor. On this issue, see Ellis and Bahiigwa (2003) and MFPED (2000a).
66
Exceptionally, a coffee stabilisation tax was temporarily introduced in 1994/95 when world coffee prices jumped unexpectedly because of a poor coffee harvest in Columbia. The tax was to control the increase of the money supply and inflation.
88
Figure 26: Tax revenue as share of total tax revenue, 1992/93 and 2001/02 70 60 50 40
1992/93 2001/02
30 20 10 0 Trade tax
Excise tax
Sales tax/VAT
Income tax
Source: Authors’ calculations based on IMF data.
Second, until 1995 a sales tax of 12-30 percent was imposed on the sale of goods and selected services. Services in general carried a transaction levy. In 1996, these were replaced by a common 17 percent value-added tax in order to broaden the tax base and improve compliance. Third, a new Income Tax Act was adopted in 1997, which applied to corporations and individuals. While previously all businesses had faced a corporate income tax of 30 percent on reported profits, the Act provided a graduated tax structure. The income tax for individuals had always been a graduated tax, but in 1995 the structure was modified and the threshold above which income is taxed was raised from USh 0.84 to USh 1.56 million (Bahemuka 2001). As a consequence of all these reforms, the share of trade tax in total tax revenue decreased, whereas the shares of excise tax, VAT67 and income tax increased (
67
For simplification, we use the term VAT also when referring to the previous system of sales tax and transaction levy.
89 Figure 26). Chen, Matovu and Reinikka (2001) showed that, by and large, the tax structure was progressive before reforms. Only the excise tax, in particular the tax on kerosene, was determined to be regressive. The income tax being levied on formal sector employees and hence on the better off was the most progressive tax. The authors found that the tax system remained progressive after reforms, with the income tax again being the most progressive one. However, they pointed out that the excise tax might turn out to be regressive if indirect effects of taxes on petroleum consumption were taken into account. These affected transport prices and thus consumer end prices of all types of goods. Rural areas, where most of the poor live, were likely hurt more than proportionately. Having said that, we have to point out that the results from this tax incidence analysis have to be treated with caution for three reasons. First, export taxes were not included in the beforereform analysis because they had been eliminated much before the reforms were adopted. If they had been included, it could have been expected that the results were different. The burden of export taxes, and in particular coffee taxes, fell heavily on the rural sector. Uganda, being a small country and therefore a price taker on the world market, was not able to shift the tax to consumers. Rather, the producers had to carry its burden in the form of a reduced producer price. Second, the authors of the analysis explained that the VAT was progressive because of the exemptions granted on goods and services that are more than proportionately consumed by the poor. In theory, general consumption taxes, to which the VAT belongs, are harder on the poor than on the rich because with increasing income households spend relatively less on consumption goods and more on savings. In Uganda, it was intended to make the VAT more equitable by granting exemptions on foodstuffs, social services, passenger transport, etc. We do not doubt that these can have the intended effect, but a look at the current exemption structure68 reveals that today there are also exemptions on financial services, insurance services, or postage stamps, all of which are clearly not consumed more by the poor than by the rich. Third, the analysis was based on the formal tax structure and not on taxes actually paid, which is a principal limitation of tax incidence analyses. In an economy with a large rural and informal sector like Uganda, there is good reason to assume that numerous businesses and individuals do not pay taxes. Gauthier and Reinikka (2001) found that tax exemptions and evasion were widespread among Ugandan businesses in 1995-97, the key reform period. Tax evasion was especially prevalent among smaller firms, while tax exemptions were more common among larger firms. If the analysis were able to capture that in general the poor are engaged in informal businesses and that these do not pay taxes, the result could again change substantially. 68
This can be found at http://www.ugrevenue.com/pdf/VATStatute.pdf.
90 Leaving the shortcomings in the tax incidence analysis aside, the principal concern with Ugandan tax revenue is that its collection performance has been rather weak over the past decade. As shortly mentioned above, tax revenue to GDP accounted for only 6.7 percent in 1992/93 and for 11.2 percent in 2001/02, being still about 4 percentage points lower than the budget projection (World Bank 2002). In this regard, Uganda performs much below the SubSaharan African average of about 25 percent. Several reasons for these revenue shortfalls are reported. First and foremost is the weak tax administration. As indicated above, firms benefit to a large extent from tax exemptions, despite the tax reform’s objective of curtailing special tax regimes. Also, the 2003 Second National Integrity Survey identified the Uganda Revenue Authority (URA) as one of the most corrupt institutions in the country. Eventually, improved URA performance might be forthcoming as a result of new management, concerted efforts to eliminate corruption, and increased funding from the government for purchasing modern technology. Additional factors for tax revenue shortfalls are the culture of non-compliance prevailing in Uganda, the difficulty of bringing the informal sector into the tax net, the granting of additional VAT exemptions, the lowering of import duty rates, and smuggling69 (World Bank 2002). As a result of low tax revenues, Uganda has had high and persistent budget deficits of 8 percent on average over the past decade. The tax system has therefore not performed to its task to provide the resources necessary for public spending. The expenditure level could only be maintained because Uganda received high donor inflows. Grants have constituted a substantial part of the public budget over the period 1992/93-2001/02. Their share in total revenue has accounted for 34.7 percent on average.70 After reaching a minimum of 28.5 percent in 1995/96, this share increased again and amounted to 36.6 percent in 2001/02. In particular after the government made its commitment to poverty reduction clear and introduced the PAF at the end of the 1990s, more and more donor resources were mobilised. Possibly, donors felt that the PAF mechanism ensured channelling resources to pro-poor expenditures and were therefore willing to increase their financial support. As Table 40 reveals, donor budget support to the PAF jumped considerably right after its introduction. Table 40: Sources of PAF resources (share of total resources)
1997/98 1998/99 1999/00 2000/01 2001/02 2002/03 HIPC resources Government resources Donor budget support
n.a. 100.0 n.a.
19.2 66.3 14.5
20.8 47.8 31.4
30.9 35.9 33.2
29.3 44.2 26.5
25.0 47.5 27.5
Source: Authors’ calculations based on USAID data.
69 70
For example, fuel is smuggled from Kenya as the Ugandan excise tax on fuel is higher.
Note that total ODA flows are higher than these numbers as there is a large amount of ODA that is not flowing directly into the budget. In many publications, total ODA is estimated at about 53 percent of the budget.
91 In fact, the PAF became instrumental in the donors’ shift from project to general budget support (Williamson and Canagarajah 2003). This, however, makes it hard for us to determine whether it was donor resources or domestic revenue that financed spending on priority areas. In close relation to this, questions of fungibility cannot be satisfyingly answered. Yet, considering the low share of tax revenue in GDP and the high share of external resources in public revenue, it is straightforward that it was not taxes alone, if at all, that were channelled into public spending on the poor. Instead, donor resources played an essential role in financing primary education, primary health care, rural feeder roads, water sources, and agricultural extension services. As these resources do not represent gains from economic growth but rather “gifts” from the outside, they cannot be re-distributed. Thus, pro-poor growth in the indirect way takes place only to a very limited extent. 4.2.4 Policy recommendations
As we have seen in this chapter, Uganda has made several steps in order to realize pro-poor growth in the indirect way over the past decade. It has increased expenditures for povertyreducing programs, and has employed a progressive tax system. However, serious constraints in terms of targeting public spending, public service quality and tax revenue collection prevail. If these are not satisfyingly resolved in the near future, indirect pro-poor growth cannot be fully achieved, and improvements in poverty outcomes will be severely jeopardised. First and foremost, revenue collection must be improved. Donors might contribute in this regard by training civil servants, who are employed in tax collection positions. They might also increase their role in the fight against corruption. They should take signs of rent-seeking and concerns of absorptive capacity much more serious than in the past. Second, Uganda must comply with its budget plans. Donors might have to increase their pressure on the government in this issue. Supplementaries for poverty-unrelated programs should be evaluated with a highly critical view, budget increases for defence in particular. As the past has shown, increased defence spending has not lead to a resolution of the conflict in the North, which is why the chances of success of a military approach might be seriously in doubt. Instead of granting the government supplementary defence spending, donors should put more emphasis on humanitarian and developmental projects as well as conflict resolution in the Northern districts. Third, the quality of public services must be improved. Given that many quality concerns could be traced back to the low capacity of local authorities, donors might increase their involvement in capacity building at the local level. Closely related, they might support the training of local teachers, health workers, extension workers, etc. in one or the other way. Fourth, the incentive structure of public service delivery must be reviewed. Teachers, health workers, and extension workers should be attracted to remote areas by offering them higher salaries, or any other type of compensation. Equally, there could be some kind of (material)
92 motivation for districts who maintain their rehabilitated roads and water sources. Fifth, with regard to specific priority areas more attention must be paid to the primary health, the rural water, and the agricultural sectors. It must be made clear that achievements in one sector might well influence the achievement in another sector. On the one hand, donors might play an important role in creating awareness for this. Intersectoral linkages have not sufficiently been investigated so far. On the other hand, donors might themselves focus their activities more on neglected areas, on improving the health situation in particular. Even though Uganda has a very good track record in preventing the spread of HIV/AIDS, more information and education campaigns have to be conducted. Also, donors might increase their support in the provision of anti-retroviral drugs. Family planning is an issue that donors have not taken a firm stand on so far. Sixth, even though education has been the major focus of the government’s commitment to poverty reduction, the current situation cannot be satisfactory. High enrolment rates in public primary schools have to be accompanied by an improved quality of the education. Besides, the question remains to be answered whether primary education is sufficient for achieving pro-poor growth, or whether the government should not additionally promote higher levels of education, vocational training for the poor in particular.
5
Conclusion
In this study, we aimed at evaluating the Ugandan economic performance of the past decade when high economic growth rates coincided with remarkable poverty reduction. Special emphasis was put on the question whether the country’s experience can be classified as one of pro-poor growth. We examined trends in poverty and how they relate to economic growth over the past 10 years, which we intend to summarise in the following conclusions. Between 1992 and 2003, the Ugandan population has experienced important welfare gains in terms of consumption. During the 1990s, consumption increases were broad-based, distributional shifts were only slightly negative or even pro-poor, and thus growth significantly reduced poverty from 56 percent in 1992 to 35 percent in 1999. By survey-based measures, growth was clearly pro-poor although the gains were not equally distributed across the country. Urban-rural disparities increased, and regional divergence could be observed. Growth was thus not pro-poor in the sense that it would have been concentrated in already disadvantaged areas. Since 1999, however, poverty has been rising again to 38 percent of the total population. This corresponds to an increase in the number of poor people from 7 million to 9 million within three years. This setback seriously reduces Uganda’s chances to achieve its goal of reaching a poverty level of 10 percent or less by 2017. It turned out that it was mainly the worsening income distribution that prevented growth, which has still been relatively high, from reducing poverty effectively. Inequality increased considerably, and the richest parts of the population gained most from economic growth during this period. In contrast to earlier years, inequality within rural and urban areas and within regions increased. Hence, pro-poor growth has not taken place recently.
93 We found out that the remarkable success in terms of poverty reduction during the 1990s can be mainly traced back to high growth rates in agriculture. Being an agrarian economy, Uganda depends heavily on this sector and its performance, which is why recent years have seen a setback in terms of poverty reduction. Since growth in agriculture has declined, poverty among agricultural households rose quite substantially and contributed to rising poverty as a whole. Insufficient diversification and deficient reforms have not succeeded in enabling the sector to absorb recent negative price shocks. Despite some improvements, agricultural households have diversified their income sources only modestly. Most of them are still only engaged in subsistence agriculture, as market integration remains limited. This is mainly due to lack of access to productive infrastructure in rural areas. Rural households have not been able to accumulate productive assets, which could sustain higher consumption levels. They face serious constraints in capital and land markets. In addition, natural resource degradation and environmental shocks threaten food security for many households. Overall, this fragility of the achievements in agricultural livelihoods threatens the future prospects for pro-poor growth. As a consequence, a large number of households have moved out of agriculture, and it can be expected that this trend will continue or even accelerate in the future. Urbanisation is likely to increase. It will be crucial for further poverty reduction efforts that these people find employment in productive jobs. MSE might play an essential role in absorbing them. As the results from our survey suggest, these enterprises face several serious constraints, and public policies with regard to MSE promotion and private sector development in general have not been satisfactory. Under the current circumstances, MSE do not provide an adequate platform for achieving pro-poor growth. Besides, low levels of education, poor health conditions of the population and insufficient access to infrastructure inhibit further and faster poverty reduction as well. Even though the government has made notable progress in securing pro-poor growth in the indirect way and hence in investing in the assets of the poor, we determined a number of remaining obstacles. Access to education improved considerably after the introduction of Universal Primary Education, and enrolment rates increased for children from all consumption quintiles. The gender bias that had previously existed has been fully eliminated. However, it has to be recognised that the poor, and girls in particular, are still more likely to stay away or drop out of school in higher grades. Poorer children are particularly disadvantaged in the access to secondary and tertiary schools. Achievements in the health sector are confined to the prevalence of HIV/AIDS. Other health indicators have not improved significantly, and more importantly, they have deteriorated for the poor. It appears that the recent abolition of cost-sharing brought about a significant improvement in the access to health care facilities. Poor people benefit in particular from public subsidies on primary
94 health care. In contrast, hospitals are mainly benefiting people from richer households, and in that sense, public spending is not fully distributed in a pro-poor way. Taken all these findings together, economic growth in Uganda in the past decade can only to a limited extent be classified as pro-poor. Direct pro-poor growth has taken place during the 1990s but not in recent years. Besides, the country lacks an effective system for redistributing the gains from growth to the poor. Thus, the scope for indirect pro-poor growth to take place turned out to be limited. This study outlined the major links between growth and poverty reduction in Uganda. However, some aspects of pro-poor growth need further and more detailed research. In order to better understand growth and pro-poor growth in Uganda we recommend further studies on the following issues: 1. A study of rural households, fertility rates and rural population growth. Extremely high rural population growth as it happened to take place during the last 20 years is not in favour of life chances of the Ugandan population, especially poor rural households including women. 2. An in-depth study of household income diversification, with special emphasis on nonfarm activities. Agricultural exports and food production for local markets are volatile. The distributional consequences as well as the possible contribution of diversification to poverty reduction should be assessed. 3. An in-depth study of MSE with focus on industrial clusters, collective efficiency and global value chains. Related studies in many other African countries show that urban and rural poverty reduction will be easier if MSE-development will be clustered, governed by “key firms” and integrated in value chains. 4. A related study of business support systems and analysis of research activities of Ugandan universities regarding MSE and recent transfer of technology, skills etc. could deepen knowledge of constraints of private sector development. This study should also include a study of school-leavers, their competence levels, and training. The increasing young population with UPE but without necessary vocational skills is a major challenge for pro-poor growth. 5. A study on the impact of decentralisation on poverty reduction and which role local governments play in achieving or inhibiting pro-poor growth. It seems that decentralising the provision of certain public services worsened, or at best didn’t improve, their supply and quality. Low local capacities seem to prevent the intended advantages of decentralisation to be realised. 6. A study on the relevance of different levels and types of schooling for achieving propoor growth. We expect that universal primary education has been a necessary but not a sufficient policy in order to secure an improvement in the employment situation of the majority of the population.
95
6
Bibliography
Ablo, Emmanuel and Ritva Reinikka (1998): Do budgets really matter? Evidence from public spending on education and health in Uganda, World Bank Policy Research Working Paper 1926, Washington D.C. Adelman, Irma and Steven J. Vogel (1992): The relevance of ADLI for sub-Saharan Africa, in: African Development Perspectives Yearbook 1990/91, pp. 258-285. Appleton, Simon (2001a): Changes in poverty and inequality, in: Reinikka, Ritva and Paul Collier (2001). Appleton, Simon (2001b): Poverty reduction during growth: The case of Uganda, 1992-2000, mimeo, University of Nottingham. Appleton, Simon (2002): Regional or national poverty lines: The case of Uganda in the 1990s, mimeo. Bahemuka, Pius K. (2001): Income tax in Uganda, Kampala. Bass, Hans-Heinrich (1997): Towards a new paradigm of informal sector labour markets, in: African Development Perspectives Yearbook, Vol. 5, pp. 275-288. Belshaw, D., P. Lawrence and M. Hubbard (1999): Agricultural tradables and economic recovery in Uganda: The limitations of structural adjustment in practice, in: World Development, Vol. 27, No. 4, pp. 673-690. Berthélemy, Jean-Claude and Ludvig Söderling (2001): Emerging Africa, Paris. Bevan, David L. (2001): The budget and medium-term expenditure framework in Uganda, Washington D.C. Bevan, David with Chris Adam, John Okidi and Fred Muhumza (2003): Poverty Eradication Action Plan revision 2003/03. Discussion paper on economic growth, investment and export promotion, July 30, 2003, mimeo, Kampala. Biggs, Tyler (2003): Is small beautiful and worthy of subsidy? Literature review, unp. Paper, World Bank. Bigsten, Arne and Steve Kayizzi-Mugerwa (2001): Is Uganda an emerging economy?, Nordiska Afrikainstitutet Research Report No. 118, Uppsala. Brownbrigde, Martin (2002): Resolving bank failures in Uganda: Policy lessons from recent bank failures, in: Development Policy Review, Vol. 20, No. 3, pp. 279-291. Chen, Duanjie, John Matovu and Ritva Reinikka (2001): A quest for revenue and tax incidence, in: Reinikka, Ritva and Paul Collier (eds.). Collier, Paul and Ritva Reinikka (2001): Reconstruction and liberalisation: An overview, in: Reinikka, Ritva and Paul Collier (eds.).
96 The COMPETE Project and Alice Gowa (2001): The path forward in Uganda’s coffee sector, Paper prepared for The Presidential Conference on Export Competitiveness, February 2001. Cotton, Linda, James Habyarimana, William Kalema, Chad Leechor, Jean Michel Marchat et al. (2003): Uganda investment climate assessment, Washington, D.C. (RPED), Draft, October 2003. Deininger, Klaus and John Okidi (2002): Growth and poverty reduction in Uganda, 19922000: Panel data evidence, mimeo. DeRosa, Dean A., Marios Obwona and Vernon O. Roningen (2002). The new EAC customs union: Implications for Uganda trade, industry competitiveness, and economic welfare, EPRC Occasional Paper 17, Kampala. Devarajan, Shantayanan, David Dollar and Torgny Holmgren (2001): Aid and reform in Africa: Lessons from ten case studies, Washington D.C. Diehl, Christoph and Heinz-Werner Marpmann (2003): Feasibility study on the transition of the Development Finance Department (DFD), Kampala. Dijkstra, Anneke Geske and Jan Kees van Donge (2001): What does the ‘show case’ show? Evidence of and lessons from adjustment in Uganda, in: World Development Vol. 29, No. 5, pp. 841-863. Dijkstra, Anneke Geske and Jan Kees van Donge (2003): What does the ‘show case’ show? Programme aid in Uganda, in: Howard N. White and Anneke Geske Dijkstra (eds.): Programme aid and development: Beyond conditionality, London. Dorward, Andrew, Jonathan Kydd, Jamie Morrisson and Ian Urey (2004): A policy agenda for pro-poor agricultural growth, in: World Development, Vo. 32, No. 1, pp 73-89. Ellis, Frank and Godfrey Bahiigwa (2003): Livelihoods and rural poverty reduction in Uganda, in: World Development, Vol. 31, No. 6, pp. 997-1013. Foster, Mick and Sadie Mackintosh-Walker (2001): Sector wide programmes and poverty reduction, Centre for aid and public expenditure, ODI, London. Foster, Mick and Peter Mijumbi (2001): How, when and why does poverty get budget priority? Uganda case study, EPRC Occasional Paper 5, Kampala. Gauthier, Bernard (2001): Productivity and exports, in: Reinikka, Ritva and Paul Collier (eds.). Gauthier, Bernard and Ritva Reinikka (2001): Shifting tax burdens through exemptions and evasion: An empirical investigation of Uganda, World Bank Policy Research Working Paper 2735, Washington D.C. Gibbon, Peter (2001): Upgrading primary production: A global commodity chain approach, in: World Development, Vol. 29, No. 2, pp. 345-363. Goverment of Uganda (2003): Strategies to promote economic growth. Progress report, Paper presented to the 2003 Consultative Group, May 2003, Kampala.
97 Hansen, Holger Bernt and Michael Twaddle (1998): Developing Uganda, Oxford. Hutchinson, Paul (2001): Combating illness, In: Reinikka, Ritva and Paul Collier (eds.). The IDEA Project (2001): Uganda’s horticulture sector: Fruits, flowers, vegetables and vanilla, Paper prepared for The Presidential Conference on Export Competitiveness, February 2001. IITA-Foodnet et al. (2001): Uganda’s Irish potatoe sector, Paper prepared for The Presidential Conference on Export Competitiveness, February 2001. IMF (2002a): Uganda – Updated debt sustainability analysis and assessment of public external debt management capacity, EBS/2/162, Washington D.C. IMF (2003b): Uganda: Financial system stability assessment, including reports on the observance of standards and codes, IMF Country Report No. 03/97, Washington D.C. IMF (2003): Uganda: Joint Staff assessment of the poverty reduction strategy paper annual progress report, IMF Country Report No. 03/300, Washington, D.C. IMF and World Bank (2001): Financial sector assessment program (FSAP): Main report, draft, Washington D.C. Jomo, K.S. (2001): Globalisation, liberalisation, poverty, and income inequality in Southeast Asia, OECD Technical Paper 185, Paris. Kaelin, Andrew J. and Ian G. Cowx (2002). Outline of the path forward in Uganda’s fisheries sector, Paper prepared for The Presidential Conference on Export Competitiveness, February 12,2002. Kakwani, Nanak and Ernesto M. Pernia (2000): What is pro-poor growth?, in: Asian Development Review, Vol. 18, No. 1, pp 1-16. Kakwani, Nanak, Shahidur Khandker and Hyun H. Son (2003): Poverty equivalent growth rate: with applications to Korea and Thailand, mimeo, World Bank. Kappel, Robert, Utz Dornberger, Michaela Meier and Ute Rietdorf (eds.) (2003): Klein- und Mittelunternehmen in Entwicklungsländern, Hamburg. Kasekende, L.A. and M. Atingo-Edo (1999): Uganda’s experience with aid, in: Journal of African Economies, Vol. 8, No. 4, pp. 617-649. Keefer, Philip (2000): Growth and poverty reduction in Uganda: The role of institutional reform, Draft paper 4/27/00, World Bank. Kempaka, Gloria and Marios Obwona (2000): Review of budget allocation and out-turns, EPRC Kampala. Klasen, Stephan (2003): In search of the holy grail. How to achieve pro-poor growth?, in: Tungodden, B. and N. Stern (eds.): Towards pro-poor policies. Proceedings from the ABCDE Europe, Washington D.C.
98 Krasemann, Dieter (1996): Studie zur Kleingewerbeförderung in Uganda. Ein Report an den Deutschen Entwicklungsdienst, Kampala. Kyomugisha, Charity (2001): The state and small-scale industrialization in Uganda, Centre for Basic Research Working Paper No. 69/2001, Kampala. Lall, Sanjaya (2002): Failing to compete: Technology development and technology systems in Africa, Cheltenham. Lanjouw, Peter et al. (2001): Poverty, education and health in Indonesia: Who benefits from public spending?, World Bank Policy Research Working Paper 2739, Washington D.C. Larson, Donald and Klaus Deininger (2001): Crop markets and household participation, in: Reinikka, Ritva and Paul Collier (eds.). Lentz, Andrew (2002): Assessing the impact of Uganda’s Poverty Action Fund. A participatory rural appraisal in Kamuli District, online WorldLearning publication. Liedholm, Carl and Donald Mead (1999): Small enterprises and economic development: The dynamics of micro and small enterprises, London. McDonald, Calvin, Christian Schiller and Kenichi Ueda (1999): Income distribution, informal safety nets, and social expenditures in Uganda, IMF Working Paper 99/163, Washington D.C. McGee, Rosemary (2000): Analysis of participatory poverty assessment (PPA) and household survey findings on poverty trends in Uganda, Mission Report, Kampala. Ministry of Finance, Planning and Economic Development. MFPED (2000a): Participatory poverty assessment report. Learning from the poor, Kampala. MFPED (2000b): Plan for the modernisation of agriculture, Kampala. MFPED (2001): Poverty eradication action plan, Kampala. MFPED (2002a): Budget speech, Kampala. MFPED (2002b): Participatory poverty assessment process. Deepening the understanding of poverty, Kampala. MFPED (2003a): Medium-term competitive strategy for the private sector, 2000-2005, Kampala. MFPED (2003b): MSE Brochure, Kampala. MFPED (2003c): Uganda poverty status report, Kampala. Ministry of Finance and Economic Planning (MFEP) (1995): Demographic and health survey 1995, Statistics Department, Entebbe. Mugume, Adam and Marios Obwona (2001): Credit accessibility and investment decisions in Uganda’s manufacturing sector: An empirical investigation, EPRC Rsearch Series No. 27, Kampala.
99 Nalumansi, Sarah R., Silas Oluka, Siegfried Müller-Maige and Günter Rösch (2002): Skilled manpower in Uganda. Report prepared for the European Union, Kampala. Nel, Marian and Janet Shapiro (2003): Exploring options: Non-formal education options in Uganda, Prepared for GTZ/PEVOT Uganda, November 2003, Kampala. Okidi, John and Sarah Ssewanyana (2003) Income poverty in Uganda, 1992-2003, Power Point Presentation at the Consultative Conference on PEAP Revision and 2004/05 – 2006/07 Budget Framework, 28th – 30th October, 2003, Kampala. Okidi, John A., Okwi, Paul O. and John S. Ddumba (2000): Welfare distribution and poverty in Uganda, 1992-1997, EPRC Occasional Paper No. 6, Kampala. Okurut, Francis Nathan, Jonathan J.A.O. Odwee and Asaf Adebua (1999): Determinants of regional poverty in Uganda, EPRC Research Series No. 8, Kampala. Opolot, Samson James (2001): How universal is universal primary education? A case study on access and equity dimensions in Arua, Gulu and selected schools in Kampala, Report prepared for ActionAid-Uganda/CBR study on “Contradictions in UPE in Uganda”. Otim, Peter O. (2001): Revisiting the curriculum: A study on the relevance of the primary schools curriculum for fishing and pastoral communities, Report prepared for ActionAidUganda/CBR study on “Contradictions in UPE in Uganda”. Pfaffe, Joachim Friedrich et al. (2003): Mid-term review of the Education Strategic Investment Plan (ESIP) in Uganda. Final report, Kampala. Ponte, Stefano (2001a): The ‘latte revolution’? Winners and losers in the restructuring of the global coffee marketing chain, CDR Working Papers 01.3, Copenhagen. Ponte, Stefano (2001b): Coffee markets in East Africa: Local responses to global changes or global responses to local challenges, CDR Working Papers 01.5, Copenhagen. Ravallion, Martin (1999): When is growth pro-poor? Evidence from the diverse experiences of India’s states, World Bank Policy Research Working Paper No. 2263, Washington D.C. Ravallion, Martin (2001): Growth, inequality, and poverty: Looking beyond averages, in: World Development, Vol. 29, No. 11, pp. 1803-1815. Ravallion, Martin and Shaohua Chen (2003): Measuring pro-poor growth, in: Economics Letters, Vol. 78, No. 1, pp. 93-99. Reinikka, Ritva (2001): Recovery in service delivery: Evidence from schools and health centers, in: Reinikka, Ritva and Paul Collier (eds.). Reinikka, Ritva and Jakob Svensson (2002): Coping with poor public capital, in: Journal of Development Economics, Vol. 69, No.1, pp. 51-69. Reinikka, Ritva and Paul Collier (eds.) (2001): Uganda's recovery. The role of farms, firms, and government, Washington D.C. Rudaheranwa, Nichodemus (2000): Transport costs and protection for Ugandan industry, in: Jalilian, Hossein, Michael Tribe and John Weiss (eds.).
100 Sarris, Alexander H. and Roger van den Brink (1993): Economic policy and household welfare during crisis and adjustment in Tanzania, New York. Schoepf, Brooke Grundfest (2003): Uganda. Lessons for AIDS control in Africa, in: Review of African Political Economy, Vol. 30, No. 98, pp. 553-572. Sengendo, Hannington, Tonny Oyana, Bob Nakileza and Paul Musali (2001): The informal sector in employment creation in Kampala, in: Alila, Patrick O. And Poul Ove Pedersen (eds.). Sørensen, Pernille (2001): Trust – a cornerstone in trade: the economic universe of Iganga maize-traders in Uganda, in: Alila, Patrick O. And Poul Ove Pedersen (eds.). Svensson, Jakob (2002): Who must pay bribes and how much? Evidence from a cross-section of firms, in: The Quarterly Journal of Economics, Vol. 118, No. 1, pp. 207-230. Tribe, Michael (2000): The concept of “infant industry” in a sub-Saharan African context, in: Jalilian, Hossein, Michael Tribe and John Weiss (eds.). Uganda Bureau of Statistics (UBOS) (2001): Demographic and Health Survey 2000-2001, Uganda Bureau of Statistics, Entebbe. Uganda Bureau of Statistics (UBOS) (2003): A report on the Ugandan Business Register, 2001/2002, Entebbe. Uganda Microfinance Capacity Building Framework (UCAP) (2001): The Uganda micro finance capacity building framework, draft, Kampala. Uganda Microfinance Outreach Plan (2001): Extending the outreach of sustainable microfinance in Uganda. Implementation plan, Kampala. Weder, Beatrice (2003): Obstacles facing smaller business in developing countries, in Gary S. Fields and Guy Pfeffermann, eds, Pathways out of poverty. Private firms and economic mobility in developing countries, Boston, Dordrecht, London. White, Howard and Anneke Geske Dijkstra (2003): Programme aid and development: Beyond conditionality, London. Williamson, Tim and Sudarshan Canagarajah (2003): Is there a place for virtual poverty funds in pro-poor public spending reform? Lessons from Uganda’s PAF, in: Development Policy Review, Vol. 21, No. 3, pp. 449-480. Wood, Adrian and Kate Jordan (2000): Why does Zimbabwe export manufactures, and Uganda not?, in: The Journal of Development Studies, Vol. 37, No. 2, pp. 91-116. World Bank (2002): The Republic of Uganda. Public expenditure review. Report on the progress and challenges of budget reforms, Washington D.C.