... of the MM Algorithm. 1. The MM algorithm is not an algorithm, but a prescription
... An MM algorithm operates by creating a surrogate function that minorizes or ...
The MM Algorithm Kenneth Lange Departments of Biomathematics, Human Genetics, and Statistics UCLA
April, 2007
Overview of the MM Algorithm
1. The MM algorithm is not an algorithm, but a prescription for constructing optimization algorithms.
2. The EM algorithm from statistics is a special case.
3. An MM algorithm operates by creating a surrogate function that minorizes or majorizes the objective function. When the surrogate function is optimized, the objective function is driven uphill or downhill as needed.
4. In minimization MM stands for majorize/minimize, and in maximization MM stands for minorize/maximize. 1
History of the MM Algorithm 1. Ortega and Rheinboldt (1970) enunciate the principle in the context of line search methods. 2. de Leeuw and Heiser (1977) present an MM algorithm for multidimensional scaling contemporary with the classic Dempster et al. (1977) paper on EM algorithms. 3. Subsequent appearances: robust regression (Huber, 1981), quadratic lower bound principle (B¨ ohning & Lindsay,1988), medical imaging (Lange et al, 1987, De Pierro, 1995; Lange & Fessler, 1995), quantile regression (Hunter & Lange, 2000), survival analysis (Hunter & Lange, 2002), paired and multiple comparisons (Hunter, 2004), variable selection (Hunter & Li, 2002), DNA sequence analysis (Sabatti & Lange, 2002), and discriminant analysis (Lange & Wu, 2006). 2
Rationale for the MM Principle
1. It can generate an algorithm that avoids matrix inversion.
2. It can separate the parameters of a problem.
3. It can linearize an optimization problem.
4. It can deal gracefully with equality and inequality constraints.
5. It can turn a non-differentiable problem into a smooth problem. 3
Majorization and Definition of the Algorithm 1. A function g(θ | θn ) is said to majorize the function f (θ) at θn provided f (θn ) = g(θn | θn ) f (θ) ≤ g(θ | θn)
for all θ.
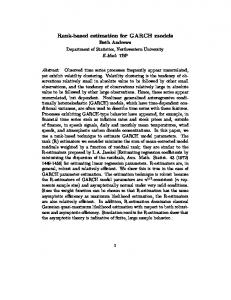
The majorization relation between functions is closed under the formation of sums, nonnegative products, limits, and composition with an increasing function. 2. A function g(θ | θn ) is said to minorize the function f (θ) at θn provided −g(θ | θn ) majorizes −f (θ). 3. In minimization, we choose a majorizing function g(θ | θn ) and minimize it. This produces the next point θn+1 in the algorithm. 4
0.0
0.5
1.0
1.5
A Quadratic Majorizer
−2
−1
0
1
2
5
Descent Property
1. An MM minimization algorithm satisfies the descent property f (θn+1 ) ≤ f (θn ) with strict inequality unless both g(θn+1 | θn ) = g(θn | θn ) f (θn+1 ) = g(θn+1 | θn ).
2. The descent property follows from the definitions and f (θn+1 ) = g(θn+1 | θn ) + f (θn+1 ) − g(θn+1 | θn ) ≤ g(θn | θn ) + f (θn ) − g(θn | θn ) = f (θn ).
3. The descent property makes the MM algorithm very stable. 6
Generic Methods of Majorization and Minorization
1. Jensen’s inequality — EM algorithms 2. Chord above the graph property of a convex function — image reconstruction 3. Supporting hyperplane property of a convex function 4. Quadratic upper bound principle — B¨ ohning and Lindsay 5. Arithmetic-geometric mean inequality 6. The Cauchy-Schwartz inequality — multidimensional scaling 7
Chord and Supporting Hyperplane Properties 4
3.5
3
2.5
2
1.5
1
0.5
0 −1
−0.8
−0.6
−0.4
−0.2
0 x
0.2
0.4
0.6
0.8
1
8
Example 1: Finding a Sample Median
1. Consider the sequence of numbers y1 , . . . , ym. The sample median θ minimizes the non-differentiable criterion f (θ) =
n X
|yi − θ|.
i=1
2. The quadratic function hi(θ | θn ) =
1 1 (yi − θ)2 n| + |y − θ i 2 |yi − θn | 2
majorizes |yi − θ| at the point θn . P n) majorizes f (θ). h (θ | θ 3. Hence, g(θ | θn ) = n i i=1 9
15
20
A Sum of Quadratic Majorizers
10
x
x
5
x x
0
1
2
3
x
4
5
6
10
Example 1: MM Algorithm
1. The minimum of the quadratic g(θ | θn ) =
# n " 2 X (yi − θ) 1 n| . + |y − θ i 2 i=1 |yi − θn |
occurs at θn+1 =
Pn n i=1 wi yi Pn n i=1 wi
for win = |yi − θn |−1. 2. The algorithm works except when a weight win = ∞. It generalizes to sample quantiles, to least L1 regression, and to quantile regression. 11
Example 2: Bradley-Terry Ranking
1. Consider a sports league with m teams. Assign team i the skill level θi. Bradley and Terry proposed the model Pr(i beats j) =
θi . θi + θj
2. To ensure that the skill levels are identifiable, set θ1 = 1.
3. If bij is the number of times i beats j, then the likelihood of the data is L(θ) =
Y i,j
θi θi + θj
!b ij
.
12
Example 2: Loglikelihood 1. We estimate θ by maximizing f (θ) = ln L(θ) and then rank the teams on the basis of the estimates. 2. The form of the loglikelihood f (θ) =
X
h
bij ln θi − ln(θi + θj )
i
i,j
suggests that we work on the term − ln(θi + θj ) if we want to separate parameters. 3. Hence we apply the supporting hyperplane property h(y) ≥ h(x) + ∇h(x)t (y − x), of a convex function h(x). For the choice h(x) = − ln x, this minorization amounts to − ln y ≥ − ln x − 1 x (y − x). 13
Example 2: Minorization 1. The minorization − ln y ≥ − ln x − (y − x)x−1 produces the surrogate g(θ | θn ) =
X
θi + θj bij ln θi − ln(θin + θjn ) − n + 1 . n θi + θj i,j
2. Because the parameters are separated, the optimal point θin+1 = P
P j6=i bij
n n j6=i(bij + bji)/(θi + θj )
is easy to find.
3. Under natural assumptions, these MM iterates converge to the unique maximum likelihood point. 14
Example 3: Random Graph Model
1. Random graphs provide interesting models of connectivity in genetics and internet node ranking.
2. In a simplified version of the Chatterjee and Diaconis model, we assign a propensity pi ∈ [0, 1] to each node i. 3. An edge between nodes i and j then forms independently with probability pipj . In other words, for a handshake to occur, both parties must agree.
4. The most obvious statistical question in the model is how to estimate the pi from data. Once this is done, we can rank nodes by their estimated propensities. 15
Example 3: Loglikelihood
1. If E denotes the edge set of the graph, then the loglikelihood can be written as L(p) =
X {i,j}∈E
h
i
ln pi + ln pj +
X
ln(1 − pipj ).
(1)
{i,j}6∈E
Here {i, j} denotes a generic unordered pair.
2. The logarithms ln(1 − pipj ) are the bothersome terms in the loglikelihood.
3. We will minorize each of these by exploiting the concavity of the function ln(1 − x). 16
Example 3: Two Successive Minorizations
1. Using the concavity of ln(1 − x) gives the minorization ln(1 − pi pj ) ≥ ln(1 − pnipnj ) −
1 (pipj − pni pnj ) 1 − pnipnj
and eliminates the logarithm.
2. This minorization is not quite good enough to separate parameters, however. Separation can be achieved by invoking the second minorizing inequality 1 pnj 2 pi + −pi pj ≥ − ( 2 pni
pni 2 pj ). pnj
Note again that equality holds when all pi = pni . 17
Example 3: MM Algorithm
1. It follows that L(p) is minorized by the function g(p | pn ) =
X
h
ln pi + ln pj
{i,j}∈E X
+
i
"
ln(1 − pni pnj ) −
{i,j}6∈E
1 pnj 2 1 pi + ( 1 − pnipnj 2 pni
pni 2 pj ) . pnj
∂ g(p | p ) = 0 and let d denote the degree of node 2. If we set ∂p n i i i, then the MM update is
pn+1,i =
√
pni P
di
pnj {i,j}6∈E 1−pnipnj
1/2
(2)
.
18
#
Example 3: Comments on the MM Algorithm
1. If by chance pn+1,i > 1, then it is prudent to set pn+1,i = 1−� for � > 0 very small.
2. When di = 0, the MM algorithm makes the sensible choice pn+1,i = 0.
3. Step doubling produces an algorithm close to the Chatterjee and Diaconis algorithm for estimating the propensities.
4. This derivation extends to random directed graphs and generates MM updates for ingoing and outgoing propensities. 19
Example 4: Transmission Tomography 1. In transmission tomography, high energy photons are beamed from an external source through the body to an external detector. 2. The plane region of an X-ray slice is divided into small pixels, and pixel j is assigned attenuation coefficient θj . 3. The number of photons beamed along projection i (line of flight) is Poisson distributed with mean di. Transmitted counts yi for different projections are independent. 4. A photon entering pixel j along projection i successfully traverses the pixel with Poisson probability e−lij θj , where lij is the intersection length of the projection and pixel. 20
Example 4: Cartoon of Transmission Tomography
Source @ @ @ @ @ @ @ @ @ @ @ @ @ @ @ @ @ @ @ R @
Detector
21
Example 4: Loglikelihood
1. The probability that a photon transmitted along projection i is detected is given by the exponentiated line integral e−hli,θi , P where hli, θi = j lij θj .
2. The loglikelihood under the model for transmission tomography is f (θ) =
X i
fi(hli , θi) =
Xh
i −hl ,θi −die i + yi ln di − yihli , θi − ln yi! .
i
3. Note that the function fi(s) = −di e−s − ys + ci is strictly concave. 22
Example 4: Minorization
1. Now consider the composition of a concave function fi(s) and a linear function hli , θi, and set αn ij =
lij θjn hli, θn i
.
Because fi(s) is concave,
X θj n n n θj n fi (hli, θi) = fi αij n hli, θ i ≥ αij fi hl , θ i . i n θ θ j j j j with equality when θ = θn. X
2. This term-by-term minorization for each projection yields an overall minorization g(θ | θn ) that separates the parameters. 23
Example 4: MM Algorithm 1. Maximization of the surrogate function can be accomplished by applying Newton’s method parameter by parameter. 2. This treatment omits smoothing terms. These also can be minorized to give a surrogate function with separated parameters. 3. The Poisson model accounts for random variation and allows simultaneous smoothing. 4. The images produced by the Poisson model and the MM algorithm are superior to images produced by standard Fourier methods using the Radon transform. Thus, patient X-ray doses can be lowered without compromising image quality. 24
Example 5: Machine Learning Discriminant Analysis
1. To discriminate among k + 1 categories, choose k + 1 vectors in Rk to form the vertices of a regular tetrahedron. Each training case i is assigned to a vertex via its indicator ui.
2. For p observed cases, define the regularized risk function R(A, b) =
p X i=1
kui − Axi − bk� + λ
k X
kaj k2,
j=1
where atj is the jth row of a k × q matrix A of regression coefficients, b is a k × 1 column vector of intercepts, and kvk� = max{kvk − �, 0} denotes �-insensitive distance on Rk for a fixed � > 0. Estimate A and b by minimizing R(A, b). 25
Example 5: Rationale for Risk Function
1. Choosing the vertices of a regular tetrahedron makes all vertices equidistant.
2. Euclidean distance is less sensitive to large residuals than Euclidean distance squared.
3. In predicting membership, it does not make much difference how close the linear predictor is to the artificial indicator ui. Hence, �-insensitive distance. 4. Unless the number of cases is much larger than the number of features, estimates of the regression coefficients tend to be poor. Hence the need for regularization. 26
Example 5: Quadratic Majorization of kyk� Repeated application of the Cauchy-Schwarz inequality produces the majorizer 1 kxk2 + 1 kyk − � 2 2kyk 1 2 kx − yk q(x | y) = 4(�−kyk) 1 2 kx − zk 4(�−kzk)
kyk ≥ 2� kyk < � � < kyk < 2�
of kyk�, where in the last case z = cy with the positive contraction constant c chosen so that kzk = 2�−kyk. There is no majorization in the anomalous situation kyk = �.
27
1.5 1.0 0.5 0.0
loss function
2.0
2.5
Loss Function versus Surrogate Function
−3
−2
−1
0
1
2
3
x
28
1.5 1.0 0.5 0.0
loss function
2.0
2.5
Loss Function versus Surrogate Function
−3
−2
−1
0
1
2
3
x
29
Example 5: Performance of the Discriminant Method
1. On standard test problems, the machine learning method performs well compared to other methods of discriminant analysis.
2. The MM algorithm is much simpler to program then competing algorithms that solve the dual problem to risk function minimization. For k +1 categories, each MM update involves solving k different weighted least squares problems.
3. The MM algorithm is reasonably fast. Step doubling halves the number of iterations until convergence. 30
Error Rates for Examples from the UCI Data Repository Method TDA LDA QDA KNN OVR MSVM AltMSVM CART Random forest
Wine 0 0.0112 0.0169 0.0506 0.0169 0.0169 0.0169 0.1404 0.0674
Glass 0.2970 0.4065 NA 0.2991 0.3458 0.3645 0.3170 0.1449 0.1589
Zoo Lymphography 0 0.0541 NA 0.0878 NA NA 0.0792 0.1351 0.0099 0.0541 NA NA NA NA 0.1683 0.1351 0.0297 0.0135
1. For the wine and glass data, the error rates are average misclassification rates based on 10-fold cross validation. 2. The error rates for the zoo and lymphography data refer to training errors. 31
Example 6: Convex Programming 1. In convex programming we minimize a smooth function f (θ) subject to concave inequality constraints vj (θ) ≥ 0. 2. In view of the supporting hyperplane property, n) v (θ j g(θ | θn ) = f (θ) + ω + ∇vj (θn )t(θ − θn )]. [vj (θn ) ln vj (θ) j majorizes f (θ). Here ω is any positive constant.
X
3. The presence of the term ln vj (θ) in g(θ | θn ) works as a barrier to prevent the event vj (θ(m+1) ) ≤ 0 from occurring. 4. The multiplier vj (θn ) of ln vj (θ) gradually adapts and allows vj (θn+1 ) to tend to 0 if it is inclined to do so. 32
Example 6: Implementation of the MM Algorithm
1. The MM minimization algorithm must start with a point in the interior of the feasible region. All iterates stay within the interior region. Inequality constraints are implicit.
2. The minimization step of the MM algorithm can be carried out approximately by Newton’s method.
3. When there are linear equality constraints Aθ = b in addition to the inequality constraints vj (θ) ≥ 0, these should be enforced during the minimization of g(θ | θn ). Majorization disposes of the inequality constraints. 33
Example 6: Derivation of the Majorizer 1. Since −vj (θ) is convex, −vj (θ) + vj (θn ) ≥ −∇vj (θn )t(θ − θn ). 2. Because − ln y + ln x ≥ −(y − x)x−1 , h i n n vj (θ ) − ln vj (θ) + ln vj (θ ) ≥ vj (θn ) − vj (θ).
3. Adding the last two inequalities, we see that h i n n vj (θ ) − ln vj (θ) + ln vj (θ ) + ∇vj (θn )t (θ − θn ) ≥ 0, with equality when θ = θn.
4. Summing the last inequality over j and multiplying by the positive constant ω gives the majorizer. 34
Example 6: Geometric Programming Consider minimizing f (x) = (x1x2 x3 )−1 + x2 x3 subject to the constraint v(x) = 4 − 2x1x3 − x1 x2 ≥ 0 for positive values of the xi. Under the change of variables xi = eθi , the program is convex, and the MM algorithm with ω = 1 gives: Iteration n 1 2 3 4 5 10 15 20 25
f (x n ) 2.0000 1.6478 1.5817 1.5506 1.5324 1.5040 1.5005 1.5001 1.5000
xn 1 1.0000 1.5732 1.7916 1.8713 1.9163 1.9894 1.9986 1.9998 2.0000
xn 2 1.0000 1.0157 0.9952 1.0011 1.0035 1.0011 1.0002 1.0000 1.0000
xn 3 1.0000 0.6065 0.5340 0.5164 0.5090 0.5008 0.5001 0.5000 0.5000 35
Local Convergence of an MM Algorithm 1. The MM map M (θ) gives the unique point M (θn ) = θn+1 that optimizes g(θ | θn ). 2. At the optimal point θˆ, one can show that M (θ) has differential h i 2 −1 2 2 dM (θˆ) = −d g(θˆ | θˆ) d f (θˆ) − d g(θˆ | θˆ)
in the absence of constraints. 3. The linear rate of convergence depends on the largest eigenvalue of the differential. All eigenvalues lie on [0,1). 4. In a practical sense, the rate of convergence depends on how well the surrogate function g(θ | θn ) approximates f (θ). 36
Global Convergence of an MM Algorithm
1. If an objective function is strictly convex or concave, then the MM algorithm will converge to the unique optimal point, assuming it exists.
2. If convexity or concavity fail, but all stationary points are isolated, then the MM algorithm will converge to one of them.
3. This point can be a local optimum, or in unusual circumstances, even a saddle point.
4. There exists methods for accelerating the convergence of MM and EM algorithms. 37
Remaining Challenges
1. Devise new MM algorithms, particularly for high dimensional problems.
2. Quantify the local rate of convergence of the MM algorithm in the presence of inequality constraints. When does an MM algorithm converge at a sublinear rate?
3. Estimate the computational complexity of the convex programming and other MM algorithms.
4. Devise better ways of accelerating MM and EM algorithms. 38
References
1. de Leeuw J, Heiser WJ (1977), Convergence of correction matrix algorithms for multidimensional scaling. Geometric Representations of Relational Data (editors Lingoes JC, Roskam E , Borg I), pp. 735–752, Mathesis Press
2. Hunter DR, Lange K (2004) A tutorial on MM algorithms. Amer Statistician 58:30–37
3. Lange, K (2004) Optimization. Springer-Verlag, New York
4. Lange K, Hunter DR, Yang I (2000) Optimization transfer using surrogate objective functions (with discussion). J Comput Graphical Stat 9:1–59 39