REVIEWS
The model organism as a system: integrating ‘omics’ data sets Andrew R. Joyce* and Bernhard Ø. Palsson‡
Abstract | Various technologies can be used to produce genome-scale, or ‘omics’, data sets that provide systems-level measurements for virtually all types of cellular components in a model organism. These data yield unprecedented views of the cellular inner workings. However, this abundance of information also presents many hurdles, the main one being the extraction of discernable biological meaning from multiple omics data sets. Nevertheless, researchers are rising to the challenge by using omics data integration to address fundamental biological questions that would increase our understanding of systems as a whole.
Terabyte A unit of computerinformation-storage capacity that is equal to one trillion bytes or one thousand gigabytes.
Data mining An analytical discipline that is focused on finding unsuspected relationships and summarizing often large observational data sets in new ways that are both understandable and useful to the data owner.
Omics data set A generic term that describes the genome-scale data sets that are emerging from highthroughput technologies. Examples include wholegenome sequencing data (genomics) and microarraybased genome-wide expression profiles (transcriptomics).
*Bioinformatics Program and ‡ Department of Bioengineering, University of California, San Diego, 9500 Gilman Drive, La Jolla, California 92093-0412, USA. e-mails:
[email protected];
[email protected] doi:10.1038/nrm1857
The completion and publication of the Haemophilus influenzae genome sequence in 1995 (REF. 1) marked a significant phase transition in the history of biological research. The advent of whole-genome sequencing and other high-throughput experimental technologies transformed biological research from a relatively datapoor discipline into one that is data rich. An important challenge that is faced by investigators today lies in interpreting these large-scale data sets and thereby deriving fundamental and applied biological information about whole systems. The challenge that comes with information-rich environments is not unique to post-genomics biological research. Modern data sets in many disciplines are frequently immense in size. For example, National Oceanic and Atmospheric Administration (NOAA) satellites, which are used to monitor global climate change, generate approximately one terabyte of data per day2. Furthermore, the international retail giant Wal-Mart maintains a database of nearly 460 terabytes that contains product information and details on the customers who buy them3. This onslaught of available information has driven the development of important data-mining techniques that are devoted to uncovering details that are of practical value for various applications4. Although their size is often on the same, or a smaller, scale compared with other modern data sets, significant challenges are unique to modern post-genomics data sets. For example, many technological platforms, both hardware and software, are available for several ‘omics’ data types, but some of these are prone to introducing technical artefacts5. This can bias the data, which can falsely expose sample differences in the absence of a
biological cause. In addition, uniform, standardized data representations are not always adopted6, which complicates cross-experiment comparisons. Data-quality, context and lab-to-lab variations represent another important hurdle that must be overcome in genome-scale science7. Despite these challenges, however, investigators are making progress in identifying, extracting and interpreting biological insights from omics data sets. One successful approach to doing so requires the integration of omics data. Here, we review some of the recent work that is being conducted around the world with regards to studying biology at the systems level in this way 8. We will first introduce many of the omics methods and data types that are currently available to researchers. We will then discuss several recently developed data-integration techniques and the types of problems that they are designed to tackle. We will also highlight a number of recent studies that successfully integrated omics data to address important biological questions. Finally, the article will conclude with a discussion of the challenges that face the field as well as its future directions. The advent of high-throughput DNA sequencing in the mid-1990s was quickly followed by technological innovations that provide genome-scale measurements for many of the molecular species that exist within the cell (FIG. 1). The description of the cellular network that these omics data provide for a given time and/or condition can be classified into three broad categories: components, interactions and functional states. Components data yield information regarding the specific molecular content of the cell or system.
198 | MARCH 2006 | VOLUME 7
www.nature.com/reviews/molcellbio
© 2006 Nature Publishing Group
F O C U S O N M O D E L L I N G C E L L U L A R SRY MS ES VTI EEW Components
Gene
Genomics
Interactions Protein–DNA interaction
Transcription factor Transcriptomics
mRNA
Proteomics
Protein products Protein–protein interaction
Metabolomics Glycomics Lipidomics
A
B
C Functional states Fluxomics
ATP ADP A
F
B
G
C D E Localizomics
J
L
H K
K
M Phenomics
Components data Genomics. Genomics, which is defined here as the study of the whole genome sequence and the information contained therein, is clearly the most mature of the different omics fields. Since 1995, nearly 300 genome-sequencing projects, with representative species from each of the three kingdoms of life, have been completed9 and hundreds more are underway. The raw sequence data themselves are facilitating many fascinating comparative genomics studies that are designed to identify gene-regulatory elements10, to understand speciation11, and to refine our idea of the evolutionary tree of life12. Beyond the simple genome sequence, genome annotation defines the complement of proteins and functional RNAs that are available to the cell, as well as their associated regulatory elements. For example, many computational efforts have addressed the task of identifying transcription-factor-binding sites in genomic sequences, as shown in a recent study in which a critical performance assessment of many available tools was conducted13. So-called ORFeome projects are also underway to isolate experimentally each protein-coding component that is encoded by the open reading frames (ORFs) of a system. These projects — which will validate computational predictions, isolate and characterize splice variants, and facilitate downstream functional analyses14 — are currently ongoing for many organisms, including the nematode Caenorhabditis elegans, humans and the pathogen Brucella melitensis.
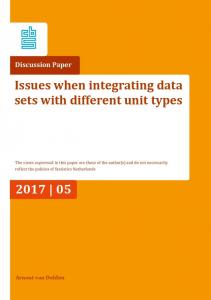
Figure 1 | ‘Omics’ data are providing comprehensive descriptions of nearly all components and interactions within the cell. Omics data sets that describe virtually all biomolecules in the cell are starting to become available. These data can be generally classified into three categories: components, interactions and functional-states data. Components data detail the molecular content of the cell or system, interactions data specify links between molecular components, and functional-states data provide an integrated readout of all omics data types by revealing the overall cellular phenotype. The central pathway traces the biological information flow from the genome to the ultimate cellular phenotype, and the available omics data types that are used to describe these processes are indicated in the adjacent boxes. From the top, DNA (genomics) is first transcribed to mRNA (transcriptomics) and translated into protein (proteomics), which can catalyse reactions that act on and give rise to metabolites (metabolomics), glycoproteins and oligosaccharides (glycomics), and various lipids (lipidomics). Many of these components can be tagged and localized within the cell (localizomics). The processes that are responsible for generating and modifying these cellular components are generally dictated by molecular interactions, for example by protein–DNA interactions in the case of transcription, and protein–protein interactions in translational processes as well as enzymatic reactions. Ultimately, the metabolic pathways comprise integrated networks, or flux maps (fluxomics), which dictate the cellular behaviour, or phenotype (phenomics).
Transcriptomics. The field of transcriptomics provides information about both the presence and the relative abundance of RNA transcripts, thereby indicating the active components within the cell. Since the mid-tolate 1990s, countless genome-wide studies have examined the dynamics of gene expression in many model systems and environments. Microarrays15 and serial analysis of gene expression (SAGE)16 represent the most well-used approaches and have been applied to many model systems, as well as to the study of genes that are predominantly expressed in stem cells17, to classifying the molecular subtypes of human cancers18, and to monitoring the host-cell transcriptional response to pathogens19. Even though these types of transcriptomics studies provide crucial information regarding the expression state, or primary genomics readout of the cell, it must be recognized that various levels of post-transcriptional control might rival its importance and are not captured by these analyses20.
Interactions data specify the connectivity that exists among the molecular species, thereby defining the network ‘scaffold’ within the cell or system. Finally, functional-states data reveal the overall behaviour, or phenotype, of the cell or system. The following sections briefly introduce many omics technologies that are used by researchers to generate these data in the context of these three categories, and many useful online resources that contain publicly accessible data are summarized in TABLE 1.
Proteomics. Ultimately, proteomics aims to identify and quantify the cellular levels of each protein that is encoded by the genome. Methods based on two-dimensional gel electrophoresis and mass spectrometry are the most popular strategies21. High-throughput, quantitative, western-blot methods have also been implemented, but require extraordinary efforts and resources22. The proteomes of many cellular structures and organelles, such as the cytoskeleton and mitochondria, have been assessed23. Additional recent efforts are being devoted to developing next-generation technologies that will allow
NATURE REVIEWS | MOLECULAR CELL BIOLOGY
VOLUME 7 | MARCH 2006 | 199
© 2006 Nature Publishing Group
REVIEWS Serial analysis of gene expression (SAGE). An experimental technique for transcriptome analysis through the massive sequential analysis of short cDNA sequence tags. The cDNA tags are derived from cellular or tissue mRNA for which the corresponding genes can be identified, and the total count of cDNA tags for each gene represents an accurate measurement of its expression level.
Mass spectrometry An analytical technique that identifies biochemical molecules (such as proteins, metabolites or fatty acids) on the basis of their mass and charge.
for the better characterization of proteome–phenotype relationships by elucidating more fully the link between protein-expression profiles and distinct cellular processes or conditions24. In particular, one strategy that is being developed involves overcoming the problem of detecting only the most highly represented proteins in biological samples by focusing on unique characteristic peptides for each protein or protein isoform24. Metabolomics/metabonomics. The discipline of metabolomics seeks to identify the complete set of metabolites, or the metabolome, of the cell. The related metabonomics field specifically studies the dynamic metabolic response of living systems to environmental stimuli or genetic perturbation, and for the purposes of this review will be treated as an equivalent data type25. The metabolome represents the output that results from the cellular integration of the transcriptome, proteome and interactome (described in the next section)26, and therefore provides not only a list of metabolite components but also a functional readout of the cellular state. As one of the newer
omics data types, the methods that are used to generate these data are still being refined, and typically rely on mass spectrometry, NMR spectroscopy and vibrational spectroscopy27 to analyse the metabolite contents that are extracted from isolated cells or tissues. Given the highly diverse set of biomolecules and the large dynamic range of metabolite concentrations that require detection, modern techniques must capture hundreds of distinct chemical species. Despite these challenges and the consequent limitations, metabolomics is fast becoming a popular tool for studying the cellular state of many systems, including plants28, the human red blood cell29 and microbes30, as well as in metabolic-engineering applications31, in pharmacology and toxicology32 and in human nutritional studies33. Localizomics. Localizomics seeks to identify the subcellular location of all proteins in the cell, which can provide key insights into the cellular function of the individual proteins as well as their probable interacting partners. In general, localizomics — more so than most
Table 1 | ‘Omics’ data repositories* Data types
Online resource
Description
URL
Genomics
Genomes OnLine Database (GOLD)
Repository of completed and ongoing genome projects
http://www.genomesonline.org
Transcriptomics
Gene Expression Omnibus (GEO)
Microarray and SAGE-based genomewide expression profiles
http://www.ncbi.nlm.nih.gov/geo
Stanford Microarray Database (SMD)
Microarray-based genome-wide expression data
http://genome-www.stanford.edu/microarray
World-2DPAGE
Links to 2D-PAGE data
http://us.expasy.org/ch2d/2d-index.html
Open Proteomics Database (OPD)
Mass-spectrometry-based proteomics data
http://bioinformatics.icmb.utexas.edu/OPD
Lipidomics
Lipid Metabolites and Pathways Strategy (LIPID MAPS)
Genome-scale lipids database
http://www.lipidmaps.org
Localizomics
Yeast GFP Fusion Localization Database
Yeast genome-scale protein-localization data
http://yeastgfp.ucsf.edu
Biomolecular Network Database (BIND)
Published protein–DNA interactions
http://www.bind.ca/Action/
Encyclopedia of DNA Elements (ENCODE)
Database of functional elements in human DNA
http://genome.ucsc.edu/ENCODE/index.html
Munich Information Center for Protein Sequences (MIPS)
Links to protein–protein-interaction data and resources
http://mips.gsf.de/proj/ppi
Database of Interacting Proteins (DIP)
Published protein–protein interactions
http://dip.doe-mbi.ucla.edu
Components
Proteomics
Interactions Protein–DNA
Protein–protein
Functional states Phenomics
RNAi database
C. elegans RNAi screen data
http://rnai.org
General Repository for Interaction Datasets (GRID)
Synthetic-lethal interactions in yeast
http://biodata.mshri.on.ca/grid
A Systematic Annotation Package For Community Analysis of Genomes (ASAP)
Single-gene-deletion microarray data for E. coli phenotypes
http://www.genome.wisc.edu/tools/asap.htm
*This table details some of the databases that store and distribute genome-scale omics data sets through publicly accessible Web sites. Some omics technologies do not yet have associated data-dissemination resources — notably metabolomics, glycomics and fluxomics — and are therefore not included in this table. It should also be noted that this table does not represent all publicly available omics data resources, but, rather, provides a reasonably broad sample of the data that are readily accessible to researchers today. C. elegans, Caenorhabditis elegans; 2D-PAGE, two-dimensional polyacrylamide-gel electrophoresis; E. coli, Escherichia coli; GFP, green fluorescent protein; RNAi, RNA interference; SAGE, serial analysis of gene expression.
200 | MARCH 2006 | VOLUME 7
www.nature.com/reviews/molcellbio
© 2006 Nature Publishing Group
F O C U S O N M O D E L L I N G C E L L U L A R SRY MS ES VTI EEW
Vibrational spectroscopy An analytical technique that can be used to investigate the composition of biological samples by the characteristic frequencies at which chemical bonds vibrate.
Metabolic engineering An applied discipline that is devoted to the targeted improvement in cellular properties or metabolite production by experimental manipulation of specific metabolic or signaltransduction pathways.
In silico prediction A general term that refers to a computational prediction that usually results from the analysis of a mathematical or computational model.
Histocytomics A developing field that is scaling up the traditional techniques of histochemistry and cytochemistry, such that many cellular species can be identified and localized in a cell or tissue sample in a highthroughput manner.
Tiling array A high-density microarray that contains evenly spaced, or ‘tiled’, sets of probes that span the genome or chromosome, and can be used in many experimental applications such as transcriptome characterization, gene discovery, alternative-splicing analysis, ChIP–chip, DNAmethylation analysis, DNA-polymorphism analysis, comparative genome analysis and genome resequencing.
ChIP–chip A high-throughput experimental technique that combines chromatin immunoprecipitation (ChIP) and microarray technology (chip) that directly identifies protein–DNA interactions.
Power-law distribution Networks that exhibit a powerlaw distribution, also known as scale-free networks, are nonuniform, with most nodes having very few links, whereas a few so-called hub nodes have a very large number of links. Notably, many biological networks follow a power-law distribution as does the internet, for example.
other omics data types — requires extraordinary efforts, as each molecular species must be tagged or detected by antibodies, visualized by microscopy and assigned, often manually, to a specific subcellular domain or organelle. Accordingly, complete localizome determination has been restricted to model systems, such as Escherichia coli34 and Saccharomyces cerevisiae35, which are most amenable to manipulation by standard molecular-biology techniques. Recent experimental efforts have generated a genome-wide resource of individual promoter constructs, thereby setting the stage for the determination of the C. elegans localizome36, and computational techniques are allowing for the in silico prediction of protein localization in eukaryotes37. Such predictions can be made on the basis of information regarding amino-acid and protein-domain families being previously associated with known subcellular locations. Furthermore, recent technological advancements — such as laser-scanning cytometry and tissue microarrays, which can simultaneously visualize the presence of many biological species in many different cell or tissue samples — are transforming traditional histochemical and cytochemical methods from low- to high-throughput tools. This has spurred the nascent field of histocytomics, which has the potential to bring localizomics to more experimentally challenging systems, such as mammalian cell and tissue culture38. High-throughput technologies for the detection and measurement of other cellular components are also becoming available. For example, lipidomics39 seeks to identify and classify the complete inventory of lipids and their associated interacting factors within the cell, and glycomics40 seeks to do the same for carbohydrates and glycans. However, these methods are in their infancy and relatively few data sets have been generated so far. Therefore, data-integration efforts using these omics data types remain on the horizon.
Interactions data The protein–DNA interactome. Data concerning the interactions between proteins and DNA, particularly between transcription factors and their target promoters, fundamentally define the genetic regulatory network of the cell. Determining the structure of this network is important to understand how cells modify their transcriptional state during developmental processes41 and in response to environmental, extracellular, intracellular and intercellular signals. The combination of chromatin immunoprecipitation (ChIP) with whole-genome promoter or tiling arrays42, commonly known as ChIP–chip or genome-wide location analysis43, has become the premier tool for the high-throughput elucidation of gene-regulatory interactions. In recent years, researchers have exploited ChIP–chip to study various transcription factors in many model systems. Studies have investigated RNA polymerase binding to promoters in E. coli44, S. cerevisiae45 and humans46. Comprehensive investigations of the S. cerevisiae transcription-factor regulatory network have also appeared47. Furthermore, several studies have investigated the regulatory interactions of important
human transcription factors such as Myc48, nuclear factor (NF)-κB49, p53 (REF. 50) and cyclic-AMP-responseelement-binding protein (CREB)51. A recent study also exploited ChIP–chip to interrogate nonspecific protein–DNA interactions, which have important roles in defining the transcriptional state of cells, by examining histone acetylation and methylation patterns in S. cerevisiae52. They found that histone acetylation occurs primarily at the beginning of genes, whereas histone methylation can be found throughout transcribed regions. The protein–protein interactome. Protein–protein interactions — in signalling cascades and enzyme-complex formation, for example — dictate many cellular processes. Identifying all functional protein–protein interactions will be important for understanding the structure and function of the integrated cellular network53. In recent years, several techniques have provided many genome-scale protein–protein-interaction maps. These include experimental yeast two-hybrid54 and co-affinity purification coupled with mass-spectrometry techniques, as well as computational approaches that predict protein– protein interactions by relying on shared characteristics of known interacting proteins55 or phylogenetic evolutionary information56. So far, reasonably comprehensive protein–proteininteraction networks 57 have appeared for bacteria (E. coli58 and Helicobacter pylori59), the malarial pathogen Plasmodium falciparum60, S. cerevisiae61, the fruitfly Drosophila melanogaster62, C. elegans63 and humans64. Many follow-up studies have analysed the patterns of interacting components, or topological properties, that are exhibited by the resulting networks65 and have debated the potential underlying biological implications. For example, they have asked whether the apparent power-law distribution of protein–protein-interaction connectivity exists to confer robustness against the perturbation of network components66. Further studies have assessed the fidelity of protein–protein-interaction data (estimated to be as low as 50% for yeast two-hybrid screens) and how to best capture the ‘true’ network67. Additional efforts are aimed towards developing highthroughput small-molecule screens designed to identify molecules that interact with, and disrupt, protein–protein interactions68.
Functional-states data Phenomics. The term phenomics refers to the highthroughput determination of cellular fitness or viability in response to genetic and/or environmental perturbations. Several high-throughput strategies are used at present to accomplish this task. Phenotyping microarrays facilitate a high-throughput, parallelized assessment of the growth capabilities of wild-type and mutant microbes69. Chemogenomics applies a similar approach by rapidly screening the phenotypic effect of libraries of compounds on whole biological systems and also has functional-genomics capabilities70. RNA interference (RNAi) screens, in which each gene product is functionally knocked down but not deleted, likewise,
NATURE REVIEWS | MOLECULAR CELL BIOLOGY
VOLUME 7 | MARCH 2006 | 201
© 2006 Nature Publishing Group
REVIEWS Network scaffold Refers to the structure of a network that specifies the components of the network and the interactions between them, and represents the end product of the networkreconstruction process.
Network module A portion of a biological network that is composed of multiple molecular entities (such as genes, proteins or metabolites) that work together as a distinct unit within the cell, for example, in response to certain stimuli or as part of a developmental or differentiation programme.
are invaluable tools in assessing genotype–phenotype relationships and have been used extensively in studies of D. melanogaster, C. elegans and human systems71. Comprehensive studies in E. coli34 and S. cerevisiae72 have also produced detailed information regarding gene and pathway essentiality by examining cellular viability following single and double gene deletions, respectively. Recently developed techniques in the field of fluxomics73 also provide functional-states data by quantifying the specific flux of metabolites through enzymatic reactions within the cell. This approach has so far been limited to studies of microbes, however, and studies that integrate fluxomics and other high-throughput data have yet to appear in the literature.
Methods for omics data integration The growing availability of omics data is providing researchers with unprecedented, large-scale views of biological systems. In recent years, many researchers have made great strides towards extracting insights from these data by devoting much of their work to studying the properties and content of omics data sets, ultimately developing general methods to integrate various genome-scale data types (TABLE 2). These approaches generally tackle three specific tasks: first, identifying the network scaffold by delineating the connections that exist between cellular components; second, decomposing the network scaffold into its constituent parts, or network modules, in an attempt to understand the overall network structure; and third, developing cellular or systems models to simulate and predict network behaviour that gives rise to cellular phenotypes (FIG. 2). Furthermore, many software packages have appeared that can facilitate these efforts (TABLE 3).
Identifying the scaffold. Protein–DNA and protein– protein-interactome data define the interactions that comprise cellular networks. As previously noted, however, these data sets can be prone to high error rates67. Researchers attempt to mitigate this issue by developing methods that integrate multiple omics data types, yielding scaffolds that are likely to reflect real cellular networks more closely. The methods described below aim to refine protein–DNA or protein–protein networks by reducing the number of false-positive interactions, therefore allowing for explicit and accurate definitions of enzymatic complexes, as well as gene-regulatory and signalling networks. A common approach to uncovering gene-regulatory networks focuses on integrating transcriptomics and genomics information. One strategy to accomplish this involves, first, clustering high-throughput geneexpression data sets, and then isolating the upstream regions of the clustered genes and analysing them for common cis-regulatory motifs74. Additional methods circumvent the need for multiple gene-expression data sets, and instead rely on directly correlating the probability of cis-regulatory transcription-factor-binding motifs occurring in a particular promoter region with the corresponding gene-expression pattern74. If the identified motifs correspond to known transcriptionfactor-binding sites, the regulatory network that is responsible for the observed transcription state can be inferred. The MODEM (module construction using gene expression and sequence motif ) algorithm extends this idea by employing the REDUCE (regulatory-element detection using correlation with expression) algorithm to find regulatory motifs, and subsequently allowing for the inclusion of either ChIP–chip or transcription-factor-perturbation
Table 2 | ‘Omics’ integration techniques* Methods
Integration data types
URL
References
Identifying the scaffold REDUCE, MODEM algorithms
Genomics, transcriptomics
http://bussemaker.bio.columbia.edu/reduce
84
GRAM algorithm
PDI, transcriptomics
http://psrg.lcs.mit.edu/GRAM/Index.html
85
Enriched motifs (for example, using mfinder and mDraw) PPI, PDI, genomics
http://www.weizmann.ac.il/mcb/UriAlon/ groupNetworkMotifSW.html
90
SAMBA algorithm
Genomics, PDI
http://www.cs.tau.ac.il/%7Ershamir/ expander/expander.html
93
SANDY algorithm
PDI, transcriptomics
http://sandy.topnet.gersteinlab.org
95
Active subnetworks (for example, using Cytoscape)
PPI, PDI, transcriptomics
http://www.cytoscape.org
96
Within-pathway and between-pathway network models
PPI, PDI, phenomics
http://www.cellcircuits.org/Kelley2005
98
COBRA method
Genomics, proteomics, localizomics, phenomics
http://systemsbiology.ucsd.edu
Developmental gene-regulatory networks (for example, using the BioTapestry tool)
Genomics, phenomics
http://www.biotapestry.org
Decomposing the scaffold
Cellular modelling and analysis 100,101 105
*This table provides URLs for various online resources that supply direct software implemention and/or additional information regarding many of the techniques detailed in the main text. COBRA, constraint-based reconstruction and analysis; GRAM, genetic regulatory modules; MODEM, module construction using gene expression and sequence motifs; PDI, protein–DNA interaction; PPI, protein–protein interaction; REDUCE, regulatory-element detection using correlation with expression, SAMBA, statistical-algorithmic method for bicluster analysis; SANDY, statistical analysis of network dynamics.
202 | MARCH 2006 | VOLUME 7
www.nature.com/reviews/molcellbio
© 2006 Nature Publishing Group
F O C U S O N M O D E L L I N G C E L L U L A R SRY MS ES VTI EEW Bayesian model A probabilistic model that generally specifies the likelihood of an observation occurring, on the basis of the presence of various characteristics that are known or assumed to be associated with the observation according to prior information.
a
experiments 75 to delineate the regulatory network. The success of these methods, however, is often hampered due to the inherent high degree of variability, or ‘noise’, of microarray gene-expression data, and the general difficulty in identifying the often degenerate regulatory-motif signatures in genomic sequences. Another increasingly popular approach to identifying gene-regulatory networks involves the integration of protein–DNA-interaction data with transcriptomics data. Bar-Joseph et al.76 developed an algorithm known as genetic regulatory modules (GRAM) to accomplish this task. GRAM first identifies all protein–DNAbinding events that are indicated by ChIP–chip results for a given set of transcription factors. A subset of genes that are identified through the analysis of the binding data is then selected on the basis of them having highly correlated gene-expression profiles. The binding data are then revisited with relaxed binding-detection criteria to add additional gene targets that share similar expression profiles with the initially chosen gene subset, and that use the same set of transcriptional regulators. This iterative process results in the specification of a b
c
Build network scaffold
Simulate and analyse
Decompose network into modules
m
v2 v1
Figure 2 | ‘Omics’ data-integration approaches for identifying, decomposing and modelling cellular networks. Many investigators are devoting significant efforts to investigating the properties of omics data sets and developing general methods to integrate these data. These techniques generally accomplish three particular tasks: first, identifying the network scaffold; second, decomposing the network scaffold; and third, cellular-systems modelling and analysis. a | Identifying the network scaffold. This panel depicts the general strategy for identifying all interactions between cellular components that comprise the gene-regulatory network scaffold by integrating chromatin immunoprecipitation (ChIP) and microarray gene-expression data (referred to as ChIP–chip data). ChIP–chip data specify the interactions between a transcriptional regulator and its target gene, and various statistical approaches can be used to derive the specific regulatory relationships (that is, transcriptional activation or repression) between components. b | Network-scaffold decomposition. This procedure is generally carried out by integrating omics data in the context of a given or inferred network structure, followed by deconstructing the network into network modules. These modules are then commonly used either to infer organizational principles or identify active portions of the network. c | Cellular-systems modelling and analysis. The availability of these omics data sets opens the door for integrative efforts that incorporate these data into whole-cell or systems models. Genome-scale models are under development and involve, first, the incorporation of data into a network model, followed by the mathematical representation of that model, to ultimately facilitate simulation and analysis.
gene-regulatory network and can be used to study its modularization (see below). Furthermore, given a reconstructed network, techniques are available to determine computationally which perturbation experiments will promote the most rapid elucidation and expansion of the network in the future77,78. Systematic approaches that infer the structure of the protein–protein-interaction network have been developed. In recent years, Bayesian classification methods have emerged as a common approach to overcoming the problem of noisy interaction data. The general approach combines and uses subtle evidence from disparate data sources in an effort to filter out false positives from the list of possible protein–protein interactions. First, it identifies features that are shared by known interacting proteins (known as ‘gold standard’ positives) and similarly identifies features that are characteristic of known noninteracting pairs (known as ‘gold standard’ negatives). It then compares the integrated characteristics for pairwise combinations of proteins against the same characteristics for known interacting protein pairs and known non-interacting protein pairs and generates a likelihood score for each potential interaction. The result is a probabilistic interactome in which all pairwise combinations of proteins are represented, the highest scoring of which represent the most likely structure of the protein–proteininteraction network. Using this approach to elucidate the S. cerevisiae protein–protein-interaction network, Jansen et al.79 integrated mRNA-correlation transcriptomics data, genomics (which included functional annotation and other ontological data) and data on whether genes are essential or not from high-throughput phenotyping assays. This Bayesian approach allowed them to derive a probabilistic structure for the entire S. cerevisiae protein–protein-interaction network. Recently, Rhodes et al.80 adopted this approach to build a comprehensive probabilistic human protein–protein-interaction network containing 40,000 interactions, which, when accounting for differences in gene number, is comparable to results obtained for model organisms. To achieve this, they integrated genomics data in the form of functional annotation, ontological and shared-protein-domain data, orthologous protein–protein-interaction data from other model organisms, and mRNA co-expression-based transcriptomics data. Both of the described studies confirmed selected predicted interactions using detailed follow-up experiments. Furthermore, given that interacting proteins tend to perform similar functions or participate in similar cellular processes, the confirmed interaction results are useful in assigning functional annotations to hypothetical proteins that are shown to interact directly with protein(s) of known function. However, although these integrative efforts improved protein–protein-interaction detection results over using any one data type alone, it should be noted that neither study was able to recover all of the known interactions, and that the false-positive rates remained high. This discrepancy could be a product of technical limitations that are associated with the experimental protocols that were used to generate the data, or could, perhaps, be
NATURE REVIEWS | MOLECULAR CELL BIOLOGY
VOLUME 7 | MARCH 2006 | 203
© 2006 Nature Publishing Group
REVIEWS Table 3 | Software for ‘omics’ integration* Package
Accessibility
Functionality
URL
Biotapestry
Open source
• Build developmental gene-regulatory network models http://www.biotapestry.org • Visualize network • Simulate and analyse network behaviour
CellDesigner Open source
• Build interaction maps • Visualize process diagrams
http://www.celldesigner.org
Cytoscape
Open source
• Build interaction maps • Visualize high-throughput data • Conduct graph theoretical analysis
http://www.cytoscape.org
Pajek
Free for noncommercial use
• Build interaction maps • Visualize network structure • Conduct graph theoretical analyses
http://vlado.fmf.uni-lj.si/pub/networks/pajek/default. htm
SimPheny
Commercial
• Build COBRA models • Integrate high-throughput data • Visualize high-throughput data • Simulate and analyse network behaviour
http://www.genomatica.com
ToPNet
Open source
• Represent interaction maps as PetriNets • Visualize high-throughput data
http://www.biosolveit.de/ToPNet
YeastHub
Open source
• Integrate high-throughput data
http://yeasthub.gersteinlab.org
*As omics data sets become increasingly available, the need has grown for software tools to effectively integrate, structure, analyse and visualize omics data. This table compiles several of the useful tools that are currently available to researchers, briefly describes their utility, and includes links to their associated online resources. The Systems Biology Markup Language (SBML) Web page provides links to many other software tools for network visualization and analysis (http://www. sbml.org). COBRA, constraint-based reconstruction and analysis.
due to differences in the growth conditions that were used to generate the experimental data. With these factors in mind, subsequent analyses that aim to identify the organizational principles of these networks, some of which are described below in the context of scaffold decomposition, might themselves be confounded by incomplete or incorrect interactions that are likely to exist within these derived scaffolds.
Synthetic lethal This term refers to the lethal or significantly impaired phenotype that results from mutations in two non-essential genes that, individually, result in viability. Such an interaction possibly indicates their activity within the same essential pathway or parallel nonessential pathways.
Bipartite graph A set of graph vertices that is partitioned into two distinct sets such that no two graph vertices within the same set are adjacent. For example, one set can represent genes, and the other set can represent characteristics that describe the function(s) of those genes.
Scaffold decomposition. Many available methods are designed to complement scaffold-building techniques by decomposing them into network modules. These methods generally aim to accomplish one of two tasks. The first method attempts to analyse a network scaffold directly by identifying its modular structure, with the ultimate aim of understanding organizational principles of networks. By contrast, the second method aims to integrate omics data types with known or pre-defined molecular scaffolds — for example, from scaffolds that are derived from interactions data or generated by using the methods described in the previous section — in order to pinpoint the portions of the network that are most active under a given condition and therefore best explain the observed systemic behaviour. One approach that was designed to study the modular structure of networks involves the identification of significantly enriched motifs, or interaction patterns, that exist within the network (FIG. 3). Yeger-Lotem et al.81 searched for enriched two-, three- and four-protein motifs in an integrated protein–protein, protein–DNA network. The identified enriched motifs are thought to represent the basic building blocks that comprise the cellular network. The incorporation of localizomic data also helps isolate the most biologically relevant motifs82, as interacting components are most likely to exist in the same subcellular compartment or organelle.
Zhang et al. 83 recently expanded on this idea by combining protein–protein interaction, ChIP–chip (protein–DNA interaction), gene co-expression (transcriptomics), synthetic lethal (phenomics) and sequence homology (genomics) data to decompose an integrated S. cerevisiae interaction network into modules. After constructing a comprehensive S. cerevisiae interaction network from these data, significantly enriched three-node (and some four-node) network motifs were then detected and organized into network themes that consisted of overlapping motif structures. Network themes were then further grouped into thematic maps, which provided a topological overview, specifying links between different functional subsystems, and ultimately imposing a hierarchical structure onto the network. Additional efforts, such as the statistical analysis of network dynamics (SANDY) algorithm84, are also extending these analyses to reflect the dynamic properties of the network by assessing topological features under various environmental conditions85. Tanay et al.86 took a slightly different approach to the same network-modularization problem with their statistical-algorithmic method for bicluster analysis (SAMBA) algorithm. A bipartite graph is first constructed in which genes are linked to gene properties that are derived from omics data. Genes that share a statistically significant number of properties are then identified and, together, represent a network module. Modules can then be analysed using methods from the field of graph theory to define connectivity statistics and ultimately assess their global organization within the network. As previously noted, however, these studies that are aimed at studying network organization rely on high-quality scaffold identification and can therefore be significantly compromised by erroneous data.
204 | MARCH 2006 | VOLUME 7
www.nature.com/reviews/molcellbio
© 2006 Nature Publishing Group
F O C U S O N M O D E L L I N G C E L L U L A R SRY MS ES VTI EEW
Figure 3 | Network-motif enrichment: an example of network decomposition. One approach to decomposing complex networks involves the identification of enriched motifs, or interaction modules, that exist within networks. a | A reconstructed Escherichia coli regulatory network. This diagram represents a hierarchical representation of the regulatory network that was previously used in an integrated regulatory and metabolic model of E. coli 96. This relatively complex network structure that contains 104 regulators and 479 target-enzyme genes is organized so that global regulators are depicted in red, major regulators in purple, minor regulators in green, and target genes — in this case model enzymes — in yellow. The blue lines represent direct regulatory reactions, either between regulators or between regulator and target enzymes. Genes were arbitrarily assigned to the regulator class (global versus major versus minor) on the basis of the total number of target genes that are either directly under their control, or that are indirectly controlled by the direct interaction with other regulators. b | Network-motif-enrichment analysis. To illustrate one method that researchers use to decompose biological networks, network-motif-enrichment analysis81 was conducted to identify the relative enrichment of the 13 possible types of three-node motifs that could be present within the depicted E. coli regulatory network. The four three-node motifs that were detected within the network are shown. Only the top motif was identified as occurring more frequently than would be expected by chance, as determined by comparisons with randomized networks. This motif, which is commonly known as the feed-forward loop, has been frequently observed in biological-network analyses and is thought to serve as a filter against noise within networks that are responding to various signals.
homology — for pairwise combinations of genes in a training set, which are then used to predict whether the combined perturbation of two genes will lead to a growth-deficiency phenotype. This method could prove invaluable in focusing experimental studies of network robustness in systems that cannot be so easily genetically manipulated. Rather than predicting synthetic-lethal interactions, Kelley and Ideker89 used an integrated network to uncover mechanistic explanations for growth-deficient double-deletion strains, and thereby elucidated underlying network organizational principles. They first constructed an integrated network that was comprised of protein–protein and protein–DNA interactions, as well as enzyme–enzyme interactions that are specified by metabolic reaction maps as defined in the Kyoto Encyclopedia of Genes and Genomes (KEGG)90. Using a log-odds scoring scheme, they identified within- and between-pathway network motifs in an effort to explain the synthetic-lethal interactions. Within-pathway motifs correspond to instances where genetic interactions occur between genes for which the protein products are involved in the same pathway, whereas betweenpathway cases involve genes for which the protein products participate in distinct pathways or processes. The application of this method as a predictive tool was also assessed and it was determined that between-pathway motifs are generally better predictors of synthetic-lethal interactions in S. cerevisiae — this would be expected, given that the perturbation of multiple independent pathways is likely to have a larger impact on cellular fitness than multiple perturbations of a single pathway. As an additional application, these network motifs were also shown to be potentially useful in studying the organizational properties of a network and to make protein-function predictions.
Much effort has also focused on identifying portions of the cellular network that are likely to be responsible for an observed phenotype. Ideker et al.87 developed a method for identifying ‘active subnetworks’ by integrating interaction and transcriptomics data. They first assembled a network scaffold on the basis of the interaction data and independently assessed the statistical significance for each component within the assembled network. They then used a simulated annealing-based search algorithm to identify subnetworks that are enriched for differentially expressed genes. Subnetwork enrichment was assessed by comparing an aggregate statistical measure for all components in the identified subnetwork against randomly selected subnetworks of the same size from the same expression data. Highly significant enriched subnetworks indicate a probable involvement in the phenotype under study. Another network-decomposition approach integrates many biological networks in an effort to predict synthetic-lethal interactions88. Decision trees are constructed that integrate various characteristics — such as localization, functional annotation and shared sequence
Cellular modelling and analysis. As noted previously, omics technologies are providing systems-wide measurements of virtually all classes of biomolecules. Although the level of precision of most systems-wide measurements is not yet sufficient to detail specific levels or concentrations of cellular components, these data are beginning to open the door for integrative efforts that strive to model the entire cell. Accordingly, significant work is being devoted to developing methods that facilitate whole-cell modelling, simulation and analysis. The constraint-based reconstruction and analysis (COBRA) technique91 has emerged in recent years as a successful approach to modelling systems on a genome scale. In contrast to many existing computational modelling approaches, the COBRA method seeks to clearly distinguish biologically feasible from biologically unfeasible network states, rather than exactly predicting network behaviour. By relying primarily on network stoichiometry, COBRA avoids the need to define kinetic rate constants and other parameters that are difficult or impossible to determine accurately in the laboratory. This technique begins with developing a network reconstruction on the basis of annotated genome sequence, known biochemistry and other high-throughput resources, such as
a
Simulated annealing-based search algorithm A global optimization technique that traverses a search space by testing random mutations on an individual solution, keeping all better solutions, and accepting worse solutions probabilistically on the basis of the difference in solutions and a decreasing temperature parameter.
Training set A collection of data that has known characteristics and is used to develop a predictive model in data-mining and machine-learning applications (for example, in Bayesianmodel approaches). The characteristics learned from the training set are used to make subsequent predictions about new data.
b
NATURE REVIEWS | MOLECULAR CELL BIOLOGY
VOLUME 7 | MARCH 2006 | 205
© 2006 Nature Publishing Group
REVIEWS
Log-odds scoring scheme A statistical procedure that is designed to assess the significance of an observation by calculating a quantity that considers the observed frequency relative to the expected frequency, if the observation was random.
Constraint-based reconstruction and analysis (COBRA). A genome-scale modelling approach that involves: first, the reconstruction of biochemical reaction networks; then, applying constraints to the network; and finally, analysing the characteristics and capabilities of the network using various computational techniques.
Network reconstruction The process of integrating different data sources to create a representation of the chemical events that underlie a biochemical reaction network.
Governing constraints Biochemical networks and cellular systems are constrained by natural law. These governing constraints include physico-chemical constraints (such as enzyme turnover), topobiological constraints (such as cellular crowding), environmental constraints (such as nutrient availability) and regulatory constraints (such as gene repression in response to external signals).
Omics data integration The simultaneous analysis of high-throughput genome-scale data that is aimed at developing models of biological systems to assess their properties and behaviour.
Biomarker A distinctive biochemical indicator that is associated with a biological process or event (for example, the presence of a protein, or set of proteins, that are characteristic of cancerous cells).
proteomics, localizomics and phenomics data92. Governing constraints, such as reversibility and maximum capacity of enzymatic reactions, can then be imposed on the network, thereby defining the feasible network states91. Since 1999, more than a dozen genome-scale metabolic-network reconstructions for various microorganisms from all major taxa of the tree of life have appeared in the literature (reviewed in REF. 92). Models of organelles and individual human cells, such as the mitochondria and the red blood cell, are also available. Each network reconstruction captures the components of the system and the interactions between them, thereby effectively representing two-dimensional genome annotations93. Furthermore, the combination of genome-scale models and associated analytical methods that is used by the COBRA technique has proven useful in basic research, by aiding researchers in identifying metabolic systems properties and in directing experimental design91,92, as well as in applied disciplines such as metabolic engineering94. Furthermore, when viewed in light of genome-wide expression data, these models can be used to uncover the structure of transcription regulation in metabolic networks95. So far, however, these models have had their main success in assessing the metabolic capabilities of cells, but do not account for many other important aspects of cellular biology. Efforts have begun that are aimed at incorporating regulatory96 and signalling processes97 using the COBRA approach, but much work remains to be done in order to capture the true internal state of the cell through whole-cell modelling. Significant advances are also being made in modelling developmental gene-regulatory networks. These genetic programmes are of primary interest as they ultimately dictate the growth and differentiation of multicellular systems. Developmental programmes are encoded in DNA sequence, and models that explain these processes are derived by integrating genomics and localizomics data to establish developmental regulatory interactions within and between various cell types. This is then followed by the detailed experimental validation98 of these relationships. Each interaction can be verified unambiguously using established experimental techniques — regulatory relationships are either confirmed or refuted based on the developmental impact of mutations in DNA promoter regions — and are therefore independent of molecular concentrations or kinetic constants. Although the sea urchin model is the most mature, models of developmental gene-regulatory networks are becoming available for many other organisms41.
Asking ‘big’ questions Many researchers are capitalizing not only on new omics technologies, but also on the wealth of information that has been captured by omics data (FIG. 4). Many efforts are using omics integration to identify potential functional annotation99. Perhaps more interesting, however, are the many investigations that have been facilitated by omics integration, and which are aimed at delineating systemswide behaviour and addressing fundamental evolutionary questions. So, integrating multiple omics data sets to form networks, and determining their functional states, is
allowing us to address both proximal (or systems-specific) and distal (or broader-scale) evolutionary questions in biology at a resolution that was previously impossible. From scaffolds to functional states. Omics integration studies that are designed to characterize the behaviour of S. cerevisiae have pervaded the literature in recent years. One particular line of research that uses integrative techniques revolves around identifying all the key components that are involved in the S. cerevisiae response to various mutagens. For example, the integration of single-gene-deletion phenotypic screens, localization experiments and protein–protein-interaction data has provided a systems-level view of DNA-damage responses and the recovery from exposure to known carcinogens100. A recent study expanded on this work by integrating genomics and phenomics data that were obtained while screening additional carcinogens, and it derived specific insights into the relative importance of DNA-repair modules for resistance to each compound101 — ultimately revealing new functional interactions. The S. cerevisiae response to arsenic exposure was also elucidated through the integration of phenomics, transcriptomics and protein–protein-interactions data102 in an effort to understand the cellular response to this widespread, non-mutagenic carcinogen. C. elegans is another model organism that is increasingly being studied at the systems level using omics data integration. In particular, these integrative efforts have focused on more fully characterizing all the elements that are at work during specific biological processes. For example, phenomics data from RNAi screens combined with protein–protein-interactions data enabled the recent elucidation of additional factors that are involved in the RNAi process103. Integration of these data also led to the further elucidation of the Dauer-formation family member-7–transforming growth factor-β (DAF-7– TGF-β) signalling pathway104 (which participates in cancer pathogenesis, inflammation and developmental pathways) as well as to the identification of possible novel participants in the DNA-damage-response process105. Incorporating gene co-expression data into these types of analyses has also allowed researchers to deduce the protein complexes and active network components that are responsible for early C. elegans embryogenesis106. The integration of omics data is also driving many recent studies in plants. Given the huge diversity of metabolic compounds that plants can produce, plant researchers have been spurring advances in metabolomic technologies and the subsequent analytical procedures, many of which rely on the integration of omics data. For example, the integration of genomics and metabolomics data is driving functional-annotation efforts that assign specific enzymes to previously uncharacterized metabolic reactions107. Transcriptomics and metabolomics data are also being integrated to assess the potential for inadvertent systems-wide impacts that could result from the genetic engineering of crops108, as well as to analyse the nutrientstarvation stress response in Arabidopsis thaliana109. Many studies of human systems are also adopting omics data-integration strategies to identify biomarkers
206 | MARCH 2006 | VOLUME 7
www.nature.com/reviews/molcellbio
© 2006 Nature Publishing Group
F O C U S O N M O D E L L I N G C E L L U L A R SRY MS ES VTI EEW Genomics
Transcriptomics
Proteomics
Metabolomics
Protein–DNA interactions
Protein–protein interactions
Fluxomics
Phenomics
Genomics (sequence annotation)
• ORF validation • Regulatory element identification74
• SNP effect on protein activity or abundance
• Enzyme annotation
• Binding-site identification75
• Functional annotation79
• Functional annotation
• Functional annotation71,103 • Biomarkers125
• Enzyme annotation109
• Gene-regulatory • Functional networks76 annotation89 • Protein complex identification82
Transcriptomics • Protein: (microarray, SAGE) transcript correlation20
Proteomics • Enzyme (abundance, postannotation99 translational modification) Metabolomics (metabolite abundance)
• Differential complex formation
• Regulatory complex identification
• Functional annotation102
• Enzyme capacity • Functional annotation • Metabolic pathway bottlenecks
• Metabolictranscriptional response Protein–DNA interactions (ChlP–chip)
• Metabolic flexibility • Metabolic engineering109
• Signalling cascades89,102
• Dynamic network responses84
Protein–protein interactions (yeast 2H, coAP–MS)
• Pathway identification activity89 Fluxomics (isotopic tracing)
• Metabolic engineering Phenomics (phenotype arrays, RNAi screens, synthetic lethals)
Figure 4 | ‘Omics’-data integration helps to address interesting biological questions on the systems level. This array summarizes some of the potential biological insights that can be gleaned from the pairwise integration of omics data. Each element in the array contains examples of the type of systemic information that can be gained by integrating omics data. Reference numbers are noted for those applications that are described in the main text. Empty elements represent more challenging integrations where an application is less obvious. It should also be noted that many researchers have extended integrative analyses, some of which are described in the main text, to include three or more omics data sets to investigate additional biological problems. ChIP–chip, chromatin-immunoprecipitation–DNA-microarray; coAP–MS, co-affinity-purification–mass-spectrometry; ORF, open reading frame; RNAi, RNA interference; SAGE, serial analysis of gene expression; SNP, single nucleotide polymorphism; yeast 2H, yeast two-hybrid analysis.
that are associated with disease states, to elucidate signalling-pathway components more fully, and to conduct detailed studies of important transcription-factor mechanisms of action and activities. Recently, metabolomics and transcriptomics data were integrated to define prognosis characteristics in human neuroendocrine cancers110. Researchers used transcriptomics signatures to identify activated portions of the metabolic network and to then direct corresponding metabolomics experiments that were designed to detect specific metabolic changes that are characteristic of the most aggressive types of this cancer. This work ultimately resulted in the identification of transcriptomics and metabolomics biomarkers for these disorders that are associated with particular pathways that are involved in γ-aminobutyric acid (GABA) and imidazole-4-acetate production, respectively. Another study used protein–protein-interaction and proteomics data to elucidate interferon (IFN)-mediated regulation in human liver cells more fully111, which might lead to the enhanced understanding of the host response to hepatitis C virus. In an additional study, protein–DNA interaction and transcriptomics data were integrated from a number of human and mouse tissues to study CREB activity51.
It was determined that CREB-target-gene activation cannot be explained by CREB-binding-site occupancy or the phosphorylation state of the transcription factor alone, but instead, requires the selective recruitment to the promoter of other transcription factors, such as CREB-binding protein (CBP), and possibly additional cofactors as well. Each of the above examples highlights how omics data sets can be integrated to provide comprehensive views of model systems and to therefore better understand their overall behaviour in response to various environmental conditions and stimuli. Gaining evolutionary insights. Many evolutionary studies are also benefiting from the integration of multiple omics data types. One question that is of fundamental interest is what cellular factors distinguish species, and are therefore likely to have had roles in speciation events, particularly those of close evolutionary relatives? For example, as the chimpanzee and human genome sequences share ~99% identity, what other cellular factors account for the many morphological, behavioural and cognitive differences that exist between species? Enard et al.112 used transcriptomics and proteomics data to show that significant changes in
NATURE REVIEWS | MOLECULAR CELL BIOLOGY
VOLUME 7 | MARCH 2006 | 207
© 2006 Nature Publishing Group
REVIEWS
Metabolic syndrome An increasingly common, complex and multi-factorial disorder that is characterized by glucose intolerance, abdominal obesity, hypertension and abnormal cholesterol levels that increases an individual’s risk of developing coronary heart disease and type 2 diabetes.
Personalized genomic medicine The idea that genome-scale technologies will allow clinicians to apply treatment regimens that are tailored specifically to an individual patient on the basis of their genetic makeup and associated predispositions.
Gödel’s incompleteness theorem A prominent result from mathematical logic that basically states that for any formal theory in which basic arithmetical facts (or axioms) are provable, it is possible to construct an arithmetical statement that is true but neither provable nor refutable within the theory. Therefore, despite having all axioms available, certain truths may not be provable or readily apparent.
gene and protein expression patterns in the brain might have more crucial roles than changes in other tissues. A follow-up study that lends support to this idea integrated genomics and transcriptomics data, and identified a trend towards increased protein-coding changes between humans and chimpanzees in brain-specific genes relative to other tissues113. Additional studies investigated brainregion-specific transcriptomes of humans and chimpanzees114 and found general differences between species, although these differences were not related to any single brain region. Understanding the role of changes in transcriptional regulatory networks throughout evolution is also of central interest. Ihmels et al.115 integrated genomics and transcriptomics data to identify an evolutionary ‘re-wiring’ of the S. cerevisiae transcriptional regulatory network that seems linked to its ability for rapid anaerobic growth. They first identified differential correlations between gene-expression levels in mitochondrial ribosomal proteins and RNAs between S. cerevisiae and a distantly related yeast species. A specific regulatory motif was subsequently identified in the genomic sequence, the absence of which explained the differential correlation patterns and strong fermentative growth ability of S. cerevisiae relative to the distantly related yeast species. This association was then confirmed in nine other yeast species. A similar study integrated genomics and transcriptomics data to study the dynamics of the evolution of transcriptional regulatory networks by examining ribosomal regulation in 17 yeast species116.
Challenges that lie ahead The current and potential utility of omics integration is clear. Deriving the molecular scaffold that provides the structures of cellular networks, interpreting biological data in terms of these scaffolds, and ultimately modelling how cellular networks behave in silico will continue to drive systems-level research and our general understanding of model organisms. Many challenges exist and must be confronted, however, before the field of systems biology can move significantly forward through omics integration. The primary problems facing the field involve data, software and model accessibility. At present, many, and perhaps most, high-throughput data-integration efforts rely on supplementary-data repositories to disseminate detailed results, and these are often not standardized to facilitate downstream analysis by other researchers. Although the data repositories that are detailed in TABLE 1 are working towards alleviating this problem, few are close to achieving the level of consistent utility that genomics resources such as GenBank have attained. The additional confounding issue of data reliability and reproducibility must also be appropriately addressed as these high-throughput databases mature. As summarized in a recent editorial that assesses the problems that are associated with transcriptional profiling117, consistent standards for representing data — including an assessment of cross-platform and cross-laboratory consistency — are important issues that must be carefully considered in order for these resources to be of true utility to researchers in the field.
Similarly, much of the software and code that is developed in omics data-integration efforts is either not made readily available, or is not accessible to researchers who might be interested in applying the associated methods to their own problems of interest. One of the exceptions to this idea is the Cytoscape118 software package that facilitates network modelling as well as high-throughput data integration and analysis. The user-friendly interface and useful analytical plugins make this tool readily accessible to all researchers. Similar efforts will be required to make omics data integration and analysis as ubiquitous and accessible as a programme such as BLAST, for example, has become. Finally, the issue of making the contents of cellular models available to the research community is of primary concern. As more and more cellular models are developed in an effort to fully describe biological systems, their distribution in a standardized form is required to facilitate their further development and general utility in biological research. The Systems Biology Markup Language (SBML)119, for example, has been developed to provide a uniform framework in which models can be represented, and the recently initiated MIRIAM (‘minimum information requested in the annotation of biochemical models’)120 project and affiliated databases will facilitate the dissemination of uniformly structured and annotated models to the research community. The adoption of these or similar standards will be important to the advancement of the field.
Omics integration going forward So far, the integration of omics data has primarily affected basic biological research using model systems. However, this strategy is also beginning to influence clinically relevant applications. For example, the budding field of toxicogenomics is being driven by the recognition of the potential power in interpreting standard toxicological studies in genomics, proteomics and metabolomics contexts121. Nutrigenomics has also emerged as a field that aims to harness omics strategies to study the complex interaction between the human body, nutritional intake and the environment122. This field has vast potential to make significant inroads towards understanding and developing treatments for metabolic syndrome and related disorders123,124. Other medical disciplines are also feeling the impact of the omics revolution. Multiple omics data sets are beginning to shed additional light on the complex, chronic inflammatory neurological disease multiple sclerosis125. Cancer research is also benefiting from integrated systems analysis using omics data126. Furthermore, many researchers anticipate that these strategies will translate into drug-development applications127 and, ultimately, into personalized genomic medicine128. The general optimism that is associated with the promise of systems biology, omics data integration, and personalized health care must be tempered by the acknowledgement of a potentially unsettling reality, however. Drawing an analogy to Gödel’s incompleteness theorem, the availability of complete information that omics data potentially represents might not be sufficient
208 | MARCH 2006 | VOLUME 7
www.nature.com/reviews/molcellbio
© 2006 Nature Publishing Group
F O C U S O N M O D E L L I N G C E L L U L A R SRY MS ES VTI EEW to understand all the underlying principles that govern the functions of biological systems. In other words, despite having all ‘axioms’ in hand, the associated fundamental ‘truths’ might not be fully revealed. Nonetheless, omics technologies and omics data integration are likely to continue to affect biological research as investigators harness these strategies to tackle difficult problems on previously unprecedented scales.
1.
2.
3. 4.
5.
6.
7.
8.
9.
10.
11.
12.
13.
14.
15. 16.
17.
18.
19.
20.
21.
22. 23.
Fleischmann, R. D. et al. Whole-genome random sequencing and assembly of Haemophilus influenzae Rd. Science 269, 496–512 (1995). Ehrenman, G. Mining what others miss: highlighting the subtleties in 1012 bytes of data, technology tries to clear up its own complex mess. Mechanical Engineering-CIME 127, 26 (2005). Hays, C. L. What Wal-Mart Knows About Customers’ Habits. New York Times (14 Nov 2004). Hand, D. J., Blunt, G., Kelly, M. G. & Adams, N. M. Data mining for fun and profit. Stat. Sci. 15, 111–131 (2000). Kluger, Y., Yu, H., Qian, J. & Gerstein, M. Relationship between gene co-expression and probe localization on microarray slides. BMC Genomics 4, 49 (2003). Quackenbush, J. Data standards for ‘omic’ science. Nature Biotechnol. 22, 613–614 (2004). A short, incisive report that introduces some of the problems that the omics sciences face with regards to data quality and representation standards. Bader, G. D. & Hogue, C. W. Analyzing yeast protein– protein interaction data obtained from different sources. Nature Biotechnol. 20, 991–997 (2002). Ge, H., Walhout, A. J. & Vidal, M. Integrating ‘omic’ information: a bridge between genomics and systems biology. Trends Genet. 19, 551–560 (2003). Liolios, K., Tavernarakis, N., Hugenholtz, P. & Kyrpides, N. C. The genomes on line database (GOLD) v.2: a monitor of genome projects worldwide. Nucleic Acids Res. 34, D332–D334 (2006). Kellis, M., Patterson, N., Endrizzi, M., Birren, B. & Lander, E. S. Sequencing and comparison of yeast species to identify genes and regulatory elements. Nature 423, 241–254 (2003). Chimpanzee Sequencing And Analysis Consortium. Initial sequence of the chimpanzee genome and comparison with the human genome. Nature 437, 69–87 (2005). Delsuc, F., Brinkmann, H. & Philippe, H. Phylogenomics and the reconstruction of the tree of life. Nature Rev. Genet. 6, 361–375 (2005). Tompa, M. et al. Assessing computational tools for the discovery of transcription factor binding sites. Nature Biotechnol. 23, 137–144 (2005). Brasch, M. A., Hartley, J. L. & Vidal, M. ORFeome cloning and systems biology: standardized mass production of the parts from the parts-list. Genome Res. 14, 2001–2009 (2004). Hardiman, G. Microarray platforms — comparisons and contrasts. Pharmacogenomics 5, 487–502 (2004). Harbers, M. & Carninci, P. Tag-based approaches for transcriptome research and genome annotation. Nature Methods 2, 495–502 (2005). Li, L. & Akashi, K. Unraveling the molecular components and genetic blueprints of stem cells. Biotechniques 35, 1233–1239 (2003). Rhodes, D. R. & Chinnaiyan, A. M. Integrative analysis of the cancer transcriptome. Nature Genet. 37, S31–S37 (2005). Jenner, R. G. & Young, R. A. Insights into host responses against pathogens from transcriptional profiling. Nature Rev. Microbiol. 3, 281–294 (2005). Mata, J., Marguerat, S. & Bahler, J. Posttranscriptional control of gene expression: a genomewide perspective. Trends Biochem. Sci. 30, 506–514 (2005). Patterson, S. D. & Aebersold, R. H. Proteomics: the first decade and beyond. Nature Genet. 33 (Suppl.), 311–323 (2003). Ghaemmaghami, S. et al. Global analysis of protein expression in yeast. Nature 425, 737–741 (2003). Yates, J. R. 3rd, Gilchrist, A., Howell, K. E. & Bergeron, J. J. Proteomics of organelles and large cellular structures. Nature Rev. Mol. Cell Biol. 6, 702–714 (2005).
Note added in proof After submission of this manuscript, an important study129 appeared that proposes a physical model of protein–protein interaction networks that strongly indicates that high-throughput protein–protein interaction studies may be dominated by non-specific interactions, which must be considered in all studies that rely on these high-throughput data.
24. Kuster, B., Schirle, M., Mallick, P. & Aebersold, R. Scoring proteomes with proteotypic peptide probes. Nature Rev. Mol. Cell Biol. 6, 577–583 (2005). 25. Griffin, J. L. & Bollard, M. E. Metabonomics: its potential as a tool in toxicology for safety assessment and data integration. Curr. Drug Metab. 5, 389–398 (2004). 26. Nielsen, J. & Oliver, S. The next wave in metabolome analysis. Trends Biotechnol. 23, 544–546 (2005). 27. Dunn, W. B., Bailey, N. J. & Johnson, H. E. Measuring the metabolome: current analytical technologies. Analyst 130, 606–625 (2005). 28. Fridman, E. & Pichersky, E. Metabolomics, genomics, proteomics, and the identification of enzymes and their substrates and products. Curr. Opin. Plant Biol. 8, 242–248 (2005). 29. Markuszewski, M. J., Szczykowska, M., Siluk, D. & Kaliszan, R. Human red blood cells targeted metabolome analysis of glycolysis cycle metabolites by capillary electrophoresis using an indirect photometric detection method. J. Pharm. Biomed. Anal. 39, 636–642 (2005). 30. Wu, L. et al. Quantitative analysis of the microbial metabolome by isotope dilution mass spectrometry using uniformly 13C-labeled cell extracts as internal standards. Anal. Biochem. 336, 164–171 (2005). 31. Memelink, J. Tailoring the plant metabolome without a loose stitch. Trends Plant Sci. 10, 305–307 (2005). 32. Robertson, D. G. Metabonomics in toxicology: a review. Toxicol. Sci. 85, 809–822 (2005). 33. Gibney, M. J. et al. Metabolomics in human nutrition: opportunities and challenges. Am. J. Clin. Nutr. 82, 497–503 (2005). 34. Arita, M., Robert, M. & Tomita, M. All systems go: launching cell simulation fueled by integrated experimental biology data. Curr. Opin. Biotechnol. 16, 344–349 (2005). 35. Huh, W. K. et al. Global analysis of protein localization in budding yeast. Nature 425, 686–691 (2003). 36. Dupuy, D. et al. A first version of the Caenorhabditis elegans promoterome. Genome Res. 14, 2169–2175 (2004). 37. Guda, C. & Subramaniam, S. pTARGET: a new method for predicting protein subcellular localization in eukaryotes. Bioinformatics 21, 3963–3969 (2005). 38. Coulton, G. Are histochemistry and cytochemistry ‘Omics’? J. Mol. Histol. 35, 603–613 (2004). 39. Wenk, M. R. The emerging field of lipidomics. Nature Rev. Drug Discov. 4, 594–610 (2005). 40. Shriver, Z., Raguram, S. & Sasisekharan, R. Glycomics: a pathway to a class of new and improved therapeutics. Nature Rev. Drug Discov. 3, 863–873 (2004). 41. Levine, M. & Davidson, E. H. Gene regulatory networks for development. Proc. Natl Acad. Sci. USA 102, 4936–4942 (2005). 42. Mockler, T. C. et al. Applications of DNA tiling arrays for whole-genome analysis. Genomics 85, 1–15 (2005). 43. Buck, M. J. & Lieb, J. D. ChIP–chip: considerations for the design, analysis, and application of genome-wide chromatin immunoprecipitation experiments. Genomics 83, 349–360 (2004). 44. Herring, C. D. et al. Immobilization of Escherichia coli RNA polymerase and location of binding sites by use of chromatin immunoprecipitation and microarrays. J. Bacteriol. 187, 6166–6174 (2005). 45. Pokholok, D. K., Hannett, N. M. & Young, R. A. Exchange of RNA polymerase II initiation and elongation factors during gene expression in vivo. Mol. Cell 9, 799–809 (2002). 46. Kim, T. H. et al. A high-resolution map of active promoters in the human genome. Nature 436, 876–880 (2005). 47. Harbison, C. T. et al. Transcriptional regulatory code of a eukaryotic genome. Nature 431, 99–104 (2004).
NATURE REVIEWS | MOLECULAR CELL BIOLOGY
48. Li, Z. et al. A global transcriptional regulatory role for c-Myc in Burkitt’s lymphoma cells. Proc. Natl Acad. Sci. USA 100, 8164–8169 (2003). 49. Martone, R. et al. Distribution of NF-κB-binding sites across human chromosome 22. Proc. Natl Acad. Sci. USA 100, 12247–12252 (2003). 50. Cawley, S. et al. Unbiased mapping of transcription factor binding sites along human chromosomes 21 and 22 points to widespread regulation of noncoding RNAs. Cell 116, 499–509 (2004). 51. Zhang, X. et al. Genome-wide analysis of cAMPresponse element binding protein occupancy, phosphorylation, and target gene activation in human tissues. Proc. Natl Acad. Sci. USA 102, 4459–4464 (2005). 52. Pokholok, D. K. et al. Genome-wide map of nucleosome acetylation and methylation in yeast. Cell 122, 517–527 (2005). 53. Cusick, M., Klitgord, N., Vidal, M. & Hill, D. E. Interactome: gateway into systems biology. Hum. Mol. Genet. 14, R171–R181 (2005). 54. Fields, S. High-throughput two-hybrid analysis. The promise and the peril. FEBS J. 272, 5391–5399 (2005). 55. Ben-Hur, A. & Noble, W. S. Kernel methods for predicting protein–protein interactions. Bioinformatics 21 (Suppl. 1), i38–i46 (2005). 56. Pazos, F., Ranea, J. A., Juan, D. & Sternberg, M. J. Assessing protein co-evolution in the context of the tree of life assists in the prediction of the interactome. J. Mol. Biol. 352, 1002–1015 (2005). 57. Droit, A., Poirier, G. G. & Hunter, J. M. Experimental and bioinformatic approaches for interrogating protein–protein interactions to determine protein function. J. Mol. Endocrinol. 34, 263–280 (2005). 58. Butland, G. et al. Interaction network containing conserved and essential protein complexes in Escherichia coli. Nature 433, 531–537 (2005). 59. Rain, J. C. et al. The protein–protein interaction map of Helicobacter pylori. Nature 409, 211–215 (2001). 60. Lacount, D. J. et al. A protein interaction network of the malaria parasite Plasmodium falciparum. Nature 438, 103–107 (2005). 61. Ito, T. et al. Roles for the two-hybrid system in exploration of the yeast protein interactome. Mol. Cell Proteomics 1, 561–566 (2002). 62. Formstecher, E. et al. Protein interaction mapping: a Drosophila case study. Genome Res. 15, 376–384 (2005). 63. Li, S. et al. A map of the interactome network of the metazoan C. elegans. Science 303, 540–543 (2004). 64. Stelzl, U. et al. A human protein–protein interaction network: a resource for annotating the proteome. Cell 122, 957–968 (2005). 65. Scholtens, D., Vidal, M. & Gentleman, R. Local modeling of global interactome networks. Bioinformatics 21, 3548–3557 (2005). 66. Hahn, M. W., Conant, G. C. & Wagner, A. Molecular evolution in large genetic networks: does connectivity equal constraint? J. Mol. Evol. 58, 203–211 (2004). 67. Sprinzak, E., Sattath, S. & Margalit, H. How reliable are experimental protein–protein interaction data? J. Mol. Biol. 327, 919–923 (2003). 68. Roehrl, M. H., Wang, J. Y. & Wagner, G. A general framework for development and data analysis of competitive high-throughput screens for smallmolecule inhibitors of protein–protein interactions by fluorescence polarization. Biochemistry 43, 16056–16066 (2004). 69. Bochner, B. R. New technologies to assess genotype– phenotype relationships. Nature Rev. Genet. 4, 309–314 (2003). 70. Bredel, M. & Jacoby, E. Chemogenomics: an emerging strategy for rapid target and drug discovery. Nature Rev. Genet. 5, 262–275 (2004).
VOLUME 7 | MARCH 2006 | 209
© 2006 Nature Publishing Group
REVIEWS 71. Dykxhoorn, D. M. & Lieberman, J. The silent revolution: RNA interference as basic biology, research tool, and therapeutic. Annu. Rev. Med. 56, 401–423 (2005). 72. Tong, A. H. et al. Global mapping of the yeast genetic interaction network. Science 303, 808–813 (2004). 73. Sauer, U. High-throughput phenomics: experimental methods for mapping fluxomes. Curr. Opin. Biotechnol. 15, 58–63 (2004). 74. Li, H. & Wang, W. Dissecting the transcription networks of a cell using computational genomics. Curr. Opin. Genet. Dev. 13, 611–616 (2003). 75. Wang, W. et al. Inference of combinatorial regulation in yeast transcriptional networks: a case study of sporulation. Proc. Natl Acad. Sci. USA 102, 1998– 2003 (2005). 76. Bar-Joseph, Z. et al. Computational discovery of gene modules and regulatory networks. Nature Biotechnol. 21, 1337–1342 (2003). Introduces the GRAM algorithm that can be used to identify gene modules or groups of co-expressed genes that share a common transcriptional regulator. This approach is useful for inferring transcriptionalregulatory networks from omics data sets. 77. Gat-Viks, I., Tanay, A. & Shamir, R. Modeling and analysis of heterogeneous regulation in biological networks. J. Comput. Biol. 11, 1034–1049 (2004). 78. Yeang, C. H. et al. Validation and refinement of generegulatory pathways on a network of physical interactions. Genome Biol. 6, R62 (2005). 79. Jansen, R. et al. A Bayesian networks approach for predicting protein–protein interactions from genomic data. Science 302, 449–453 (2003). 80. Rhodes, D. R. et al. Probabilistic model of the human protein–protein interaction network. Nature Biotechnol. 23, 951–959 (2005). This study illustrates the use of a Bayesian classification strategy to predict the structure of molecular networks — orthologous protein–protein interactions, transcriptomics and genomics data were integrated to develop a Bayesian model that predicts 40,000 human protein–protein interactions. 81. Yeger-Lotem, E. et al. Network motifs in integrated cellular networks of transcription-regulation and protein–protein interaction. Proc. Natl Acad. Sci. USA 101, 5934–5939 (2004). This work presents a methodology to decompose cellular networks into their constituent basic building blocks, or network motifs. Although the technique can be applied to networks of any type, this study focuses on the analysis of a S. cerevisiae network derived from genome-scale protein–protein- and protein–DNA-interaction data sets. 82. Yeger-Lotem, E. & Margalit, H. Detection of regulatory circuits by integrating the cellular networks of protein–protein interactions and transcription regulation. Nucleic Acids Res. 31, 6053–6061 (2003). 83. Zhang, L. V. et al. Motifs, themes and thematic maps of an integrated Saccharomyces cerevisiae interaction network. J. Biol. 4, 6 (2005). 84. Luscombe, N. M. et al. Genomic analysis of regulatory network dynamics reveals large topological changes. Nature 431, 308–312 (2004). 85. Han, J. D. et al. Evidence for dynamically organized modularity in the yeast protein–protein interaction network. Nature 430, 88–93 (2004). 86. Tanay, A., Sharan, R., Kupiec, M. & Shamir, R. Revealing modularity and organization in the yeast molecular network by integrated analysis of highly heterogeneous genomewide data. Proc. Natl Acad. Sci. USA 101, 2981–2986 (2004). 87. Ideker, T., Ozier, O., Schwikowski, B. & Siegel, A. F. Discovering regulatory and signalling circuits in molecular interaction networks. Bioinformatics 18 (Suppl. 1), S233–S240 (2002). 88. Wong, S. L. et al. Combining biological networks to predict genetic interactions. Proc. Natl Acad. Sci. USA 101, 15682–15687 (2004). 89. Kelley, R. & Ideker, T. Systematic interpretation of genetic interactions using protein networks. Nature Biotechnol. 23, 561–566 (2005). 90. Kanehisa, M., Goto, S., Kawashima, S., Okuno, Y. & Hattori, M. The KEGG resource for deciphering the genome. Nucleic Acids Res. 32, D277–D280 (2004). 91. Price, N. D., Reed, J. L. & Palsson, B. O. Genome-scale models of microbial cells: evaluating the consequences of constraints. Nature Rev. Microbiol. 2, 886–897 (2004).
92.
93. 94.
95.
96.
97.
98.
99.
100.
101.
102.
103.
104.
105.
106.
107.
108.
109.
110.
This review discusses the COBRA approach to modelling genome-scale molecular networks by integrating genome-scale data sets with a specific emphasis on the many recent analytical methods that are associated with these models for studying characteristics and capabilities of microorganisms. Reed, J. L., Famili, I., Thiele, I. & Palsson, B. O. Towards multidimensional genome annotation. Nature Rev. Genet. 7, 130–141 (2006). Palsson, B. Two-dimensional annotation of genomes. Nature Biotechnol. 22, 1218–1219 (2004). Patil, K. R., Akesson, M. & Nielsen, J. Use of genomescale microbial models for metabolic engineering. Curr. Opin. Biotechnol. 15, 64–69 (2004). Patil, K. R. & Nielsen, J. Uncovering transcriptional regulation of metabolism by using metabolic network topology. Proc. Natl Acad. Sci. USA 102, 2685–2689 (2005). Covert, M. W., Knight, E. M., Reed, J. L., Herrgard, M. J. & Palsson, B. O. Integrating highthroughput and computational data elucidates bacterial networks. Nature 429, 92–96 (2004). Papin, J. A. & Palsson, B. O. The JAK–STAT signaling network in the human B-cell: an extreme signaling pathway analysis. Biophys. J. 87, 37–46 (2004). Longabaugh, W. J., Davidson, E. H. & Bolouri, H. Computational representation of developmental genetic regulatory networks. Dev. Biol. 283, 1–16 (2005). The reconstruction and modelling of developmental gene-regulatory networks is detailed by integrating various data types using the BioTapestry modelling software. Saghatelian, A. & Cravatt, B. F. Global strategies to integrate the proteome and metabolome. Curr. Opin. Chem. Biol. 9, 62–68 (2005). Begley, T. J., Rosenbach, A. S., Ideker, T. & Samson, L. D. Hot spots for modulating toxicity identified by genomic phenotyping and localization mapping. Mol. Cell 16, 117–125 (2004). Lee, W. et al. Genome-wide requirements for resistance to functionally distinct DNA-damaging agents. PLoS Genet. 1, e24 (2005). Haugen, A. C. et al. Integrating phenotypic and expression profiles to map arsenic-response networks. Genome Biol. 5, R95 (2004). Kim, J. K. et al. Functional genomic analysis of RNA interference in C. elegans. Science 308, 1164–1167 (2005). Tewari, M. et al. Systematic interactome mapping and genetic perturbation analysis of a C. elegans TGF-β signaling network. Mol. Cell 13, 469–482 (2004). Boulton, S. J. et al. Combined functional genomic maps of the C. elegans DNA damage response. Science 295, 127–131 (2002). Gunsalus, K. C. et al. Predictive models of molecular machines involved in Caenorhabditis elegans early embryogenesis. Nature 436, 861–865 (2005). This study integrated transcriptomics, protein– protein interactions and RNAi-based phenomics to map the molecular network topology of genes associated with early embryogenesis in C. elegans. The resulting structure is used to infer potential network organizational and functional properties such as interacting molecular complexes and cellular-process crosstalk. Oksman-Caldentey, K. M. & Saito, K. Integrating genomics and metabolomics for engineering plant metabolic pathways. Curr. Opin. Biotechnol. 16, 174–179 (2005). Kristensen, C. et al. Metabolic engineering of dhurrin in transgenic Arabidopsis plants with marginal inadvertent effects on the metabolome and transcriptome. Proc. Natl Acad. Sci. USA 102, 1779–1784 (2005). This study used omics data integration to diagnose unexpected impacts of genomic manipulations on the phenotype of the organism. Metabolomic and transcriptomic data were integrated to assess the systems-wide impact of introducing exogenous high-flux pathways to A. thaliana. Hirai, M. Y. et al. Integration of transcriptomics and metabolomics for understanding of global responses to nutritional stresses in Arabidopsis thaliana. Proc. Natl Acad. Sci. USA 101, 10205–10210 (2004). Ippolito, J. E. et al. An integrated functional genomics and metabolomics approach for defining poor prognosis in human neuroendocrine cancers. Proc. Natl Acad. Sci. USA 102, 9901–9906 (2005).
210 | MARCH 2006 | VOLUME 7
The utility of integrating omics data to identify biomarkers is shown in this work, which integrated transcriptomics and metabolomics data to determine a molecular signature that is associated with poor-prognosis human neuroendocrine cancers. 111. Yan, W. et al. System-based proteomic analysis of the interferon response in human liver cells. Genome Biol. 5, R54 (2004). 112. Enard, W. et al. Intra- and interspecific variation in primate gene expression patterns. Science 296, 340–343 (2002). 113. Khaitovich, P. et al. Parallel patterns of evolution in the genomes and transcriptomes of humans and chimpanzees. Science 309, 1850–1854 (2005). 114. Khaitovich, P. et al. Regional patterns of gene expression in human and chimpanzee brains. Genome Res. 14, 1462–1473 (2004). 115. Ihmels, J. et al. Rewiring of the yeast transcriptional network through the evolution of motif usage. Science 309, 938–940 (2005). Genomics and transcriptomics data are integrated to identify a cis-regulatory element associated with the evolutionary emergence of rapid anaerobic growth capacity in certain yeast species. This study highlights the potential of integrating omics data sets to address fundamental evolutionary questions. 116. Tanay, A., Regev, A. & Shamir, R. Conservation and evolvability in regulatory networks: the evolution of ribosomal regulation in yeast. Proc. Natl Acad. Sci. USA 102, 7203–7208 (2005). 117. Shields, R. MIAME, we have a problem. Trends Genet. 22, 65–66 (2006). 118. Shannon, P. et al. Cytoscape: a software environment for integrated models of biomolecular interaction networks. Genome Res. 13, 2498–2504 (2003). One of the most widely used and broadly accessible software packages designed to facilitate omics data integration and analysis, known as Cytoscape, is detailed in this report. 119. Hucka, M. et al. The systems biology markup language (SBML): a medium for representation and exchange of biochemical network models. Bioinformatics 19, 524–531 (2003). 120. Novere, N. L. et al. Minimum information requested in the annotation of biochemical models (MIRIAM). Nature Biotechnol. 23, 1509–1515 (2005). 121. Stierum, R., Heijne, W., Kienhuis, A., van Ommen, B. & Groten, J. Toxicogenomics concepts and applications to study hepatic effects of food additives and chemicals. Toxicol. Appl. Pharmacol. 207, 179–188 (2005). 122. Corthesy-Theulaz, I. et al. Nutrigenomics: the impact of biomics technology on nutrition research. Ann. Nutr. Metab. 49, 355–365 (2005). 123. Desiere, F. Towards a systems biology understanding of human health: interplay between genotype, environment and nutrition. Biotechnol. Annu. Rev. 10, 51–84 (2004). 124. Roche, H. M., Phillips, C. & Gibney, M. J. The metabolic syndrome: the crossroads of diet and genetics. Proc. Nutr. Soc. 64, 371–377 (2005). 125. Ibrahim, S. M. & Gold, R. Genomics, proteomics, metabolomics: what is in a word for multiple sclerosis? Curr. Opin. Neurol. 18, 231–235 (2005). 126. Khalil, I. G. & Hill, C. Systems biology for cancer. Curr. Opin. Oncol. 17, 44–48 (2005). 127. Nikolsky, Y., Nikolskaya, T. & Bugrim, A. Biological networks and analysis of experimental data in drug discovery. Drug Discov. Today 10, 653–662 (2005). 128. Billings, P. R. et al. Ready for genomic medicine? Perspectives of health care decision makers. Arch. Intern. Med. 165, 1917–1919 (2005). 129. Deeds, E. J., Ashenberg, O. & Shakhnovich, E. I. A simple physical model for scaling in protein–protein interaction networks. Proc. Natl Acad. Sci. USA 103, 311–316 (2006).
Competing interests statement The authors declare competing financial interests, see Web version for details.
FURTHER INFORMATION Bernhard Palsson’s laboratory: http://systemsbiology.ucsd.edu Access to this interactive links box is free online.
www.nature.com/reviews/molcellbio
© 2006 Nature Publishing Group