The Moderation of Output and In‡ation: A Good Shock, Bad Shock Story Szilárd Benk Magyar Nemzeti Bank Central European University Max Gillmany Cardi¤ Business School Institute of Economics, Hungarian Academy of Sciences Michal Kejak CERGE-EI May 31, 2007 Abstract We allow jointly for money and credit shocks to e¤ect output through an endogenous growth business cycle model that includes exchange credit. For the 1919-2004 annual period, we explain the close correlation of volatilities of GDP growth and in‡ation in terms of credit and money shocks that have "bad" and "good" e¤ects, de…ned in terms of their e¤ects on the spectral variation in GDP. With these shocks we characterize and contrast the two great volatility cycles over this historical period. The Great Moderation post-1983 coincided with good credit shocks from deregulation, while the Great Depression was faced with bad money and credit shocks that were consistent with its prolonged nature. Keywords: Volatility, business cycle, credit shocks, velocity. JEL: E13, E32, E44 We thank Daniel Levy, Patrick Minford, Casper de Vries, participants at the Reading University seminar series, the EMF Amsterdam conference, and gratefully acknowledge support from a World Bank GDN RRC IV grant. y Corresponding author: Cardi¤ Business School, Aberconway Drive, Cardi¤ CF11 3EU, UK;
[email protected].
1
1
Introduction
GDP and in‡ation rate volatility rose to higher levels from the 1960s through the mid-1980s. The decrease in GDP volatility at the end of this period is know now as the Great Moderation. However historical data shows that there was a much larger rise and decline in these two volatilities from 1927 to 1940, which …nally dropped to low levels in the 1950s. This much larger cycle encompassed the Great Depression and WWII (please see Section 1.1). This paper shows a new perspective on the signi…cant US macroeconomic stability experienced since 1983, in terms of the lower GDP and in‡ation volatility. It does this by analyzing and comparing the two major rises and declines of these volatilities since 1919 using a stochastic endogenous growth monetary economy. We show what percent of the total GDP growth rate variation is due to each of three di¤erent shocks, on goods productivity, money supply growth rates, and credit sector productivity; we decompose the GDP growth rate variation across spectral frequencies; and we determine the contribution of each shock to the spectral variation of the GDP growth. This is done for the entire 1919-2004 period, for various subperiod divisions, and for exogenous growth to provide a comparison to our endogenous growth baseline model. We similarly explain money velocity variation as it helps to detail di¤erences in the major volatility swings of GDP growth and in‡ation. To present a cohesive story, …rst we set out an endogenous growth monetary economy, as found in Benk, Gillman, and Kejak (2007) (Section 2). We compare the model’s simulated behavior to facts, for example as in Cooley and Hansen (1995) (Section 3). Then, we construct the shocks based upon the equilibrium solutions of our model and time series data, as does Parkin (1988) (Appendix) and show their historical patterns (Section 4). Then we demonstrate how they a¤ect the …rst moment: the level of GDP and velocity (Section 4.1). Then we see how the shocks e¤ect the second moment: the variation of GDP growth and velocity, as in Ingram, Kocherlakota, and Savin (1994). We further study this variation across subperiods, as in Jermann and Quadrini (2006), and across the spectral frequencies. For this spectral analysis, we de…ne the short run (SR), long run (LR), and business cycle (BC) 1
frequency decompositions, as in Levy and Dezhbakhsh (2003) (Section 4.2). We …nd that the behavior of the credit shock in our model, plays a very di¤erent role during the two major volatility movements. This provides a distinguishing characteristic by which to contrast these episodes, and at the same time explain some puzzles occuring with the post 1983 Moderation. While the co-movement of in‡ation volatility with GDP volatility remained remarkably consistent throughout the entire 1919-2004 period, the credit shocks, money velocity, and money supply growth rate volatilities have signi…cant breaks from moving with these other two. This gives rise to a characterization of the why GDP and in‡ation volatility fell post-1983 even as the volatility of the M1 money growth rate rose, in contrast to the 1927-1955 period when money velocity and all money aggregate growth rate volatilities coincided with the in‡ation and GDP volatility movements. From these we see that money and credit shocks are important in explaining GDP growth and velocity volatiity, along with productivity shocks. The money supply growth rates explain a lot of GDP volatility, but of a di¤erent nature pre- and post-war. This source of volatility from money is due to short run factors 1919-1939, and more from longer run factors from 1955-2004. Credit likewise behaves in a di¤erent fashion across the periods: Constrained during 1919-1939, subsidized during 1940-1950, and liberalized postwar. Post-1983 "good" credit shocks to GDP are consistent with a Jermann and Quadrini (2006) type of facilitation of less GDP volatility while the "bad" credit shocks prewar contributed to greater GDP volatility. The constraints on exchange credit prewar allow the money supply volatility to translate directly into GDP and in‡ation volatilities. But the liberalization of credit post-1983 keeps the money supply volatility from increasing the GDP and in‡ation volatilities (Sections 5 and 6).
2
15.0%
8.0% 6.0%
10.0%
4.0% 5.0%
2.0%
0.0%
0.0% -2.0%
-5.0%
-4.0% -10.0%
-6.0%
Inflation
2003
1999
1995
1991
1987
1983
1979
1975
1971
1967
1963
1959
1955
1951
1947
1943
1939
1935
1931
1927
1923
-8.0% 1919
-15.0%
Volatility(Inflation)
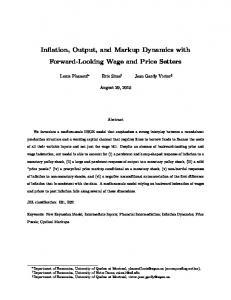
Figure 1: In‡ation Rate Level and its Volatility 1919-2004
1.1
Historical Trends
There are four historical stylistic trends that we identify as being important. 1) In‡ation and its volatility move together, as shown in Figure 11 . 2) In‡ation volatility and GDP volatility each had a large up and down movement in the pre-War period that lasted through WWII, and these were much larger than the the rise and fall of these volatilities from the 1960s to the 1990s; see Figure 2. 3) Also in Figure 2, money velocity volatility and M1 growth rate volatility moved together and broadly followed GDP and in‡ation volatilities up until 1983, when they together sharply diverged from the other two. 4) GDP and the normalized in‡ation volatilities move together throughout the entire historical period except WWII. In Figure 3, the in‡ation volatility is normalizing by adjusting the in‡ation volatility upwards by multiplying it by the average proportion di¤erence between it and the GDP 1
Volatility is calculated as the standard deviation of the variable over a certain window. For annual data it is a 7 year window; the formula is volatility(xt ) = SD(xt
k ; xt k+1 ; :::xt ; :::; xt+k 1; xt+k );
where k = 3 for annual data.
3
14.0% 12.0% 10.0% 8.0% 6.0% 4.0% 2.0%
Volatility(GDP) Volatility(Inflation)
2003
1999
1995
1991
1987
1983
1979
1975
1971
1967
1963
1959
1955
1951
1947
1943
1939
1935
1931
1927
1923
1919
0.0%
Volatility(Velocity) Volatility(grM1)
Figure 2: Volatilities of GDP, In‡ation, Velocity and M1 Growth 1919-2004
volality for the 1919-2004 period. It is also important to see that the GDP volatility and the GDP growth rate volatility are very similar. Figure 4 shows that both move with the in‡ation rate volatility, and that the GDP growth rate volatility is even a bit more highly correlated with the in‡ation rate volatility. 5). Finally, Figure 5 shows that the GDP level (growth rate) and the in‡ation rate moved together from 1919-1955 (except 1945-1949), with a 0.65 correlation from 1919-1939, and almost in opposite directions post-1955, with a -0.25 correlation from 1951-2004.
2
The Endogenous Growth Economy with Credit
The representative agent economy is as in Benk, Gillman, and Kejak (2007), which is an endogenous growth version of the monetary business cycle with credit that appears in Benk, Gillman, and Kejak (2005b) and Benk, Gillman, and Kejak (2005a), now with human capital investment causing growth as in Lucas (1988) instead of exogenous growth. By combining the business cycle with endogenous growth, stationary in‡ation lowers the output growth rate as in Gillman and Kejak (2005) over the stochastic secular trend, and
4
0.2 0.18 0.16 0.14 0.12 0.1 0.08 0.06 0.04 0.02
Volatility(GDP)
2003
1999
1995
1991
1987
1983
1979
1975
1971
1967
1963
1959
1955
1951
1947
1943
1939
1935
1931
1927
1923
1919
0
Volatility(Inflation) [scaled]
Figure 3: Scaled In‡ation Volatility Versus GDP Volatility, 1919-2004
0.2 0.18 0.16 0.14 0.12 0.1 0.08 0.06 0.04 0.02
Volatility(GDP)
Volatility(Inflation) [scaled]
2003
1999
1995
1991
1987
1983
1979
1975
1971
1967
1963
1959
1955
1951
1947
1943
1939
1935
1931
1927
1923
1919
0
Volatility(gY)
Figure 4: Volatilites of GDP, the GDP Growth and Scaled In‡ation, 19192004
5
20% 15% 10% 5% 0% -5%
Corr(grGDP, inflation) Full sample: 0.38 1919-1939: 0.65 1940-1950: 0.23 1951-2004: -0.25
-10% -15%
grGDP
2003
1999
1995
1991
1987
1983
1979
1975
1971
1967
1963
1959
1955
1951
1947
1943
1939
1935
1931
1927
1923
1919
-20%
Inflation
Figure 5: GDP Growth Rate Level and the In‡ation Rate Level, 1919-2004
as supported empirically for example in Gillman, Harris, and Matyas (2004). While over the business cycle, shocks cause changes in growth rates and in stationary ratios. There are three shocks, to the goods sector productivity, the money supply growth rate, and the credit sector productivity. The shocks occur at the beginning of the period, observed by the consumer before the decision process, and follow a vector …rst-order autoregressive process. For goods sector productivity, zt ; the money supply growth rate, ut ; and credit sector productivity, vt : Zt =
Z Zt 1
+ "Zt ;
(1)
where the shocks are Zt = [zt ut vt ]0 , the autocorrelation matrix is Z = diag f'z ; 'u ; 'v g and 'z ; 'u ; 'v 2 (0; 1) are autocorrelation parameters, and the shock innovations are "Zt = [
zt
ut
vt ]
0
N (0; ) : The general struc-
ture of the second-order moments is assumed to be given by the variancecovariance matrix
2.1
. These shocks a¤ect the economy as described below.
Consumer Problem
Consider a representative agent that maximizes over an in…nite horizon its expected lifetime utility over consumption ct and leisure xt . Utility is given 6
by: U = E0
1 X
t
u(ct ; xt )
0
0;
2 (0; 1):
(8)
This makes AF evt the random productivity shift factor. Note the microfoundations for the credit production function. Denoting total real credit by dt ; the full function can be written as dt = ct (1
at ) = AF evt (ft ht ) ct1 ;
(9)
so that it is CRS in e¤ective labor ft ht and consumption goods ct : Gillman, Harris, and Kejak (2006) lay out a fully decentralized version of …nancial intermediation using a similar production function. It is micro-founded in the literature of Clark (1984) and Hancock (1985) who specify a third factor other than labor and capital for the production of …nancial services, this factor being the deposited funds. While capital is omitted here for simplicity, the goods consumption can be thought of as being equal to the deposited funds. This follows when all exchange means originate from the intermediary, both money deposits and credit, and is backed completely by deposits held in the bank. Since ct is the total amount of goods bought with exchange means in the model, total deposits would equal ct : Thus the production function is directly based upon the micro-banking function which is CRS in standard inputs and …nancial deposits. While the deposit structure is suppressed in this model for simplicity of presentation, the credit productivity shock can be 8
thought of as a standard productivity shock to the …nancial intermediation sector.2 The period t budget constraint of the representative consumer is given by: Pt wt lt ht + Pt rt sGt kt + Pt (1
2.2
k )kt
Pt ct + Pt kt+1 + Mt+1 : (10)
+ Tt + Mt
Producer Problem
The …rm maximizes pro…t given by yt wt lt ht rt sGt kt ; subject to a standard Cobb-Douglas production function in e¤ective labor and capital. This is given as yt = G(sGt kt ; lt ht ; zt ) = AG ezt (sGt kt )1
(lt ht ) :
(11)
The …rst order conditions for the …rm’s problem yield the following expressions for the wage rate and the rental rate of capital: wt = AG e
rt = (1
2.3
1
sGt kt lt ht
zt
)AG ezt
(12)
;
sGt kt lt ht
(13)
:
Government Money Supply
It is assumed that the government policy includes sequences of nominal transfers which satisfy: Tt =
t Mt
=(
+ eut
1)Mt ;
t
where t is the growth rate of money and of money. 2
= [Mt
Mt 1 ]=Mt 1 :
is the stationary growth rate
Benk, Gillman and Kejak (2007) takes this Clark (1984) production approach.
9
(14)
2.4
De…nition of Competitive Equilibrium
Denote the state of the economy by s = (k; h; M; z; u; v) and by a prime (’) the next-period values. A competitive equilibrium consists of a set of policy functions c(s), x(s), l(s), n(s), f (s), sG (s), a(s), k 0 (s), h0 (s), M 0 (s), pricing functions P (s), w(s), r(s) and a value function V (s), such that: (i) households maximize utility: given the pricing functions and the policy functions, V (s) solves the functional equation (15). (ii) …rms maximize pro…ts, the functions w and r being given by (12) and (13). (iii) goods and money markets clear, in equations (10) and (14). The representative agent’s optimization problem can be written in a recursive form as: V (s) =
max
c; x; l; n; f;sG; a;k0 ;h0 ;M 0
fu(c; x) + EV (s0 )g
(15)
subject to the conditions (3)-(10).
2.5
E¤ect of Shocks on Balanced-Path Growth Rate
Equilibrium conditions along the balanced-growth path are given here to describe how the shocks a¤ect the equilibrium. Rt =
(16)
+ ;
~t xt 1+R = ; ct wt ht ~ t = at Rt + Rt (1 R rHt 1 + gt =
"AH
sHt kt lHt ht
1 + rHt 1+
H
(17) (18)
at ) ;
(1 ")
(1 =
(19)
xt );
1 + rt 1+
K
;
(20)
At the Friedman optimum, the nominal interest R of equation (16) equals zero and no credit is used. But as in‡ation rises, the agent substitutes from goods towards leisure while equalizing the margin of the ratio of the shadow 10
h i ~ t = (wt ht ) ; in equation (17). Here price of goods to leisure, xt =( ct ) = 1 + R ~ t ; as given in equation (18), is the average exchange cost per unit of output; R this equals the average cost of using cash, Rt ; weighted by (at ) and the average cost of using credit, Rt ; weighted by (1
at ) : That Rt is an average cost
can be veri…ed by dividing the total cost of credit production by the total output of credit production. And this total exchange cost determines how much substitution there is from money to credit, and from goods to leisure. Substitution towards leisure causes a fall in the human capital return of rHt
"AH (sHt kt =lHt ht )(1
")
(1
xt ) , given in equation (19). The marginal
product of physical capital rt , in equation (13), also falls, while the real wage wt in equation (12) rises, while there is a Tobin (1965)-type substitution from labor to capital across all sectors in response to the higher real wage to real interest rate ratio; the Tobin (1965) like rise in sHt kt =lHt ht mitigates but does not reverse the fall in the return to human capital rHt caused by the increase in leisure. The growth rate, in equation (20), falls as Rt rises since both rHt and rt fall. As the in‡ation rate continues to rise, the credit substitution channel allows the growth rate to decline at a decreasing rate, as more credit and less leisure are used as the substitute for the in‡ation-taxed good (Gillman and Kejak 2005). A positive money shock increases Rt and the goods shadow price [1 + at Rt + (1
at ) Rt ] relative to the leisure shadow price wt ; induces substitu-
tion from goods (ct =ht ) towards leisure (xt ); and decreases the growth rate; a positive credit shock in reverse decreases the cost of exchange, induces substitution from xt towards ct =ht , increases the employment rate (1
xt ) and
gt . A goods productivity shock directly increases rt and gt .
3
Calibration and Solution
In order to put the problem into a form for which standard solution techniques can be applied, we transform the variables so that all variables in the dererministic version of the model converge to a steady state. De…ne ~ 1; 1; z; u; v) so that ~ = M=P h and thus s~ = (k; c~ = c=h, ~{ = i=h, k~ = k=h, M all variables marked with (~) follow a stationary process. 11
3.2
2
0.947
0.64
'z
'u
'v
0.77
0.91
0.81
0.99 z
1.69
AG
AH
AF
1
0.51
1.10
u
0.42
v
1.22
zu
-0.11
0.13
k
h
0.05
0.05
zv
-0.42
uv
0.88
Table 1: Parameter values used in calibration To solve and simulate the model, the model parameters must be assigned values. We calibrate the model by mapping the model economy into observed features of the data; parameters are chosen so that certain features of the nonstochastic steady state of the model match average values from US annual time series between 1919-2004. The US average of the ratio of M1 to consumption over 1919-2004 is 0.38, and the model’s m=c (inverse consumption velocity) is calibrated to match this. In other ways, the calibation process follows closely Benk, Gillman, and Kejak (2007). Table 1 presents the parameter values used for calibration. In order to solve the model, we log-linearize the equilibrium conditions of the model around its deterministic steady state, and denote by the steady state value of variable , and by ^ its percentage deviation from the steady state (^ = log( )
log( )). Then we solve the resulting stochastic linear
system of equations by using standard techniques described, for example as in Hartley, She¤rin, and Salyer (1997).
3.1
Data
Table 2 presents US data stylized facts, in terms of moments of a set of variables for the period 1919-2004. The series have been detrended using the Christiano and Fitzgerald (2003) asymmetric frequency …lter with a band of 2-86 years (86=sample size). This …ltering approach is used instead of more standard HP …lter in order to preserve not only the short-run and business cycle ‡uctuations but also the longer run movements in data. This allows for study of the long-term features of the endogenous growth model, simultaneously with the short-run and business cycle movements. Focusing on volatility, consumption and investment relative volatilities are 0.64 and 4.04, while GDP growth is 0.48. Consumption and investment 12
GDP GDP growth Consumption Investment Banking hours Nominal wages Real wages CPI Inflation Real money M1 M1 growth Velocity
Relative Volatility 1.00 0.48 0.64 4.09 1.70 1.49 0.49 1.44 0.44 1.61 2.12 0.61 1.39
Corr w/ Output 1.00 0.20 0.56 0.53 -0.29 0.55 0.44 0.42 0.40 0.47 0.65 0.10 0.06
Corr w/ Output growth 0.20 1.00 0.01 0.17 -0.35 -0.12 -0.09 -0.09 0.32 0.14 0.05 0.54 0.01
Corr w/ Money growth 0.10 0.54 -0.20 -0.16 -0.27 -0.24 -0.19 -0.18 0.42 0.30 0.10 1.00 -0.24
Note: See Appendix for data sources. All series represent the cyclical component of the data …ltered with the Christiano-Fitzgerald asymmetric frequency …lter with a band of 2-86 years (86=sample size). Series are in logs except those that represent rates. Relative volatility is measured as the ratio of standard deviation of the series to the standard deviation of GDP
Table 2: US business cycle facts correlation with output is 0.56 and 0.53. On the monetary side, velocity volatility is 1.39, real M1 volatility is 1.61 and in‡ation volatility is 0.44. The correlation of velocity with output is 0.06, slightly procyclic (postwar velocity data is more procyclic).
3.2
Simulated Model Results
Here the calibrated model is used to simulate variables that can be compared to the actual correlation experience of the US data presented above. Level variables are normalized by human capital. Simulated relative volatilities of consumption and investment ratios are 0.66 and 3.27, comparing well to the data values of 0.64 and 4.09. Output growth volatility is 0.29 again comparing well to 0.48 for the GDP data. The model ’s consumption and investment correlation with output is 0.89 and 0.90 versus 0.56 and 0.53. On the monetary side, the simulated velocity volatility is 0.96 as compared to 1.39 in the data, about 70% of that found in the data. The normalized money and the in‡ation volatilities are 1.35 and 0.70, compared to 1.61 and 13
k/h m/h c/h l z u v s r w y/h k/l i/h x R n h growth velocity a f inflation y growth
Relative Volatility 0.93 1.35 0.66 0.44 0.58 0.22 0.46 0.01 0.11 0.76 1.00 1.06 3.27 0.06 0.68 0.45 0.03 0.96 0.80 0.69 0.70 0.29
Corr w/ Output 0.64 0.70 0.89 0.70 1.00 -0.10 -0.41 0.42 0.49 0.91 1.00 0.28 0.90 -0.95 -0.27 -0.10 -0.10 0.05 0.45 0.45 -0.34 0.64
Corr w/ Output growth 0.17 0.34 0.43 0.68 0.67 -0.05 -0.27 0.57 0.60 0.45 0.64 -0.13 0.72 -0.52 -0.12 -0.39 -0.38 0.19 0.27 0.34 -0.22 1.00
Corr w/ Money growth -0.07 -0.65 -0.09 -0.08 -0.09 1.00 0.82 -0.03 -0.04 -0.08 -0.10 -0.03 -0.08 0.12 0.52 -0.01 -0.02 0.81 -0.87 0.49 0.49 -0.05
Table 3: Business cycle properties - simulations: all shocks 0.44 in the data. Velocity’s correlation with output is 0.05, right on the mark compared to the data’s 0.06. Real money correlation with output is 0.70 compared to the data value of 0.47. The simulated in‡ation correlation with output is positive while it is negative in the data; but the simulated correlation of in‡ation with money growth is positive at 0.49, and positive in the data at 0.42.
4
The E¤ect of Shocks on GDP and Velocity
We construct the shocks as in Parkin (1988) and Benk et al (2005b, 2007). This process is described in the Appendix. One di¤erence from previous work is that we use a long …lter, which takes out only the 86 year trend from the data. This is the minimalist …ltering consistent with stationary series, 14
desirable for leaving in the longer run features, along with business cycle and short run features, that are focused on in the spectral ordering of the variance decomposition. The next three …gures show each of the shocks, for both the baseline endogenous growth and the comparison model of exogenous growth. The productivity shock is little changed from exogenous growth; the credit shock shows signi…cant di¤erences from exogenous growth, for example during the Great Depression; and the money shock has various di¤erences such as during the Great In‡ation. 20%
10%
0%
-10%
-20%
-30%
z_endog
2003
2001
1999
1997
1995
1993
1991
1989
1987
1985
1983
1981
1979
1977
1975
1973
1971
1969
1967
1965
1963
1961
1959
1957
1955
1953
1951
1949
1947
1945
1943
1941
1939
1937
1935
1933
1931
1929
1927
1925
1923
1921
1919
-40%
z_exog
Figure 6: Productivity Shocks, Endogenous and Exogenous Growth Models, 1919-2004
Figure 6 shows a harsh negative e¤ect of the goods sector productivity shock during the Great Depression, consistent with total factor productivity stories of the Great Depression (Kehoe and Prescott 2002). Figure 7 shows the credit shock. The baseline endogenous growth shows for example negative e¤ects during the Great Depression that contributed to its prolongement, and some positive e¤ects during the 1970s and into the deregulatory period. Figure 8 shows the crash in the money supply starting in 1928 that lasted through to 1940, and not really reaching a trough until 1946. And it shows 15
u_endog
16
2003
2001
1999
1997
1995
1993
1991
1989
1987
1985
1983
1981
1979
v_endog
1977
1975
1973
1971
1969
1967
1965
1963
1961
1959
1957
1955
1953
1951
1949
1947
1945
1943
1941
1939
1937
1935
1933
1931
1929
1927
1925
1923
1921
1919
2003
2001
1999
1997
1995
1993
1991
1989
1987
1985
1983
1981
1979
1977
1975
1973
1971
1969
1967
1965
1963
1961
1959
1957
1955
1953
1951
1949
1947
1945
1943
1941
1939
1937
1935
1933
1931
1929
1927
1925
1923
1921
1919
20%
15%
10%
5%
0%
-5%
-10%
-15%
-20%
v_exog
Figure 7: Credit Shocks, Endogenous and Exogenous Growth Models, 19192004
8%
6%
4%
2%
0%
-2%
-4%
-6%
-8%
u_exog
Figure 8: Money Shocks, Endogenous and Exogenous Growth Models, 19192004
the long prolonged increase during the Great In‡ation.
4.1
First Moment: E¤ect of Shocks on Historical Levels
The e¤ects of these shocks on output and on velocity can be devised by summing up the contributions with error. Here, the decomposition into shocks can be written as: ybt =
yb ~ k kt
+
for GDP, and for velocity (V ytd =mt =
where the terms
i z zt ,
Vb ~ k kt
i u ut
y z zt
y u ut
+
+
y v vt
+ errorty ;
(21)
y=m) as: +
and
V z zt
+
i v vt ;
V u ut
+
V v vt
+ errortV ;
(22)
with i = y; V; indicate the contribution
to productivity, money and credit shocks to the cyclical component of GDP d 3 (b y ) and velocity (y=m). Figure 9 shows the e¤ects on GDP for the entire historical period, where again there is detrending with the 2-86 …lter. The contribution of credit to GDP is very small, although its contribution to velocity is considerable. The GDP Figure shows high in‡ation of the 1920s was causing negative e¤ects on output, which then crashed. In the 1970s, it is clear that the negative e¤ect of the high in‡ation on output is going opposite of the productivity shocks to both the goods and credit sectors, leaving only the money shock to be going in the same direction as the GDP cycle. Figure 10 then shows how each shock a¤ects velocity ‡uctuations, indicating how well the velocity cycle is explained by the shocks. One observation is that when velocity is not fully described by the shocks, then GDP in turn tends not to be well-explained by the goods productivity shock. This seems true for the 1920s, the Great Depression, and to a much lessor extent the Great In‡ation period. This may show in particular times when the in‡ation 3
The stationary variable is actually y=h; however as we are not aware of any human capital estimate back to 1919, and so cannot normalize y by h here, we assume a smooth trend for h that has no e¤ect on the …ltered data so that there is no di¤erence between the decomposition of the ‡uctuations of y versus y=h:
17
30%
20%
10%
0%
-10%
-20%
Effect of prod on Y
Effect of money on Y
Effect of credit on Y
2003
2001
1999
1997
1995
1993
1991
1989
1987
1985
1983
1981
1979
1977
1975
1973
1971
1969
1967
1965
1963
1961
1959
1957
1955
1953
1951
1949
1947
1945
1943
1941
1939
1937
1935
1933
1931
1929
1927
1925
1923
1921
1919
-30%
GDP cycle
Figure 9: E¤ect of Shocks on GDP Cycle, 1919-2004
rate is not fully anticipated, which is consistent with the greater short run GDP variation during these times that we …nd in the next subsection.
4.2
Second Moment: Variance Decomposition by Shocks and Frequency Domain
We decompose the ‡uctuations in GDP growth and velocity along two dimensions: First, we show how much of the variance in explained by each of the shocks. Second, we decompose the variance based on frequencies, and show that how much of the variance takes place at short run, business cycle and long run frequencies, and then how much each of these frequencies are explained by each of the shocks. The decomposition of the variance of the GDP growth and velocity by shocks is based on the principle described in Ingram, Kocherlakota, and Savin (1994), and has been done as follows: Let z, v and u be the three, possibly correlated shocks. Let’s assume the ordering z-v-u, that is, the movements in z are responsible for any comovements between z and v or z and u, and that movements in v are responsible for any comovements between v and u. We can formalize this notion by de…ning vte to be the residuals in a regression of vt on the vector (zt ; :::; zt s ) and uet to be the residuals in a regression of 18
30%
20%
10%
0%
-10%
-20%
-30%
Effect of prod on vel
Effect of money on vel
Effect of credit on vel
2003
2001
1999
1997
1995
1993
1991
1989
1987
1985
1983
1981
1979
1977
1975
1973
1971
1969
1967
1965
1963
1961
1959
1957
1955
1953
1951
1949
1947
1945
1943
1941
1939
1937
1935
1933
1931
1929
1927
1925
1923
1921
1919
-40%
Velocity cycle
Figure 10: E¤ect of Shocks on Velocity Cycle, 1919-2004
ut on the vector (zt ; :::; zt s ; vt ; :::; vt s ). Thus we interpret vte as capturing the movements of v that are not associated with current, future, or past movements in z. Given this particular ordering, consider the decomposition of the variance _ t ) into the components due to the various shocks that is of GDP growth (4y obtained by running the regression: _ t= 4y
S X s=0
|
z;s zt s
{z
_ z 4y t
}
+
S X s=0
|
e v;s vt s
{z
_ v 4y t
}
+
S X s=0
|
e u;s ut s
{z
_ u 4y t
+ "t
(23)
}
_ t explained by each shock is given Then the fraction of the variance of 4y by: P z =
_ z) V ar(4y t _ t) , V ar(4y
Pv =
_ v) V ar(4y t _ t) , V ar(4y
Pu =
_ u) V ar(4y t _ t) . V ar(4y
A similar regression to
that of (23) is run on velocity and the same shocks to determine its variance decomposition. It is important to emphasize that unless the shocks z, v and u are orthogonal to each other, the results are sensitive to the ordering adopted. Should this be the case, this method typically assigns too much variance to the shock ordered …rst and possibly too little variance to the shock ordered last. To mitigate this problem, we considered all the six possible orderings 19
1919-1939 1940-1950 1951-1965 1966-1985 1986-2004 1919-2004 except 1941-1950 1919-2004
PR 34% 25% 39% 52% 46% 48% 18%
Endogenous M 41% 32% 33% 27% 24% 31% 35%
CR 24% 43% 28% 22% 31% 20% 47%
PR 37% 46% 24% 42% 36% 58% 28%
Exogenous M 40% 18% 22% 30% 33% 26% 28%
CR 23% 36% 54% 28% 31% 16% 44%
Table 4: Decomposition of Variance of GDP Growth, by Shock and Subperiod
1919-1939 1940-1950 1951-1965 1966-1985 1986-2004 1919-2004 except 1941-1950 1919-2004
PR 43% 42% 56% 11% 22% 18% 24%
Endogenous M 34% 26% 20% 47% 38% 45% 47%
CR 22% 32% 24% 42% 41% 37% 29%
PR 29% 22% 39% 16% 35% 12% 17%
Exogenous M 53% 19% 13% 45% 35% 57% 56%
CR 19% 58% 48% 39% 30% 31% 28%
Table 5: Decomposition of Variance of Velocity, by Shock and Subperiod of the shocks, and then computed the average of the fractions of variance explained by each shock. This way we formed an average of the fractions, computed where each shock has been ordered twice …rst, twice second and twice last. 4.2.1
By Subperiod
Tables (4) and (5) report these average fractions of variance of the GDP growth and velocity, explained by the productivity (PR), money (M) and credit (CR) shocks. These variance decompositions are reported for the entire 1919-2004 period, for this except the WWII period, and then for various subperiods. These encompass the interwar (Great Depression) period of 1919-1939, the WWII period of 1940-1950, the postwar non-in‡ationary period of 1951-1965, the high in‡ation (Great In‡ation) period of 1966-1985, and the deregulatory/low-in‡ation (Great Moderation) period of 1986-2004. The results show …rst that money and credit shocks had signi…cant contributions over the entire period and for all of the subperiods. Some particulars
20
stand out. For example the money shock contributed the most to the variation in output growth during the Great Depression subperiod, at 41%, and more than money contributed to the variance of any other subperiod. And the productivity shock contributed the least to velocity during 1966-1985, and the most to output growth during the same subperiod. It is easier to interpret such …ndings with the further variance breakdown by frequency. 4.2.2
By Both Spectral Frequency and Subperiod
The second step in our analysis is to decompose the variance of the GDP growth and velocity along a third dimension and to show the amount of variance that takes place at short run, business cycle and long run frequencies. Frequencies are de…ned as in Levy and Dezhbakhsh (2003): the short-run (SR) frequency band corresponds to cycles of 2-3 years, the business cycle (BC) frequency band to cycles of 3-8 years, and the long-run (LR) band to cycles of 8 years and longer. The proportion of variance of a series due to SR, BC and LR components can be obtained as in Levy and Dezhbakhsh (2003): it amounts to estimating the spectral density of the series, normalizing it by the series variance, and then computing its integral over the corresponding frequency band. If we denote by f (!) the spectral density of the series and by
2
its variance,
then the fraction of variance due to each frequency component is given by R 2 =2 R 2 =3 R 2 =8 H SR = 2 =3 f (!)= 2 d!, H BC = 2 =8 f (!)= 2 d!, H LR = 2 =1 f (!)= 2 d!. The frequency bands are determined by the mapping ! = 2 =p, where p measures the cycle length (2, 3 or 8 years). We are using an alternative, equivalent measure for the fractions of variance (suggested also by Levy and Dezhbakhsh (2003)): this consists of passing the series through a band-pass …lter, estimating the variance of the …ltered series and relating it to the variance of the original series. We employ the Christiano-Fitzgerald asymmetric band-pass …lter with the afore-mentioned 2-3, 3-8 and >8 year bands. This procedure is applied to the simulated series of output growth and velocity, where simulations have been run by feeding back the estimated variance-covariance structure of the shocks into the model. The variance-covariance matrices have been estimated separately for 21
each of the subperiods, this way we obtained simulated series and decompositions that di¤er by subperiods. The results are reported in tables (6) and (7), columns ‘all’, indicating the total variance of a given series at a given frequency. To assess the fraction of variance explained by each shock in turn at each frequency, we decompose each of the frequency component further, by shocks. The variance decomposition procedure is similar to that described in equation (23). The di¤erence consists in pre-…ltering the target series and the shock series to extract the adequate frequency component. According to this, the Christiano-Fitzgerald asymmetric band-pass …lter with the 2-3, 3-8 and >8 year bands is applied to the output growth and velocity series, as well as to the productivity, money and credit shock series. The columns ‘PR’, ‘M’ and ‘CR’ of tables (6) and (7) summarize the results. The numbers in these columns show the fraction of variance at a given frequency that is explained by a given shock. Tables 6 indicates that the money shock contributes more to the short run variance of GDP during 1919-1939, and 1966-1985, than in all other periods, and more to business cycle variation as well during these periods. Its e¤ect on LR GDP volatility drops in half during 1919-1939, and below average from 1966-1985, while being above 23% for the LR GDP at other subperiods. This provides a sense in which the close comovement of in‡ation with GDP growth, seen in Figure 5, is Phillips-like in the Great Depression, and during the Great In‡ation, and so exhibiting more the short run e¤ects of the money shock on GDP. The money shock has more of the long run e¤ects on GDP growth after WWII, consistent with the emergence more of the long run endogenous growth features of the model whereby the in‡ation tax decreases the growth rate. In fact, money had a 0% e¤ect on GDP short run movements in the stable money periods of 1951-1965 and 1986-2004 (and 1940-1950). This is a remarkable indication of the type that gives a quantitative impact to Friedman’s money as a veil: only when it shudders does GDP ‡utter. But the quanti…cation here of the SR and BC e¤ects makes this dictum strictly about 22
PR
Endogenous M
CR
all
PR
Exogenous M
CR
all
1919-1939 SR BC LR
5% 12% 25%
3% 9% 11%
5% 12% 19%
13% 33% 55%
14% 11% 9%
11% 13% 4%
9% 24% 5%
35% 48% 17%
SR BC LR
1% 6% 18%
0% 5% 21%
1% 4% 43%
2% 16% 82%
13% 16% 8%
9% 10% 4%
9% 21% 9%
31% 48% 21%
SR BC LR
0% 7% 26%
0% 7% 23%
1% 3% 33%
1% 17% 81%
11% 15% 7%
9% 5% 6%
14% 24% 9%
34% 44% 22%
SR BC LR
6% 16% 11%
3% 9% 18%
3% 7% 26%
12% 32% 55%
15% 20% 4%
15% 14% 3%
10% 11% 7%
40% 45% 14%
SR 0% BC 6% LR 29% 1919-2004 except 1941-1950 SR 2% BC 14% LR 22% 1919-2004 SR 1% BC 10% LR 20%
0% 5% 23%
0% 5% 31%
1% 16% 83%
10% 13% 7%
12% 16% 7%
12% 16% 7%
34% 45% 21%
2% 6% 25%
3% 7% 20%
7% 27% 66%
12% 23% 6%
12% 8% 6%
13% 15% 5%
37% 46% 17%
2% 5% 23%
2% 9% 28%
5% 24% 70%
9% 15% 5%
9% 10% 7%
18% 22% 5%
36% 47% 17%
1940-1950
1951-1965
1966-1985
1986-2004
Table 6: Decomposition of Variance of GDP Growth by Frequency, 1919-2004
23
PR
Endogenous M
CR
all
PR
Exogenous M
CR
all
1919-1939 SR BC LR
4% 7% 21%
3% 11% 23%
4% 11% 17%
10% 29% 61%
4% 6% 24%
4% 10% 28%
4% 12% 8%
12% 28% 60%
SR BC LR
1% 2% 31%
1% 2% 19%
0% 1% 43%
2% 5% 93%
1% 4% 28%
1% 2% 10%
1% 4% 48%
4% 10% 87%
SR BC LR
2% 8% 23%
2% 9% 24%
4% 7% 22%
8% 24% 68%
2% 7% 27%
2% 5% 25%
2% 7% 24%
6% 19% 75%
SR BC LR
2% 4% 9%
2% 8% 29%
2% 6% 38%
6% 18% 76%
2% 6% 21%
2% 4% 25%
2% 7% 32%
6% 17% 78%
SR 1% BC 1% LR 24% 1919-2004 except 1941-1950 SR 2% BC 4% LR 18% 1919-2004 SR 2% BC 4% LR 22%
2% 6% 29%
2% 6% 30%
4% 13% 83%
2% 2% 27%
2% 6% 26%
1% 6% 29%
4% 14% 82%
2% 8% 35%
2% 7% 22%
6% 19% 75%
2% 3% 15%
2% 6% 39%
2% 8% 23%
5% 17% 78%
2% 6% 35%
1% 5% 23%
5% 15% 80%
2% 4% 25%
2% 6% 34%
2% 9% 16%
6% 19% 75%
1940-1950
1951-1965
1966-1985
1986-2004
Table 7: Decomposition of Variance of Velocity by Frequency, 1919-2004
24
the shorter run frequencies, leaving the in‡ation tax e¤ect on growth for the long run frequency. A complementary story emerges from the credit shock. It contributes remarkably its lowest e¤ect on short run GDP volatility during the 19862004 period, of 0.3% (less than one percent), even when its contribution to velocity changes was at its highest. It also has a very mild contribution to SR GDP volatility during 1950-1965. Its highest contribution to SR GDP volatility is during 1919-1939, of 5%. Further, the frequency e¤ects of the money and credit shocks are also re‡ected in the velocity results. The SR and BC e¤ects of each money and credit on velocity were stronger in the 1919-1939 subperiod than in any of the other subperiods. The Great Depression SR GDP volatility is the result of a "bad" credit shock, of the Friedman and Schwartz (1963a) and Bernanke and Blinder (1988) variety. The only other time the SR credit contribution to GDP volatility exceeded one percent was during the 1966-1986 subperiod when, at 3%, credit was constrained during a high in‡ation, before deregulation. When the e¤ects of credit on SR GDP volatility were all low, below one percent, these were the calm periods of 1951-1965 and 1986-2004. These periods simultaneously saw the e¤ect of credit on LR GDP volatility at its highest (except WWII): above 30%. These were the "good" credit shocks. The e¤ects of the credit shock on BC GDP volatility was only 3-5% during the two calm periods of good credit shocks, their lowest amounts. But during the 1919-1939, the BC contribution was its highest, more than double at 12%; and during the 1966-1986 period, its BC contribution to GDP volatility was second highest above 7%. These were times of the "bad" credit shocks. So a clear pattern does emerge. Money and credit had their biggest e¤ects on short run and business cycle GDP volatility when times, and shocks, were bad. The bad money shocks were the unexpected changes in in‡ation and high expected changes; the bad credit shocks were the repression of the credit sector. Money and credit had their biggest e¤ects on the long run GDP volatility when times, and shocks, were good. This is when in‡ation could be predicted well and credit was free to provide in‡ation avoidance services.
25
4.3
The WWII Period
Looking at the movement of the credit shock during WWII, it is apparent that it alone can explain the great GDP volatility at this time. This is veri…ed by looking at the …rst moment contribution of the shocks to GDP during 1940-1950, where in Figure 9 the credit shocks were positively contributing to the actual positive output growth variation while the goods productivity went in the opposite, negative, direction. The variance decomposition shows that credit contributed 43% of the total GDP variation, in the LR spectrum during this period. So this is not classi…ed as a short run or business cycle e¤ect. Iincluding the WWII period by using the whole period of 1919-2004, Table (4) shows that the contribution of the goods productivity shock to GDP variation drops remarkably, from 48% to 18%, while credit and money shocks become more important. As compared to Table 5, there is also about half the contribution of productivity shocks to velocity variation, as compared to the whole period excluding 1941-1950. The marked e¤ect of the credit shock during the war period can be interpreted in terms of the War e¤ort to raise government …nance through the sales of government bonds. This is a type of subsidization of credit use that is speci…c to the war period.
5
Discussion
5.1
Consumption Smoothing
The Jermann and Quadrini (2006) interpretation that …nance enables a greater smoothing of consumption is certainly attactive. And the development of such instruments, the completing of more inter-state markets, would certainly act in that way and even produce positive shocks on GDP, as we found for the US deregulatory period, in Benk, Gillman, and Kejak (2005b).4 However the possibility of non-Jermann and Quadrini (2006) 4
There were some exceptions; an example of a negative credit shock given by Benk et al (2005b) was the 1986 law ending the trading of general partner unlimited liabilities to
26
shocks are also possible, ones that cause negative e¤ects on GDP, and that increase its volatility; such shocks are the ones Bernanke and Blinder (1988) emphasizes. The existence of these during the Great Depression, as occured with the collapse of the banking sector, as opposed to the freeing up of …nance at the peak of the Great In‡ation, helps explain why credit shocks had a bigger e¤ect on GDP during the Great Depression than in the Great Moderation, and why velocity and money volatility together bifurcated from GDP and in‡ation volatility during the Great Moderation and after. The deregulation period was one of expanding the spanning of the …nancial instruments across uncertain states that allowed for a positive expansion of credit, rather than the collapse that occured in the Great Depression, that facilitated an avoidance of changes in the in‡ation tax and of the GDP instability that such changing in‡ation taxes can cause. Figure 11 focuses on how the credit and GDP volatilities moved together everywhere except especially in 1927-1938, and in 1981-2004. While repressed in the Great Depression, GDP volatility went way up. And when deregulation begain in 1981, credit volatility rose while GDP volatility fell. Or in terms of the average volatilty levels post-1983, consider that during 1972-1982, they were 1.9% for credit and 2.7% for GDP growth, while for 1983-2004, credit volatility nearly doubled to 3.4% while GDP was nearly halved to 1.5%. Thus greater consumption smoothing was allowed as opposed to less consumption smoothing in the Great Depression. The high velocity and money volatility after 1983 re‡ected the rise of these credit instruments. In particular, money market accounts, at both investment banks and commercial banks, allowed interest to be earned; writing checks on these accounts meant the ability to use credit cards during the exchange period while earning nearly full government bond interest rates. This credit became the source of interest-earning means of exchange that were used in a way unprecedented in magnitude compared to earlier periods. Money aggregates like M1 include limited partners that lead to tax-based increases in real-estate investment trusts (REITS); this is linked to the subsequent collapse of the savings and loans sector heavily invested is such REITS.
27
14.0% 12.0% 10.0% 8.0% 6.0% 4.0% 2.0%
Volatility(GDP)
2003
1999
1995
1991
1987
1983
1979
1975
1971
1967
1963
1959
1955
1951
1947
1943
1939
1935
1931
1927
1923
1919
0.0%
Volatility(Credit)
Figure 11: Volatilities of GDP and the Credit Shock, 1919-2004
some of these interest bearing accounts and so their expanded use simply represents more exchange funds also being used as part of intertemporal …nance, at the low end of the term structure. The con‡uence of exchange and intertemporal credit can explain the preference for short maturities, as is modeled in Bansal and Coleman (1996) and Canzoneri and Diba (2005). Therefore, the increased volatility of this money, but not of in‡ation or GDP, combined with the variance of decomposition analysis, suggests that these …nancial instruments were providing both exchange and intertemporal functions that allowed for greater consumption smoothing even while in‡ation levels fell. The private money volatility was increased post 1983, the creditbased money created by the …nance sector, that both Friedman and Schwartz (1963b) and Bernanke and Blinder (1988) emphasize.
5.2
Related VAR Findings
Focusing on long run persistence within time-varying VAR evidence, Cogley and Sargent (2005) …nd that money supply changes can explain the reduced in‡ation and unemployment (rather than output) volatility seen since 1983. This is the view that policy rather than luck led to changes in in‡ation rates. This is consistent with the …ndings here except that we also focus how the 28
credit component of the money supply has remained volatile, as re‡ected in velocity volatility. Taking the short run point of view that money supply shocks can only a¤ect output and in‡ation through the liquidity e¤ect, as in the IS-LM analysis, Canova and Gambetti (2004) for 1978-2003 …nd that structural changes occured in the economy from the 1980s onwards but that monetary policy does not explain the Great Moderation; they also argue related themes in a series of papers. Here they construct a time varying VAR, using output instead of unemployment in comparison to Cogley and Sargent (2005) (with four other variables: in‡ation, nominal interest rates and the nominal money stock), and restrict the impulse responses to only VAR evidence in which there is a liquidity e¤ect on money supply shocks over the last 6 periods. The in‡ation and output equations show the time varying coe¢ cients indicating structural change, as does the money supply equation, but the money supply and output equations show more variation than the in‡ation equation. On the basis of these di¤ering magnitudes of the degree to which the money and output coe¢ cients move more than the in‡ation coe¢ cients, and the lack of synchronicity in the coe¢ cient time variations, Canova and Gambetti argue that monetary policy does not explain the decreased output volatility. The time varying VAR …ndings of both Cogley and Sargent (2005) and Canova and Gambetti (2004) support our analysis that the behavior of these aggregates shows less volatility after …nancial deregulation. However while Canova and Gambetti (2004) restrict their impulse analysis to only liquidity e¤ects and zero out all long run e¤ects, our model is one of long run features that can be well-applied to historical analysis. In particular, money-induced in‡ation causes lower GDP growth in our model, and this is ruled out in Canova and Gambetti (2004) impulse responses. Further we explain why the M1 money supply growth rate shows variation that departs from the in‡ation and GDP growth paths, as based on increased credit contributions to velocity volatility. This makes the M1 growth rate volatility consistent with lower in‡ation and GDP volatility in our model. Further, other results cast doubt on the importance of the liquidity effect at times when it is not a largely unexpected acceleration or decelera29
tion in in‡ation. Thornton (2006) …nds that the measured liquidity e¤ect is of very small magnitude. Relatedly the work of Cochrane and Piszzesi (2002) stress that only the unexpected changes in Federal Reserve interest rate cause shocks to monetary policy; expected interest rate changes do not cause monetary policy shocks. Taking these literature strands together, large and variable money supply growth rate changes could cause liquidity e¤ects and monetary policy shocks that are important, and that add to the volatility of in‡ation and output. These translate into times when the money shock in our model has a stronger short run and business cycle e¤ect. But our results show that the money shocks still cause important long run e¤ects, especially in the post-1986 subperiod of our variance decomposition, which identi…cation strategies cannot omit without underestimating the impact of money shocks during such periods.
6
Conclusion
We …nd …rst that most of the GDP volatility occurs in the LR frequency when using the baseline endogenous growth economy, while in contrast the exogenous growth framework forces this mainly into the SR and BC frequencies. Productivity shocks explain only 14% of GDP volatility for the 1919-2004 period excluding WWII (1941-1950), although these shocks are typically the main story in even the most advanced standard business cycle analysis (Chari, Kehoe, and McGrattan 2007). While we hope that this provokes quali…cation of restricting analysis to only business cycle frequencies, this di¤erence of endogenous and exogenous growth sets the scene for the primary contribution of the paper. We explain both the Great Depression and the Great In‡ation/Great Moderation periods using a set of tools that is able to contrast somewhat starkly these two periods of great volatility swings. The paper presents the historical trends in which velocity volatility diverges from GDP volatility post-1983 but move together 1919-1939, while in‡ation and GDP volatility moved together all the time except WWII. And then for analysis of these trends, we determine the contribution of the model’s shocks to both …rst and 30
second moments of GDP and velocity, across the frequencies and subperiods. The results are that both money and credit shocks have distinct behavior across the two periods; this provides the basis of the paper’s explanation of the di¤erence in the two great volatility swings. We use a good shock - bad shock characterization for this. Money shocks a¤ect more the SR and less the LR in both the Great Depression (1919-1939) and the Great In‡ation (1965-1985) subperiods. We interpret this as being the result of the unexpected deceleration and acceleration of in‡ation during these times. These we consider the "bad" money shocks, in that at these times the sum of the SR and BC frequency e¤ects on GDP are more than double those during the other subperiods; this means there is more than double the short and medium run volatility from the money shock source. During other periods the "good" money shocks have exactly zero contribution to SR frequency variation in GDP, but a strong contribution to long run volatility through their e¤ect on the growth rate despite having little e¤ect on the …rst moment: the level of GDP growth. Credit shocks likewise a¤ect more the SR and BC frequencies and less the LR during the Great Depression and Great In‡ation subperiods, and so these are the "bad" credit shocks. But, in contrast to the bad money shocks which are perfectly symmetric in these two subperiods, the bad credit shocks have asymmetric e¤ects. During the Great Depression the SR and BC credit e¤ects are more than three times the magnitude during the other subperiods, while during the Great In‡ation only double that of the other two subperiods. We interrpret this as times when the credit was repressed: more severely from the …nancial collapse in the Great Depression and less so from the binding credit restrictions during the rise of the Great In‡ation. So we explain the two great volatility movements as having rather similar bad money and credit shocks that contribute to greater SR and BC GDP growth volatility. And the di¤erence between the two great movements is that the signi…cant "good" credit volatility after 1983 allowed the money supply volatilities to be neutralized, so that GDP volatility could decline. The credit apparently acted as an tax-escape valve that blew o¤ the velocity steam that would otherwise have increased GDP volatility, as it did in the 31
1919-1939 period. The break in the Friedman and Schwartz (1963b) moneyincome causality was allowed post-1983 because of a Jermann and Quadrini (2006) type ability to smooth consumption even as money elements were volatile. This did not happen in the Great Depression when the credit valve was not operating well.
A A.1
Appendix Construction of Shocks
Based on the solution of the model from section 2, the log-deviations of the ~ z; u; v). By model variables be written as linear functions of the state s = (b k;
stacking the equations, the solution can be written in matrix form as follows: i h i0 h b ~ (24) Xt = A k t + B zt ut vt ; h
i0 ^ ^ b where X = c~ x^ l n ^ f s^G a ^ . From (24), one can construct the solution of any variable of the model, by forming the appropriate linear com-
bination of the appropriate rows of (24), the linear combinations being given by the linearized versions of equations (3)-(10). Given the model solution h (24) (thatiis, knowing the value of matrices A and B), the series of shocks zt ut vt can be constructed by using data on X and b k~ and "solving" the system of linear equations (24). It can be easily t
t
seen, that in order to identify the three series of shocks, we need data on at least three variables from Xt . In a three-variable case the shocks represents
the solution of a system of three linear equation. If more that three variables are used, then the shocks are "overidenti…ed" as we have more equations than unknowns. In such a case we apply a least-square procedure as we illustrate below. In the procedure of constructing the shocks, we employ the variables on which we were able to …nd reliable data. We construct stationary variables c=y, i=y and m=y, and on which we use data to construct the shocks. We also use data on labor hour in banking sector f . and on the wage rate in banking - the latter series being used as a proxy for the marginal product 32
of labor in banking (mplb). The data series on b k~ (k~ = k=h) is constructed by using for k the capital accumulation equation (4), data on investment to compute b~{t and the initial condition b k~ 1 = 0. For human capital, because
of a lack of a series going back to 1919, we use a smooth trend, as data in Jorgenson and Stiroh (2000) for 1959-1998 indicates. c i=y, c m=y, d f^ and mplb, d we set up a ~ c=y, Having the data series on b k,
system of linear equations:
XXt = AA
h
b k~t
i
+ BB
h
zt ut vt
i0
;
(25)
i0 c c d b d where XX = c=y i=y m=y f mplb and the rows of the matrices AA and BB result from the linear combinations of the corresponding rows h
of matrices A and B, the appropriate linear combinations being given by the linear equations that de…ne the variables from XX as functions of the variables from X. The marginal product of labor in banking, is derived from equation (8), while the de…nition of the other terms of the matrix XX is straightforward. The least square "estimates" for the shock series are computed as follows: h i0 i h 0 1 0 b ~ est zt ut vt = (BB BB) BB (XXt AA k t ): t
In this approach we used …ve variables to construct the economy’s three
shocks. To test for the robustness of the process of shock construction, we repeated the computation by using combinations of …ve variables taken four at a time, and …ve taken three at a time, allowing for …fteen more possible ways to construct the shocks. Figure ?? graphs seven of the computed credit shock series of these along with the baseline of …ve variables. The results show that all combinations that include m=y, either c=y or i=y, and either f or mplb generate nearly the same shock series, while other combinations (not graphed) show randomness and lack of conformity. Thus, we found that the results are robust as long as the variables are included that correspond to the model’s three sectors in which the three shocks occur.
33
40.0%
30.0%
20.0%
10.0%
0.0%
-10.0%
-20.0%
c/y, i/y, mplb, f, m/y
i/y, mplb, f, m/y
c/y, i/y, f, m/y
c/y, i/y, mplb, m/y
i/y, f, m/y
2003
1999
1995
1991
1987
1983
1979
1975
1971
1967
1963
1959
1955
1951
1947
1943
1939
1935
1931
1927
1923
1919
-30.0%
i/y, mplb, m/y
Figure 12: Credit Shocks Constructed with Various Combinations of the Five Variables, 1919-2004
A.2
Data Sources
Data used in the paper has been constructed on annual frequency, for the 1919 - 2004 time period. The main data sources were the Bureau of Economic Analysis (BEA) and the IMF International Financial Statistics (IFS). Series have been extended backwards until 1919 based on the series published in Kuznets (1941), Friedman and Schwartz (1963a) (F&S) and the online NBER Macrohistory Database (http://www.nber.org/databases/macrohistory/contents/) (NBER). The data series are as follows: Gross Domestic Product (BEA, Kuznets) Consumer Price Index (BEA, F&S) Price Index for Gross Domestic Product (BEA, Kuznets) Personal Consumption expenditures (BEA, Kuznets) Gross private domestic investment (BEA, Kuznets) Wage and salary accruals (BEA, Kuznets) Wage and salary accruals, Finance, insurance, and real estate (BEA, Kuznets) Full-time equivalent employees (BEA, Kuznets)
34
Full-time equivalent employees, Finance, insurance, and real estate (BEA, Kuznets) M0 (IFS, NBER) M1 (IFS, NBER) M2.(IFS, NBER) Treasury Bill rate (IFS, NBER)
References Bansal, R., and W. J. Coleman (1996): “A Monetary Explanation of the Equity Premium, Term Premium, and Risk-Free Rate Puzzles,” Journal of Political Economy, 104(6), 1135–1171. Benk, S., M. Gillman, and M. Kejak (2005a): “A Comparison of Exchange Economies Within a Monetary Business Cycle,” The Manchester School, 73(4), 542–562. (2005b): “Credit Shocks in the Financial Deregulatory Era: Not the Usual Suspects,”Review of Economic Dynamics, 8(3), 668–687. (2007): “Money Velocity in an Endogenous Growth Business Cycle with Credit Shocks,” Journal of Money, Credit, and Banking, Forthcoming. Bernanke, B. S., and A. S. Blinder (1988): “Credit, Money, and Aggregate Demand,”American Economic Review, 78(2), 435–39. Canova, F., and L. Gambetti (2004): “On the Time Variations of US Monetary Policy: Who is Right?,” Conference paper, Money Macro and Finance (MMF) Research Group. Canzoneri, M., and B. Diba (2005): “Interest Rate Rules and Price Determinacy: The Role of Transactions Services of Bonds,” Journal of Monetary Economics, 52(2), 329–344.
35
Chari, V. V., P. J. Kehoe, and E. R. McGrattan (2007): “Business Cycle Accounting,”Econometrica, 75(3), 781–836. Christiano, L. J., and T. J. Fitzgerald (2003): “The Band Pass Filter,”International Economic Review, 44(2), 435–465. Clark, J. A. (1984): “Estimation of Economies of Scale in Banking Using a Generalized Functional Form,”Journal of Money, Credit, and Banking, 16(1), 53–68. Cochrane, J., and M. Piszzesi (2002): “The Fed and Interest Rates–A High-Frequency Identi…cation,”American Economic Review, 92(2), 90–95, Conference Proceedings. Cogley, T., and T. J. Sargent (2005): “Drift and Volatilities: Monetary Policies and Outcomes in the Post WWII U.S.,”Review of Economic Dynamics, 8(2), 262–302. Cooley, T. F., and G. D. Hansen (1995): “Money and the Business Cycle,”in Frontiers of Business Cycle Research, ed. by T. F. Cooley, chap. 7, pp. 175–216. Princeton University Press, Princeton. Friedman, M., and A. J. Schwartz (1963a): A Monetary History of the United States, 1867-1960. Princeton University Press, Princeton, NJ. (1963b): “Money and Business Cycles,” Review of Economics and Statistics, 45, 32–64. Gillman, M., M. Harris, and L. Matyas (2004): “In‡ation and Growth: Explaining a Negative E¤ect,” Empirical Economics, 29(1), 149–167, Reprinted in Baltagi, Badi H (Ed), 2004, Studies in Empirical Economics, "Panel Data: Theory and Applications", Physica-Verlag. Gillman, M., M. N. Harris, and M. Kejak (2006): “The Interaction of In‡ation and Financial Development with Endogenous Growth,” working paper.
36
Gillman, M., and M. Kejak (2005): “In‡ation and Balanced-Path Growth with Alternative Payment Mechanisms,” Economic Journal, 115(500), 247–270. Hancock, D. (1985): “The Financial Firm: Production with Monetary and Nonmonetary Goods,”Journal of Political Economy, 93(5), 859–880. Hartley, J., S. Sheffrin, and K. Salyer (1997): “Calibration and Real Business Cycle Models: An Unorthodox Experiment,” Journal of Macroeconomics, 19(1), 1–17. Ingram, B., N. Kocherlakota, and N. Savin (1994): “Explaining Business Cycles: A Multiple-Shock Approach,”Journal of Monetary Economics, 34, 415–428. Jermann, U. J., and V. Quadrini (2006): “Financial Innovations and Macroeconomic Volatility,”NBER Working Papers 12308, NBER. Jorgenson, D. W., and K. J. Stiroh (2000): “Raising the Speed Limit: U.S. Economic Growth in the Information Age,” OECD Economics Department Working Papers 261, OECD. Kehoe, T. J., and E. C. Prescott (2002): “Great Depressions of the Twentieth Century,”Review of Economic Dynamics, 5(1), 1–18. King, R. G., and S. Rebelo (1990): “Public Policy and Economic Growth: Developing Neoclassical Implications,”Journal of Political Economy, 98(5), S126–50. Kuznets, S. (1941): National Income and its Composition, 1919-1938. National Bureau of Economic Research, New York. Levy, D., and H. Dezhbakhsh (2003): “On the Typical Spectral Shape of an Economic Variable,”Applied Economics Letters, 10(7), 417–423. Lucas, Jr., R. E. (1988): “On the Mechanics of Economic Development,” Journal of Monetary Economics, 22, 3–42.
37
Parkin, M. (1988): “A Method for Determining Whether Parameters in Aggregative Models are Structural,”Carnegie-Rochester Conference Series on Public Policy, 29, 215–252. Thornton, D. L. (2006): “The Daily Liquidity E¤ect,” Working Papers 2006-020, Federal Reserve Bank of St. Louis. Tobin, J. (1965): “Money and Economic Growth,” Econometrica, 33(4, part 2), 671–684.
38