illustration is constructed of text plus two lenses makes it. easier to edit ... The Magic Lenses logo. Lenses can ..... first approach, the application is responsible for creating, .... is a trademark of Adobe Systems, Inc. UNIX is a trademark of. AT&T.
The Movable Filter as a User Interface Tool Maureen C. Stone, Ken Fishkin, Eric A. Bier Xerox PARC, 3333 Coyote Hill Rd., Palo Alto CA 94304 E-mail: {stone, fishkin, bier}@parc.xerox.com
ABSTRACT
Magic Lens filters are a new user interface tool that combine an arbitrarily-shaped region with an operator that changes the view of objects viewed through that region. These tools can be interactively positioned over on-screen applications much as a magnifying glass is moved over a newspaper. They can be used to help the user understand various types of information, from text documents to scientific visualizations. Because these filters are movable and apply to only part of the screen, they have a number of advantages over traditional windowwide viewing modes: they employ an attractive metaphor based on physical lenses, show a modified view in the context of the original view, limit clutter to a small region, allow easy construction of visual macros and provide a uniform paradigm that can be extended across different types of information and applications. This paper describes these advantages in more detail and illustrates them with examples of magic lens filters in use over a variety of applications. CR Categories and Subject Descriptors: I.3.6 [Computer Graphics]: Methodology and Techniques—interaction techniques; H.5.2 [Information Interfaces and Presentation]: User Interfaces—interaction styles; I.3.3 [Computer Graphics]: Picture/Image Generation—viewing algorithms; I.3.4 [Computer Graphics]: Graphics Utilities— graphics editors Key Words: viewing filter, lens, transparent, visualization, editing, macro, graphics INTRODUCTION
In many applications, users are faced with the problem of quickly exploring and modifying data through a graphical user interface. In this paper, we present a new type of tool for this task, called the magic lens filter. A magic lens filter is a movable, arbitrarily shaped region plus a filter that affects the appearance of structures viewed through it. This operator can be quite general, accessing the underlying data structures of the application and reformatting the information to generate a modified view. Overlapping lenses compose their filters, providing a direct-manipulation way to produce customized views. Magic lens filters can be combined with click-through tools, spatially bounded regions that modify input directed through the region. Magic lens filters and click-through tools have been previously introduced as components of the SeeThrough Interface system[5]. This paper will focus on the
use of magic lens filters as a tool for exploring and modifying information. We present a wider range of examples in this domain than previously published, and emphasize the specific advantages of lenses as a user interface tool beyond their use in the see-through interface. Magic lens filters have a number of potential advantages over traditional methods of generating alternate views and filtering information. Binding the filter to a spatially bounded, movable region creates an easily understood user model based on experience with physical lenses. Limiting the view to a local region preserves context and can reduce clutter. Lenses can be parameterized, and can have arbitrary shape. The user can position different filters simultaneously over different parts of the displayed information to get multiple, simultaneous views. Lenses that overlap compose their effects, making it easy to create visual macros. These macros can be temporary, or can be “welded together to create a compound lens that encapsulates a set of filters and parameters. Finally, the magic lens metaphor can be used uniformly across applications. Magic lens filters perform a wide variety of operations that are currently performed by other user interface techniques, including: modifying the way a picture or solid model is rendered on the screen (e.g., wireframe versus shaded), querying application state (e.g., what font is this?), querying a database, activating alignment aids (e.g., turn on the grid), or identifying a region of interest (e.g., identifying the rectangular region of a VLSI drawing to work on next). By unifying these operations into a single technique, magic lens filters can reduce the time needed for users to learn to use a system and increase the consistency of the user interface. Users will more quickly learn to use new applications because familiar lenses can be applied to them. Conversely, programmers can add functionality to many applications at once by implementing a new filter. The lens metaphor provides a rich set of useful interface tools. We have only begun to explore this area. Two exploratory implementations exist within the Cedar programming environment [20], which runs on SunOS; one focuses on graphical editing, using the Multi-Device Multi-User MultiEditor (MMM) framework [6], and the other uses lenses for visualizing structure in text documents. A third implementation focused on visualizing maps is implemented in C++ in the X window system [16].
After describing the basic principles of operation of lenses, we describe in more detail each of the advantages their use Movable Filter as a User Interface Tool. Proceedings of CHI ’94, provides, illustrated with examples. Further sections then (Boston, MA, April 24-28) ACM, New York, (1994), pp. 306-312. describe the implementation, discuss related work, and present our conclusions and plans for future work.
Publishedas:MaureenC.Stone,KenFishkin,EricA.Bier. The
PRINCIPLES OF OPERATION
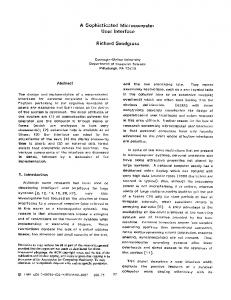
The basic operation of a magic lens filter is to read an underlying model of some data, create a new model based on the lens viewing operation, and format the new model to present a new view of the data within the lens boundary or viewing region. The viewing region selects a portion of the model to operate on, called the input region. The size and shape of the input region is defined by the viewing region together with the viewing operation. It may be the same size as the input region, or different, as in a magnification lens. For a 3D model, the input region is a cone-shaped volume defined by the eye point and the viewing region. Overlapping two lenses composes their functions in bottom to top order. There are several ways to implement composition [5]. For this paper, we assume that lenses compose by copying and modifying a sequence of models. The model output by the lower lens is the input to the upper lens. In this context, model is defined quite broadly, including both data structures and application state. Furthermore, a model may incorporate a variety of data types from a variety of applications. For example, if a lens lies atop three other lenses and two applications, it receives input from five sources. Many types of lenses are more effective if they can be parameterized by the user. For example, a magnification lens may have a slider along its edge, through which the user may change the magnification factor. To illustrate the operation of magic lens filters, figure 1 shows two lenses for viewing a text document where each paragraph and character can have attached properties that affect the documents’ appearance. Therefore, a specific appearance can be generated in a number of ways. For example, the word “Selection may appear in a bold typeface because the paragraph style indicates it, or because there are “boldface properties attached to the characters. In the figure, the upper lens boxes all characters that have properties attached, making it easy to see that the word “Selection has none, unlike the words “MIDDLE and “RIGHT below. The lower lens marks whitespace with its underlying representation. Spaces are marked with small dots while tabs are marked with small arrows, similar to the global mode in Microsoft Word. Applying this operation locally reduces the visual clutter. The lenses overlap, showing composition of their effects.
we feel they best illustrate. These figures are intended to emphasize the functionality of these examples as opposed to the visual aspects of their design. There are many different and better designs for these examples, especially as we have deliberately avoided using color to accommodate the limitations of these proceedings. Most of the illustrations in this section are snapshots of actual implemented examples, although the map examples have been touched-up slightly with a graphics editor to improve the presentation. Figures 1, 3, 4 and 15 are illustrations of straightforward extensions to the existing text and graphical editing implementations. The examples in figures 9 and 16 require access to external databases. We have not implemented this type of tool, although we believe they would be straightforward to produce. Local Views
A common problem in applying viewing operations to data is restricting the area of effect for that operation to a “selected region or “region of interest . Since all magic lens filters have a restricted region of operation, the “region of interest becomes a special case of the lens metaphor. Some of the advantages of local views as implemented by magic lens filters are described in this section. Details in context Magic lens filters can show detail within a restricted region without losing the context provided outside the region. For example, figure 2 shows a map of the major roads in a section of Santa Clara county created from the TIGER/Line format provided by the U.S. Census Bureau [8]. The lens shows all of the roads in its region.
Selection The mouse has three buttons named LEFT, and RIGHT corresponding to their physical layout. Here are the selection commands for .each .button: LEFT select .point MIDDLE select .shape MIDDLE ,
RIGHT
extend selection
Figure 1. The upper lens highlights text with properties and the lower lens shows the representation of whitespace. EXAMPLES
In this section, we provide examples that illustrate the use of lenses as a user interface tool. The examples are grouped into categories based on the advantages provided by their use. Most lenses incorporate more than one of these advantages so we have placed our sample lenses within whichever category
Figure 2. A lens that provides a more detailed roadmap.
Reduce clutter As a lens affects only a local area, its filter can generate a view that would be too cluttered if applied globally. For example, consider figure 3, which shows the font associated with each text string. It is difficult to position the labels without obscuring the underlying text, and it is difficult to read the text and labels together. With a bounded region, the layout problem can be simplified. While the static view is difficult to read, such a filter dynamically applied is easy to interpret because the user can easily switch between the filtered and the unfiltered view by moving the lens.
user may select from a small palette of pre-defined shapes, and can resize shapes by dragging the corners or edges.
TimesB 10.0
Selection Times
10.0
named LEFT, The mouse 0.0 three buttons 1has 10 .0 Times Times MIDDLE TimesB , and RIGHT TimesBcorrespondin g to their 8.0 8.0 physical layout. Here are the selection commands for each button: Figure 3. Labels to identify the font in a text document. The underlying text is from figure 1.
Figure 4 also shows the advantage of a locally bounded filter. This lens was designed to visualize the gravity algorithm used in snap-dragging [7]. Each dot indicates a potential cursor position. The line from the dot to the underlying shape indicates the point that would be selected using gravity. Applying this filter globally would be computationally expensive and would lose any context provided by the area colors of shapes.
Figure 5. Lenses showing detail in two different locations.
We have also experimented with shaped lenses for artistic effects. Figure 6 shows the words “Magic Lenses overlaid by a magnification lens and a lens that shows a wireframe view. In this situation, the lenses are intended to remain as a permanent part of the scene. However, the fact that the illustration is constructed of text plus two lenses makes it easier to edit the text than if the text geometry had been modified to produce the lens effects.
Figure 4. Gravity algorithm debugging lens. Lines show where cursor positions will snap.
Other clutter-reducing lenses are magnification lenses or fisheye lenses that increase the amount of detail as well as increasing the size of the view. Such a lens could control the zooming feature of Pad [15] that makes it possible, for example, to read notes written “between the lines of a document. Another variation would adjust the level of detail to control access to sensitive information. Multiple simultaneous views Magic lens filters go beyond regions of interest in that there may be several of them active simultaneously, possibly showing different effects. Figure 5 shows two lenses positioned over an application showing map data. Each shows local detail. Such a map would be useful for illustrating how to get from one location to another. Multiple lenses need not be of the same type. For example, a user who wishes to copy an object from one part of a document to another could have a magnification lens over the current object location to help in selection, and a grid lens over the destination location to help in placement. Queries have a built-in geometric attribute The input region of a lens serves as a built-in geometric attribute, allowing the user to specify an operand for an operation, the operation, and the output region for that operation simultaneously. For example, the user could position a lens over a portion of a map and show only roads that cross the lens boundary. As the lens region influences the query, the user may wish to alter the lens shape to further tune the query. To extend the above example, the user may wish to only show roads which exit an irregularly shaped housing subdivision. Accordingly, lenses can be sized and shaped to refine their semantics. We have implemented lenses that can be arbitrarily shaped, although we have not yet provided a general, interactive user interface for controlling shape; the
Figure 6. The Magic Lenses logo.
Lenses can be included as a semi-permanent part of the presentation in domains other than graphics. One common use of data visualization systems is to make illustrations of the data (e.g. exploded or wire-frame views). Carefully shaped lenses can be used to create these illustrations. These illustrations can be displayed statically (e.g. printed), or presented interactively. Coordinated Alternate Views
There are many ways to display complex information. Traditionally these display modes are applied either globally or to the current selection. In the latter case, theTool new view is often displayed in a second window. Magic lens filters can be used to encapsulate these modes in movable regions, making it easier to coordinate the different views. For example, a lens could be used in two-view editing systems such as Juno [13] or Tweedle [1] or two-view user interface editors [2] to visualize one representation in the context of the other. Magic lens filters can also be used as a debugging tool for programs that display data by displaying a textual description of the data. The text may be either the original representation or an intermediate form designed for debugging. Figure 7 shows a lens that displays the description of a selected segment of road.
In a hypertext system [14], lenses could be used to highlight links and enable their operation. This provides a solution to the visual clutter caused by making the links always visible. Lenses could also be used to activate the links. In this case, the lens could display either the attributes or contents of the destination node. Visual Macros Figure 7. The lens shows the text tags for the indicated segment of road.
In applications such as astronomy, medical imaging, comparative cartography and structural analysis, multiple images of the same object are compared to evaluate different characteristics of the object. Magic lens filters can be used to provide coordinated views of these images. Figure 8 shows a pseudo-color view indicating the sign and relative magnitude of curvature in the context of a shaded view of a 3D object.
If two lenses overlap one another, their effects compose in the area of intersection. For example, if a lens filters a database for certain characteristics then the ability to overlap and compose lenses provides a way to incrementally and visually construct complex database queries by direct manipulation. The advantage of lenses over conventional methods of defining these queries is their visual nature. The resulting visual macro can then be saved as a compound lens. For example, figure 10 contains two lenses, one which emphasizes water, and another which emphasizes major roads. In their area of overlap, they emphasize both.
Figure 8. Gaussian curvature pseudo-color lens. (Original images courtesy of Steve Mann)
Another example of alternate views that benefit by being shown in context is views that display temporal changes. For example, a lens could be used to show a region of a map as a function of time, making it easy to compare the current geography with that of ten years ago. Similarly, a lens could be used to show previous versions of text in an edited document. Lenses could be placed over a video frame in a video exploration application [12], each showing part of that frame at some temporal displacement. An alternate view may provide a link to a separate but related object in a different model. For example, figure 9 shows a lens that displays the definition of the word selected through it. The lens starts out transparent and at any convenient size. The user clicks through the lens to select a word. The lens then resizes itself to display the definition underneath the line containing the selection, as shown in the figure. The original line of text is visible, but the text under the definition is obscured. Selection The mouse has three buttons named LEFT, and RIGHT corresponding to their physical layout. Here are the selection commands comm for each button: se|lec|tion n. 1. a. The act of selecting or
Figure 10. Composing lenses to show waterways (dashed lines) and major roads (bold lines). Safe Exploration
Magic lens filters allow users to preview changes to a model, and to explore different views of that model without destroying or modifying the underlying data. For example, the lens in Figure 11 reverses the depth order of objects in a 2.5D graphical editor. Under the lens we can see hidden objects while simultaneously seeing the standard presentation outside of the lens. (a)
(b)
MIDDLE ,
the fact of being selected; choosing; choice. b. That which is selected.
Figure 9. A lens displaying the definition of a word selected through it.
Figure 11. (a) An illustration made of layered shapes. (b) The lens shows the shapes in reverse order.
A similar lens positioned over a function call could display the function definition, or the function code itself. One positioned over a bibliographic reference could show the full reference.
Similarly, the lens in Figure 12 scales objects based on their depth. The effect is to provide a 3D perspective view of their relative positions, enabling the user to see around the objects
in front to the ones behind. Because the view changes with the position of the lens, this lens is especially effective in motion. Magic lens filters can also be used to explore true 3D scenes. For example, an exploding parts lens would show an exploded view of the objects viewed through it, or be used in molecular visualization as in the VIEW system [4]. (a)
examples of lenses and click-through tools for editing have been previously published [5]. (a)
(b)
(c)
(b)
Figure 15. The previously deleted bush in front of the house (a) is visible in the lens (b) and can be restored by clicking on it (c). Figure 12. 3D depth filter applied to three overlapping objects. (a) The large rectangle is the filter. (b) The filter moves right, changing the view. Enhance Editing Operations
So far, we have described only the use of magic lens filters to modify output. However, the filter can also be used as part of a click-through tool, which handles input events such as mouse clicks. To use such a tool in our system, the user first positions it over an object of interest with the non-dominant hand using a trackball. Next, the user points at an object visible in the tool’s output region, using a cursor controlled by a mouse in the dominant hand. The tool inverts the effect of the filter to allow the user to select the actual object behind the filter. In addition, the tool may apply an operation to the selected object. In the resulting tool, the filter and input handling work together; the filter provides a customized view that makes it easier to perform the tool’s operation.
Platform for Inter-application Tools
Magic lens filters can be moved from one application to another. As a result, the investment that a user puts into learning to use a filter will pay off in many contexts. Filters that work well across many applications include filters that magnify, change colors, or highlight objects based on graphical properties such as size and color. Filters may also tune their effect based on the specific application in which they are applied. For example, figure 16 illustrates a “highlight schools lens positioned over two different applications. In the map viewer on the left, school buildings are shown shaded, with bold outlines. In the text viewer on the right, words that refer to schools are shaded.
The next Stanford game is Saturday night at home against Colorado, an even bigger challenge than San Jose State. Freshmen outside linebackers Brian Batson and
Click-through tools with magic lens filters can be used to select objects that would otherwise be difficult to select. For example, figure 13 shows a lens that locally shrinks each object to separate coincident edges. A user wishing to select one edge of a particular shape can click through this lens to select the edge unambiguously.
Figure 16. A “highlight schools lens (dashed rectangle) over two different applications.
In addition to providing a consistent interface for performing operations in both of these applications, the lenses allow the user to strongly decouple the conceptual effect of an operation from the implementation of that operation. The “highlight schools operation may be implemented quite differently within the two applications. Figure 13. The local scaling lens. (Tiling by Doug Wyatt)
Figure 14 shows a tool with three lenses that display grids. Clipping the grids to a lens reduces visual clutter. Combining the three grids into one tool makes it easy to switch between them; the user just moves the tool to apply a different grid.
IMPLEMENTATION
In this section, we give a general outline of software architectures that support magic lenses. The architectures vary depending on which types of lens filters they support, and on the lens user interface. Types of Lens Filters
There are three types of lens filters to implement: appearancealtering, application-specific, and multiple-application. Appearance-altering
Figure 14. Three grid lenses.
Figure 15 demonstrates a lens that shows recently deleted objects in a graphical editor: the leftmost shrub, deleted from the scene (a), appears under the lens (b). The user can click through the lens to restore the object to the scene (c). Other
Applications in a graphical environment typically produce their output by a set of procedure calls to a low-level graphics library that draws lines, polygons, circles, text, and so forth. The X server, the Cedar Imager, and the Microsoft Windows GDI are examples of such packages. Filters whose semantics can be expressed as modifications to calls to these primitive drawing procedures can be implemented by extending the
drawing package. A lens is implemented as a monitor which traps or “ambushes drawing calls within a region corresponding to the output region of the lens and alters the graphics calls within that region. For example, a “turn red lens would ambush a “set color command and set its parameter to “red, within the given region. This architecture supports composition by recursively calling the modified display routines.
implementation classes. The Cedar environment has a common address space and data format for all applications and a ubiquitous, easily-modified graphics library, that makes it easy to explore lenses that operate across applications. The Unix/X environment, with its multiple address spaces and standard window manager, has been the testbed for exploring application-specific lenses in the context of a multi-address space window environment.
Such lenses are invisible to applications that move under them; the application(s) need not be modified. However, this architecture does require the modification of a fundamental part of the system, and lenses of this type cannot perform higher-level semantics. For example, the “highlight major roads lens of figure 10 could not be implemented as the concept of a “road is application-specific.
RELATED WORK
Application-specific Lenses can be implemented entirely within a single application, with lens filters unique to it. The application is responsible for computing lens semantics and drawing lens output. Multiple-application The most difficult class of lens to implement is portable across applications, yet has semantics specific to each. The “highlight schools lens of figure 16 is such a lens. Its implementation requires knowledge of the semantics of the data structures within two different applications. The lens semantics can be implemented in two very different ways. If a standard language exists for reading and writing application objects, then the lens filter can be implemented as a single entity. If it is over two applications, it will receive two data models as input, describing two semantically distinct sets of data, but both expressed in the same format. This is similar to what windowing systems presently require of applications which support clipboards, but lenses with more powerful semantics may require a richer object description than that presently found in clipboards. If no such standard language exists, then the lens may be represented to the user as a single lens, but implemented as a set of application-specific lenses, one for each application region over which the lens finds itself. For example, in figure 16 (a lens whose left half is over a map viewer, and whose right half is over a text editor), the left half of the lens would be presented as a lens to the map viewer, and the right half of the lens would be presented as a second lens to the text editor. The parts of the lens which are not over an application must be handled specially. User Interface
The user interface of a lens may either be supported by a specific application, or by the windowing system. With the first approach, the application is responsible for creating, placing and moving the lenses, and determining when lenses must be repainted. Typically, such lenses cannot be moved outside the application boundary. With the second approach, the window system creates, places, and moves the lenses. However, the messages provided by the windowing system must be augmented to incorporate the more complicated semantics required by magic lens filters. Multiple-application lenses require the second approach so that the lens may be moved outside of any particular application. Our current implementations incorporate all of these
The concept of using a filter to change the way information is visualized in a complex system has been introduced before [10, 11, 21]. Recent image processing systems support composition of overlapping filters [18]. However, none of these systems combine the filtered views with the metaphor of a movable viewing lens. The Pad system [15] contains the idea of portals, magnifying glasses that provide access to different parts of the Pad information plane. Portals can also contain filters that modify the view of objects below them, making them similar to magic lens filters. Portals provide similar functionality to some of our lenses, but are presented primarily as a metaphor for navigation in Pad as opposed to a general purpose tool for exploring and modifying information. Other systems provide special-purpose lenses that provide more detailed views in the context. For example, a fisheye lens [9] can enhance the presentation of complicated graphs [17]. The bifocal display provides similar functionality for viewing a large space of documents [19]. The MasPar Profiler uses a tool based on the magnifying lens metaphor to generate more detail (including numerical data) from a graphical display of a program [3]. The VIEW system moves a spherical probe around a molecule, revealing associated state [4]. CONCLUSIONS
Bounded, movable filters can serve many roles in enhancing a user’s interaction with software applications. In particular, these filters can modify rendering style, query application state, display alignment aids and identify regions of interest. By unifying these and other functions into a single user interface paradigm, magic lens filters can increase user interface consistency. In addition, because they can be moved from application to application, these filters provide functionality that can be used in many application contexts, like that of the Copy and Paste keys of many keyboards. Magic lens filters have many advantages over applicationwide viewing modes. They can show local details in the context of larger-scale information, limit clutter to small regions, apply different filters in different places at the same time, and query features locally. Arbitrarily shaped filters can be used to refine queries, create dynamic illustrations, or produce artistic effects. They provide easy customization through visual macros and a way to explore models without modifying them. When combined with click-through tools, they provide enhanced editing operations including views of hidden objects, a reliable way to select objects, and a visual way to switch modes. The direct-manipulation metaphor of physical lenses on overlapping layers seems to significantly enhance the usefulness of these local filters. The combination of user control and the animation inherent in the interactive motion helps the user create the context needed to interpret the potentially complex visualizations produced by these tools.
While we have no formal evidence for this observation, the anecdotal evidence is interesting. People who have seen static pictures find a videotape of the tools in action much easier to understand. Furthermore, we have personally observed that examples which seem confusing when passively viewed on the videotape are easily understood when we are actively operating the system. Magic lens filters are an important part of a new see-through user interface paradigm that allows the user to bring tools to the data instead of loading data into tools. This paper describes some of the benefits to the user of including filters in this kind of interface, and presents examples of useful tools in a number of domains including text editing, debugging, graphical editing, and map visualization. We anticipate that these filters will prove useful in many forms and in many applications beyond those described here. FUTURE WORK
6.
7.
8. 9.
10.
We are working to extend magic lens filters to new problem domains (3D, word processing), to new computing environments (Macintosh, PC), and to extend the quantity and quality of the existing lenses. We also intend to more formally study the effectiveness of these tools by including them in real applications and by performing user studies.
11.
ACKNOWLEDGMENTS
12.
We would like to acknowledge Tony DeRose as one of the original inventors of the magic lens metaphor, Matt Conway for his contributions to the implementation of the map browser application, and the following people for ideas, suggestions and enthusiasm: Andrew Glassner, Jock Mackinlay, Ken Pier and Polle Zellweger.
13.
Trademarks and Patents: Magic Lens and See-Through Interface are trademarks of the Xerox Corporation. Postscript is a trademark of Adobe Systems, Inc. UNIX is a trademark of AT&T. TIGER/Line is a trademark of the Bureau of the Census. Patents related to the concepts discussed in this paper have been applied for by the Xerox Corporation.
14.
REFERENCES
16.
1.
2.
3.
4.
5.
Paul Asente, Editing Graphical Objects Using Procedural Representations, Stanford University Ph.D. dissertation, 1987. Gideon Avrahami, Kenneth P. Brooks, and Marc H. Brown. A two-view approach to constructing user interfaces. Proceedings of Siggraph ’89 (Boston, MA, July), Computer Graphics Annual Conference Series, ACM, 1989, pp. 137-146. Kent Beck, Jon Becher, and Liu Zaide. Integrating profiling into debugging. Proceedings of the 1991 International Conference on Parallel Processing, Vol. II, Software, August 1991, pp. II-284-II-285. Lawrence D. Bergmen, Jane S. Richardson, David C. Richardson, and Frederick P. Brooks, Jr.. VIEW—An exploratory molecular visualization system with userdefinable interaction sequences. Proceedings of Siggraph ’93 (Anaheim, CA, August), Computer Graphics Annual Conference Series, ACM, 1993, pp. 57-64. Eric A. Bier, Maureen C. Stone, Ken Pier, William Buxton, and Tony D. DeRose. Toolglass and Magic Lenses: The See-Through Interface. Proceedings of Siggraph ’93 (Anaheim, CA, August), Computer
15.
17.
18. 19.
20.
21.
Graphics Annual Conference Series, ACM, 1993, pp. 73-80. Eric A. Bier and Steve Freeman. MMM: a user interface architecture for shared editors on a single screen. Proceedings of the ACM SIGGRAPH Symposium on User Interface Software and Technology (South Carolina, November), ACM, 1991, pp. 79-86. Eric A. Bier and Maureen Stone. Snap-dragging. Proceedings of Siggraph ’86 (Dallas, August), Computer Graphics, Vol. 20, No. 4, ACM, 1986, pp. 233-240. Bureau of the Census. TIGER/Line Census Files, 1990. Washington, 1991. George Furnas. Generalized Fisheye Views. Proceedings of CHI ’86, (Boston, MA, April 1986), pp. 16-23. Adele Goldberg and Dave Robson. A Metaphor for User Interface Design, Proceedings of the University of Hawaii Twelfth Annual Symposium on System Sciences, Honolulu, January 4-6, (1979), pp. 148-157. Glenn Krasner and Stephen Hope. A Cookbook for Using the Model-View-Controller User Interface Paradigm in Smalltalk-80, Journal of Object-Oriented Programming, 1, 3, (1988), pp. 26-49. Michael Mills, Jonathen Cohen and Yin Yin Wong. A magnifier tool for video data. Proceedings of CHI ’92, (Monterey, CA, May 3-5, 1992) ACM, New York, (1992), pp. 93-98. Greg Nelson. Juno, a constraint-based graphics system. Proceedings of Siggraph ’85 Computer Graphics, Vol. 19, No. 3, ACM, 1985, pp. 235-243. Jakob Nielsen. HYPERText & HYPERMedia. Academic Press. 1990. Ken Perlin and David Fox. Pad: an alternative approach to the computer interface. Proceedings of Siggraph ’93 (Anaheim, August), Computer Graphics Annual Conference Series, ACM, 1993, pp. 57-64. Robert W. Scheifler, James Gettys, and Ron Newman. X Window System. Digital Press, Bedford MA, 1988. Manojit Sarkar and Marc H. Brown. Graphical Fisheye Views of Graphs. Proceedings of CHI ’92, (Monterey, CA, May 3-5, 1992) ACM, New York, (1992), pp. 83-91. ImageVision, Silicon Graphics Inc., Mountain View, CA. Robert Spence and Mark Apperley. Data Base Navigation: An Office Environment of the Professional. Behaviour and Invormation Technology, 1, 1, (1982), 43-54. Daniel C. Swinehart, Polle T. Zellweger, Richard J. Beach, and Robert B. Hagmann. A structural view of the Cedar programming environment. ACM Transactions on Programming Languages and Systems, Vol. 8, No. 4, ACM, 1986, pp. 419-490. Stephen A. Weyer and Alan H. Borning. A Prototype Electronic Encyclopedia, ACM Transactions on Office Systems, 3, 1, (1985), pp. 63-88.