region, ranging from county agencies, private industry and regional partnerships, ... development of this application, how it would achieve the goal of developing this tool and ... were released in May 2010 (iPhone) and August 2010 (Android).
The NANOOS Visualization System (NVS): Lessons Learned in Data Aggregation, Management and Reuse, for a User Application E. Mayorga*, T. Tanner*, R. Blair+, A.V Jaramillo#, N. Lederer*, C.M. Risien%, C. Seaton# *
Applied Physics Laboratory, University of Washington, Seattle WA 98105 Boeing Research & Technology P.O. Box 3707, MailCode 42-50, Seattle WA 98124 # Center of Coastal Margin Observation & Prediction, Oregon Health & Science University, Beaverton OR 97006 % College of Oceanic and Atmospheric Sciences, Oregon State University, Corvallis OR 97330 +
Abstract- The mission of NANOOS is to coordinate and support the development, implementation, and operations of a regional coastal ocean observing system (RCOOS) for the Pacific Northwest region, as part of the U.S. IOOS. A key objective for NANOOS is to provide data and user-defined products to a diverse group of stakeholders in a timely fashion, and at spatial and temporal scales appropriate for their needs. To this end, NANOOS developed the NANOOS Visualization System (NVS), which aggregates, displays and serves meteorological and oceanographic data, derived from buoys, gliders, tide gauges, HF Radar, meteorological stations and satellites, as well as model forecast information in such a way that it presents end users with a rich, informative and user friendly experience. First released in November 2009, NVS has already undergone several significant updates. While its original focus and continued strength is on near-real-time (NRT) observations from stationary platforms (buoys, coastal stations, etc.), it has evolved to include other types of observations as well as forecast information. NVS integrates data from a wide diversity of providers across the region, ranging from county agencies, private industry and regional partnerships, to core IOOS federal programs, and state agencies and academic groups that are principal partners in NANOOS' Data Management and Communication (DMAC) efforts. Regional and national feedback confirms that NVS has been well received by ocean observing and stakeholder communities alike. This paper discusses, in detail, NVS 2.0, which was released in August 2010. In particular, we provide an in depth look at the database schema, metadata, data harvesting, and component communication. In addition, we discuss the NVS data management and communication approach in the context of the IOOS DMAC interoperability and standards-based efforts, highlighting the strengths and weaknesses of application-focused vs. strong-interoperability-focused approaches. Lessons learned both from technical and project management perspectives are also presented. Lastly, we discuss future plans for NVS. Anticipated improvements include automating asset metadata discovery and processing using IOOS standard protocols, and a NANOOS implementation of ERDDAP that will support NVS by replacing multiple, data-source-specific data harvesters with more generic and easier-to-maintain NERDDAP harvesters; and by enabling customized data subsetting and download capabilities that will be accessible through the NVS user interface.
I.
INTRODUCTION
The Northwest Association of Networked Ocean Observing Systems (NANOOS) is the Regional Association of the national Integrated Ocean Observing System (IOOS) for the Pacific Northwest (PNW) states of Oregon and Washington. The spatial domain of NANOOS extends from the US/Canada border in the north to Cape Mendocino in the south. At present, 44 entities have signed NANOOS’ operational Memorandum of Agreement. These entities include tribal, industries, state and local government, non-governmental organizations and academic institutions. The mission of NANOOS is to coordinate and support the development, implementation, and operations of a regional coastal ocean observing system (RCOOS) for the PNW. A key objective for NANOOS is to provide data and user-defined products regarding the ocean to a diverse group of end users in a timely fashion, and at spatial and temporal scales appropriate for their needs. To this end, NANOOS developed the NANOOS Visualization System (NVS, http://nvs.nanoos.org). The primary goal for NVS 1.0 was to aggregate, serve and display near-realtime (NRT) data in a common and consistent way using open source technologies and services such as Google Maps that were familiar to NANOOS stakeholders (Risien et al., 2009). Early NVS prototypes were based on lessons learned through the development of other interactive user interfaces, including an Applied Physics Laboratory (APL) application called the Boater Information System (BIS) and a NANOOS pilot project, Google Map based, asset list, being inspired by the functionality of web sites such as Magic Seaweed and Weather Underground’s Wundermap, and the results of a series of meetings and discussions between members of the NANOOS User Products, Data Management and Communication and Education and Outreach committees (UPC, DMAC and E&O, respectively), which culminated in an internal white paper in May 2009 that detailed a vision of what NANOOS was looking to achieve through the development of this application, how it would achieve the goal of developing this tool and how an early prototype would possibly look and function. At that time, weekly conference calls were set up among key DMAC and UPC members from multiple NANOOS partner institutions in Oregon and Washington, to steer the development of NVS. NVS 1.0 was released in early
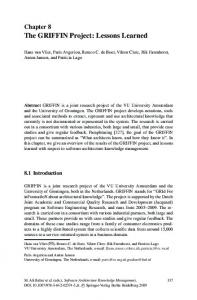
November 2009 and delivered to Stakeholders NRT coastal, estuarine, oceanographic and meteorological data, derived from in situ assets (buoys, tide gauges, meteorological stations, and shore stations), via an interactive Google Map-based application. NVS versions 1.5 and 1.6 were released in March and May 2010, respectively (see http://www.nanoos.org/nvs/information/version_history.php). These releases included significant upgrades of the NVS database to accommodate new asset classes, such as the in situ asset forecasts described below, and improve functionality and performance. Changes were also made to the filtering capabilities as well as the user interface (UI), which was redesigned to accommodate, for example, NOAA & NANOOS model forecasts that were added where possible, to in situ assets such as buoys and tide gauge stations. Lastly, satellite derived chlorophyll and sea surface temperature overlays, and plots of Oregon State University (OSU) NRT glider and X-Band Radar data were added. In early August 2010 NVS 2.0 was released. This release marks a significant step forward for NVS as it includes a completely overhauled UI that, for example, allows users to quickly select regions of interest and optimizes the available map-based interface. HF Radar overlays, model forecast time series overlays that users can animate at various speeds and download in KML (Keyhole Markup Language) format for viewing in Google Earth, and the ability to compare observations to model forecast information using the “Comparator” tool are all new features included in NVS 2.0. In addition to the online application, NVS mobile applications (“apps”) that reuse NVS component communication resources were released in May 2010 (iPhone) and August 2010 (Android). Our goal here is to describe the approach used by the current NVS version (2.0) with respect to information management and communication, both with external resources and among NVS components. Section II provides this description of the NVS information system, including an in-depth presentation of the database schema, metadata, data harvesting, and component communication. In Section III, the NVS data management and communication approach is discussed in the context of the IOOS DMAC interoperability and standards-based efforts, highlighting the strengths and weaknesses of application-focused vs. stronginteroperability-focused approaches (http://ioos.gov/library/dmac_implementation_2010.pdf). Lessons learned are discussed in Section IV and Conclusions and future directions, including data handling, possible, incremental implementations of automated metadata updates and harvester upgrades and an ongoing effort to deploy a NANOOS implementation of ERDDAP (NOAA Environmental Research Division’s Data Access Program) are summarized in Section V. II. NVS DATA MANAGEMENT AND COMMUNICATIONS A. The NVS information system The NVS information system (its “Data Management and Communications” component; IOOS, 2010; de La Beaujardiere et al., 2009) was developed incrementally through a collaboration of team members with different backgrounds and based in different institutions. Nevertheless, broad common objectives have guided its design, implementation and evolution. These include a rigorous focus on optimizing the user experience, separation and modularization of individual developer roles, and rapid, agile development cycles with periodic re-assessments and re-factoring. This approach has resulted in the development of loosely coupled broad components and sub-components that are maintained independently, but with regular communication and collaboration among developers. All NVS information system components are implemented operationally on Linux servers using open source software. At the broadest level, NVS 2.0 is made up of three components: the NVS Assets Database, the NVS Framework, and the NVS Data Harvesters (Fig. 1). These will be described in more detail below. The Assets Database couples the other two components and is the repository of all NVS data and metadata. In fact, a powerful feature of NVS is that its user interface and dynamic information presentation are directly driven by a central datastore, a light-weight MySQL database developed specifically to support NVS functionality. Here, the term “data” refers to dynamic, temporally varying observations of environmental conditions, while “metadata” refers to generally static information about the asset, including institutional affiliations (such as the “provider”, the entity responsible for managing and maintaining an asset); geospatial and elevation/depth information; platform, sensor and measurement descriptors and categorizations; asset identifiers and names; and information about data sources. In NVS, assets have been grouped into three broad classes: 1. SISO: "Stationary In-Situ Observations" assets. Platforms that are effectively fixed geographically (horizontally), such as buoys and shore moorings. Currently these are specifically assets that report data in near-real-time, but that is not a strict requirement in NVS. 2. MLOC. "Moving-Location" assets. This asset class includes cruises with multiple stations, gliders and AUV’s, and sparse or grab-sample monitoring.
3.
GRID. "Gridded Regular and Irregular Data" assets. This asset class encompasses representations of environmental conditions that are spatially continuous, including the output from remote sensing instruments (e.g., satellites and HF radar) and from numerical models (hindcasts, nowcasts and forecasts).
While NVS capabilities have been greatly expanded since version 1 to include MLOC and GRID assets, SISO assets remain the most robust and extensive implementation; for that reason, they are the primary focus of this presentation, whereas MLOC and GRID assets will be discussed only briefly. In addition, the assets database also includes information used only for visualization and user-interface configurations, such as minimum and maximum y-axis values per measurement variable in time series plots; these schema elements will not be addressed here. The NVS Framework encompasses all user-interface elements, including the communication of data and metadata from the assets database. The Framework (Fig. 1) includes the time series plotter (implemented using Python matplotlib), data-download functionality, all user-interface elements, and communication with mobile apps. Information passing among these elements is managed by a Controller via extensive use of RESTful web services and metadata caching, described in more detail below. The NVS Data Harvesters insert time-varying asset data into the Asset Database via a set of data-source specific programs (individual harvesters; see Fig. 1) that regularly access and transform data from multiple sources. Currently the database retains a rolling 30-day data archive for SISO assets and the few most recent model forecast site results (described below), corresponding to the present NVS focus on NRT, recent-past and near-future information. B. Database schema Fig. 1 shows a simplified representation of the core database schema used in the NVS Assets Database. Each asset class generally follows a simple schema with three core tables. For SISO assets, these are: siso_meta: Asset metadata, except for information about measurements. “Asset MD” in Fig. 1. siso_data_details: Information about measurements, by asset and depth/altitude. “Asset Meas. MD” in Fig. 1. siso_data: Observation data, by asset, measurement, depth/altitude and time step. “Asset Meas. DATA” in Fig. 1.
Fig. 1. NVS Information System Schematics. Shaded blocks represent broad NVS components. The dashed DS5-DAC2 arrow represents an alternate access point for DS5 assets. Acronyms and abbreviations used: DAC (Data Assembly Center), DD (Data Dictionary), DS (Data Source), Lib. (Library), MD (Metadata), Meas. (Measurements), NH (NVS Harvester), UI (User Interface).
The measurements data dictionary table (“Meas. DD” in Fig. 1) lists and defines each unique measurement variable found in the database, and includes measurement attributes such as categories, preferred units, IOOS DMAC name, and CF name and URL (CF: Climate Forecast convention; Hankin et al., 2009; Nativi et al., 2008). As a general rule, the database schema only contains information that NVS uses directly or will require in the near future. A simple schema has been maintained as much possible, often foregoing schema normalizations while favoring fast queries and a simple data model that can be mapped readily to internal data models in the NVS Framework Controller and NVS Data Harvesters code. This simplicity has also facilitates the rapid evolution of NVS. New attributes or schema changes are introduced only when required by new NVS features. The first implementation of model forecast data in NVS (version 1.5) was accomplished via the extraction of forecast time series at sites within the model domain where SISO assets are located. While these model assets are represented in NVS through the GRID asset class to match their origin, the linkage of GRID and SISO assets was implemented in the schema using a simple match-up table, siso_vs_grid (Fig. 1), that matches each unique GRID asset identifier (grid_label) with corresponding unique SISO asset identifiers (siso_label). C. Metadata, semantic mediation and metadata maintenance NVS integrates data from a wide diversity of providers across the region, ranging from county agencies, private industry and regional partnerships, to core IOOS federal programs, and state agencies and academic groups that are principal partners in NANOOS DMAC efforts. Providers and corresponding provider types as classified in NVS are listed in Table 1, together with asset counts. Assets in each asset class are also categorized into platform types, listed in Table 2. Finally, Table 3 lists current NVS data sources, where a data source (“DS” in Fig. 1) is defined as a unique, distinct supplier of open-access data in a common form for one or more assets; when the data source assembles and redistributes data from other providers (in addition to assets for which it is the provider, if applicable), it is termed a Data Assembly Center (“DAC”, Fig. 1 and Table 3; see de La Beaujardiere et al., 2009). TABLE 1. NVS PROVIDERS, LISTED BY ASSET CLASS (3) AND PROVIDER TYPE (7). ALL PROVIDER TYPES OTHER THAN “FEDERAL” AND “ENV. CANADA” ARE REGIONAL PROVIDERS, THOUGH SOME FEDERAL PROVIDERS (E.G., NOAANERRS) INVOLVE REGIONAL PARTNERSHIPS; CDIP-SCRIPPS ASSETS (BUOYS) OFTEN INVOLVE DIVERSE PARTNERSHIPS. provider CDIP-Scripps CMOP OSU-COAS UW-APL UW-ORCA VENUS ICM-Mobilisa LOBO King County WADOE NOAA-NDBC NOAA-NDBC/C-MAN NOAA-NERRS NOAA-NOS/CO-OPS NOAA-PMEL Env. Canada CMOP OSU-COAS UW-APL UW-PRISM HCDOP CMOP OSU-HFRadar OSU-XBRadar NOAA-CoastWatch NOAA-NCEP NOAA-NOS/CO-OPS
provider_type asset count provider_url Stationary in-situ observation assets (16 providers, 99 assets) Academic 6 cdip.ucsd.edu Academic 17 www.stccmop.org Academic 1 www.coas.oregonstate.edu Academic 2 www.nanoos.org Academic 5 orca.ocean.washington.edu Academic 4 www.venus.uvic.ca Industry 4 buoy.icmobil.com Industry 1 yaquina.satlantic.com County 3 green.kingcounty.gov/marine-buoy State 4 www.ecy.wa.gov/programs/eap/mar_wat/moorings.html Federal 11 www.ndbc.noaa.gov/maps/Northwest.shtml Federal 6 www.ndbc.noaa.gov/cman.php Federal 5 nerrs.noaa.gov Federal 24 tidesandcurrents.noaa.gov Federal 1 www.pmel.noaa.gov/stnP/index.html Env. Canada 5 weatheroffice.gc.ca/marine/index_e.html Moving-location assets (5 providers, 5 assets) Academic 1 www.stccmop.org Academic 1 www.coas.oregonstate.edu Academic 1 www.nanoos.org Academic 1 www.prism.washington.edu Non-Governmental 1 www.hoodcanal.washington.edu Gridded regular and irregular data assets (6 providers, 8 assets) Academic 1 www.stccmop.org Academic 1 bragg.coas.oregonstate.edu Academic 1 web.engr.oregonstate.edu/~hallerm/index.htm Federal 2 coastwatch.pfeg.noaa.gov Federal 2 www.emc.ncep.noaa.gov Federal 1 tidesandcurrents.noaa.gov
The diversity of providers and flexibility adopted with respect to allowed data formats and encodings (see below) necessitated the implementation of considerable semantic mediation to resolve both structural and contextual semantic heterogeneities (Beran
and Piasecki, 2009; Horsburgh et al., 2009) among data sources. These heterogeneities involve nearly all attributes associated with observations: date-time encoding, location, asset identification and naming, platform type, observation depth representation and schemes (including multiple sensors at different depths or elevations, and time-varying depths), measurement names and units, and representation of invalid or missing data. Semantically homogenized asset and asset-measurement metadata corresponding to these attributes is therefore stored in the NVS Assets Database or built into the parsing logic of each data harvester (see below). As a result, the NVS Framework is provided with consistent, predictable, and sufficiently comprehensive metadata, enabling Framework – and NVS Mobile Apps – developers to focus instead on building rich user-interface functionality and information communication that take full advantage of these metadata. The extensive metadata use throughout NVS is illustrated schematically in Fig. 1. Metadata in the NVS Assets Database is currently maintained manually by the TABLE 2. NVS PLATFORM TYPES. NVS Data Manager. While this approach is clearly not scalable, it has been platform type asset count entirely appropriate and manageable at the scale of a regional observing system Stationary in-situ observation assets with a limited number of NRT coastal observation assets, which change Buoy 38 infrequently due to resource constraints. We believe the tradeoffs relative to Fixed Shore Platform 49 automated schemes have favored our approach, both in terms of a reduced initial commitment to complex automation while the system was maturing, and because Land Station 8 automated metadata harvesting options do not yet exist for assets from important Seabed Cabled Platform 4 some regional data sources. Moving-location assets Cruise
2
Glider
3
D. Data harvesting General description. Gridded regular and irregular data assets NVS Data Harvesters for SISO assets are implemented in Python (2.6) and run as automatic, independent batch processes that use a custom code library (“NH Model 4 Lib.” in Fig. 1) for common functionality. Data harvesting frequency ranges from Radar 2 once every 5 minutes to every 24 hours. Each harvester is tuned to a specific data Satellite 2 source, which may be a single-provider DS or a multi-provider DAC (Fig. 1). In selecting a data source access point and data format for NVS harvesting, we were guided by a focus on using the most practical, easy-to-parse, efficient and robust data stream when more than one option was available either from a single DS or via a DAC (e.g., DS5->NHDS5 vs. DS5->DAC2-> NHDAC2 option in Fig. 1). As a result of this flexibility and a deliberate decision to use whatever DS configuration providers with limited resources made available, NVS harvesters currently ingest a set of widely heterogeneous data formats, encodings, structures, and semantics. For example, data for multi-depth SISO platforms distributed through ASCII delimited files may be arranged with different depths as different columns, or with common measurements columns and each depth labeled via a column attribute. Also, the most recent data may be distributed as only the latest reading, as cumulative time series, or as time intervals encompassing the most recent data telemetry batch. TABLE 3. NVS DATA SOURCES. ENTRIES IN BOLD ALSO FUNCTION AS DATA ASSEMBLY CENTERS. data_source asset count Stationary in-situ observation assets (9 data sources) NANOOS-APL 7 NANOOS-CMOP 17 NANOOS-OSU 2 VENUS 4 ICM-Mobilisa 4 King County 3 WADOE 4 NOAA-NDBC 34 NOAA-NOS/CO-OPS 24 Moving-location assets (3 data sources) NANOOS-APL 3 NANOOS-CMOP 1 NANOOS-OSU 1 Gridded regular and irregular data assets (4 data sources) CORDC 1 NANOOS-CMOP 1 NANOOS-OSU 4 NOAA-CoastWatch 2
Data harvesters make extensive use of metadata in the NVS Assets Database at run-time to identify the assets per data source, mappings between data-source and NVS measurement names, depths per measurement, etc. (Fig. 1); therefore, much of the functioning of NVS data harvesters is configured via the Assets Database, permitting rapid and convenient reconfigurations. As described above, hard-wiring within data harvesters together with Assets Database metadata result in semantically homogenized data loaded into the database. When the NVS Framework was enhanced to support GRID assets and model forecasts at sites (siso_vs_grid) starting with NVS 1.5, the SISO data harvester infrastructure provided the base and the bulk of the code templates to support site forecast harvesting. These harvesters currently operate in a similar fashion as SISO harvesters.
NVS Team Partner as NVS Data Assembly Center. In order to take advantage of the entire, distributed NVS development team and its diverse skill sets, as well as reduce the load placed on any one server, the tasks of processing and harvesting data for inclusion into NVS have been distributed between UWAPL, OHSU and OSU. At present, OSU is responsible for harvesting and processing NRT data for the OSU NH-10 buoy,
located approximately 10 nautical miles west of Newport, OR, and the Yaquina Bay LOBO (Land/Ocean Biogeochemical Observatory) system that is operated and maintained by WET Labs. NH-10 data are telemetered to shore every three hours where QA/QC methods are applied and the data are written out as flat ASCII files, using a standard, internally agreed upon file structure. LOBO data are downloaded from the provider and written out as flat ASCII files every hour, using the same standard file structure as NH-10. In effect, OSU acts as a Data Assembly Center that has reduced the complexity and knowledge required of NVS Data Harvester developers, turning multiple data sources into a single, well-characterized DAC. In addition, OSU is responsible for harvesting asset forecast data (“siso_vs_grid” functionality) from the NOAA NCEP Wave Watch III (WWIII) and North American Mesoscale (NAM) models as well water level forecast information from NOAA COOPS (Table 4). These forecast fields are accessed using a series of C shell and Matlab scripts. Time series of meteorological and oceanographic variables (Table 4) are extracted for individual SISO assets from the NAM and WWIII fields, while CO-OPS water level forecasts are downloaded and processed for each NOS tide gauge station (SISO assets) within the NANOOS domain. These time series are written out as flat ASCII files using the same standard, internally agreed upon file structure used for the NH-10 and LOBO SISO assets. The ASCII files are made available to NVS harvesters via HTTP. A recent addition to NVS is animated 2-D overlays that show WWIII-derived wind and wave forecasts. OSU accesses and plots these fields every 6 hours and makes the resulting 183 PNG files as well as three JSON (JavaScript Object Notation) metadata files available to the APL image tile server, which in turn ingests, processes and serves them to NVS. The original images are projected using an Equidistant Cylindrical projection so that they are Google Earth compatible when users download the overlays as KML files. E. NVS Framework component communication and JSON web-service data access Component communication within the NVS Framework. Data (and metadata) handling in the NVS Framework is generally comprised of two components: data extraction and data transport (see Fig. 1). For data extraction, the Framework uses a simple set of scripts that wrap around PHP MySQL functions. There are a variety of destinations for information pulled out of the NVS Assets Database, and as a result, the data structure that results from extraction is generalized and formed into simple objects. Once the data has been extracted, it is processed according to its intended use. If the destination is a "Data Download", it is reformatted into a simple CSV structure or other formats (such as JSON and XML) and returned to the client. If the destination of extracted data is NVS, or an NVS Mobile App, it is formatted into a JSON object and returned to the requesting component. The JSON format provides an efficient method of data transport for NVS because the primary server-side (PHP and Python) and client-side (JavaScript) languages can easily interpret and instantiate JSON objects. The actual structure of JSON used in NVS was the result of discussions among the principal developers and typically contains a success key and metadata using agreed upon keys. Data (values, timestamp, depth, etc.) are stored in parallel arrays (lists), and require all arrays to contain the same number of elements, which can be fragile; however, this method provides a compact way to send and retrieve large data sets, and has thus far proven reliable and efficient. In some cases, such as metadata that changes infrequently, when information is extracted from the database it is saved in JSON format to file on disk (cached), and the file is sent to the client. When other clients make subsequent requests, the date of the cached file is checked against the database and returned to the client if the database hasn't changed. This minimizes unnecessary queries to the database and optimizes performance across NVS. TABLE 4. MODEL (GRID) ASSETS Model Tides
NVS Data Source NANOOS-OSU
Provider
Service
Data/File Format HTML
Update Schedule 1 x Daily
NOAA-CO-OPS
Web Server (HTTP)
WaveWatch III
NANOOS-OSU
NOAA-NCEP
GrADS Data Server (GDS)
GRIB
4 x Daily
NAM Model
NANOOS-OSU
NOAA-NCDC
THREDDS Data Server (TDS)
GRIB
4 x Daily
Columbia Estuary
NANOOSCMOP
CMOP
Web Server (HTTP)
Delimited ASCII
1 x Daily
Measurements Water Level
Wave Period, Wave Height, Wave Mean Dir., Wind Direction, Wind Speed Air Temperature, Barometric Pressure, Rel. Humidity, Wind Direction, Wind Gust, Wind Speed Water Temperature, Salinity
Domain In-Situ Assets: 22 Overlay: 21 – 60oN, 12.75 – 261.25oE In-Situ Assets: 21
In-Situ Assets: 85
In-Situ Assets: 21
External communication with mobile apps. The basic modular design of the NVS architecture allowed for the use of RESTful web services for component communication within the NVS Framework. The iPhone and Android applications have taken advantage of this infrastructure originally designed for communication between NVS Framework components. The mobile apps make use of this service by making an HTTP request to an NVS Framework URL. An NVS script identified by this URL is executed. During execution the NVS script parses that request, and either pulls the appropriate metadata or data from the database and returns it in JSON format, or, if the request is for a plot, the URL for the plot is returned, also in JSON format. This RESTful API with JSON data encoding was found to be well suited to operation in restricted-resource devices such as smart phones. The web service was designed to minimize both the number of transactions to NVS as well as the amount of data passed in each transaction, which is important when network data charges for these devices can be high and network speed can be limited. JSON was found to be an excellent data encoding mechanism. It has proven to be able to efficiently encode structured data such that the resultant data packet is small and easy to parse. One drawback, however, is that JSON is not self-describing. Some a-priori knowledge of the data structure and contents is needed to create client programs. With NVS this was not an issue since there is excellent communication between team members. F. Other Database export and access mechanisms All external access to the NVS Assets Database is currently mediated by the NVS Framework. We are exploring additional mechanisms for enabling more diverse access to the database (see Fig. 1). For example the open-source GeoServer software may provide a single translation service to formats and services common within the GIS community (e.g., KML, GeoRSS, and OGC Web Mapping Service). NANOOS is already using GeoServer to support other online mapping products, and we have assessed the use of GeoServer to provide access to an inventory of NVS assets. Likewise, the NANOOS ERDDAP implementation currently in development may take advantage of the NVS data harvesters directly or indirectly, making NVS asset data and metadata available through its translation services. III. NVS AND IOOS DMAC IOOS DMAC is converging on data access protocols and standards that facilitate the interoperable exchange of data. This is accomplished through the use of standards-based Service Oriented Architectures (SOA). For in-situ observation data the OGC Sensor Observation Service (SOS) is mandated (de La Beaujardiere, 2008; IOOS, 2010). The SOS standard defines operational semantics and operations in an HTTP request-response paradigm. SOS does not define, however, the format of the data items contained in SOS transactions. This has led to a substantial diversity in implementations and semantic representations that is only partially resolved through complex code handling of many unique cases (E. Bridger, pers. comm.). For that reason, the IOOS program office has been working closely with the IOOS regional association to define a workable data-encoding standard for use within SOS transactions. This work is coming to convergence and should see regional implementations later this year. For gridded data, the combination of NetCDF, CF conventions and OPeNDAP have demonstrated a significant degree of success at achieving interoperability (e.g. Signell et al., 2008; Hankin et al., 2009). Finally, the IOOS program office has recently established a metadata registry for site and gridded data sets. This registry collects and stores metadata from the IOOS mandated data services located within each of the regional associations. The registry is a work in progress, but will allow for data discovery in a standard way when data services are fully deployed and consistent. As described above, NVS currently harvests data from different data sources in diverse data formats, structures and semantics; no harvester currently ingests an SOS access point. This circumstance resulted from the pragmatic NVS guiding principles described earlier. While the development of new NVS harvesters can indeed be labor intensive (depending on the relevance of existing harvesters that may be used as templates for the new data source), the heterogeneity of SOS implementations that has predominated until recently means that, in practice, the approach used by NVS has not necessarily been more time consuming than a reliance on SOS access points, when available. As IOOS standard services become widely available, data harvesting and metadata updating may be automated. The NVS architecture allows us to independently transition each data source harvester and metadata scheme, as appropriate, without impacting the NVS Framework. We will explore the use of SOS access points and the IOOS Registry on a selective basis in the near future, and will make such transition on a per-data-source – or per DAC – basis as it becomes advantageous. In addition, NANOOS DMAC will make available through IOOS standard protocols all regional asset data that are discoverable and accessible from NVS and are not otherwise available to IOOS.
IV. LESSONS LEARNED Cyberinfrastructures and regional marine data management and data access provision are ideally collaborative efforts with strong social components (e.g., Baker and Chandler, 2008). NVS is the result of close collaboration between the three standing committees that comprise NANOOS, but particularly the DMAC and UPC committees. At the outset, weekly conference calls were set up among key DMAC and UPC members from multiple NANOOS partner institutions in Oregon and Washington. These calls have served as an opportunity to continually build a consensus around the evolution and goals of NVS, to discuss and critique the implementation of features being developed, and more broadly, to sustain momentum, cohesiveness and buy-in among team members. Without the cooperation, leadership and involvement of diverse members from the three NANOOS committees, NVS would not have been possible. Common goals and vision for NVS allowed this application to be built as a team effort without regard to geographic location or institutional affiliation, only 6 months after the requirements had been agreed to. An emphasis on user application needs, an agile development approach, and the diversity of NVS team members all contributed to the implementation of data-handling approaches that favor light-weight designs, rapid development, component modularization, backend data caching, and fast data access. This approach has also facilitated the transition of team member roles as circumstances evolve (such as the emergence of OSU as an NVS DAC), and the transition of prototypes or proof-of-concepts developed by some members with their preferred tools, to operational NVS implementations using more robust components. Team members' participation in both user-products and DMAC activities have allowed us to maintain IOOS DMAC interoperability standards within sight with components that can be incrementally upgraded to support and take advantage of IOOS DMAC standards as they evolve. With respect to application data communication, an early reliance on RESTful web services for modular data access within the NVS Framework recently enabled us to support convenient and high-performance access via the NVS iPhone Application released in May 2010, and more recently the NVS Android Application. A flexible approach to data ingestion enabled us to readily ingest data from local providers. These partners often have limited resources to develop or deploy additional data access methods, and may not have a mandate to participate in US national interoperability networks such as IOOS. Our flexibility, however, allowed the development of data harvesters based on local providers’ existing infrastructure and resources. By not imposing new data-delivery requirements and adjusting instead to the existing infrastructure, we were able to ingest data that had never before been aggregated into regional or national networks. This is particularly true for King County (WA), which was completing an internally driven overhaul of its moorings’ telemetry and data management just as NVS 1 was being finalized. It is also true of VENUS, a Canadian sea-bed monitoring observatory project which became a NANOOS partner as NVS 1 was nearing completion. V. CONCLUSIONS AND FUTURE DIRECTIONS NANOOS is currently implementing ERDDAP as a new user product that will provide more extensive and customized access to regional datasets than NVS. By targeting a technical audience, this implementation will complement NVS' focus on interactive, intuitive visualizations and information access. ERDDAP provides many functions to both aggregate data and translate data into various formats such as KML, CSV, Matlab mat files, etc. The ERDDAP architecture provides a web services API to access these data aggregation and transformation operations. By utilizing these programmatic interfaces, NANOOS will be able to provide ERDDAP functionality through a customized, NANOOS-controlled user interface (NANOOS ERDDAP, or NERDDAP). We anticipate that NERDDAP will be able to support NVS by replacing multiple, data-source-specific NVS data harvesters with a more generic and easier-to-maintain NERDDAP harvester; and by enabling customized data subsetting and download capabilities that will be accessible through the NVS user interface. As the standards-based IOOS Registry and Catalog mature, NVS will be able to take advantage of these national services to automate asset metadata discovery, update and processing. Likewise, NVS data harvesters will be converted to interoperable IOOS data transport standards as these become robust and consistent. The NVS architecture facilitates an incremental, evolutionary approach to these enhancements, isolating the impact of these overhauls from the NVS Framework that supports all user interactions. As NVS has become successful and recognized, local providers more and more see the value both to themselves and the community of having their assets included in NVS, and are now often approaching us to participate. And as NVS team member have become more comfortable with the maturing NVS architecture and with each other, it has also become easier to propose and add new features, new assets, and new asset types. We believe NANOOS’ experience with NVS will be of value to other regional coastal and ocean observation systems, and to the development of multi-partner marine cyberinfrastructures in general.
ACKNOWLEDGMENT The authors thank NANOOS leadership and partners for supporting and encouraging our work. In addition, we thank the NOAA Integrated Ocean Observing System (IOOS) Program Office for its leadership. This work was conducted with support from NOAA IOOS grants to the University of Washington. The statements, conclusions, and recommendations expressed here are those of the authors and do not necessarily reflect the views of the National Oceanic and Atmospheric Administration or the U.S. Department of Commerce. REFERENCES Baker, K. S. and Chandler, C. L. 2008. Enabling long-term oceanographic research: Changing data practices, information management strategies and informatics. Deep Sea Research Part II: Topical Studies in Oceanography 55(18-19), 2132--2142. Beran, B. and M. Piasecki. 2009. Engineering new paths to water data. Computers and Geosciences 35(4): 753-760, doi:10.1016/j.cageo.2008.02.017 de La Beaujardière, J., C.J. Beegle-Krause, L. Bermudez, S. Hankin, L. Hazard, E. Howlett, S. Le, R. Proctor, R.P. Signell, D. Snowden and J. Thomas. 2009. Ocean and Coastal Data Management. OceanObs 2009. de La Beaujardière. 2008. The NOAA IOOS Data Integration Framework: Initial Implementation Report. Proc. MTS/IEEE Oceans’08. Hankin, S., J.D. Blower, T. Carval, K.S. Casey, C. Donlon, O. Lauret, T. Loubrieu, L.P. de la Villeon, A. Srinivasan, J. Trinanes, Ø. Godøy, R. Mendelssohn, R. Signell, J. de La Beaujardiere, P. Cornillon, F. Blanc and R. Rew. 2009. NetCDF-CF-OPeNDAP: Standards for Ocean Data Interoperability and Object Lessons for Community Data Standards Processes. OceanObs 2009. Horsburgh, J. S., Tarboton, D. G., Piasecki, M., Maidment, D. R., Zaslavsky, I., Valentine, D. and Whitenack, T. 2009. An integrated system for publishing environmental observations data. Environmental Modelling & Software 24(8), 879--888. IOOS. 2010. Guidance for Implementation of the Integrated Ocean Observing System (IOOS) Data Management and Communication (DMAC) Subsystem. NOAA IOOS Program Office White Paper, v1.0, March 2, 2010. Nativi, S., J. Caron, B. Domenico and L Bigagli. 2008. Unidata’s Common Data Model mapping to the ISO 19123 Data Model. Earth Science Informatics 1: 59– 78, doi:10.1007/s12145-008-0011-6 Risien, C. M., Allan, J. C., Blair, R., Jaramillo, A. V., Jones, D., Kosro, P. M., Martin, D., Mayorga, E., Newton, J. A., Tanner, T. and Uczekaj, S. A. 2009. The NANOOS Visualization System: Aggregating, displaying and serving data. Proc. MTS/IEEE Oceans'09. Signell, R.P., S. Carniel, J. Chiggiato, I. Janekovic, J. Pullen and C.R. Sherwood. 2008. Collaboration tools and techniques for large model datasets. Journal of Marine Systems 69(1-2): 154-161, doi:10.1016/j.jmarsys.2007.02.01