Association of Schools of Construction of Southern Africa The Ninth Built Environment Conference 2 - 4 August 2015, Durban, South Africa
Conference Proceedings
PREFACE The ASOCSA Built Environment conference series has become the undisputed leading built environment conference on the African continent. It is one of only two construction-related conferences in South Africa that has been fully accredited by the Department of Higher Education (DHET) for subsidy. Since its inception in 2006 the blind peer reviewed conference proceedings have been referred to by private and public sector policy and decision makers. The series produces a post-conference edition of the Journal of Construction, which is on the list of journals approved by the South African Department of Higher Education and Training (DHET) for subsidy. The series continues to underwritten by major industry stakeholders that have included the Construction Industry Development Board (CIDB), Council for the Built Environment (CBE), Master Builders South Africa (MBSA), branches of the MBA, major construction companies and PPC Cement. It has been endorsed by the International Council for Research and Innovation in Building and Construction (CIB), one of the largest global built environment research organizations. OBJECTIVES The Ninth Built Environment Conference continued in the tradition of previous conferences in the series and provided in an ever-increasing challenging global economic environment with shrinking sponsorship budgets an international forum with a very clear industry development and sustainability focus that provides the opportunity for researchers and practitioners from developed, developing and underdeveloped nations to deliberate topical current issues that impact the Built Environment. The broad objectives of the conference are:
To provide a forum for multi-disciplinary interaction between academics and industry practitioners; To disseminate innovative and cutting edge practices that respond to the conference theme and outcomes, namely Reflections on Directions in Construction; To provide a world class leading internationally recognized, accredited conference for the built environment; and To contribute to the existing built environment body of knowledge (BEBOK) and practice.
The conference organizers brought together in a single forum a group of researchers and academics from the full range of built environment disciplines that include engineers, architects, quantity surveyors, construction and project managers. Delegates were drawn not only from South African institutions of higher education, government agencies, and other construction-related organizations but also from the African continent, Australia, Europe and the United Kingdom.
CONFERENCE THEME AND OUTCOMES Reflections on Directions in Construction This conference sought responses to questions related to current conversations and debates on infrastructure delivery and sustainability such as, for example, Infrastructure Development Management Integrated Project Delivery (IPD) including professional practice Sustainable Green Building Information and Communication Technologies (ICT) including Innovative construction education Building Information Modelling Improved project management Inappropriate construction practices and ethics Construction Health and Safety Construction contracts Innovation in construction technologies and includes papers that address, inter alia, · · · · ·
Current trends and developments Policies Legislation and regulations Practices Case studies
These internationally peer reviewed and edited proceedings were aimed at contributing significantly to the body of knowledge relative to the science and practice of construction not only in South Africa but everywhere that the products of construction are being produced. Ferdinand Fester Durban, South Africa August 2, 2015
ACKNOWLEDGEMENTS The organizing committee of The Ninth Built Environment conference, held in Durban, South Africa, wish to thank the Master Builders Association KwaZulu-Natal, the School of Engineering at University of KwaZuluNatal, the Council of the Association of Schools of Construction of Southern Africa and membership universities and individuals for supporting this conference through their valued contributions. Without that support this conference and the further development and growth of the Association of Schools of Construction of Southern Africa (ASOCSA) with respect to its mission in the region would not have been possible. Further, this support demonstrates the commitment to the further development of the body of knowledge relative to the science and practice of construction. This commitment is deeply valued and acknowledged. Our thanks are extended to Professor Theo Haupt (University of KwaZulu-Natal) and Ferdinand Fester (University of Johannesburg) who worked unstintingly on every aspect of the conference. Together with the Scientific and Technical Committee and additional reviewers to whom special thanks are extended they worked hard and long to prepare refereed and edited papers and published proceedings of the highest standard that satisfy the criteria for subsidy by the South African Department of Higher Education and Training (DHET). The contribution and excellent support of our webmaster, Wendal Koopman, in setting up and supporting our conference website is appreciated. Finally, the sterling contribution and efforts of Ferial Lombardo to the success of this conference is acknowledged in her capacity as conference organizer working with the conference committee and evident in the superlative logistic coordination and attention to detail in every aspect of the conference organization.
ORGANISERS – SOUTH AFRICA Ferdinand Fester, University of Johannesburg, South Africa, President Prof Theodore Haupt, Academic Chair Ms. Ferial Lombardo, Conference Organiser
COPYRIGHT Copyright © 2015 by Association of Schools of Construction of Southern Africa, 77 Herbert Penny Road Penhill Estate 7100 South Africa All rights reserved. This publication, or parts thereof, may not be reproduced in any form or by any means, electronic or mechanical, including photocopying, recording or any other information storage and retrieval systems now known or to be invented, without permission from the Copyright owners, Association of Schools of Construction of Southern Africa. Permission is granted to quote from The Built Environment with the customary acknowledgement of the source. DISCLAIMER While every effort is made to ensure accuracy in this publication, the publishers and editors make no representation, express or implied, with regard to the accuracy of the information contained in these proceedings and cannot accept any legal responsibility or liability in whole or in part for any errors or omissions that may be made. The views expressed in this publication are not necessarily those of the publishers and editors, neither do they endorse or guarantee any claims made by the authors of the papers in these proceedings. The reader should therefore verify the applicability of the information or particular situations and check the references prior to any reliance thereupon. Published by Association of Schools of Construction of Southern Africa, 77 Herbert Penny Road, Penhill Estate, 7100, South Africa
ISBN number: 978-0-620-67120-0
PEER REVIEW PROCESS In order to maintain and ensure the highest quality in the conference proceedings and comply with the requirements for subsidy of the South African Department of Higher Education and Training (DHET), a rigorous two-stage system of peer review by no less than two acknowledged experts in the field has been followed. In terms of this process, each abstract received was twice blind reviewed in terms of: Relevance to overall conference theme and objectives; Relevance to selected sub-theme; Originality of material; Academic rigour; Contribution to knowledge; and Research methodology. Authors whose abstracts were accepted after a blind peer review process was completed, were provided with anonymous reviewers’ comments and requested to submit their full papers noting and addressing these comments. Evidence was required relative to the action taken by authors regarding the comments received. These resubmitted papers were twice blind reviewed again in terms of: Relevance to overall conference theme and objectives; Relevance to selected sub-theme; Originality of material; Academic rigour; Contribution to knowledge; Research methodology and robustness of analysis of findings; Empirical research findings; and Critical current literature review. Authors whose papers were accepted after this second review were provided with additional anonymous reviewers’ comments and requested to submit their revised full papers. These final papers were only included into both the conference presentation schedule and the conference proceedings after evidence was provided that all comments were appropriately responded to, having been multiple peer-reviewed for publication. At no stage was any member of the Scientific and Technical Committee or the editor of the proceedings involved in the review process relative to their own authored or co-authored papers. The role of the editor was to ensure that the final papers incorporated the reviewers’ comments and arrange the papers into the final sequence based on the conference presentation schedule as captured on the conference proceedings flashdrive and Table of Contents. Of the 78 abstracts originally received, only 47 papers were finally accepted for presentation at the conference and inclusion in these proceedings, representing an acceptance rate of 60%. To be eligible for inclusion these papers were required to receive one of three recommendations from at least two reviewers, namely
Accepted for publication or Provisional acceptance provided minor changes / corrections are made or To re-submit for publication provided author/s reconsider/s the areas of concern
LIST OF REVIEWERS Prof David Edwards, Birmingham City University, UK Prof Theodore Haupt, University of Kwa-Zulu Natal, Durban Prof Tinus Maritz, University of Pretoria, RSA Dr N Chileshe, University of South Australia, Australia Dr Sarah Phoya, Ardhi University Tanzania Dr Geraldine Kikwasi, Ardhi University Dr Brink Botha, Nelson Mandela University, RSA Dr. Justus Agumba University of Johannesburg, RSA Dr. Ruben Ndihokubwayo, Cape Peninsula University of Technology, RSA Dr. Senthilkumar Venkatachlam, University of Sharjah United Arab Emirates Dr. Claudia Loggia, University of KwaZulu-Natal. RSA Dr. Nishani Harinarain, University of KwaZulu-Natal. RSA Dr. Vittorio Tramontin, University of KwaZulu-Natal. RSA Ephraim Zulu, Copperbelt University, Zambia Mrs. Renata Fester, RRF Training Consultant, RSA Ferdinand Fester, University of Johannesburg, RSA Nazeem Ansary, University of Johannesburg RSA Llewellyn van Wyk, CSIR Denamo Addissie, Addis Ababa University, Ethopia SCIENTIFIC AND TECHNICAL COMMITTEE Prof Raymond Levitt, Stanford University, USA Prof Sarvesh Chandra, Indian Institute of Technology, India Prof Francois Jacobs, California Baptist University, USA Prof Diedrich Prigge, California Baptist University, USA Prof. K. Kajimo-Shakantu, University of Free State, RSA Prof David Edwards, Birmingham City University, UK Prof A Gibb, Loughborough University, UK Prof G Ofori, National University of Singapore, Singapore Prof C Monson, University of Washington, USA Prof Theodore Haupt, University of Kwa-Zulu Natal, Durban Prof C Cloete, University of Pretoria, RSA Prof David Root, University of Witwatersrand, RSA Prof C Trois, University of Kwa-Zulu Natal, RSA Prof M Maritz, University of Pretoria, RSA Prof PD Rwelamila, University of South Africa, RSA Dr S Zulu, Leeds University, UK Dr N Chileshe, University of South Australia, Australia Dr S Mohamed, Griffiths University, Australia Dr. O.O. Ugwu, University of Nigeria, Nigeria Dr Geraldine Kikwasi, Ardhi University, Tanzania
History ASOCSA is not the first attempt to form a body that addresses, inter alia, matters of construction education and training. In the days of the Building Industries Federation South Africa and the National Development Fund there were regular annual meetings of the Heads of Departments that offered construction-related programs. Recognizing the two-tiered higher education sector in South Africa, there were separate meetings for universities and the former technikons. In the more recent past, the Chartered Insti tute of Building - Africa initially convened annual educators’ forums that did not quite fulfill the same function as the previous forums. However, during 2005 the very first meeting of University Heads of Departments drawn from all higher education institutions in South Africa met for the very first time since the re-landscaping of the sector in the same venue to discuss matters affecting construction, and particularly construction education in the country. This meeting was repeated in 2006 where the need was expressed for the establishment of a formal forum / association of universities to engage in discussion / debate / collaboration / promotion of matters of mutual interest. Broad Aims
ASOCSA aims to be the professional association for the development and advancement of construction education in Southern Africa, where the sharing of ideas and knowledge inspires, guides and promotes excellence in curriculums, teaching, research and service. To achieve this aim ASOCSA is partnering with the construction industry to find ways to effectively represent the interests of both construction academic and industry practitioners. ASOCSA will offer a variety of programs and services designed to help its members serve their customers more effectively and succeed in an increasingly challenging environment of construction information management and technology. To this end ASOCSA provides a forum for the debate and discussion of issues of mutual interest to all industry stakeholders. For example, one of the tasks of ASOCSA will be supporting the development of curriculums that address the needs of the construction sector in the Southern African region. ASOCSA convenes an annual conference that is one of only two construction-related conferences accredited by the Department of Higher Education and Training (DHET) where construction academics and practitioners can interact relative to practical experience and the findings of relevant research. This conference series is endorsed and underwritten by the International Council for Research and Innovation in Building and Construction (CIB) as well as several major industry stakeholders. The Journal of Construction which is accredited by the Department of Higher Education presently published electronically four times per year is the official journal of ASOCSA and in the past more than 5,000 complimentary copies were distributed to all industry stakeholders in the Southern African region. The production and distribution of practice notes and technical papers is a further endeavor to grow the partnership between academia and industry. With respect to the Southern African region, ASOCSA is committed to the following: Vision To drive innovative construction related higher education Mission Statement To promote, facilitate, develop and monitor the relevance and quality of construction related curricula, research and graduates in conjunction with higher education institutions, industry and government. Strategic objectives The objectives of the Association are:
to promote and facilitate the development of curricula for construction related programmes to assist with the accreditation of construction related programmes
to hold an annual conference that acts as a forum for multi-disciplinary interaction between academics and practitioners to publish an accredited research-based journal and contribute to the built environment body of knowledge (BEBOK) to disseminate information dealing with construction education and related matters to develop and maintain closer links with industry and government to represent the collective views of its members to liaise with other organisations and persons to promote the interests of its members to promote and support relevant postgraduate research to provide bursaries to postgraduate students in accordance with set criteria
ASOCSA continues to seek opportunities to promote both academic and industry employment opportunities. Finally, ASOCSA intends to play a significant role in the accreditation of constructionrelated academic programs. Heads Forum meetings ASOCSA believes that meetings of the Heads Forum comprising of Heads of School and Departments of Construction is a vital component of its functions and holds Heads meetings during each conference. It is still the aim of ASOCSA to bi-annual Heads meetings. International Affiliation ASOCSA has commenced discussions about closer collaboration with similar institutions such as the Associated Schools of Construction (ASC) in the United States, the Royal Institute of Chartered Surveyors (RICS), the Chartered Institute of Building (CIOB), Australian Institute of Building (AIB) and Council of the Heads of the Built Environment (CHOBE) in the United Kingdom. ASOCSA has entered into a Memorandum of Understanding with the International Council for Research and Innovation In Building and Construction (CIB). In summary, benefits of membership of ASOCSA which are self-evident include participation in meetings of the Heads Forum throughout the region, access to the Journal of Construction, reduced rates at all ASOCSA, MBA and CIB events, involvement at regional level with industry-academia forums, interaction and networking opportunities relative to, for example, collaborative research, curriculum development, external moderation of courses, and external examination ASSOCIATION OF SCHOOLS OF CONSTRUCTION OF SOUTHERN AFRICA Office bearers President Vice-president
Ferdinand Fester Prof. Theo C Haupt
Council Members Prof Tinus Maritz Dr Geraldine Kikwasi Eng. Frances Mwape Sylvester Shipalana Michael Border Mrs Elke Hefer Prof Kahilu Kagima-Shakantu Ephraim Zulu
University of Johannesburg University of Kwa-Zulu Natal
University of Pretoria Ardhi University Tanzania (Eastern Africa) National Council of Construction - Zambia Sylsmultiservices Central University of Technology Durban University of Technology University of the Free State Copperbelt University - Zambia
Journal of Construction Editorial Committee Editor: Prof Ayman Othman - The British University in Egypt Associate Editor: Dr Justus Agumba – University of Johannesburg Assistant Editor: Dr Nishani Harinarain – University of KwaZulu-Natal Chair of Heads Forum Nazeem Ansary
University of Johannesburg
For more information on ASOCSA and its activities visit www.asocsa.org
TAX BENEFIT ASOCSA is a registered Public Benefit Organization as defined in Section 30 of the Income Tax Act and a registered Section 21 Company as defined in the Companies Act. Therefore all donations made to ASOCSA will be fully deductible for income tax purposes and a section 18A certificate, for proof of deductibility will be issued to the donor upon receipt of the donation. The deductible donation is limited to 10% of the donors’ taxable income before providing for Section 18A and Section 18 deductions.
Introduction CIB is the acronym of the abbreviated French (former) name: "Conseil International du Bâtiment" (in English this is: International Council for Building). In the course of 1998, the abbreviation has been kept but the full name changed into: INTERNATIONAL COUNCIL FOR RESEARCH AND INNOVATION IN BUILDING AND CONSTRUCTION CIB was established in 1953 as an Association whose objectives were to stimulate and facilitate international cooperation and information exchange between governmental research institutes in the building and construction sector, with an emphasis on those institutes engaged in technical fields of research. CIB has since developed into a world wide network of over 5000 experts from about 500 member organisations active in the research community, in industry or in education, who cooperate and exchange information in over 50 CIB Commissions covering all fields in building and construction related research and innovation. CIB Members are institutes, companies and other types of organisations involved in research or in the transfer or application of research results. Member organisations appoint experts to participate in CIB Commissions. An individual also can be a member and participate in a Commission. CIB Commissions initiate projects for R&D and information exchange, organise meetings and produce publications. These meetings can be Commission meetings for members only or international symposia and congresses open to all. Publications can be proceedings, scientific or technical analyses and international state of the art reports. CIB Past and Present CIB was established in 1953 with the support of the United Nations, as an association whose objectives were to stimulate and facilitate international collaboration and information exchange between governmental research institutes in the building and construction sector. At that time an implicit objective also was to help rebuild the European infrastructure for building and construction research following the ravages of the second World War. At the start 43 research institutes were members of CIB and by far the majority of these were European. And just as in the programmes of these institutes at that time, so in the CIB programme there was a strong emphasis on technical topics. For selected topics CIB Commissions were established to which member organisations appointed experts from their staff to participate. Along with all types of less visible activities, this collective participation resulted in many important international symposia and congresses and in a large number of publications acknowledged as of global standing. Indeed many of these formed the factual basis for developing international standards or were themselves used as such. Others were international state-of-the-art reports that for a long time provided an indispensable input to programming new research by the participating institutes and countries. However, CIB has come a long way since 1953. At present about 500 organisations are members of CIB from whom about 5000 individual experts participate in over 50 CIB Commissions. These extend over the whole area of building and construction research and innovation. Amongst the CIB member organisations we can now find almost all the major national building research institutes in the world, as well as many other types of organisations in the building and construction sector who have joined us since. And although within the CIB programme considerable attention is still given to
technical topics, there are now also activities focused on topics like organisation and management, economics of building, legal and procurement practices, architecture, urban planning and human aspects. It is no exaggeration to say that at present CIB is the world's foremost platform for international cooperation and information exchange in the area of building and construction research and innovation. And we continue to increase our membership, to expand our scope, to initiate new activities while constantly striving to improve the quality of our products and services.
Master Builders KwaZulu-Natal KwaZulu-Natal Master Builders and Allied Industries Association is an Employers’ organisation registered in terms of the Labour Relations Act, the Association exists to represent the interests of members, as well as to provide them with specialist support services to assist them in the successful running of their business. The membership comprises over 700 enterprises involved in the building industry and related activities in the province of KwaZulu-Natal. The organisation has been in existence for 114 years and is recognised and respected by a wide range of role players in the building industry and beyond. The Head office is based in Essex Terrace, Westville, supported by area offices across the province in Zululand, South Coast, Midlands, and Northern Natal. The Association continually strives for excellence in service delivery in all areas of operation, providing a wide range of services including training, building services, occupational health and safety, employee benefit schemes and more. Our special projects include an emerging contractor programme, Vuka Makhi programme and a bursary fund. Complementary operations include:
Building inspections, quality assurance and construction risk management Health and safety consulting Mediation and dispute resolution Conference and meeting facilities Café Indaba Master Builders Print Studio Mobile clinic Master Builders Occupational Health Clinic Property leasing Training academy E-learning Recruitment agency
The general management of the Association is, subject to the direction and control of general meetings of the Association, controlled by the Executive Council. The Executive Director is the Association’s Chief Executive (CEO). The Association continuously reviews its operations with the object of introducing new and innovative services in the building and allied industry.
27 July 2015 Dear Author PEER REVIEW PROCESS: 9TH BUILT ENVIRONMENT CONFERENCE: DURBAN, SOUTH AFRICA 2015 I confirm that the following peer review process was strictly followed relative to this conference. In order to maintain and ensure the highest quality in the conference proceedings and comply with the requirements for subsidy of the South African Department of Higher Education and Training (DHET), a rigorous two-stage system of peer review by no less than two acknowledged experts in the field has been followed. In terms of this process, each abstract received was twice blind reviewed in terms of:
Relevance to overall conference theme and objectives Relevance to selected sub-theme; Originality of material; Academic rigour; Contribution to knowledge; and Research methodology.
Authors whose abstracts were accepted after the blind review process was completed, were provided with anonymous reviewers’ comments and requested to submit their full papers noting and addressing these comments. Evidence was required relative to the action taken by authors regarding the comments received. These resubmitted papers were twice blind reviewed again in terms of:
Relevance to overall conference theme and objectives; Relevance to selected sub-theme; Originality of material; Academic rigour; Contribution to knowledge; Research methodology and robustness of analysis of findings; Empirical research findings; and Critical current literature review.
Authors whose papers were accepted after this second review were provided with additional anonymous reviewers’ comments and requested to submit their revised full papers. These final papers were only included into both the conference presentation schedule and the conference proceedings after evidence was provided that all comments were appropriately responded to, having been multiple peer-reviewed for publication. At no stage was any member of the Scientific and Technical Committee or the editor of the proceedings involved in the review process relative to their own authored or co-authored papers. The role of the editor was to ensure that the final papers incorporated the reviewers’ comments and arrange the papers into the final sequence based on the conference presentation schedule as captured on the conference proceedings flashdrive and Table of Contents. Of the 78 abstracts originally received, only 47 papers were finally accepted for presentation at the conference and inclusion in these proceedings, representing an acceptance rate of 60%. To be eligible for inclusion these papers were required to receive one of three recommendations from at least two reviewers, namely
Accepted for publication or Provisional acceptance provided minor changes / corrections are made or To re-submit for publication provided author/s reconsider/s the areas of concern
LIST OF REVIEWERS Prof David Edwards, Birmingham City University, UK Prof Theodore Haupt, University of Kwa-Zulu Natal, Durban Prof Tinus Maritz, University of Pretoria, RSA Dr N Chileshe, University of South Australia, Australia Dr Sarah Phoya, Ardhi University Tanzania
Dr Geraldine Kikwasi, Ardhi University Dr Brink Botha, Nelson Mandela University, RSA Dr. Justus Agumba University of Johannesburg, RSA Dr. Ruben Ndihokubwayo, Cape Peninsula University of Technology, RSA Dr. Senthilkumar Venkatachlam, University of Sharjah United Arab Emirates Dr. Claudia Loggia, University of KwaZulu-Natal. RSA Dr. Nishani Harinarain, University of KwaZulu-Natal. RSA Dr. Vittorio Tramontin, University of KwaZulu-Natal. RSA Ephraim Zulu, Copperbelt University, Zambia Mrs. Renata Fester, RRF Training Consultant, RSA Ferdinand Fester, University of Johannesburg, RSA Nazeem Ansary, University of Johannesburg RSA Llewellyn van Wyk, CSIR Denamo Addissie, Addis Ababa University, Ethopia
SCIENTIFIC AND TECHNICAL COMMITTEE Prof Raymond Levitt, Stanford University, USA Prof Sarvesh Chandra, Indian Institute of Technology, India Prof Francois Jacobs, California Baptist University, USA Prof Diedrich Prigge, California Baptist University, USA Prof. K. Kajimo-Shakantu, University of Free State, RSA Prof David Edwards, Birmingham City University, UK Prof A Gibb, Loughborough University, UK Prof G Ofori, National University of Singapore, Singapore Prof C Monson, University of Washington, USA Prof Theodore Haupt, University of Kwa-Zulu Natal, Durban Prof C Cloete, University of Pretoria, RSA Prof David Root, University of Witwatersrand, RSA Prof C Trois, University of Kwa-Zulu Natal, RSA Prof M Maritz, University of Pretoria, RSA Prof PD Rwelamila, University of South Africa, RSA Dr S Zulu, Leeds University, UK Dr N Chileshe, University of South Australia, Australia Dr S Mohamed, Griffiths University, Australia Dr. O.O. Ugwu, University of Nigeria, Nigeria Dr Geraldine Kikwasi, Ardhi University, Tanzania
Regards
Ferdinand Fester (ASOCSA President)
Prof Theo C Haupt (ASOCSA Vice-President)
Ms Ferial Lombardo (ASOCSA Conference Organizer)
CONTENTS Session: Construction Education Analysis and Evaluation of Curriculum Development for the Construction Management Programme (CMP) Breda Strasheim & Jan Wium …….....……………………………….....
01
Higher Education for future Built Environment professionals: barriers experienced by Property Development students in KwaZulu-Natal, South Africa Vittorio Tramontin, Mdunyiswa Mfundo Wanda, Claudia Loggia, Theo C. Haupt …………..…..…………………………..………………………
14
Curriculum Review for the Property Development (PropDev) Programme at the University of Kwa-Zulu Natal (UKZN) – A Case Study Theo Haupt and Ephraim Zulu…….....................................................
27
Competency of Built Environment graduates C. Beveridge, B. Botha, R. Gerber, R. and F.Geminiani……...………
40
Studio based learning in Construction: Turning the Titanic Theo C. Haupt and Nishani Harinarain...............................................
54
Student Engagement in Studio Based Learning in Construction Theo C. Haupt and Nishani Harinarain…..……………………..………
66
Determinants of Skill Shortages of Construction Workers at the Eastern Cape Province of South Africa A. Aiyetan………………………………………….………………………
78
Challenges for Higher Education for energy efficiency in buildings in KwaZulu-Natal, South Africa Vadinie Moodley, Vittorio Tramontin……………………….……………
90
The Effect of Repeating a Test after an Initial Poor Performance on Students’ Subsequent Performance Theo Haupt and Ephraim Zulu……………………………...…………...
103
Determinants predicting mathematics success for Civil and Built Environment students at a Comprehensive University JN Agumba and T C Haupt…………………………….………………
115
Session: Sustainable Construction and Infrastructure Delivery Stakeholder Conceptualizations of Sustainable Design and Construction in Tanzania Victoria Marwa Heilman………………….…...…………................……
127
Sustainable Energy in the South African Built Environment G.L. Nel, G., B.Botha, C.M.Adendorff……………………………..…….
139
The primary factors contributing to the low implementation of green building practices in South Africa Nishani Harinarain ………………………………………….……............
157
Cost and Benefits Analysis of Sustainable Building Production in Western Cape Province, South Africa Julius A. Fapohunda, Bashir O. Ganiyu, Bukola H. Solanke, Annelise Nicholson, and Ajibola O. Fatokun………………………...…………….
169
Challenges in implementing sustainable building practices in the residential sector Brightman Smiso Ngcobo and Nishani Harinarain….…………………
183
The final users’ perception of the indoor environmental quality of green buildings: a case study in KwaZulu-Natal, South Africa Vittorio Tramontin, Ashley Parbhoo, Claudia Loggia…………..………
192
Public Capital Investment in Infrastructure Development and Economic Growth in Ethiopia Theo C. Haupt and Denamo Addissie……………………….………….
205
The use of real-time energy data in the establishment and financing of energy efficient smart building in South Africa D. Hayman, C. Loggia*, V. Tramontin……………...……………………
218
Incorporating Risk Management into the Design process to reduce risks associated with Buildings adapative reuse Ayman A. E. Othman ,Farah I. H. Balaha, F Fester, T Haupt…………
230
Session: Development and Innovation A Review on Information Interface Management in Construction Design Process – Importance, Challenges and Management Methods Senthilkumar Venkatachalam and Saleh Abu Dabous………….…….
244
Challenges of artisan skills development in the construction industry Makhetha L. Botsane and Kahilu Kajimo-Shakantu............................
254
A Theoretical perspective for emerging contractors' economic sustainability: A Strategic Management Approach Anugwo Iruka Chijindu, Shakantu Winston ….…………..…………….
267
Assessing progression in the project management profession from the past 3 decades: A Retrospective Study M.S. Mohale, C. Loggia, T.Haupt ………….………..…………………..
277
SWOT analysis as a means for identification of project delivery objectives driven by non-monetary incentives R. Ndihokubwayo…………………………………….……………………
290
The shortage of trained artisans in the construction industry within Port Elizabeth D. Mulder, B. Botha, R. Gerber and F Geminiani………..…………….
306
Theoretical Framework for optimising construction role-player performance A. Hefer, W. Shakantu, F. Geminiani FL and B.Botha……….………..
319
Causal Layered Analysis of Nanotechnology Developments Directly affecting the South African Construction Industry towards 2020 D.J. Rishworth, C.M. Adendorff, and B. Botha………...……………….
342
Session: Construction Practices and Ethics Alcohol abuse and illicit drug use on construction sites: a norm or an emerging issue? Geraldine J. Kikwasi …………………………………...…………………
363
Model for exploring women’s motivation for getting into business in the Tanzanian construction industry Nyamagere Gladys Sospeter….…………………...…………………….
373
Accident cost estimation relationship between direct and direct costs Theodore C. Haupt and Elke Hefer……………...………………………
387
Gender Perception on the Effects of Substance Abuse: A Case of Students at a Comprehensive University Justus N. Agumba ……………………..…………..……………………..
408
Influences of Stakeholders’ Power on their Participation in Health and Safety Risk Management in Construction projects in Tanzania Sarah Phoya, Harriet Eliufoo…………………..…………………………
421
"Louisiana is under stench" An investigation into the tender process of dry sanitation units in the UGU municipal district Ravi Chetty and Nishani Harinarain……..……………….….………….
435
How much is enough? A pilot study of the cost of construction health and safety Theodore C. Haupt and Elke Hefer…………………………..………….
448
Session: Project Environment The financial impact of fast-track construction A. Potgieter, B. Botha, A.Hefer,, R.Gerber…………...…………………
458
Assessing the construction sector contributions to the South Africa economy Babola, Buys & NcwandI………………………………………………….
475
Adjudication as an Alternative Dispute Resolution Process on Public Sector Construction Contracts in South Africa: the Current State M.C. Mewomo and M.J. Maritz……………..……………………………
487
Improving procurement management practices in the public sector. A study of Eastern Cape Province Ncedo Cameron Xhala and Kahilu Kajimo-Shakantu……….………...
497
Integrating Kano Model and Quality function deployment as a hybrid tool towards capturing client requirements in the design process Ayman A. E. Othman , Karim El-Dalil, F Fester, T Haupt…………..…..
510
page 1
ASOCSA 2015 – 26
Analysis and Evaluation of Curriculum Development for the Construction Management Programme (CMP) J A vB Strasheim and J Wium
[email protected] /
[email protected] Department of Civil Engineering University of Stellenbosch Private Bag X1 MATIELAND 7602 South Africa Tel +27 21 808 4435 / +27 21 808 4348 Cell +27 83 289 487 / +27 82 335 7733
ABSTRACT Background The Construction Management Programme (CMP) is a continued professional development programme for construction industry middle level managers. It has been providing a four week personal development and educational programme for construction managers since 1976. The programme is presently presented on an annual basis at Stellenbosch University and caters for the Building as well as the Civil Engineering sectors of the industry. Purpose of the Paper The typical format of a management development programme curriculum focused on middle managers in the construction industry is reviewed. The approach adopted for the CMP in dealing with the requirements of andragogy as well as the dichotomy of focusing on business as well as project and engineering management curriculum content, is discussed. The CMP curriculum has evolved and has been updated over the period of nearly thirty years since the programme started. The main purpose of this paper is thus to review the development of the curriculum and the didactical approach to over the recent past and to provide pointers for future updates of the curriculum as well as modifications to the didactical approach adopted.
Proceedings: 9th Built Environment Conference
2-4 August 2015, Durban, South Africa
ISBN 978-0-620-67120-0
page 2
Research methodology and implications The research on curricula was conducted by referring to selected archives of the CMP programme as well to other resources outlining the typical components of generic programme curricula in use. The impact which technical as well as technological change has had on the time and resources allocated per curriculum topic is documented. The structuring of the curriculum to accommodate the teaching and study of various topics as well as tutorials and group activities is also reviewed. Findings based on the empirical research By comparing the past and present curriculum of the CMP with other similar curricula, some proposals for modification of the present curriculum in the future are formulated. Practical implications and outcomes The outcome of the research is the provision of a reference document to be used by the CMP management for the planning of future updates of the curriculum. Keywords Education & training; Construction and engineering management, Curriculum development, Andragogy, Student-Directed Teaching List of notations and acronyms 1. CMP - Construction Engineering Management Programme 1.1 The Construction Management Programme (CMP) The Construction Management Programme (CMP) is a programme designed to develop middle management for the South African construction industry. It is a four week residential programme which covers a wide range of modules dealing with personal development, the construction business environment, business management and project management. The programme was started in 1976 at the Graduate School of Business at the University of Cape Town and has been presented on a regular biannual basis since then. Faculty members for presentation of modules (academics as well as practicing engineers and managers) are drawn from a selection of institutions and organisations in South Africa and around the world.
Proceedings: 9th Built Environment Conference
2-4 August 2015, Durban, South Africa
ISBN 978-0-620-67120-0
page 3
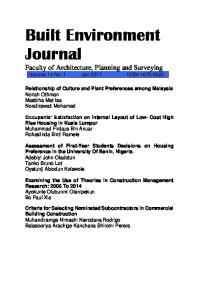
Since 1987 the programme has been presented at Stellenbosch University. The programme is being presented on an annual basis since 2008. 1.2 Outline of the analysis of the curriculum of the CMP The purpose of this paper is to provide an analysis of the development of the curriculum of the CMP and to compare the present curriculum content with a typical generic engineering management curriculum. In a didactical sense the CMP contains important elements linked to andragogy (the theory and practice of the education of adults). It thus contains elements of student-directed teaching technology as well as constructivism (students constructing their own understanding and meaning referred to personal experience of study material). The adopting of this approach focuses on structured as well as unstructured group work, brain storming sessions, a 'challenge session' where students need to solve a set of physical problems related to construction as well as daily and weekly formal written and oral feedback on the knowledge accumulated by students. Some of the detail aspects of the didactical aspects of the CMP are discussed in the sections below. 1.3 Structure of the CMP curriculum The overall structure of the CMP curriculum is shown in Figure 1. The key components of the curriculum and the activities associated with it are the following: The central theme of the CMP event The private sector business entity or public sector organisation (the firm) which initiates and supports selected construction related activities The construction project with all its ancillary elements Business management Tools and Techniques which are used both in the business as well as project focused business process and management process activities Selected components of the business environment which impact on the firm The synthesis and evaluation process which the delegates are subjected to. The weekly change of group membership for group work. Delegates from various industry disciplines and groupings are exposed to each other through interaction and collaboration in group assignments. The CMP forms a strong think tank for addressing industry problems through the annual theme.
Proceedings: 9th Built Environment Conference
2-4 August 2015, Durban, South Africa
ISBN 978-0-620-67120-0
page 4
ucture Figure 1 CMP Curriculum Stru
Proceedings: 9th Built Environment Conference
2-4 August 2015, Durban, South Africa
ISBN 978-0-620-67120-0
page 5
2. The CMP 2015 Curriculum The CMP curriculum course modules are grouped into themes and presentation sub-themes. Table 1 shows the themes into which the course modules listed in Table 2 are grouped. Table 1: CMP 2015: Weekly Themes and Sub‐Themes
Core Business Knowledge Innovation Business Management Leadership Production Management Project Management Environmental Change Global Perspectives Table 2: CMP 2015 ‐ Course Modules
Aspects of the Business Environment Business Leadership Business Management Communication Construction Business Management Leadership through Creativity and Innovation Financial Management Human Resource Development Public Private Partnerships Management Accounting Project Management Strategic Management System Failures in Engineering Systems Thinking Synthesis & Implementation Final Presentations for External Adjudicators Seminar with Alumni Detail aspects of the CMP curriculum which make it unique include:
Proceedings: 9th Built Environment Conference
2-4 August 2015, Durban, South Africa
ISBN 978-0-620-67120-0
page 6
Personal stress assessment workshop under Human Resource Development. Monitored team building exercise with video and facilitator feedback under Leadership Development. The Communication module consists of a number of components i.e. report writing, (Grant and Borcherds, 2008) presentation skills, interacting with the media as well as a formal personal interview with a media personality recorded on video. Role playing / acting exercise with video recording and assessment is also included. Presentations and panel discussions using selected internationally renowned educators in the field as well as high profile construction business leaders. Course module feedback and recording by students. Recording and presentation of a learning synthesis by students. Feedback from delegates on the evaluation of faculty members and module contents.
Some of these aspects are expanded on in paragraphs below. 3. Generic engineering management curricula Appendix A contains an outline of a typical Engineering Management curriculum as outlined in Mazda, 1998. When this is compared with detail aspects of the present CMP 2015 curriculum outlined in Table 1 and Table 2, the comparison shows that most of the curriculum aspects are covered by the CMP curriculum with the exception of:
personal time management the Financial management curriculum which does not cover all the topics listed in the generic curriculum
Engineering management topics such as manufacturing management, product marketing as well as mathematical modelling of business processes are deemed to fall outside the scope of the CMP.
4. Course modules where change and modernisation has taken place A number of modules have been introduced into the CMP and also existing modules have been updated to address changes in the management environment as well as required skill set of managers in the construction and engineering industry. These include:
Proceedings: 9th Built Environment Conference
2-4 August 2015, Durban, South Africa
ISBN 978-0-620-67120-0
page 7
4.1 Strategic thinking and scenario planning The well-known presenter on strategic dialogues Chantel Ilbury provides insight into this approach to Scenario Planning and Strategic Thinking based on the book Ilbury (2007). 4.2 Financial management In 2013 the Financial Management module was revised and the basic bookkeeping component of the module removed. The focus is now on 'Finance for non-financial managers'. The module now includes topics which lead students to be able to: Identify the drivers of value within the context of the company Understand and develop appropriate responses to issues identified in the financial statements Calculate, understand and develop appropriate responses identified during the calculation of financial ratios Identify and manage the drivers of cash flow of the company, given the nature of the industry Calculate the Break-even, Discounted Break-even, Net Present Value and Internal Rate of Return of identified projects Calculate the value of the company using the Discounted Cash Flow Method Calculate the Weighted Average Cost of Capital and Return on Equity A module on the publically listed companies on the Johannesburg Stock Exchange which is updated on an annual basis is also presented. Since 2009 a computer laboratory tutorial session exposing students to spread sheet based discounted cash flow calculations as well as financial ratio calculations and interpretation was added to the suite of financial modules. A review of the didactical approach adopted for the financial management modules indicate that a teaching mode is still prevalent and that the student centred learning approach components of the module needs to be extended and enhanced. 4.3 Labour relations management With the focus on the challenging South African labour environment students completing this module need to take note of:
The meaning of Employment Law and Labour Relations, both locally and internationally. Challenges of globalisation and international integration to determine the possible impact on the Engineering Sector. Implications of the interaction between changes in one or more of a wide range of macro-economic forces.
Proceedings: 9th Built Environment Conference
2-4 August 2015, Durban, South Africa
ISBN 978-0-620-67120-0
page 8
The importance of distinguishing between disputes of ‘right’ and ‘interest’ and the different mechanisms used to resolve such disputes, such as arbitration, adjudication and ‘power-play’. The impact of ‘collective bargaining’ in South Africa and the influence of registered trade unions. The proportionate income differentials and comparative wage justice.
Reference is made to the book by Van Niekerk (2012) as well as the GilesFiles web site maintained by Graham Giles. 4.4 Systems thinking The field of systems theory represents a logical approach to support the understanding of the complex world of organizations, including operations and projects The field studies systems from the perspective of the entire system, its various subsystems and the recurring patterns in the relationships between the subsystems. Students are required to: appreciate the inherent complexity in modern business decisions understand and articulate the different approaches to systems thinking be able to apply systems thinking to reduce complexity and enhance decision making be able to create basic casual loop diagrams to describe various systems be able to develop intervention strategies to improve system behaviour, based on insight gained from a Causal Loop Diagram and the process required to develop the diagram. 4.5 Infrastructure development funding Infrastructure funding and the role played by financial institutions in infrastructure spending have been addressed for the past 3 CMP events. Aspects dealt with include: The role that financial institutions can play in infrastructure projects The vision of financial institutions for project financing The requirements for project financing Securing project funding and the industry sectors that financial institutions will consider for funding The risks that financial institutions identify 4.6 Sustainability and Waste management With the increased focus on environmental issues a sub-course module on waste management was introduced to the CMP in 2014. Course participants were required to:
Proceedings: 9th Built Environment Conference
2-4 August 2015, Durban, South Africa
ISBN 978-0-620-67120-0
page 9
understand the volume and types of resource consumption in construction processes be able to evaluate a construction or production processes from a value-adding perspective understand change processes for reduced waste play a leadership role and the long-term perspective of waste management understand the role of standardization be in a position to initiate activities for waste reduction In 2015 this module was replaced by a module addressing sustainability in corporate governance and the formal reporting associated with these processes. The contents of this module was: External pressures on introducing formal disclosures: King III, Companies Act, JSE prescriptions Social & Ethics Committee UN Global Compact – 10 Principles Global Reporting Initiative GRI G4 International Integrated Reporting Frameworks o (JSE SRI Index) o (CESA Sustainability Reporting Framework)
5. Course module feedback and recording by students In line with the stated aim of student directed teaching, students are required to complete a set of course module 'logs' on a daily basis. These are submitted on the student learning platform and can form the basis for synthesis and other reports on module content required.
6. Recording and presentation of a learning synthesis by students A formal content and learning implication synthesis by students has formed an important part of the structured learning and course content assimilation process used in the CMP. Up to CMP 2005 a weekly two hour synthesis session was staged where a general discussion of the modules presented in the week was done and selected students were asked to respond to questions posed by the faculty as well as the students. In 2005 this process was formalised where students were required to prepare a one to two page synthesis report summarising the content of the modules of the week and indicating how the knowledge gained could be synthesised across modules and indicate possible application is the business and personal environment of the candidate. The input of students is also now evaluated and forms part of the overall mark for the CMP.
Proceedings: 9th Built Environment Conference
2-4 August 2015, Durban, South Africa
ISBN 978-0-620-67120-0
page 10
7. Feedback from delegates on the evaluation of faculty members and module contents Evaluation feedback from students on the content of modules as well as the lecturing faculty members has always formed part of the CMP. Since 2009 this feedback has been done using the learning platform systems of the University of Stellenbosch.
8. Development of modules and distribution of module content The development of module content as well as introduction of new modules as well and discontinuation of some modules was required to keep the CMP relevant with reference to the changing business and technological environment. 8.1 Pre-programme workshops A set of pre-programme workshops focusing on basic computer literacy as well as the use of typical project planning and management software was held during the two days preceding the CMP until 1999. With the growth of the exposure of a typical candidate to computer applications in the workplace starting with the introduction of personal computers from 1985, the requirement for these workshops fell away and they were not presented after 1999. 8.2 Provision of tablet computers Up to 2012 all the CMP course material was supplied to the delegates in printed form i.e. text books or printed notes and copies of presentations on a weekly basis. Since 2012 the students have been issued with tablet computers (Apple iPad and later Samsung Galaxy). All the textbooks (using e-reader software), notes as well as copies of presentations are now available to the students in digital form. Reference can be made to the learning platform data as well as internet cloud storage (Dropbox) to provide updated or additional documentation as required. Since notebook computers have become common in the business environment most students use their own notebooks to prepare documents and access the learning platform and other internet resources. 8.3 Use of learning platform systems Since 2009 use has been made of the leaning platform systems of the University of Stellenbosch to distribute learning material to students as well as administrating assignments as well as student feedback. The WebCT system was originally used but was replaced by SunLearn based on the open source Moodle system.
Proceedings: 9th Built Environment Conference
2-4 August 2015, Durban, South Africa
ISBN 978-0-620-67120-0
page 11
8.4 Candidate evaluation and overall CMP mark Personal as well as group assignments are graded and added to the finance test mark to provide an aggregate mark for each candidate attending the CMP.
9. Conclusion and Recommendations The tried and tested general content, format as well as mode of delivery of the CMP have proved to have stood the test of time. A selection of CMP modules have been updated and new modules added to reflect the change in the management skills requirement of managers in both the public and private sectors the Construction industry. The proposals for consideration on updating the present CMP content which have been identified are: 1. The introduction of a module focusing on personal time management 2. The updating of the Financial Management module to make it more streamlined and bring it in line with course modules offered in the public domain. 3. The enhancement of the student-centred components of the Financial Management Module. 4. The introduction of a module which addresses transformation in the construction industry It is recommended that at the annual review of the CMP curriculum focus is placed on developments in the industry as well as the business environment in general to determine what changes are required to the curriculum at any given point in time. 10. References CMP – CMP Academic Manuals 2005 to 2014 Grant, T & Borcherds, R, Communicating @ Work. Van Schaik Publishers, 2008. Harris, F & McCaffer, R, Modern Construction Management.. Blackwell,, 2014. Ilbury, C. & Sunter, C. (2007) Socrates and the Fox: A Strategic Dialogue. Human & Rousseau, 2007 Mazda, Fraidoon. Engineering Management. Addison Wesley Longman, 1998 Sherwood, D. Seeing the Forest for the Trees: A Manager's Guide to Applying Systems Thinking. Nicholas Brealey Publishing, 2002 Van Niekerk, André et al. Law@work (2nd ed). LexisNexis, 2012 CMP web site: http://www.cmp.sun.ac.za accessed July 2015.
GilesFiles - Labour relations reference web site by Graham Giles http://www.GilesFiles.co.za. accessed July 2015 Moodle Open Source Software for Online Learning – web site https://moodle.org/ and https://moodle.com/ accessed July 2015 Blackboard Learning System -WebCT site:http://www.webct.com/ accessed July 2015.
Proceedings: 9th Built Environment Conference
by
Blackboard
2-4 August 2015, Durban, South Africa
Inc.
web
ISBN 978-0-620-67120-0
page 12
Appendix A Engineering Management ‐ Curriculum Content Reference: Mazda, Fraidoon. Addison Wesley Longman 1998 I
Management and Engineering Management Definitions of management
II
Business Environment
The organisation Legal and ethical considerations
Strategy and Decision Making
Strategy formulation Decision making Information presentation Mathematical models in decision making Forecasting
III
IV
Financial Management
Financial concepts Mark‐up and profit Principles of risk and return. Financial investments Taxes Business Ownership and Organisations The Language of Accounting Financial statements Financial Analysis and Ratios Basic Costing Principles Budgeting and Profit Planning Cash Budgeting Capital Budgeting and Time Value of Money Valuing a business
V
Project and Operations Management Project planning and control Manufacturing operations
VI
Marketing and Sales Management Markets and marketing Product management sales and distribution
Proceedings: 9th Built Environment Conference
2-4 August 2015, Durban, South Africa
ISBN 978-0-620-67120-0
page 13
Engineering Management ‐ Curriculum Content (Continued) VII Personal Skills for Management Leadership and motivation Team building Effective communication Time management
Proceedings: 9th Built Environment Conference
2-4 August 2015, Durban, South Africa
ISBN 978-0-620-67120-0
page 14
ASOCSA2015-018
Higher Education for future Built Environment professionals: barriers experienced by Property Development students in KwaZulu-Natal, South Africa Vittorio Tramontin1, Mdunyiswa Mfundo Wanda2, Claudia Loggia3, Theo C. Haupt4 1
[email protected],
[email protected], 3
[email protected],
[email protected] 1,2,3,4 School of Engineering, Property Development Department, University of KwaZulu-Natal, Howard College, Durban 4041, South Africa. (Tel.: +27 312601183. Cell.: +27 745897223) ABSTRACT AND KEYWORDS Purpose: This study aims to investigate the barriers experienced by Property Development students in KwaZulu-Natal that prevent them from graduating within the minimum prescribed period, and to provide possible pointers to overcome them. Design/methodology/approach: A mixed approach was used through questionnaires submitted to the graduates in the last four years. Results were enhanced through semistructured interviews with Honours class of 2014 and lecturers. Research limitations: The context of the analysis focused on the University of KwaZulu-Natal. The limited literature available on construction education in South Africa represented an issue for research in this field. Findings: The main barriers experienced by students were found to be academic issues, increased workload, problematic transition from secondary education, lack of facilities, time management. Possible remedial actions were eventually outlined accordingly. Proceedings 9th Built Environment Conference Higher Education for future Built Environment professionals: Barriers experienced by Property Development students in KwaZulu-Natal
Proceedings: 9th Built Environment Conference
31 May - 2 June 2015 Durban, South Africa ISBN ……………………..
2-4 August 2015, Durban, South Africa
ISBN 978-0-620-67120-0
page 15
Response to conference theme: The identification of the actual barriers faced by students is critical for the development of effective construction education techniques and methods. Practical implications: This study provides the actual students’ perception of the main barriers they experienced during their undergraduate curriculum and outlines possible remedial actions that should be taken into consideration for the curriculum development of the Programme. Keywords: Challenges in Education, Property Development, Student Perception. 1. INTRODUCTION Higher education institutions everywhere experience some degree of difficulty in achieving their vision, mission and goals. In developing countries such as South Africa, the challenges for higher education institutions and students are numerous and often complex, being closely related to profound socio-economic issues. Evaluating these barriers from a student and graduate perspective can represent an important step towards the identification of their causes and the definition of possible effective solutions for improving student performance and preparation. The critical skills shortage experienced in South Africa in the first st decade of the 21 century affected education for the built environment professions, since tertiary education institutions struggled to staff programmes, as observed by Pearl (2007). He highlighted the importance of suitably equipping and supporting students employed by education providers as a crucial measure to protect the industry. With the registered increase in enrolment, South African universities should focus on improving student performance. Improving student access and success is in fact a challenge for the university sector and must become a priority focus for national policy and the institutions (DHET, 2013). This aim is particularly critical when considering the relatively low success rates and related low graduation rates that have characterised South African Universities (DHET, 2013). In the journey the students undertake to become professionals, they often experience challenges that hinder them from performing well and end up failing to graduate within the minimum prescribed time. According to past research (Frymer, 1992), several mechanisms were adopted for monitoring students at risk. The majority of them came from disadvantaged backgrounds and they became students at risk not only because they were under-prepared for higher institutions, but also because of language barrier, financial difficulties and lack of family support (Ibid). College students are also stressed due to the transitional nature of college life, which implies to adjust to a new social environment that is often far from home (Ross et al., 1999).
Proceedings: 9th Built Environment Conference
2-4 August 2015, Durban, South Africa
ISBN 978-0-620-67120-0
page 16
Previous research observed that the performance of South African Quantity Surveyors, which is traditionally the primary career undertaken by graduates in Property Development at the University of KwaZulu-Natal (UKZN), was not adequate (Pearl, 2004). One of the possible reasons might have been related to the pre-registration training provided by tertiary education institutions. Limiting the context of the investigation to KwaZulu-Natal, the rationale of this paper is therefore to investigate the main barriers that affected the performance of Property Development students at the University of KwaZulu-Natal and hindered them from graduating within the minimum prescribed period. In particular, the main objectives of the study are to identify the major barriers experienced by students and to propose possible pointers for remedial actions. The results of the study could therefore aid to improve the practice within the Programme, the performance of students and the preparation of future graduates. The research adopted a mixed method using survey questionnaires directed to graduates (from 2011 to 2014) and fourth-year students in 2014. Further semi-structured interviews were conducted with a sample of students and academic staff to gain a more in-depth understanding of the problem. After this introduction, a review of the literature on the main barriers faced by students in higher education is presented. Then the methodological approach adopted for the study is explained in detail. The following section comments on and discusses the main results achieved, and finally conclusions and recommendations are proposed. 2. BARRIERS FOR STUDENTS IN TERTIARY EDUCATION Universities create new possibilities through research and shape new responsible citizens through the process of teaching and learning (Oakeshott, 2001). However, students are often more concentrated on formal assessment and final mark result, without considering entirely the learning opportunities offered by higher education. Usually, students who underperform in tests and exams, fail the modules and this leads them into failing to graduate within the minimum prescribed time. In South Africa, 25 public universities offer a wide range of study and research opportunities for both local and international students. The country started an important restructuring of the higher education system in 2003 to widen access to tertiary education and reset the priorities of the previous system. A combination of academic and vocational diplomas, vocationally oriented education programmes and traditional theoretically oriented university degrees forms the current post-school system offered (Brand SA, 2012). However, the Department of Higher Education and Training stated that South African universities are characterised by relatively low success rates (74% in 2011 compared to a desired national norm of 80%) which resulted in a graduation rate of 15% in 2011, far below the international
Proceedings: 9th Built Environment Conference
2-4 August 2015, Durban, South Africa
ISBN 978-0-620-67120-0
page 17
norm of 25% for three-year degree programmes in contact education (DHET, 2013). Concerns have therefore been raised in terms of productivity of the system. Particularly students from poor background have showed poor graduation and throughput rates (Ibid). Previous research (Salmi, 2012) observed that high school graduates were not well prepared for university-level education in terms of academic competencies, information, motivation and social capital. However, other reasons must be searched within the university system and factors related to university students during their degree course. With regard to the Quantity Surveying profession, which is traditionally the professional career undertaken by most Property Development graduates at the University of KwaZulu-Natal, past research concluded that the performance level of South African Quantity Surveyors was poor (Pearl, 2004). It was observed that one possible reasons could have been related to tertiary education institutions that provided pre-registration training. Also, failure rates for council examinations for accreditation were high, generating considerable anger amongst candidates, particularly due to the absence of a previous coherent examination preparation process (Pearl, 2004). These shortcomings in the expertise of professionals and trainingprofessionals may depend on shortfalls in the tertiary education system and barriers experienced by the students within their degree course. Despite a general increase in undergraduate university enrolment, low academic achievement and high attrition rates persist for many students (Tinto, 1994, as cited in Hsieh et al., 2007). Student failure and retention are leading challenges faced by tertiary education institutions. Therefore, searching to understand the reasons for attrition is of critical importance (Allen, 1999, as cited in Hsieh et al., 2007). According to Knox et al. (1993, as cited in Pascarella and Terenzini, 2005), the barriers experienced by higher education students in the international context could be identified as personal (self-concept, self-esteem, self-discipline, social life and selfdirection), non-autonomy related (financial and family), and academic (lack of time management and adjusting to new teaching methods different from the high school ones). Other authors considered especially self-efficacy and goal orientation as the main factors influencing students’ underachievement (Hsieh et al., 2007). Bean and Vesper (1990, as cited in Allen, 1999) assigned to factors external to the institution (particularly personal and environmental variables, e.g. high school ranking, parents’ education, financial aid, institutional impression, family emotional support) a major role in affecting both attitudes and decisions. In addition to this, Allen (1999) highlighted the importance of motivation to succeed in tertiary education. Motivation can come from some of the external variables and persistence come from both variables and motivation. The specificity of the socio-economic conditions in a developing country such as South Africa increases the complexity of the barriers for students. Additionally, the variety of the cultural backgrounds of students in the same class creates additional challenges.
Proceedings: 9th Built Environment Conference
2-4 August 2015, Durban, South Africa
ISBN 978-0-620-67120-0
page 18
Underachievement is a significant predictor of student inability of graduating in the minimum prescribed time (Astin et al., 1997). Frymier and Thompson (1992) listed eight major challenges that contributed to students not to graduate within the minimum prescribed time at university: academic, financial, social challenges, language, lack of time management, responsibility, independence, life skills. In particular, the first four factors were identified to be the leading ones to students’ underperformance and failure. For this study, the possible barriers faced by Property Development students were categorised into four major groups, according to the findings from the review of the literature and particularly the study of Ross et al. (1999), namely interpersonal barriers, related to changes in social activities and social interaction; academic barriers, directly linked to the degree course and academic matter; intrapersonal barriers, related to psychological states and attitudes that influence decisions; environmental barriers, due to the changes in living environment. According to these categories, particular attention was dedicated in building the survey instruments to specific barriers that may most likely affect South African students. In particular, financial issues were observed to represent a major problem for higher education students that struggle to clear tuition rates (Teferra and Altbach, 2004), and financial concerns were shown to affect negatively student performance (Fryers et al., 2003 as cited in Cuthbertson et al., 2004). Also, language barriers were investigated being in general a critical aspect affecting understanding and communication in South African higher education. Specific academic barriers relating to the volume of workload, issues in the learning process and challenges of learning independently were considered an important focus within the academic category. Emphasis was also given to parental support. Family participation in students’ education was considered as predictive of students’ success by several research at international level, which observed that the more intensively parents were involved, the more beneficial the achievement effects (Michigan Department of Education, 2001). 3. METHODOLOGY The methodology adopted for this study used a convergent parallel mixed study approach combining qualitative and quantitative research. Differentiating between the two approaches is not always easy and clear cut, and the combination of both methods has the potential to intensify the study and the in-depth understanding of the problem (Fox and Bayat, 2007). Qualitative studies give more emphasis to meaning, experiences, descriptions, and are subjective, dynamic and interactive in nature (Davis, 2007). Given the aim and objectives of the research, a qualitative approach was thus essential to conduct an inquiry process of understanding of social or human problems, in order to build a complex and holistic picture and to report detailed views of informants, as observed by Creswell (1994).
Proceedings: 9th Built Environment Conference
2-4 August 2015, Durban, South Africa
ISBN 978-0-620-67120-0
page 19
A quantitative approach was used to develop an inquiry into a social or human problem based on testing theories composed of variables, measured with numbers or scores, analysed with statistical procedures, in order to determine whether the predictive generalisations of the theory might be true (Creswell, 1994). The mixed study method enabled to gain a more in-depth understanding of the participants’ facts and the identification of the most occurring factors in participants’ perceptions of situations (Leedy and Omrod, 2010). The data collection involved gathering both numeric information as well as more personal opinions and perceptions of what the students experienced at UKZN during their undergraduate study. Thus, the final database represented both qualitative and quantitative information, in line with what observed by Creswell (2013) for mixed study approaches. Two main instruments of data collection were used. A survey exploratory questionnaire was sent by email to 123 participants, who represented the sample of the study defined through a selective sampling method. This sample coincided with the Property Development Honours class students (former and current) at UKZN in the period 2011-2014. With the participants who agreed to be interviewed, semi-structured face-to-face interviews took place to investigate more in detail the barriers faced by and the personal experience of students. Semi-structured interviews were also conducted with two lecturers in the Programme in order to understand the perception of the problem from the instructor perspective. The questionnaire was organised in four sections, named interpersonal, academic, intrapersonal and environmental. The questions were based on the objectives of the study and related to the literature on the topic investigated, and contained mainly multiple choice, closed ended and declarative questions. The questions included in the interviews were mainly open-ended in order to investigate more in depth perceptions, qualitative aspects and personal opinions. The data collected were critically analysed to deduce trends and deviations reported in the form of graphs and diagrams. The answers of the interviews helped to build a better understanding in concluding the study rather than just relying on perception of statistical data. Ethical aspects were carefully considered while conducting the study. All the participants were provided with an informed consent form that explained the nature and aim of the study, the content of the questionnaire and interviews, and specified that the participation was on a voluntary basis. All the process and the data were treated with confidentiality in order to protect participants from criticism and to allow a true reflection of their views and information provided. The results were disclosed as group and not individually.
Proceedings: 9th Built Environment Conference
2-4 August 2015, Durban, South Africa
ISBN 978-0-620-67120-0
page 20
4. RESULTS AND DISCUSSION 4.1 Survey questionnaire The participants were asked to fill questionnaires that comprised four categories of barriers. The main objective was to determine from the participants the main relevant barriers experienced by students, thereby determining the conformity of the common factors under each category specified by the literature. From the selected sample, 61 questionnaires were completed and used for the data analysis. Thus a response rate of 49.6% was obtained. While investigating the intrapersonal challenges, the leading factor that was common among respondents was the financial issues they experienced during their studies. Nineteen respondents (31.2%), declared to have experienced financial related problems during the progress of their degree. This factor affected students’ mental states as they mentioned that they used to stress about not having enough financial resources to pay for their University fees. The nineteen respondents that had financial problems were black students. This barrier was mainly related to the fact that most of their parents did not afford to pay for their University fees. The second most common factor highlighted by students was the language barriers. It was found that ten of the respondents (16.4%) who had English as a non-mother tongue, had troubles in participating in class discussions, understanding the lecturers, understanding the contents that were taught in class and submitting good quality works. Thus this resulted in students getting lower marks and failing tests and examinations. Nine respondents (14.8%) who lost close persons during their studies responded that they were affected by those losses on their underperformance. Only seven students (11.5%) had suffered from serious illnesses or injuries because of which they ended up missing a lot of classes that led to them underperforming. In terms of academic barriers (figure 1), more than two third of the students (72.1%) declared to have experienced problems with adapting to the University workload. This reflected on 49.2% of the participants declaring they found first year studies very difficult, whereas only 34.4% and 6.6% of them found very difficult second and third year respectively.
Proceedings: 9th Built Environment Conference
2-4 August 2015, Durban, South Africa
ISBN 978-0-620-67120-0
page 21
Yes
Number of students
60
No o
50 40 30 20 10 0 Students who found first year studies very difficult
Students who S udents that Students who The unniversity Sttudents who Stu found second f ffound third had d problems did not receive hhad dapting to inadeequate year studies yyear studies ad academic e university asssistance faciliti es to aid very difficult v ery difficult the workload w fro om the their studies university
ure 4.1 Academ mic barriers expe erienced by Property Developm ment undergraduuates Figu
Mo ost students s (82%) decllared to hav ve taken bettween one aand two semestters to adaptt to the new environment. The transition from seccondary educatiion studies to universityy academic duties, whic ch implies a higher workloa ad, differentt teaching and learnin ng methods, need for greater committment and participation n in the cla ass, limited contact tim me with instructtors, ability of studying and learning g independe ently, was thherefore conside ered a majorr issue by m most participa ants. This ne eeds to be ccarefully taken into considerration from u university institutions in order to impplement ation measurres, as also highlighted by the Whitee Paper appropriate adapta ucation and T Training (DH HET, 2013). for Posst-School Edu Almost all the participantss (91.8%) de eclared that they t did not receive mic assistanc ce from the U University when they were underperfforming. academ Also, 77.1% 7 of the em believed d that the University U did d not have enough studyin ng facilities fo or them to usse to supportt their studies s. When the respondents we ere asked to o breakdown n their typicaal week al causes th hat influenceed their hours in order to understand the potentia d their difficu ulties in man naging the un niversity worrkload, it adaptattion time and was found that the ey declared averagely to o have dedic cated approxximately c too what is 14 hours per week to studying. However, if this data is compared ed in terms of o self-study hours from an a average student s to reeach the expecte 720 Notional N Study Hours ((72 credits)) that each h semester of the Program mme require es, it is to be noticed that first year stu udents, for exxample, are supposed to spend s an a average of 21 2 hours pe er week in tthe two n self-study, according to t the officia al handbookk of the semestters only on College e of Agricultu ure, Enginee ering and Sciience of UKZ ZN. Thus, accademic barrierss and perc ceived exce essive workload are also a related to an underestimation off the commiitment from the studentts. Studentss should nd from the vvery beginning what is th he expected level of therefore understan he time that should be dedicated d to studying in oorder to committment and th
Proceedings: 9th Built Environment Conference
2-4 August 2015, Durban, South Africa
ISBN 978-0-620-67120-0
page 22
be succcessful and not n underperrform. The ro ole and supp port of the accademic institutions and staff members is critical to clarify these e aspects annd make w is expeccted in terms s of their aca ademic dutiess. studentts aware of what With regard to o interperson nal barriers, 44 4 of the res spondents (772.13%) o experie enced time managemen m t issues, inffluenced agreed that they often ally by the tiime they use ed to spend on social activities a andd not on especia studyin ng. Almost all respond dents (96.72 2%) had pa arents that offered motivattional suppo ort to the resspondents and a that mottivation and support encouraged the res spondents to o perform bettter. Only 6 re espondents (9.84%) dies because e their parennts were agreed that they were affected in their stud divorce or sim milar. having problems at home, like d ooking at the e environmen ntal factors, only 6.6% of o the studennts who Lo lived off campus did d not have e reliable transport. Therrefore, geneerally for respondents reaching the cam pus was nott a serious issue. Studeents that n the reside ences comp plained mos stly the nois se level froom their lived in residen nce mates, which made e hard to concentrate for studyinng. Few studentts (13.1%) complained th he use of co omplex comp puter softwarre had a negativve effect on their t studies and only one e student declared to havve been negativvely affected by taking va acations durin ng the duration of the stuudies. Th he questionn naire finally a asked the sttudents to ra ank the fourr impact categorries based on o their expe erience, in te erms of likelihood of occcurrence and degree of impa act. 7%
6% 6
18%
18%
25%
244%
51%
51%
In ntrapersonal
Academic
Intraperson nal
Academ mic
In nterpersonal
Environmenntal
Interperson nal
mental Environm
Figure 4.2 Likelihood of o occurrence (lleft) and degree e of impact (right) of the four caategories
he academic c challenges were those e ones that were most llikely to Th occur and a to impac ct negatively on the perfo ormance of sttudents, folloowed by interpersonal and intrapersona l barriers. The students’’ perception of their d graduating in the minim mum prescribbed time difficultty in performing well and was the erefore prima arily related tto academic c issues expe erienced duriing their degree studies. Thiis aspect sho ould be furth her investigatted to undersstand at cademic leve el how to imp prove the cu urriculum in oorder to institutional and ac udents overc come these b barriers. help stu
Proceedings: 9th Built Environment Conference
2-4 August 2015, Durban, South Africa
ISBN 978-0-620-67120-0
page 23
4.2 Interviews Interviews enriched the quality of the information gained through the survey questionnaire and provided deeper insights on certain aspects. Seven students and two staff members accepted to be interviewed. The interviews were carried out face-to-face. Students highlighted issues related to time management that usually came along with the increased workload and lack of motivation to complete the assigned work in time. They attributed these issues in particular to confusion and little clarity on the required tasks from academic staff. Students also complained the complexity and difficulty of the curriculum at first year for learners that had never previously attended any construction related subjects at high school. This remarked the problem of the critical transition from secondary education to university that should be addressed as priority from the institution. The lack of direct experience and exposure to construction sites was complained especially at first year, where it is likely to impact positively on students for “breaking the ice” and involving them in practical aspects of the construction industry. Another aspect that should be considered for the curriculum development of the programme is the complained weight and extensive workload of accounting and economics related subjects for first year students, who had generally never attended any related subjects at high school. The help of tutors for these subjects was considered critical to succeed. Language barriers were highlighted by interviewed students, who were English non-first speakers, as highly affecting their performance due to the fact that they experienced problems in understanding lecturers’ explanation and were mostly prevented from participating in classroom discussion and asking questions. The shortage of tutors, considered fundamental for giving guidance in the preparation of formal examinations and for a better understanding of the contents of the lectures, and a closer relation with the teachers were also mentioned as other important aspects for the curriculum to be improved. The point of view of the lecturers was that the factors leading students to underperform were mainly related to language barriers, poor educational background and limited attendance. They also reported that some students complained difficulty of understanding the contents taught due to problems of communication with some lecturers and lack of preparation for the class. The lecturers highlighted the fundamental role of attendance in class, which students do not usually give the right importance to, particularly in consideration of the scarcity of South African textbooks and research production on construction related subjects. Lecturers also pointed out the rare participation of students in classroom discussion, as a result of them not having consulted the assigned preparatory readings or additional
Proceedings: 9th Built Environment Conference
2-4 August 2015, Durban, South Africa
ISBN 978-0-620-67120-0
page 24
information besides that one given in class, and the insufficient assistance provided by the university to underperforming students. Facing the mentioned barriers requires certainly a higher commitment from students, but also a reflection from academics that should address the entire curriculum. This reflection should question subject contents, teaching and learning approaches, facilities and support in order to make the curriculum more appropriate for the target of students of the programme and more focused to develop the professional skills they require in their future career. 5. CONCLUSIONS AND RECOMMENDATIONS Looking at the South African context, the main purpose of this study was to investigate the barriers experienced by the undergraduate students, particularly Property Development students at the University of KwaZuluNatal, where these barriers led them to underperform and prevented them from graduating in the minimum prescribed time. The results of a survey questionnaire investigation conducted on former undergraduate students in the Programme showed that the main category of barriers experienced during their degree studies was related to academic issues. In particular, the transition from secondary education to university workload, the lack of academic assistance from university and inadequacy of facilities for students were considered major issues. Also, financial issues, inappropriate time management, lack of commitment and self-study, language barriers and place of residence during the studies represented other main barriers emerged from the investigation. The findings from the interviews conducted with former undergraduate students and lecturers suggested in particular some valuable points with regard to student commitment and duties. Students should be advised and aware of the rules and time consumption required by academic courses, also in terms of self-study. The required level of commitment should be clear from the beginning and proper adaptation measures should be implemented during the first year to allow a sustainable transition from secondary school to the university environment and workload. As a common general rule, students should be advised to do their pre-readings before attending the classes. This could also contribute to other important aims, relating to a more active participation in class, a better time management particularly with regard to the development of the assignments according to the progress of the courses. Group work activities could be helpful in this sense to create study groups and social network groups to share and discuss more critically the course material, assignments and career aspirations. These points should be implemented through proper actions of curriculum renewal that aim not only to help students perform well, but also to foster their personal and professional growth, in order for them to mature high quality skills for increasing their competitiveness in their future career
Proceedings: 9th Built Environment Conference
2-4 August 2015, Durban, South Africa
ISBN 978-0-620-67120-0
page 25
in the Built Environment. The introduction of teaching and learning methods focused more on critical thinking development, teamwork, shared learning environment, practical experience, closer relation with instructors, closer interaction with the industry, could represent possible instruments towards overcoming the barriers experienced by former students in the Programme. Also, establishing such peer-to-peer learning environment could represent an example of the tutorial-driven models suggested by the White Paper for Post-School Education and Training to enable small group interaction, capable of alleviating the shortcomings of the school system and of assisting students with the transition to a successful university career. Observing peers within the same learning environment could also strengthen motivation, self-efficacy beliefs and foster students to implement self-regulatory behaviours when underperforming. 6. ACKNOWLEDGMENTS The authors would like to thank all the students that participated in this study and the lecturers who made themselves available for the interviews. 7. REFERENCES Allen, D., 1999. Desire To Finish College: An empirical Link between Motivation and Persistence. Research in Higher Education, 40(4), 461485. Astin, A., 1997. How ‘Good’ is Your Institution’s Retention Rate? Research in Higher Education, 38, 647-658. Brand SA, 2012. South Africa’s Universities. [Online] Available at: http://www.southafrica.info/about/education/universities.htm [Accessed 2015/03/11] Creswell, J., W., 2013. Research design: qualitative, quantitative, and th mixed method approaches. 4 ed. Los Angeles: SAGE Publications. Creswell, J., W., 1994. Research Design: Qualitative and Quantitative Approaches. Thousand Oaks: SAGE Publications. Cuthbertson, P., Lauder, W., Steele, R., Cleary, S. and Bradshaw, J., 2004. A comparative study of the course-related family and financial problems of mature nursing students in Scotland and Australia. Nurse Education Today, 24(1), 373–381. Davis, M., B., 2007. Doing a Successful Research Project: Using Qualitative or Quantitative Methods. New York: Palgrave Macmillan. DHET (Department of Higher Education and Training), 2013. White paper for Post-School Education and Training. Pretoria. Fox, W. and Bayat, M., S., 2007. A guide to managing research. Cape Town: Juta and Co Ltd. Frymier, A., B. and Thompson, C., A., 1992. Perceived teacher affinityseeking in relation to perceived teacher credibility. Communication Education, 41, 388-399.
Proceedings: 9th Built Environment Conference
2-4 August 2015, Durban, South Africa
ISBN 978-0-620-67120-0
page 26
Hsieh, P., Sullivan, J., R. and Guerra, N., S., 2007. A Closer Look at College Students: Self-Efficacy and Goal Orientation. Journal of Advanced Academics, 18(3), 454-476. Leedy, P., D. and Ormrod, J., E., 2010. Practical research planning and design. 8th ed. New Jersey: Pearson Education. Michigan Department of Education, 2001. What Research Says about Parent Involvement in Children’s Education. In Relation To Academic Achievement. Oakeshott, M., 2001, The Voice of Liberal Learning, U.S.: Liberty Fund. Pascarella, T., E. and Terenzini, T., P., 2005. How College Affects Students. San Francisco: Jossey-Bass. Pearl, R., G., 2007. South African Built Environment Education and the Case for Enhanced Staff Development at Tertiary Institutions. In The 2nd Built Environment Conference Proceedings, 392-403. Pearl, R., G., 2004. The architectural and quantity surveying professions in South Africa – are they suffering from a terminal illness? In proceedings of the 4th World Congress International Cost Engineering Council, Cape Town, 1-9. Ross, S., E., Neibling, B., C. and Heckert, T., M., 1999. Sources of stress among college students. College Student Journal, 33(2), 312-318. Salmi, J., 2012. Unleashing the Potential of South African Universities. Assessing the Tertiary Education Ecosystem. Centre of Higher Education Transformation. Teferra, D. and Altbach, P., G., 2004. African higher education: Challenges for the 21st century. Higher Education, 47(1), 21–50.
Proceedings: 9th Built Environment Conference
2-4 August 2015, Durban, South Africa
ISBN 978-0-620-67120-0
page 27
ASOCSA2015 -77
Curriculum Review for the Property Development (PropDev) Programme at the University of Kwa-Zulu Natal (UKZN) – A Case Study 1
Ephraim Zulu (
[email protected]) and Theo C 2 Haupt (
[email protected]) 1 School of Engineering, Property Development Department, University of Kwa-Zulu Natal, Howard College, Durban 4001, South Africa (Tel.: +27 312602719, Cell.: +26 09690560) 2 School of Engineering, Property Development Department, University of Kwa-Zulu Natal, Howard College, Durban 4001, South Africa (Tel.: +27 312602712, Cell.: +27 826863457) ABSTRACT AND KEYWORDS Purpose of this paper To report on the curriculum review workshop of the Property Development programme at UKZN Design/methodology/approach A one day workshop was conducted by Property Development staff at UKZN to establish the desired profile of a Property Development graduate, establish the learning outcomes required to produce such a graduate and identify any gaps in the existing curriculum and align any such gaps to meet the desired learning outcomes Findings It was established that the Property Development curriculum at UKZN was ill equipped to produce a graduate who would meet the construction industry requirements at graduation and the reliance on the instructive learning approach is not likely to produce a graduate with desired skills and competences
Proceedings: 9th Built Environment Conference
2-4 August 2015, Durban, South Africa
ISBN 978-0-620-67120-0
page 28
Research limitations/implications The paper is based on a single case and may not be generalised Practical Implications The paper shows that a perfectly well organised curriculum, if critically analysed, might not be able to meet the requirements of skill and competence required by a graduate Keywords: Curriculum, Curriculum Review, Curriculum Development, Property Development 1.
INTRODUCTION
The University of Kwa-Zulu Natal had discontinued the programme of property development due to various reasons. In 2014, the programme was reintroduced. Learning from the shortfalls of years when the programme was offered, it was decided to improve the programme by redesigning its curriculum with the aim of producing graduates who would be more industry ready with some of the skills and competences possessed by working professionals but are often lacking from graduates. This is because it was noted that construction graduates were generally criticised for failing to meet the expectations of the industry experts at graduation and often required significant further training before they were industry ready. In order to produce “industry ready graduates”, it was agreed that the curriculum must first be designed with the view to do as such. A quick review of the existing curriculum suggested that while the curriculum was generally in tandem with existing best practice in any property development programme, improvements to the curriculum were possible. For example, the curriculum itself and the learning approach were found inappropriate for producing “graduate professionals” who would be industry ready at the time of graduation since the curriculum and the learning approach did not specifically address some of the skills, knowledge and competences required by a graduate to be industry ready at graduation. It was then decided to hold a curriculum review workshop to establish the exact skills, knowledge and competences required to produce “graduate professionals”. The workshop was attended by ten staff who administer the property development programme from the department of civil engineering. The workshop sought to establish the profile of the desired property development graduate, establish the learning approach best suited to creating such a graduate, establish the learning outcomes for the particular learning approach, identify any gaps that may exist in the current curriculum and align any such gaps to meet the desired learning outcomes.
Proceedings: 9th Built Environment Conference
2-4 August 2015, Durban, South Africa
ISBN 978-0-620-67120-0
page 29
The paper reports on the curriculum review workshop and starts by establishing the necessity of reviewing curricula generally. It is concluded that literature supports that team based student centred learning combined with the traditional instructive teaching approach are appropriate to produce the desired “graduate professional” as these would create a balance in knowledge, skills and competences acquired by students. 2.
THE NEED FOR CURRICULUM DEVELOPMENT AND REVIEW
University curricula are usually developed by prominent academicians and graduates who have undergone previous training (Taha, 2015). These curricula are often handed down over time with revisions along the way depending on preferences of successive lecturers. While redesigning physician curriculum in the Kingdom of Saudi Arabia (KSA), Taha (2015) argues that this method of curriculum development and review fails to meet the training needs of physicians in the Kingdom of Saudi Arabia (KSA). Hoyles et al. (1999) in looking at the balance between theory and practice in nursing education noted that there is a tendency to place more emphasis on theory rather than practice in nursing curriculum. Hoyles et al. (1999) concluded that there is a need to revise this trend and suggested early exposure to clinical practice to achieve the reversal. Taha (2015) identified four different types of curriculum namely, competency based curriculum, core curriculum with options, spiral curriculum, and adaptive curriculum. Competence based curriculum identifies key competences which need to be learnt and suggests how to teach these competences. Core curriculum with options identifies topics that are essential and integral to the curriculum and therefore must be learnt. Optional topics are added which the learner can choose to do. Spiral curriculum covers basic science principles in the early stages of learning which are reinforced through the curriculum as the learner progresses. An adaptive curriculum does not permit a learner to progress to the next stage without understanding the core principles. This ensures that the learner acquires all the required knowledge. These different types of curriculum can be integrated to produce a curriculum which bares elements of two or more of the types. Regardless of curriculum type, there is always a need to regularly review the curriculum to ensure it still meets the intended objectives. Different approaches to curriculum review exist and are mostly based on the methodology for creating new curriculum. It is possible to redevelop curriculum meeting all stakeholder requirements from existing modules without the need to redevelop everything (Schlingensiepen, 2014). For example, Mikami et al. (2010) while trying to meet the shortage of game developer graduates at Tokyo University of Technology in Japan were able to develop curriculum by combining traditional teaching curriculum of
Proceedings: 9th Built Environment Conference
2-4 August 2015, Durban, South Africa
ISBN 978-0-620-67120-0
page 30
lectures with exercises in a game development programme which was strongly welcome by the game industry. Traditionally, curricula are developed by prominent academicians in the field with some feedback from graduates who have undergone previous training. This mode of curricula development has been criticised for failing to meet the true needs of graduates (Taha, 2015). O’Shea et al. (2015) while investigating the effect of an integrated curriculum derived from different nursing associations in the United States of America (USA) found evidence of increased knowledge in a small sample of nursing students subjected to an integrated curriculum compared to a control sample which did not. Changing needs of professionals should therefore be met with a review of curriculum which should aim to produce the requisite competences.
3.
COMPETENCE BASED CURRICULUM
Competence based curriculum has been described as a curriculum which focuses on competences to be acquired by the learner rather than on predefined disciplines and prepared lectures (Schlingensiepen, 2014; Taha, 2015). Storey (1998) described a similar methodology for curriculum developing dubbing it function analysis but with the same essence of establishing current best practice (competences) from job holders by asking them simple but searching questions. He added that these current best practices need to be balanced with future expectations. The identification and collection of competences or industry best practice is achieved through a needs assessment (Schlingensiepen, 2014) or function analysis (Storey, 1998). The needs assessment or function analysis is done through surveys, workshops, interviews, questionnaires etc. (Schlingensiepen, 2014; Taha, 2015). The identified competences are then broken into objectives after which the proper instruction method is chosen to teach the competences (Taha, 2015). Schlingensiepen (2014) notes that a “cleaning-up” of the resulting competences is necessary to ensure that the resulting programme is not only a vocational programme. A competence based curriculum has been advanced to be an advantageous curriculum (Schlingensiepen, 2014; Soliman et al., 2015). Soliman et al. (2015) found that clinical knowledge and skills were high when a problembased, system oriented medical curriculum was used on students from the college of medicine of King Saudi University (KSU) in the KSA. However, no control group was used to validate the casual effect of the problembased curriculum. In Kosovo and on nursing education, participatory action oriented curriculum similar to competence based curriculum was suggested in order to add professionalism to nursing care in that country (Goepp et al., 2008). Benefits of a competence based curriculum have been documented especially in the clinical sciences. Other fields of study,
Proceedings: 9th Built Environment Conference
2-4 August 2015, Durban, South Africa
ISBN 978-0-620-67120-0
page 31
it seems, still rely on the more traditional curriculum as suggested by the apparent lack of literature on the use of competence based curriculum in fields other than clinical sciences. When looking at student learning patterns, performance and long term knowledge retention while comparing team-based learning with didactic lecture based methods, Farland et al. (2015) identified skills such as communication, professionalism, teamwork, critical thinking and problem solving as necessities for inclusion in a team-based learning instruction method. Paramasivan and Muthusamy (2012) suggested that global minded engineering graduates should have competences such as adaptability, creativity and innovativeness. A competence based curriculum has been recommended for achieving some of the above suggested competences in learners. For example, as cited above, in trying to incorporate professionalism in nursing education in Kosovo, Goepp et al. (2008) suggested what was described as a participatory action, which is both team and competence based, with elements of grounded theory and student centeredness to be integrated in the curriculum. Notwithstanding the many merits of a competence based curriculum, Farland et al. (2015) found no evidence of long term exam performance when comparing a team-based learning approach to a didactic lecture approach. Further, no difference in exam score was found by Farland et al., (2015) notwithstanding that students spend more time learning in the team-based learning approach compared to the didactic learning approach. A similar problem was noted by Mikami et al. (2010) at the Tokyo University of technology when they introduced a curriculum that combined the traditional instructive teaching with a problem based approach in a game development programme were it was noted that students take long to master the skills for game development such that by the time they do, there isn’t enough time to actually develop any game. A specific solution was developed to go around this problem. Paramasivan and Muthusamy (2012) identified what they termed critical success factors in engineering education using a six-sigma methodology. They argue that these factors are necessary for the creation of an engineering graduate of global minded workforce, adaptable, creative and innovative. These factors are outcome based education (OBE), problem based learning (PBL), theory of inventive problem solving (TRIZ), project based learning, case based learning (CBL), internship and continuous quality improvement (CQI). In order to improve the Property Development (PropDev) curriculum at UKZN, a competence based curriculum was favoured to be delivered through a combination of team based student centred learning and instructive teaching.
Proceedings: 9th Built Environment Conference
2-4 August 2015, Durban, South Africa
ISBN 978-0-620-67120-0
page 32
4.
METHODOLOGY
The curriculum review was conducted through a workshop which was characterised by brainstorming and discussion of the brainstorming outputs. There were four stages in the workshop and these are: brainstorming the desired profile of a Property Development graduate (identification of competences); definition of instruction and learning approach and learning outcomes; gap analysis – identification of gap between existing curriculum and desired learning outcomes; and alignment of the curriculum (content and modules) to meet the desired learning out comes.
5.
THE WORKSHOP
The curriculum review workshop was conducted on 2nd February 2015 from 10:00 to 17:00 at the UKZN School of Engineering staff room. The agenda for the workshop was as follows: 1. Welcome remarks 2. Attendance 3. Introduction to curriculum workshop 4. Workshop outcomes 5. Profile of Property Development graduate 6. Tea 7. Definition of instruction approach and learning outcomes 8. Lunch 9. Gap analysis and alignment of curriculum 10. Assignment of teaching responsibilities 11. Wrap up and conclusion
5.1 Brainstorming profile (competences) of property development graduate The coordinator of the workshop welcomed all present and explained the reason for the workshop. The workshop started by defining the desired profile of a Property Development graduate. Each participant was given three Post-it® notes to write what they felt were the competences required of a Property Development graduate. The notes were then collected and pasted on a wall with similar competences grouped and duplicated ones omitted. More competences were solicited to add on to the existing ones.
Proceedings: 9th Built Environment Conference
2-4 August 2015, Durban, South Africa
ISBN 978-0-620-67120-0
page 33
The results are shown in figure 1 below.
Group 4
Group 2 Group 5 Group 1
Group 3
Group 6
Figure 1 Profile of a Property Development Graduate
The competences suggested as being necessary for the profile of a Property Development graduate are eligible (able to do the work), responsible, competent (able to carry out all tasks), skilled (able to apply what they learnt), independent thinker, problem solver, practical (hands on), construction expert, innovative (come up with new solutions), knowledgeable (same as construction expert), independent learner (thinker) lifelong learner, human skills (people skills – professional), forward thinking, creative thinker, leader, team player, negotiator, communicator, entrepreneur, proactive, visionary, planner (manager), administrator (manager), technical, sensitive, decision maker, culturally aware, socially responsible, resilient, adaptable (flexible). These competences were then grouped so that like items belong to the same group. A total of six competence areas were identified with the first group comprising of skilled professional, multi-tasker, human skills, negotiator, communicator, ethical (group 1). The second group comprised of knowledgeable, construction expert, responsible, practical, competent (group 2) and the third group comprised of employable and entrepreneur (group 3) while the fourth group comprised of leader, visionary and planner (group 4). The fifth group had critical thinker, independent thinker, problem solver, forward thinker, informed and lifelong learner (group 5) while the sixth and final group comprised of innovative, creative and proactive (group 6). Some researchers identified these competences as being required of graduates. For example, Goepp et al. (2008) identified the need to teach professionalism to nursing graduates in Kosovo and suggested to incorporate it in the curriculum. Farland et al. (2015) identified the need to teach skills such as communication, professionalism, team work, critical
Proceedings: 9th Built Environment Conference
2-4 August 2015, Durban, South Africa
ISBN 978-0-620-67120-0
page 34
thinking and problem solving while Paramasivan and Muthusamy (2012) while looking for critical success factors for engineering graduates suggested that for engineering students to be global minded, they need to have competences such as adaptability, creativity and innovativeness. The workshop agreed that graduates do not usually possess these competences.
5.2 Learning outcomes The workshop deliberated and brainstormed the outcomes which will be needed to achieve the competences identified above. The outcomes were grouped by year from year one to year three and defined using nontechnical terms only. It was agreed that year one should firstly introduce basic concepts and these were agreed as introduction to technology, management concepts, industry, numerate skills, drawing (visualisation, conceptualisation, representation, interpretation), mechanics, processes or sequences, staying alive (health and safety), pre-construction, financial concepts, cost concepts, making and field trips. Year two and three would still try to achieve these outcomes at increasingly advanced levels with some addition of other higher level desired outcomes. The curriculum would therefore be iterative by repeating the delivery of the desired outcomes albeit at progressively advanced levels.
5.3 Definition of instruction approach The workshop deliberated firstly on the learning approach which would best teach the identified competences to the students and what would be the appropriate learning outcomes to be sought from the lessons seeking to teach the aforementioned competences. It was noted that of the six competence areas identified, group one (figure 2 above) and group five (figure 6 above) competences were most unlikely to be taught effectively through the traditional instructive teaching approach. It was clear that the traditional instructive approach to teaching is not best suited to teaching such competences as professionalism, critical thinking, creativity, team work and problem solving among others. These competences require elements of outcome based education (OBE), problem based learning (PBL), theory of intuitive problem solving (TRIZ), project based learning, case based learning (CBL), internship and continuous quality improvement (CQI) among others if they are to be realised. It was therefore agreed to include a student centred approach with elements of the above learning approaches in order to teach these competences.
Proceedings: 9th Built Environment Conference
2-4 August 2015, Durban, South Africa
ISBN 978-0-620-67120-0
page 35
5.4 Gap analysis and alignment of curriculum Having specified the preferred outcomes to deliver the identified competences, the existing curriculum was critiqued to check whether it can be expected to deliver the desired outcomes. This was achieved firstly by pasting the existing curriculum for all the years on Post-it® notes on the wall (figure 2) and establishing whether each years’ curriculum can be reasonably expected to deliver the desired outcomes. Each of the years from first to third had ten modules. Figure 2 Existing curriculum
Year one modules were written on green post-it® notes, red for second year, blue for third year and orange for the fourth year which is also the honours year. It was established that there were mismatches in all the years and mismatched items were first put aside and later evaluated to establish whether they were relevant. All mismatched items were found to be relevant to the whole curriculum and were therefore assigned to semesters or years were they were thought to be a better fit.
Proceedings: 9th Built Environment Conference
2-4 August 2015, Durban, South Africa
ISBN 978-0-620-67120-0
page 36
Figure 3 Existing First Year Curriculum
Figure 4 Reviewed First year Curriculum
Figure 5 Existing Second Year Curriculum
Figure 6 Reviewed Second Year Curriculum
Year one (figure 3 above) was found to have seven matched items and three mismatched items. The mismatched items are Introduction to design, financial reporting and accounting which were found to be rather advanced for first years. Introduction to design and accounting were moved to the second year while financial reporting was moved to the third year. Physics and Management Concepts were noted to be relevant for first year students but were missing from the curriculum. These were added to the first year curriculum and posted in yellow (figure 4 above). Five items were grouped into one module (figure 4 above) to be taught through a student centred learning approach with elements of PBL and CBL, among others, in order
Proceedings: 9th Built Environment Conference
2-4 August 2015, Durban, South Africa
ISBN 978-0-620-67120-0
page 37
to introduce competences identified as not appropriately taught through traditional instructive approaches.
Figure 7 Existing Third Year Curriculum
Figure 8 Reviewed Third Year Curriculum
Year two (figure 5 above) was found to have four items matched and required four extra items to it. Introduction to Design and Accounting were added to year two (figure 6 above) from year one while Project Planning was added from year three. Structural Design was found to be relevant at this point while it did not exist anywhere in the curriculum and it was therefore added to year two. Five items were grouped into one module to be taught through a student centred learning approach (figure 6 above) as outlined for year one above. Year three (figure 7 above) had five matched items. Three items were added to year three from year two and one item from year one. Two new items were introduced which were not originally in the curriculum. Six items were grouped together to be taught through a student centred approach (figure 8 above) as outlined for year one above. Year four, which is the honours year was left as it originally was. Since there are no students going in the honours year this year, it will be reviewed in due course taking account of the success and effects of the changes in lower years. The resulting curriculum now looks as in figure 9 below as opposed to figure 2 above.
Proceedings: 9th Built Environment Conference
2-4 August 2015, Durban, South Africa
ISBN 978-0-620-67120-0
page 38
Figure 14 Reviewed Curriculum for the Property Development programme
6.
CONCLUSION
The workshop established that the Property Development curriculum at UKZN was not suited to delivering skills, competences and knowledge required by a graduate expected to deliver the requirements of the industry at the moment. The modules contain enough material to deliver the required knowledge but are ill equipped to offer appropriate skills and competences. The modules were revised and grouped so as to effectively equip students with appropriate skills, knowledge and competences through a competence based curriculum. Schlingensiepen (2014) equally noted that it is possible to create a curriculum meeting all stakeholder requirements without having to redesign the entire curriculum but rather utilise existing modules. However, content alone cannot teach competences such as professionalism, team work, critical thinking, problem solving etc. For these to be effectively learnt, it is necessary to depart from the instructive teaching approach to more student centred approaches such as team based learning, case based learning, project based learning and internship among others as outlined by Paramasivan and Muthusamy (2012). The workshop acknowledged this and recommended a student centred approach in the delivery of a large portion of the curriculum.
7.
ACKNOWLEDGEMENTS
The authors wish to thank the following members of staff from the College of Agriculture, Engineering and Sciences, Department of Civil Engineering, UKZN, who attended the curriculum review workshop held at UKZN: Dr. Claudia loggia – Lecturer, Dr. Vitorrio Tramontin –Lecturer, Dr. Nishani Harinarain, Lecturer; Mrs Bilkiss Alladeen – Teaching Administrator,
Proceedings: 9th Built Environment Conference
2-4 August 2015, Durban, South Africa
ISBN 978-0-620-67120-0
page 39
Ferdinand Fester – PhD candidate, Denamo Addissie – PhD candidate, Ms. Zakheeya Armoed – MSc candidate, and Mbogeni Mahole – MSc candidate.
8. REFERENCES Farland M.Z., Franks A.S., Barlow P.B., Rowe S.A., and Chisholm-Burns M., 2015, Assessment of student learning patterns, performance, and long-term knowledge retention following use of didactic lecture compared to team-based learning, Currents in Pharmacy Teaching and Learning, Available online 4 March 2015, ISSN 1877-1297, Goepp J.G., Johnson T.D., Maddow C.L., 2008, Challenges and promises for nurse education curriculum development in Kosovo: Results of an “accidental ethnography, Nurse Education Today (2008) 28, 419–426 Hoyles A., Pollard C., Lees S., Glossop D., 2000, Nursing students’ early exposure to clinical practice: an innovation in curriculum development, Nurse Education Today, Volume 20, Issue 6, Pages 490-498, ISSN 0260-6917, Mikami K., Watanabe T., Yamaji K., Ozawa K., Ito A., Kawashima M, Takeuchi R., Kondo K., and Kaneko M., 2010, Construction trial of a practical education curriculum for game development by industry– university collaboration in Japan, Computers & Graphics, Volume 34, Issue 6, Pages 791-799, ISSN 0097-8493, O’Shea E.R., Campbell S.H., Engler A.J., Beauregard R., Chamberlin E.C., Currie L.M., 2015, Effectiveness of a Perinatal and Pediatric Endof-Life Nursing Education Consortium (ELNEC) Curricula Integration, Nurse Education Today, 35 (2015) 765–770 Paramasivam S., Muthusamy K., 2012, Study of Critical Success Factors in Engineering Education Curriculum Development using Six-Sigma Methodology, Procedia - Social and Behavioral Sciences, Volume 56, Pages 652-661, ISSN 1877-0428, Schlingensiepen J., 2014, Competence Driven Methodology for Curriculum Development based on Requirement Engineering, Procedia - Social and Behavioral Sciences, Volume 141, Pages 1203-1207, ISSN 18770428, Soliman M., Al-Nassar S., Al-Shaikh G., Al- Ghonaim M., Al-Habib T., AlShelwi M., 2015, Evaluation of the reformed medical curriculum at King Saud University College of Medicine by its first graduates, Journal of Taibah University Medical Sciences, ISSN 1658-3612, Taha W., 2015, A guide to developing a competency based curriculum for a residency training program – Orthopaedic prospective, Journal of Taibah University Medical Sciences, ISSN 1658-3612,
Proceedings: 9th Built Environment Conference
2-4 August 2015, Durban, South Africa
ISBN 978-0-620-67120-0
page 40
ASOCSA2015-41
Competency of Built Environment graduates Casey Beveridge1, Brink Botha2, Robert Gerber3, Franco Geminiani4 1084
[email protected], a
[email protected],
[email protected], 4
[email protected] 1,2,3,4 Faculty of Engineering, the Built Environment and Information Technology, Nelson Mandela Metropolitan University, Port Elizabeth, 6031, South Africa (Tel.: +27 415042085. Cell.: 0845533367) ABSTRACT AND KEYWORDS Purpose The problem of this article addresses the competency of university graduate students who may find it challenging to obtain employment in periods of limited economic growth and downturns relative to the Construction Industry, as well as alternative industries. Design The study reviews literature on “employability”, career management and transferable / generic skills. The extent of the knowledge and skills developed in the B Tech CM / QS training program is evaluated and categorized to develop competency-testing criteria. This study is described as, Phenomenological in nature as it attempts to understand respondent’s perspectives and views of social reality. The data collected from the questionnaire was statistically analysed to determine the respondents’ perceptions on the level of competency of B Tech CM / QS graduate student in positions outside the “Built Environment.” Value B Tech CM and QS graduate students may have to explore employment opportunities in fields outside the “Built Environment” to obtain employment in these economic climates. The “employability of B Tech CM / QS graduate students in fields outside the “Built Environment” is therefore the focus of this article.
Proceedings: 9th Built Environment Conference
2-4 August 2015, Durban, South Africa
ISBN 978-0-620-67120-0
page 41
Findings The findings of this research will provide valuable insight into the “employability” of B Tech CM / QS graduate students. Graduate students and employers looking to hire professionals for various career positions may find this article informative. Conclusions are arrived at and recommendations are proposed. Keywords: Graduate Students; Employment 1. INTRODUCTION The study will focus on the “employability” of B Tech CM / QS graduate students in fields outside the “Built Environment” The problem addresses the university graduate/s students challenges in obtaining employment in periods of limited economic growth and downturns. 2. REVIEW OF HE RELATED LITERATURE The “Built Environment” is defined as: “The environment encompassing places and spaces created or modified by people including buildings, parks and transport systems.” (Roof & Oleru, 2008). A review of the literature published by Bridgstock, Simon, and Barrie (2009), forms the foundation of the theoretical framework, developed for this study. This study investigates and describes the factors that contribute to the “employability” of B Tech CM / QS graduate students. The criteria used to determine the level of competency of these students is established in this chapter. “Employability skills are the skills that are directly pertinent to obtaining and maintaining work.” (Harvey, 2001; McQuaid & Lindsay, 2005) They are comprised of the generic and discipline-specific skills required for performance in the work situation. (Bridgstock, 2009) “Students who have strong skills in self-management have a welldeveloped concept of their career goals and a positive, realistic evaluation of their abilities and aptitudes and believe themselves to possess a higher level of employability” (Eby, Butts & Lockwood 2003,: 689). According to (King, 2004) self-management behaviors can be divided into 3 sections: Positioning behaviors: Strategic choice of mobility opportunity – initiation of job moves; Investment in human capital – investing in training or education; Active network development, and Job content innovation – changes in methods or environment.
Proceedings: 9th Built Environment Conference
2-4 August 2015, Durban, South Africa
ISBN 978-0-620-67120-0
page 42
Influencing behaviors: Self-promotion, and Integration – making ones self more attractive to others. Boundary Management: Boundary maintenance - location of work and non-work role, and Role transition – navigating the transition between work and non-work roles” (King, 2004). Career Management Skills “Career management involves creating realistic and personally meaningful career goals, identifying and engaging in strategic work decisions and learning opportunities, recognising work / life balance and appreciating the broader relationship between work, the economy and society. It is the process of obtaining and maintaining work.” (Bridgstock, 2009:36). Discipline Specific Skills These are the skills traditionally included in university curricula to address specific occupational requirements (Barrie, 2004: 270). B Tech CM / QS graduate students will have discipline-specific skills in. Generic Skills Generic Skills include skills such as: Lifelong learning can be described as an attitude or stance towards ones self and the capability of continuous learning and reflection, which will promote further understanding of the world and their place in it” (Barrie, 2004: 270). “Graduates will be able to create new knowledge and understanding through the process of research and inquiry” (Barrie, 2004: 270). “Graduates will be able to work independently and sustainably, in a way that is informed by openness, curiosity and desire to meet new challenges and will be able to hold personal values and beliefs consistent with their role as responsible members of local, national, international and professional communities” (Barrie 2004:270). The theoretical framework developed for this study is illustrated in Figure 1.
Proceedings: 9th Built Environment Conference
2-4 August 2015, Durban, South Africa
ISBN 978-0-620-67120-0
page 43
Figure 1
Theoretical Framework The framework illustrates the relationship between the dependent variable, the degree of competency of B Tech CM / QS graduate students in careers outside the “Built Environment” and the independent variables, Selfmanagement, Career Management, Discipline Specific and Generic Skills. Figure 1 identifies the independent variables as Self-management, Career Management, Discipline Specific skills and Generic Skills. They are the factors that form the foundation for the development of the data collection tool. The tool was used to measure the perceived level of competency of B Tech CM / QS graduate students in careers outside the “Built Environment.” The rating Self-management, Career Management and Generic Skills will give an indication of the B Tech CM / QS gradate student’s ability to obtain and maintain employment. It will also evaluate their abilities to move up the management ladder and create success for themselves within the organizations in which they are employed.
Proceedings: 9th Built Environment Conference
2-4 August 2015, Durban, South Africa
ISBN 978-0-620-67120-0
page 44
The Discipline Specific Knowledge and Skills possessed by B Tech CM / QS graduate student will be evaluated to determine the transferability of these skills and knowledge to alternative career positions. The perceptions of respondents in alternative career positions will be tested to achieve a competency rating for B Tech CM / QS graduate students in career positions outside the “Built environment.” RESEARCH METHODOLOGY The approach for this study begins with a review of the literature on “employability”, career management and transferable / generic skills. The extent of the knowledge and skills developed in the B Tech CM / QS training program was evaluated and categorised to develop competencytesting criteria. Employees in positions in alternative career fields were then asked to complete a questionnaire that was designed to test their perceptions on the level of competency that they believe a B Tech CM / QS graduate student would experience in their position. The data collected from the respondents was then analysed and the findings tabulated. This study can firstly be described as, Phenomenological in nature as it attempts to understand respondent’s perspectives and views of social reality. Secondly, it is also descriptive in nature as it aims at describing the incidence, frequency and distribution of certain characteristics. Lastly, this approach is also co-relational as it makes use of the statistical investigation of relationships between one factor and one or more factors. This is a quantitative study that begins with a theoretical grounding in the relevant literature. Collected data was analyzed to determine the respondents’ perceptions and develop a list of alternative career positions for B Tech CM / QS graduate students, outside the “Built Environment”. Due to the descriptive nature of this study, no hypotheses have been formed. This study relies on deductive reasoning to process and interpret the data and develop a list of possible alternative career options for BTech CM/QS graduate students. A questionnaire was uploaded to the NMMU website and respondents were directed to the questionnaires location by means of an email that was sent out to recruitment agencies and company HR Departments in South Africa. The data collected from the questionnaire was statistically analyzed to determine the respondents’ perceptions on the level of competency of B Tech CM / QS graduate student in positions outside the “Built Environment.” The major advantage of using this method was that a large number of potential respondents were contacted, with minimal time and financial implications. One hundred responses to the questionnaire were received from employees in South Africa, in positions outside the “Built Environment.”
Proceedings: 9th Built Environment Conference
2-4 August 2015, Durban, South Africa
ISBN 978-0-620-67120-0
page 45
The questionnaire comprised of a five-point Likert-type question system. The questions were constructed according to a model established in the literature study. The scale was developed to evaluate the level of competency of B Tech CM / QS graduate students in positions outside the “Built Environment.” Permission to use the data collected was obtained from all the respondents and were informed that their personal information (confidentiality) would not be revealed in the report emanating from the research. The respondents were informed that a copy of the final report would be made available to them upon completion, should it be requested. 3. RESULTS A competency rating for B Tech CM / QS graduate students is calculated based on the answers respondents provided to the questions in Sections 2 and 3 of the online questionnaire: Section 2 - Self-management, Career Management and Generic Skills Section 3 - Discipline specific skills The Pearson r coefficient correlation method is used to verify and validate the findings by analysing the relationships between the perceptions of the respondents and their biographical data. Scores from Sections 2 and 3 of the online questionnaire were totaled to get an overall competency rating for the B Tech CM / QS graduate students in the respondents’ career positions. Section 2 makes use of a rating scale consisting of 4 categories: Not competent; Competent with training and mentoring; Competent with minimal training and mentoring, and Competent. Section 3 evaluates the B Tech CM / QS graduate student according to their Discipline Specific Knowledge and Skills and uses of a rating scale that consists of the categories: Not Competent; Low level of competence; Fair level of competence, and Competent. Career positions that B Tech CM / QS graduates score over 80% will be deemed to be alternative career positions for the graduates. The frequency of these career positions scoring over 80% competency will be totaled and the career positions will be ranked in descending order according to how many times each of them score over 80%. Perceptions of the level of competency of B Tech CM / QS graduate students will be described in context of the respondents’ competency rating
Proceedings: 9th Built Environment Conference
2-4 August 2015, Durban, South Africa
ISBN 978-0-620-67120-0
page 46
for Section 2 (Self-management, career management and generic skills) and Section 1 (age, gender, highest level of education and years’ experience in career position). This will reveal the relationship between the competency ratings of B Tech CM / QS graduate students to the perceptions of respondents in different biographical categories. The analysis of the data was done in 2 different stages: Stage 1 – Analysis of the data to determine which career positions scored the highest competency rating, and Stage 2 – Analysis of the data to determine the relationship between the respondents biography and perceptions of the “competency level” of BTech CM/QS graduate students in career positions outside the “Built Environment”. Stage 2 – is divided into 2 sections: The first section analyses the “level of competency” of a B Tech CM / QS graduate student in the Self-management, Career Management and Generic Skills Category. The second section analyses the “level of competency” of the B Tech CM / QS graduate students is in the category, Discipline Specific Knowledge and Skills.
Figure 2
Figure 2 indicates that 9 / 45 respondents scored B Tech CM / QS graduate students above 80% competent in Technical Sales positions, meaning that 20% of the respondents perceive B Tech CM / QS graduate students to be “competent with minimal training and mentoring“ in their career positions.
Proceedings: 9th Built Environment Conference
2-4 August 2015, Durban, South Africa
ISBN 978-0-620-67120-0
page 47
8 / 45 respondents scored B Tech CM / QS graduate students above 80% competent in Facilities / Maintenance Management positions, meaning that 18% of the respondents perceive B Tech CM / QS graduate students to be “competent with minimal training and mentoring,” in their career positions. Real Estate Sales positions also scored 8/45. 6 / 45 respondents scored B Tech CM / QS graduate students above 80% competent in Property Consulting positions, meaning that 13% of the respondents perceive B Tech CM / QS graduate students to be “competent with minimal training and mentoring” in their career positions. 3 / 45 respondents scored B Tech CM / QS graduate students above 80% competent in Property Management positions, meaning that 6% of the respondents perceive B Tech CM / QS graduate student to be “competent with minimal training and mentoring” in their career positions. Insurance Assessment positions also scored 3/45. Figure 3 indicates the relationship between the respondents’ level of education and their perceptions of the “level of competency” of B Tech CM / QS graduate students in career positions outside the “Built Environment “with their discipline specific knowledge and skills
Figure 3
Respondent’s with matric level of education perceive B Tech CM / QS graduate students to be “not competent” in 14 / 17 of the sections in this category. Communications and Computer Applications scored the highest number of competent ratings and are therefore considered the transferable
Proceedings: 9th Built Environment Conference
2-4 August 2015, Durban, South Africa
ISBN 978-0-620-67120-0
page 48
skills that a B Tech CM / QS graduate student would be competent with in their career position.
Figure 4
Respondents with a bachelors degree level of education perceive B Tech CM / QS graduate students to be competent with “no additional training and mentoring” in 4 / 15 of the sections of this category. “Minimal additional training and mentoring” requirements scored 4 / 15 in this category. 12 / 15 of the sections recorded incompetency ratings. 6 / 15 of the sections recorded that “minimal additional training and mentoring” is preferred and 5 / 15 identified that “additional training and mentoring” is preferred for the B Tech CM / QS graduate student to be perceived to be competent in the respondents’ career positions.
Proceedings: 9th Built Environment Conference
2-4 August 2015, Durban, South Africa
ISBN 978-0-620-67120-0
page 49
Figure 5
Figure/s 5 and 6 indicate that there were nearly double the amount of male respondents to female respondents; both male and female respondents scored the competency of the B Tech CM / QS graduate students in the category, Discipline Specific Knowledge, similarly. In both cases the discipline specific knowledge and skills in Pricing and Estimating, Construction Economics, Communications and Computer Applications scored the highest competency ratings. Both male and female respondents agreed that B Tech CM / QS graduate students with knowledge and skills in these disciplines would be perceived to be “competent with no additional training and mentoring” in their career positions.
Proceedings: 9th Built Environment Conference
2-4 August 2015, Durban, South Africa
ISBN 978-0-620-67120-0
page 50
Figure 6
Applications would therefore be the most transferable knowledge and skills to career positions outside the “Built Environment.” The disciplines, Site Surveying, Concrete and Structures, Applied Building Science and Appropriate Construction would therefore be the least transferable skills, to career positions outside the “Built Environment”. Findings and Deductions In this section, deductions have been made from an analysis of the data. B Tech CM / QS graduate students scored the highest “competency rating” for career positions in Estate Management, Procurement Management, Property Management, Property Valuation and Property Sales. Both male and female respondents perceive B Tech CM / QS graduate students to be “competent with no additional training and mentoring” in the categories, Self-management, Career Management and Generic Skills. Both male and female respondents in career positions outside the “Built Environment” identified Pricing and Estimating, Construction Economics, Communications and Computer Applications as the most transferable skills. Site Surveying, Concrete and Structures, Applied Building Science and Appropriate Construction were identified by both male and female
Proceedings: 9th Built Environment Conference
2-4 August 2015, Durban, South Africa
ISBN 978-0-620-67120-0
page 51
respondents as being the least transferable skills, for career positions outside the “Built Environment.” B Tech CM / QS graduate students are perceived to require “no additional training and mentoring” required by respondents between 20-25 years old, “minimal training and mentoring” by respondents 26 - 35 years old and “additional training and mentoring” required by respondent over 36 years old, to be competent in their career positions. The deduction was made that as the age of the respondents increase, so does the perception that B Tech CM / Qs graduate students will require a greater degree of training and mentoring to be competent in career positions outside the “Built Environment”. Respondents with a Matric, Diploma and Bachelor Degree level of education perceive B Tech CM / QS graduate students to be competent with “no additional training and mentoring” in their career positions. Respondents with an Honours and Master’s Degree level of education perceive B Tech CM / QS graduate students to be competent with “additional training and mentoring” in the respondent’s career positions. The deduction was made that as the level of education of the respondents increase, so does the perception that B Tech CM / QS graduate students will require a greater degree of training and mentoring, in career positions outside the “Built Environment.” Respondents with 1-10 years perceive B Tech CM / QS graduate students to be competent with “no additional training and mentoring” to be competent in the respondent’s career positions. Respondents with 11-15 years’ experience perceive B Tech CM / QS graduate students to be competent with “minimal additional training and mentoring” in the respondent’s career positions. The deduction was made that, the greater the amount of years experience the respondent has, the greater the degree of training and mentoring the B Tech CM / QS graduate students will require to be perceived as competent in career positions outside the “Built Environment.” Respondents with a matric level of education perceive Communications and Computer Applications to be the most transferable skills that B Tech CM /QS graduate students possess. Respondents with a diploma perceive Communications, Computer Applications, and Entrepreneurship to be the most transferable skills that B Tech CM / QS graduate students possess. Respondents with a bachelor’s degree perceive Communications, Computer Applications, Facilities Management, Appropriate Construction, Economics, Pricing and Estimating, Construction Management, Technology and Quantity Surveying to be the most transferable skills that B Tech CM / QS graduate students possess. Respondents with honours degree perceive Communications, Computer Applications, Facilities Management, Appropriate Construction, Economics, Pricing and Estimating, Construction Management, Technology and Quantity Surveying to be the most transferable skills that B Tech CM / QS graduate students possess. Respondents with Master’s degree perceive Communications, Computer Applications, Law and
Proceedings: 9th Built Environment Conference
2-4 August 2015, Durban, South Africa
ISBN 978-0-620-67120-0
page 52
Procedures, Property Valuations, Economics, Pricing and Estimating and Entrepreneurship to be the most transferable skills that B Tech CM / QS graduate students possess. 4. CONCLUSION B Tech CM / QS graduate students’ will be perceived to have more career options in positions outside the “Built Environment” as their age, level of education and years of experience increase. B Tech CM / QS graduate students scored the highest “competency rating” for career positions in: Estate Management; Procurement Management, and Property Management, Property Valuation and Property Sales. The skills with the highest level of most transferability to career positions outside the “Built Environment” were identified as: Pricing and Estimating; Construction Economics; Communications, and Computer Applications. B Tech CM / QS graduate students’ will be perceived to have more career options in positions outside the “Built Environment” as their age, level of education and years of experience increase. 5. RECOMMENDATION AND FUTURE RESEARCH Training could be implemented in the university holidays. Employers participating in the program would be requested to fill in a logbook for the students that would be accredited by the university to qualify the graduate students with a higher level of “employability” in those alternative positions. Further research into alternative career opportunities for graduate students with Advanced Diploma: Building and Honours degrees in CM and QS will need to be done as these programs are replacing the B Tech CM and QS training programs at the end of 2016. Any curriculum restructuring will need to be addressed and respondents’ perceptions of the “employability” of graduate students retested. Furthermore, the National Diploma: Building and B Tech CM and QS qualifications will need to be compared to the new Advanced Diploma: Building and Honours degree to identify any major differences in curriculum or training.
Proceedings: 9th Built Environment Conference
2-4 August 2015, Durban, South Africa
ISBN 978-0-620-67120-0
page 53
6. RESOURCE LIST Barrie, S. C. (2003). Conceptions of generic graduate attributes in the context of contemporary university courses and teaching. Doctoral Thesis, University of Technology, Sydney. Barrie, S.C. (2004). A Research-based approach to generic graduate attributes policy, Higher Education Research & Development, 23:3, 261275, DOI: 10.1080/0729436042000235391 http://ww.clt.uts.edu.au/atn.grad.cap.project.index.html Bowden, J., Hart, G., King, B., Trigwell, K., & Watts, O. (2000). Generic capabilities of ATN university graduates. Canberra: Australian Government Department of Education, Training and Youth Affairs. Available at http://ww.clt.uts.edu.au/atn.grad.cap.project.index.html Bridgstock, B. (2009). The graduate attributes we’ve overlooked: enhancing graduate employability through career management skills, Higher Education Research & Development, 28:1, 31 -44, DOI: 10.1080/07294360802444347http://eprints.qut.ed.au/16575/1/Ruth_Bridg stock.pdf Department of Education, Employment & Training. (2000) Ministerial review of post-compulsory education and training pathways in Victoria: Final report. Retrieved June 15, 2006, from http://www.det.vic.gov.au/det/postcomp/pdf/KirbyReport.pdf Eby, L., Butts, M., & Lockwood, A. (2003). Prediction of success in the era of the boundary less career. Journal of Organizational Behavior, 24(6), 689 -708 Foray, D. & Lundvall, B. (1996). The knowledged-based economy. Paris: Organisation for Economic Co-operation and Development Harvey, L. (2001). Defining and measuring employability. Quality in Higher Education, 7(2), 97 -109 International Labour Organization. (2000). Training for employment: Social inclusion, productivity and youth employment. Geneva: Author MaQuain, R., & Lindsay, C. (2005) The concept of employability. Urban Studies, 42(2), 197 -219 McMahon, M., Patton, W., & Tatham, P. (2003). Managing life, learning and work in the twenty first century: Issues informing the design of an Australian Blueprint for Career Development. Retrieved February 9, 2005, from http:///www.lefework.ca/AUSBP04-03.pdf Opengart, R., & Short, D. (2002). Free agent learners: The new career model and its impact on human resource development. International Journal of Lifelong Education, 22(1), 220 -233
Proceedings: 9th Built Environment Conference
2-4 August 2015, Durban, South Africa
ISBN 978-0-620-67120-0
page 54
ASOCSA2015- 61
Studio Based Learning in Construction: Turning the Titanic Nishani Harinarain1and Theodore C. Haupt2 1
[email protected], 2
[email protected] 1,2
Property Development Programme, School of Engineering, College of Argiculture, Engineering & Science. University of KwaZulu-Natal, King George V Avenue, Durban,4041, South Africa. Tel.: +27312602687 ABSTRACT AND KEYWORDS Purpose of this paper This paper presents the observation of students to various aspects of a cluster of discrete modules delivered using a studio based learning pedagogy. Design/methodology/approach A variation of a case study approach was used that included the observation studio based learning in a three-module cluster of students after a period of eight weeks into the semester. Research Limitations The research is limited because the findings are based on a single case and a sample of fifty five students who had experienced eight weeks of studio based learning of a cluster of three discrete modules in a revitalised construction program. Findings The observation included the assigned problems, review and feedback, attendance and participation, peer assessment, review and assessment, instructional space, group formation and the reflect-propose-critique-iterate process. It is evident that the distinguishing features of this form of instructional delivery or transmission mode were reflected in the observation despite the instructional space being far from ideal. Originality/value of the paper The findings of this study have implications for the way construction programs are delivered at institutions of higher education.
Proceedings: 9th Built Environment Conference
2-4 August 2015, Durban, South Africa
ISBN 978-0-620-67120-0
page 55
Keywords: studio based learning, critique, reflection, mode of instruction, learning outcomes. 1. INTRODUCTION Studio-based learning is not new. Its roots extend a long way back to Platoism and is being fully realised in modern architectural and industry design education. It exists within the university system but does not sit entirely comfortably perhaps because it is a throwback to an earlier mode of education that has been abandoned by other disciplines (Green and Bonollo, 2003). According to Maitland (1991), studio is not just a space, but a way of thinking and learning. Studio-based learning has been found to be an approach that engages and excites students while also facilitating effective learning (Hundhausen and Brown, 2004). It has been argued that the high degree of characteristic interaction, collaboration and feedback in this approach offer many advantages to students (Maitland, 1991). However, a tension exists in the University between the studio process where intuition and reflection conflict with scientific training and its range of the technical and behavioural knowledge derived from a rapidly expanding database (Green and Bonollo, 2003). This paper reports on the observation by the authors of studio based learning in a three-module cluster of students after a period of eight weeks into the semester. 2. STUDIO BASED LEARNING Studio based learning has been described as being Reflective; Design project centred; Master craftsperson supervised; Group size varied; Discussion intense; Individual project driven; Highly integrated across multiple knowledge elements of the profession being practices; Studio based; and Fostering the learning habits needed for the discovery, integration, application, and sharing of knowledge over a lifetime (Boyer and Mitgang, 1996: xv-xvi). Bringing students closer to professional practice in group-learning situations can potentially engender the development of those generic skills that are highly valued in vocational fields (Raidal and Volet, 2009). Student are able to behave like practicing professionals while engaging in relevant learning in a studio classroom setting (Burroughs, Brocato and Franz, 2009). It is a shared learning environment where students and instructors
Proceedings: 9th Built Environment Conference
2-4 August 2015, Durban, South Africa
ISBN 978-0-620-67120-0
page 56
work iteratively to find solutions to authentic complex open-ended construction-related problems (Hundhausen, Agrawal, Faitbrother and Trevisan, 2010; Mathews, 2010; Rowe, 1987). 2.1 Features of studio-based design problems Design problems are at the heart of many professional practices. The education of engineers, architects, and landscape designers, for example, must prepare students to find solutions for the very complex and illstructured problems with which they must grapple as professionals (Jonassen and Hung, 2008). These design problems have been described as being among the most complex and ill-structured kinds of problems encountered in practice (Jonassen, 2000). The features of ill-defined or illstructured problems, which are sometimes referred to as wicked problems are that they are not definitively formulated and there is no possibility of them being fully defined. Posing additional questions about the problems is acceptable considering that they could potentially lead to their continual reformulation. These problems are designed such that they do not have an explicit basis for terminating the problem-solving activity. Consequently, any proposed solution may still be developed further. Differing formulations may imply different solutions. Similarly, differing solutions may imply different formulations of the problem (Rowe, 1987). Proposed solutions are not necessarily correct or incorrect. The proposal of solutions is a means to understanding these ill-defined problems that involve multiple possible paths with many variables and constraints having to be dealt with in the process therefore what is typical is that there are multiple solution possibilities (Schön, 1987; Cennamo, Brandt, Scott, Douglas and McGrath, 2011). Some of these are known initially while some are discovered through the design activity (Schön, 1987). Students are enticed into leading their own inquiry and allowing for a ‘proposal, critique (or reflect) and iterate again’ procedure before adequate solutions are offered (Brandt, Cennamo, Douglas, Vernon, McGrath and Reimer, 2013). This design thinking process model is a cyclical pattern of analysis (taking things apart), synthesis (putting content together), evaluation (reflection on outcomes), and communication (putting outcomes into words and other media) that moves from more abstract constructs to more concrete constructs over time. Students become producers of knowledge (Kuhn, 1998). Design thinking helps cultivate an ethos built around participation, collaboration and distributed expertise (Mathews, 2010). Typically, students are presented with a design problem. These are often semester-length projects responding to a complex and open-ended assignment (Kuhn, 2001). They are expected to either work individually or in groups to develop solutions. They subject their efforts to multiple and rapid reviews during both informal and formal reviews (Ibid). The module instructor does not conduct traditional lectures but orchestrates learning experiences that help students to new insights into their work (Cennamo, et
Proceedings: 9th Built Environment Conference
2-4 August 2015, Durban, South Africa
ISBN 978-0-620-67120-0
page 57
al., 2011). While lectures do occur from time to time as required they are more in the form of presentations and discussions which aim to explain the nature of a project, the associated milestones and submission requirements (Green and Bonollo, 2003). Sometimes areas that need instructional input are delivered in the form of a lecture or presentation. Additionally, students are expected to visit places where their discipline is being practiced such as, for example, construction sites (refer Figure 1). The studio provides a bridge where students can learn the norms, practices, and tools of the larger professional community of practice before actually entering it (Brandt, et al., 2013).
Figure 1. Visit to a construction site
2.2 Student engagement and lifelong learning It is argued that the traditional teaching processes of delivering information, demonstrating the technique, and providing opportunities for practice should be transformed in ways that better prepare students for the complexities of professional practice (Brandt, et al., 2013). Students need to seek, integrate, and apply knowledge from a wide variety of disciplines or subject matter relevant to the problem solution. They seek additional knowledge and information as required to develop a solution to the assigned problem. Peers are valuable resources and collaboration with other class members is essential to the success of studio-based learning experiences (Cennamo, et al., 2011). Most students find the process of idea generation, screening and resolution of concepts difficult (Green and Bonollo, 2003). Students are confused when faced with many possible alternatives, which are not identifiable as correct or incorrect (Frost, 1992). It is the decision-making process that is difficult. Students may be unfamiliar with the practice of making their thinking explicit or public through oral and written articulations of their decision. This unfamiliarity may create self-doubt, insecurity and lack of confidence. Students who are familiar with modules that value competitiveness may resist expressing ill-formed ideas in a public forum in which they are subject to scrutiny. In classroom cultures that value
Proceedings: 9th Built Environment Conference
2-4 August 2015, Durban, South Africa
ISBN 978-0-620-67120-0
page 58
efficiency students may be reluctant to give up or abandon an initial idea and pursue an alternative, potentially more fruitful pathway (Brandt, et al., 2013). Many students are unable to pull together the disparate lectures of other modules into the design thinking process. There is little time for reflection in most undergraduate programs (Green and Bonollo, 2003). Further, students that are more experienced and skilled in studio are expected to mentor those with less experience and skill (Clinton and Rieber, 2010). Boyer and Mitgang (1996) argue that studio based learning is about instilling life-long learning habits of discovery, community, integration, application, analysis, synthesis and evaluation. The time given to the Reflect-Propose-Critique-Iterate process demands commitment of many consecutive hours. 3. RESEARCH METHOD A variation of the case study method has been adopted for this paper. Case study research is useful for the in-depth study of a phenomenon in its natural context (Yin, 2003). Case study has some limitations when compared with other methodologies. There are dangers in attempting to generalise from analysis of a single case. Case study evidence can never claim the intuitive general applicability that is present when a conclusion is derived from analysis of hundreds of diverse cases (McLeod and Elliott, 2011). Case studies typically look in detail at how change unfolds over time, based on series of multiple observations. Further, they have the space to examine the influence of contextual factors. Case studies are of particular relevance for practitioners as a form of knowledge. Additionally, the use of multiple data collection sources provides a more ‘convincing and accurate’ case study (Yin 2003). Therefore, data were collected by selfadministered questionnaire surveys, observations and semi-structured interviews. This paper only reports on the findings of the observations of the authors of the 8 week studio sessions. 3.1 Background to the case study The Bachelor of Science in Property Development is a three year programme offered at the University of KwaZulu-Natal. This degree can be followed by an Honours programme in either Quantity Surveying or Construction Management. While it had always been intended that the program which had been phased out in 2010 would start up using a new instructional approach in 2014, this was not possible because of the unavailability of a sufficiently experienced cohort of instructors who had taught construction in a studio for any length of time previously. However, in 2013 several of the instructors had attended an intensive two-day workshop on studio-based learning. As a result the first cohort of students who registered in 2014 were taught in the traditional way ‘chalk-and-talk’ approach during their first year. At the commencement of the second year
Proceedings: 9th Built Environment Conference
2-4 August 2015, Durban, South Africa
ISBN 978-0-620-67120-0
page 59
the author was appointed having developed a construction program and taught using a studio based learning pedagogy at a university in the United States. The decision was made to immediately change the traditional mode of transmission to an active learning pedagogy, namely studio based learning while working on revising the existing curriculum which involved broad based consultation with a wide range of internal and external stakeholders. After conducting a day-long gap analysis workshop (Refer to Figures 2-4) three discrete modules were integrated into a cluster and taught in the same space in periods of three hours duration. This cluster met three times per week under the guidance of three instructors. During the semester under study one of the instructors went on a study sabbatical and was not replaced. The remaining instructor had some previous experience with teaching in a studio and was coached further by the author who led the integrated cluster. The proposed revitalised curriculum would support a discursive, collaborative and co-operative learning environment in which the focus shifts from teaching to learning enabling students to acquire and develop autonomous learning skills. Students are encouraged to learn by doing (Green and Bonollo, 2003). They provide the opportunity to prepare st students for the forms of value creation essential in 21 century construction practice.
Figure 2. Existing curriculum
Figure 3. Outcomes of gap analysis
Figure 4. Reorganising modules and topics in curriculum
Proceedings: 9th Built Environment Conference
2-4 August 2015, Durban, South Africa
ISBN 978-0-620-67120-0
page 60
Each student was required to sign a declaration after they had read and studied the cluster guide indicating their understanding and acceptance of the changes that were being brought into effect. They did this without any coercion. 4. RESULTS AND DISCUSSION 4.1 Assigned problems, review and feedback The original learning outcomes of the three individual modules were consolidated into the clustered module. The assigned problem for the semester was designed to achieve as many of these as was possible in the 15-week period. The students were presented for one major semester long project broken up into five phases with specified submission dates with each building on the previous phase. The learning outcomes of the three original modules as described in the clustered module outline were mapped against the various project phases. The focus was on developing professional behaviours, skills, competences and problem-solving abilities instead of merely covering the syllabus and module content as had previously been done under the traditional instructional paradigm. The time allocated to complete each phase of the problem was about three weeks. Each phase involved work in the classroom as well as work outside the classroom. Students were expected to visit construction sites, consult with construction practitioners and relevant texts to gather information they could use to formulate proposals for solutions to the particular problem described in the project brief. Students were expected to work individually and in groups (of five) to develop solutions to the problems posed in the project. The students subjected their efforts to multiple informal and formal reviews during the semester. Students developed a work scheme as the initial step in each phase to learn the importance of proper project planning. The instructors reviewed these work schemes informally with each group. Further, the achievement of the project milestones contained in the project brief helped develop the project management skills of each group. The rotation of the group project leader for each phase allowed each group member to develop his or her leadership skills. The module instructors did not conduct traditional lectures but orchestrated learning experiences that helped students to new insights into their work. While lectures did occur from time to time as required they are more in the form of presentations and discussions which aimed to explain the nature of a project, the associated milestones and submission requirements. Instructors continually interacted with the groups during each class session and interrupted activities of the entire class from time to time to provide information and overall guidance in the form of explanatory notes
Proceedings: 9th Built Environment Conference
2-4 August 2015, Durban, South Africa
ISBN 978-0-620-67120-0
page 61
and/or presentations. Groups made periodic submissions and presentations of their work. They pinned up their work as it progressed from time to time. The feedback given during these review sessions was used to refine their proposed solutions. Each phase of the problem concluded with a set of formal submissions and presentations. Students were given detailed information about the specific submission requirements. These were evaluated using detailed rubrics which were posted on Moodle (an internet based learning website) serving as a guide for students to prepare their submissions and for their presentations or pin ups. 4.2 Attendance and participation Attendance of all sessions was mandatory. The attendance of students was monitored by having them sign an attendance register at the commencement and just before the end of each session. For students to ‘qualify’ for having attended a session they had to have been present in the class to sign the register both times. Students were constantly reminded that it was imperative for them to participate in every aspect of the assigned problems since they each needed to acquire the skills and competences that the problems were designed to develop. While the level of engagement of each student was monitored informally by the instructors during class sessions, it was no possible to do so outside of class times. 4.3 Peer assessment After completion of a phase of a project students were required to complete a confidential peer assessment of each of their group members and submit that to their instructors electronically. These were used to assess the individual contributions of each group member. 4.4 Review and assessment The grade for each project phased was made up of an assessment of the written submission as a group and the performance of each individual during pin ups and presentations. Feedback was given after each phase was graded. Students had the opportunity to make corrections to their work and include them in the final review submissions at the end of the semester. The final review or examination involved the pin up of all the completed work which included plans, schedules and lists, submission of a final project document and a half-hour long formal presentation by the entire group. This final review was conducted using a panel of external practitioners. Aside from assigning a grade to each student, the panel gave formal feedback to the instructors to be used in improving the clusters and program further. All the instructors in the program who were not involved in
Proceedings: 9th Built Environment Conference
2-4 August 2015, Durban, South Africa
ISBN 978-0-620-67120-0
page 62
the clustered module were required to attend the final review as well as those involved. 4.5 Instructional space The physical studio instructional space provides a dedicated collaborative workspace where students collaborate with experts in the form of their instructors (Schön, 1985). The studio engages students in a discursive collaboration where students talk to each other as much as or more than the instructor talks to them (Burroughs, Brocato and Franz, 2009). In brings together disparate thinking into a forum of discussion and idea exchange (Green and Bonollo, 2003). These spaces are messy in a sort of functional disarray that signifies learning is taking place in a messy business way. They hold student work desks, tables, resource storage, wall space for pin ups, and group gathering areas. The arrangement of these spaces changes continually during learning engagement (Ibid). The desks in these spaces are assigned to specific students and are usually available to them at all times. Studio classes typically meet multiple times per week for three hour to four hours sessions. Students are encouraged to work in the studio rather than at home after school hours (Cennamo, et al., 2011). There were no flat floor instructional spaces that could be converted into studio spaces for the exclusive use of the program. Instead a conventional classroom with movable desks was used for the meeting sessions. At the commencement of each session the desks were moved around to accommodate the needs of the class and then moved back to their original positions at the end of the session. This exercise was in itself an inconvenience. Further, there was no space for pin ups of student work. As with the desks students had to pin up their work and take them down again each time. There was therefore limited opportunity for students outside of the meeting sessions to review or critique the work of their peers or benchmark their work against that of their peers. Students and instructors used the same space for periodic formal reviews and presentations. Students were required to use their personal laptops during class sessions. However they were unable to charge their laptop batteries since the power points in the room being used could not accommodate their plug fittings. These power points were eventually changed to make this possible. 4.6 Group formation Given the large class size, namely 55 students, groups of five students each were formed. However, very specific requirements were set for the formation of these groups. Students had to find four classmate that they did not usually spend time with and introduce themselves. They had to memorize the names of each person spelling their names correctly and get their full contact details. The group had to comprise of both genders and where possible a three-two split. The group was also required to consist of
Proceedings: 9th Built Environment Conference
2-4 August 2015, Durban, South Africa
ISBN 978-0-620-67120-0
page 63
a mix of classmates from different language and cultural backgrounds. Each group had to at least have one laptop. Finally, they were to select a group leader for the first phase of the assigned project. 4.7 Reflect-Propose-Critique-Iterate process Reflection and critique are pivotal to studio based learning. As students discuss their ideas of solutions to the assigned problem or project brief, others critically question their ideas (Hundhausen, Agrawal, Faitbrother and Trevisan, 2010). These critique, evaluation or assessment sessions provide opportunities for students to present their solutions, articulate their reasoning, and receive feedback from instructors, peers and occasionally guests (Dannels, 2005). This is the informal critique process. As students move along the time-content continuum of understanding they begin to selfdefine their role to that of finding out by seeking out information beyond the instructor present in the studio. Iteration begins immediately, is generative, and ongoing until a formal critique or review, evaluation or assessment takes place (Ibid). Critiques occur formatively throughout a project’s development as when instructors spend time with student work groups offering input or call for spontaneous pin-up sessions as well as at the completion of a project (Cennamo, et al., 2011) (Refer to Figures 5 and 6). Iteration is followed by reflection before the process begins again. This process allows students to think deeply about meaningful issues and promotes a culture of reflection that is sophisticated, insightful and personal – something that rarely occurs in other learning environments.
Figure 5. Student pin up
Figure 6. Critique session
5 CONCLUSION This study discussed the observations of a studio based class at the University of KwaZulu-Natal after a period of eight weeks into the semester. The observation included the assigned problems, review and feedback,
Proceedings: 9th Built Environment Conference
2-4 August 2015, Durban, South Africa
ISBN 978-0-620-67120-0
page 64
attendance and participation, peer assessment, review and assessment, instructional space, group formation and the reflect-propose-critique-iterate process. It is evident that the distinguishing features of this form of instructional delivery or transmission mode were reflected in the observation despite the instructional space being far from ideal. The next phase of the study involves a national comparative survey of samples of university students in studio based learning and those in traditional programs. It is evident from this background that studio based learning in this environment was going to be more than the expected messiness. 6 ACKNOWLEDGEMENT This work is based on the research supported in part by the National Research Foundation of South Africa (Grant number 90499). 7 REFERENCES Brandt, C., Cennamo, K., Douglas, S., Vernon, M., McGrath, M., and Reimer, Y. 2013. A theoretical framework for the studio as a learning environment. International Journal of Technology and Design Education, 23, 329-348 Boyer, E. and Mitgang, L. 1996. Building community: A new future for architectural education and practice. A special Report Princeton, NJ: Carnegie. Burroughs, S., Brocato, K., and Franz, D. 2009. Problem based and Studio based learning: Approaches to promoting reform thinking among teacher candidates. National Forum of Teacher Education Journal, 19 (3), 1-15. Cennamo, K., Brandt, C., Scott, B., Douglas, S., McGrath, M., Reimer, Y. and Vernon, M. 2011. Managing the Complexity of Design Problems through Studio-based Learning. Interdisciplinary Journal of Problembased Learning, 5 (2), 12-36. Clinton, G. and Rieber, L. 2010. The studio experience at the University of Georgia: an example of constructivist learning for adults. Education Technology Research and Development, 58, 755-780 Dannels. D.P. 2005. Performing tribal rituals; A genre analysis of “Crits” in design studios. Communication Education, 54 (2), 136-160 Frost, R. 1992. The future of machine element design courses. Conference on Teaching Engineering Designers, Sydney, Australia Green, L. and Bonollo, E. 2003. Studio-based teaching: history and advantages in teaching of design. World Transactions on Engineering and Technological Education, 2 (2), 269-272. Haupt, T.C. 2009a. Preliminary Findings of South African Construction Industry-Academia Survey: Part 1, Journal of Construction, 2 (2), 26-31, ISSN 1994-7402.
Proceedings: 9th Built Environment Conference
2-4 August 2015, Durban, South Africa
ISBN 978-0-620-67120-0
page 65
Haupt, T.C. 2009b. Preliminary Findings of South African Construction Industry-Academia Survey: Part 2, Journal of Construction, 3 (1), 30-36, ISSN 1994-7402. Hundhausen, C. and Brown, J. 2004. Personalizing and discussing algorithms within CSI studio experiences: an observational study. Proceedings ICER 2005, 45-56 Hundhausen, C., Agrawal, A., Faitbrother, D and Trevisan, M. 2010. Does Studio-based instruction work in CS 1? An empirical comparison with a traditional approach. SIGCSE 10, Milwaukee, Wisconsin, March 10-13. Jonassen, D. and Hung, W. 2008. All problems are not equal: Implications for problem-based learning. The Interdisciplinary Journal of Problembased Learning, 2 (2), 6-28 Jonassen, D. 2000. Toward a design theory of problem solving. Educational Technology Research and Development Journal, 48 (4), 63-85 Kuhn, S. 1998. The software design studio: An exploration. IEEE Software, 15 (2), 65-71. Kuhn, S. 2001. Learning from the Architecture Studio: Implications for the Project-based Pedagogy. International Journal of Engineering Education, 17 (4 & 5), 349-352. Maitland, B. 1991. Problem-based learning for an Architecture degree. In: Boud, D. and Feletti, G. (eds), The Challenge of Problem-based Learning. London, Kogan Page Mathews, J. 2010. Using a studio-based pedagogy to engage students in the design of mobile-based media. English Teaching: Practice and Critique, 9 (1), 87-102. Monson, C. and Poros, J. 2003. ACHIEVE Mississippi Workshop, Mississippi State University. Novak, V.M. and Monson, C. (2013). Rethinking Construction Education: th Lessons learned from Industry Innovations. Proceedings of the 49 ASC Annual International Conference. Raidal, S. and Volet, S. 2009. Preclinical students’ predispositions towards social forms of instruction and self-directed learning: a challenge for the development of autonomous and collaborative learners. High Education, 57, 577-596. Rowe, P.G. 1987. Design Thinking. Cambridge: MIT Press Savery, J. 2006. Overview of problem-based learning: Definitions and distinctions. The Interdisciplinary Journal of Problem-based Learning, 1 (1), 9-20. Schön, D. 1985. The design studio: An exploration of its traditions and potentials. London: RIBA Publications Limited Schön, D. 1987. Educating the reflective practitioner: toward a new design for teaching and learning in the professions. San Francisco: Josey Bass Yin, R.K. 2003. Case Study Research. Designs and Methods. Third edition. Sage Publications, London.
Proceedings: 9th Built Environment Conference
2-4 August 2015, Durban, South Africa
ISBN 978-0-620-67120-0
page 66
ASOCSA2015- 62
Student Engagement in Studio Based Learning in Construction Theodore C. Haupt1 and Nishani Harinarain2 1
[email protected], 2
[email protected] 1,2 Property Development Programme, School of Engineering, College of Argiculture, Engineering & Science. University of KwaZulu-Natal, King George V Avenue, Durban,4041, South Africa. Tel.: +27312602687
ABSTRACT AND KEYWORDS Purpose of this paper This paper presents the responses of students to various aspects of a cluster of discrete modules delivered using a studio based learning pedagogy. Design/methodology/approach A variation of a case study approach was used that included observations and a survey of student opinions on six constructs or themes after a period of eight weeks into the semester about their experience of studio based learning in a three-module cluster. Research Limitations The research is limited because the findings are based on a single case and a small sample of students who had experienced eight weeks of studio based learning of a cluster of three discrete modules in a revitalised construction program. Findings The student responses were analysed using SPSS. It is evident that the distinguishing features of the studio based learning form of instructional delivery or transmission mode were reflected in their views despite the instructional space being far from ideal. However, given that this was their first experience they were apprehensive about the benefits of the approach to them personally especially in terms of whether their acquired knowledge base was broad and deep enough for them to be confident about their future careers. The mapping of the learning outcomes of the modules
Proceedings: 9th Built Environment Conference
2-4 August 2015, Durban, South Africa
ISBN 978-0-620-67120-0
page 67
against the project phases demonstrated that only the mode of transmission had in fact changed. Students were reticent about taking responsibility for their own learning possibly because they perceived that as being too risky. The greatest fear expressed by the students was that they would not be adequately prepared for the world of work. Originality/value of the paper The findings of this study have implications for the way construction programs are delivered at institutions of higher education. Keywords: studio based learning, critique, reflection, mode of instruction, learning outcomes. 1. INTRODUCTION There has been considerable debate in recent years about construction education with particular reference to its transmission or delivery mode given its disconnect between the academy and professional practice and failure to adequately prepare graduates for lifelong, autonomous learning (Haupt, 2009a and b). Consistent among many professional degrees is the view that traditional didactic instruction approaches are not well suited to improve this situation (Raidal and Volet, 2009). In response construction programs have experimented with various approaches to improve the quality and employability of their graduates while trying to narrow the gap between what academia produces and what industry needs. This paper reports on feedback from students after the introduction of an alternative instructional technique, namely studio-based learning that capitalised on the unique opportunity provided by a construction curriculum that is being revitalised. The intent of the revised curriculum was to embrace an active learning pedagogy. 2. STUDIO BASED LEARNING DEFINED Studio based learning is being embraced across several fields of study in the main because of its optimal strategies for producing articulate thinkers (Burroughs, Brocato and Franz, 2009). Studio based learning allows students to behave like practicing professionals while engaging in relevant, authentic learning in a classroom setting (Burroughs, Brocato and Franz, 2009). It is a shared learning environment where students and instructors 1 work iteratively using the ‘master/apprentice’ method to design solutions to authentic ill-structured complex open-ended construction-related problems that are ambiguous in beginnings, means, and ends (Mathews, 2010).
1
Design is used in this context and throughout the paper as a way of thinking that has its origins in or links to architecture education
Proceedings: 9th Built Environment Conference
2-4 August 2015, Durban, South Africa
ISBN 978-0-620-67120-0
page 68
According to Kuhn (1998), a studio pedagogy comprises of several core components such as, for example Project-based work on complex and open-ended problems; Rapid iteration of solutions; Frequent formal and informal critique; Consideration of heterogeneous issues; Use of precedent and thinking about the whole; Creative use of constraints; and Use of various media. A comprehensive student-centred approach to learning such as studiobased learning requires that students conduct research, integrate theory and practice, and apply knowledge and skills to develop solutions to realistic problems (Savery, 2006). Students become producers of knowledge (Kuhn, 1998). Design thinking helps cultivate an ethos built around participation, collaboration and distributed expertise (Mathews, 2010). Multivariate ambiguous construction problems are solved iteratively through multimodal analysis, proposition and critique (Monson and Poros, 2003). Introducing authentic ambiguous problems as applied exercises in the classroom or studio can help students gain deeper domain knowledge and learn the analytical skills needed to frame problems (Novak and Monson, 2013). Research has shown that students who engage in studio based learning activities perform equally well or better on standardised tests while demonstrating superior performance in making trade-specific proposals to solve problems or design solutions (Burroughs, Brocato and Franz, 2009). Rather than perpetuating the practice of teaching modules on a ‘silo’ basis with segregated content the studio approach allows for the integration of content in an active learning environment. It lends itself well to multidisciplinary teaching and learning (Kuhn, 2001). 3. RESEARCH METHOD A variation of the case study method has been adopted for this paper. Case study research is useful for the in-depth study of a phenomenon in its natural context (Yin, 2003). Case study has some limitations when compared with other methodologies. There are dangers in attempting to generalise from analysis of a single case. Case study evidence can never claim the intuitive general applicability that is present when a conclusion is derived from analysis of hundreds of diverse cases (McLeod and Elliott, 2011). Case studies typically look in detail at how change unfolds over time, based on series of multiple observations. Further, they have the space to examine the influence of contextual factors. Case studies are of particular relevance for practitioners as a form of knowledge. Additionally, the use of multiple data collection sources provides a more ‘convincing and accurate’ case study (Yin 2003). Therefore, data were collected by selfadministered questionnaire surveys, observations and semi-structured
Proceedings: 9th Built Environment Conference
2-4 August 2015, Durban, South Africa
ISBN 978-0-620-67120-0
page 69
interviews. This paper only reports on the findings of the analysis of the self-administered survey of the views of students. 3.1 The case study - Bachelor of Science in Property Development at the University of KwaZulu-Natal The Bachelor of Science in Property Development is a three year programme offered at the University of KwaZulu-Natal which was reinstated and started taking in new entrants from 2014. This degree can be followed by an Honours programme in either Quantity Surveying or Construction Management. In 2015 with the appointment of a Professor who had experience in studio based learning pedagogy, the decision was made to immediately change the traditional mode of transmission to an active learning pedagogy, namely studio based learning while working on revising the existing curriculum which involved broad based consultation with a wide range of internal and external stakeholders. After conducting a day-long gap analysis workshop three discrete modules in second year were integrated into a cluster and taught in the same space in periods of three hours duration. This cluster met three times per week under the guidance of instructors. The students were presented for one major semester long project broken up into five phases with specified submission dates with each building on the previous phase. The time allocated to complete each phase of the problem was about three weeks. Students were expected to work individually and in groups (of five) to develop solutions to the problems posed in the project. The students subjected their efforts to multiple informal and formal reviews during the semester. The module instructors did not conduct traditional lectures but orchestrated learning experiences that helped students to new insights into their work. While lectures did occur from time to time as required they are more in the form of presentations and discussions which aimed to explain the nature of a project, the associated milestones and submission requirements. Students were expected to visit construction sites, consult with construction practitioners and relevant texts to gather information they could use to formulate proposals for solutions to the particular problem described in the project brief. Each student was required to sign a declaration after they had read and studied the cluster guide indicating their understanding and acceptance of the changes that were being brought into effect. They did this without any coercion. 4. RESULTS AND DISCUSSION After having participated in the studio for 8 weeks of the 15 week-long semester (about halfway through) the very first cohort of 55 second year students were asked to participate in a confidential self-administered
Proceedings: 9th Built Environment Conference
2-4 August 2015, Durban, South Africa
ISBN 978-0-620-67120-0
page 70
survey. The instrument was designed in terms of six sub-sections or themes to examine the impact of studio-based learning on the students. The response or participation rate was 28 students or 51%. It was not possible to correlate the findings by gender as no provision was made in the instrument for students to indicate their gender. The sections or themes were, namely a) Role, commitment and involvement of instructors; b) Nature of assignments, projects and problems; c) Student engagement and empowerment; d) Mode of delivery or transmission; e) Group dynamics; and f) Characteristic of graduates. Students were presented with statements under each of the subsections and asked to respond in terms of their levels of agreement on a 5point scale where 1=strongly disagree, 2=disagree, 3=neutral, 4=agree and 5=strongly agree. The degree of internal consistency or Cronbach Alpha scores for the scale used for the various constructs is shown in Table 1. Table 1. Reliability test Construct
Cronbach Alpha
No of items
Role, commitment and involvement of instructors
0.880
14
Nature of assignments, projects and problems
0.788
8
Student engagement and empowerment
0.755
11
Mode of delivery or transmission
0.861
7
Group dynamics
0.875
3
Characteristic of graduates
0.909
22
All constructs were found to have statistically high levels of internal reliability, namely Cronbach Alpha values greater than 0.700. The OneSample T-test when applied to all the constructs showed that the sample means for all items differed significantly from the neutral value of 3.00 at the 99% confidence interval level. In all cases except group dynamics the sample means were above 3.00. a.
Role, commitment and involvement of instructors
In studio based learning the role of instructors is pivotal given that it is different to ‘chalk-and-talk’ roles in other approaches. The collaborative nature of studio based learning encourages instructors and students to work together. Instructors who are ‘experts’ facilitate and encourage student responsibility for learning. They design multivariate authentic ambiguous construction problems that students have to develop solutions for. Either informally or formally, instructors iteratively review, critique and give feedback on proposed solutions and guide student thinking (Cennamo, et. al., 2011). From time to time they might interrupt class sessions by
Proceedings: 9th Built Environment Conference
2-4 August 2015, Durban, South Africa
ISBN 978-0-620-67120-0
page 71
making presentations of relevant material as part of the process of giving guidance and input (Green and Bonollo, 2003). Students were asked to respond to a series of 14 statements on the role, commitment and involvement of their instructors in their studio classes. There is a high degree of internal consistency for the scale used for this construct of 14 items, namely a Cronbach Alpha statistic of 0.880. The removal of the item “the role of the educator/instructor has changed to that of a facilitator of learning” would increase the internal consistency to 0.884 but was retained despite the Corrected Item-Total Correlation being low, namely 0.250. The findings are presented in Table 2. It is evident that the students recognised the overt and visible efforts of instructors to proactively change the form of delivery from one that is familiar to them to one that is based on a student-centred pedagogy. For example, participation in discussions, interaction with other students, and reflection had means above 4.00. However, students responded less favourably to statements that related to the ‘messiness’ of the approach and their perceived lack of understanding the changed role of instructors and the organisation of the module. Preparedness of instructors, organisation and sequencing of material, presentation of material, and enthusiasm for the module had means that ranged between 3.37 and 3.04. Table 2. Performance of instructors Role, commitment and involvement of instructors The instructors encourage participation in discussions The instructors encourage me to interact with other students in the class The instructors stimulate me to think about the subject The instructors have been available to discuss problems and questions relating to my assignments The instructors organise class time effectively and efficiently The role of the educator/instructor has changed to that of a facilitator of learning The instructors are interested in helping me to learn Assignments marked by the instructors have been returned within a reasonable timeframe The instructors are well prepared for the subject Written comments on assignments marked by the instructors have been helpful The instructors organise and sequence the subject matter well The instructors are helpful in response to my questions or problems Because of the instructors, I have felt enthusiastic about studying this subject The instructors present the subject- matter clearly
b.
Mean 4.444
Std Dev 0.697
Rank 1
4.407
0.500
2
4.192
0.567
3
4.185
0.622
4
4.000
0.733
5
3.846
0.731
6
3.777
1.050
7
3.777
1.012
8
3.370
0.791
9
3.370
1.079
10
3.333
0.733
11
3.333
1.143
12
3.111
1.120
13
3.038
0.823
14
Nature of assignments, projects and problems
Studio based problems which are at the heart of professional practice have been described as authentic, ill-structured, complex, open-ended, messy and ambiguous in beginnings, means and ends. These problems do not necessarily have correct or incorrect solutions. There can also be multiple
Proceedings: 9th Built Environment Conference
2-4 August 2015, Durban, South Africa
ISBN 978-0-620-67120-0
page 72
solutions. Students were asked to respond to a series of 8 statements on the nature of the design problems they were presented with in their studio classes. There is a degree of internal consistency for the scale used for this construct of 8 items, namely a Cronbach Alpha statistic of 0.692 which is marginally below the rule-of-thumb 0.700 for acceptable internal scale consistency. The removal of the item “I find that having to move from what I do not know by seeking answers to find information and solutions is enlightening” increased the internal consistency to 0.788 with a low Corrected Item-Total Correlation of -0.055. The findings are shown in Table 3 with the exclusion of one item. The students strongly agreed that the problems that they had been presented with in the clustered module mirrored the nature and features of typical studio based problems. They acknowledged that the boundaries of their existing knowledge were being stretched, the problems were demanding and required decisions and choices about the relevance of large amounts of information. They also recognised that there were multiple solutions to their problem. They also had to defend their proposed solutions. Table 3. Nature of design problems Nature of problems The problems are demanding and stretch the boundaries of what I know I am given problems that require me to gather a large amount of information that I have to work through and select what I need to propose a solution to them I have to decide what information is useful and discard that which is not The problems that I am given require me to construct and reconstruct meaning from large amounts of information The problems demand that I discuss, reflect, defend and argue my view point The problems that I have to resolve are ambiguous and do not have a single solution When I propose a solution to the problems I have to substantiate and justify my position
c.
Mean
Std Dev
Rank
4.444
0.640
1
4.407
0.636
2
4.370
0.629
3
4.259
0.655
4
4.111
0.751
5
4.037
0.939
6
3.963
0.979
7
Student engagement and empowerment
Unlike other ‘instructor centric’ transmission modes, studio based learning involves students collaboratively and actively in their own learning. For students this process can be difficult and unsettling. Consulting their peers and defending their viewpoints are discomforting experiences. However, their participation in and embracing the studio based form of instruction is important for its benefits to be derived optimally. Students were asked to respond to a series of 11 statements on student engagement in their studio classes. There is a high degree of internal consistency for the scale used for this construct of 11 items, namely a Cronbach Alpha statistic of 0.709. The
Proceedings: 9th Built Environment Conference
2-4 August 2015, Durban, South Africa
ISBN 978-0-620-67120-0
page 73
removal of the item “to arrive at a solution demands that I agree with a point of view even though I might disagree initially” increased the internal consistency to 0.755 with a low Corrected Item-Total Correlation of 0.033. The findings are shown in Table 4 with the exclusion of one item. The findings demonstrate that students experienced the characteristics of studio based learning in the delivery of the clustered module, namely that they had proposed solutions, had them critiqued, were allowed to address shortcomings in their proposals, were active learners and had taken responsibility for their own learning. They did not agree as strongly that they were empowered by the studio approach. This response is understandable given that this was their first experience and they had only been in the cluster for 8 weeks. Table 4. Student engagement Student engagement and empowerment I am encouraged to propose solutions and have them critiqued I am allowed to fix shortcomings in my proposed solutions Instead of being a passive and inactive learner I am becoming a creator of knowledge Rather than being passive in class I am an active agent in my own learning experience I take responsibility for and control of my own learning in this module In this module I am allowed to take the initiative in figuring out my own learning needs It is acceptable to agree and disagree The module allows me to identify the resources that I need I am able to formulate my own learning goals The focus on learning empowers me
d.
Mean
Std Dev
Rank
3.960
0.789
1
3.880
0.600
2
3.880
0.665
3
3.840
0.687
4
3.840
1.106
5
3.800
0.866
6
3.800
1.118
7
3.520
1.159
7
3.440 3.280
0.820 0.890
9 10
Mode of delivery or transmission
The mode of instruction had changed from the traditional instructor-centred focus on teaching to one that is student-centred and focused on learning. This approach has characteristics that are very different especially the shift in responsibility for learning to the students themselves with support from instructors. Students were asked to respond to a series of 8 statements on mode of delivery or transmission or instruction in their studio classes. There is a high degree of internal consistency for the scale used for this construct of 8 items, namely a Cronbach Alpha statistic of 0.814. The removal of the item “there has been a shift from the traditional teacher centred approach, in which the emphasis is on teachers and what they teach, to a student centred approach, in which the emphasis is on students and what they learn” increased the internal consistency to 0.861 with a low Corrected Item-Total Correlation of -0.096. The findings are shown in Table 5 with the exclusion of one item. While students strongly agreed that the modules were focused on learning rather than teaching they were less agreeable with how they felt
Proceedings: 9th Built Environment Conference
2-4 August 2015, Durban, South Africa
ISBN 978-0-620-67120-0
page 74
the studio based learning pedagogy would impact them personally and directly. For example, they seemed reticent about how prepared they would be for the changing needs of the industry, the depth of their learning, and the transformational potential of the approach. As stated earlier, this response is understandable given that this was their first experience and they had only been in the cluster for 8 weeks. Table 5. Impact of mode of instruction Mode of delivery/transmission The modules are focused on learning rather than teaching The assignments helped me to analyse and synthesize important information The way the module is delivered encourages critical analysis and synthesis I will be able to meet the changing needs of the industry This approach encourages the development of a deep approach to learning I find this form of instruction which focuses on learning transformational The way these modules are taught prepares me for lifelong learning
e.
Mean 4.038
Std Dev 0.870
Rank 1
3.730
0.724
2
3.576
0.945
3
3.346
1.198
4
3.230
1.305
5
3.153
0.784
6
3.038
1.148
7
Group dynamics
Working in groups was reflective of everyday practices in construction where construction project teams of professionals were temporary and transient and constituted and/or approved either by clients. Typically the influence of individual professionals on that structure is limited. Students were asked to respond to a series of 4 statements about the group dynamics in their studio classes. There is a high degree of internal consistency for the scale used for this construct of 4 items, namely a Cronbach Alpha statistic of 0.852. The removal of the item “I have to work with people from backgrounds that I do not understand” would increase the internal consistency to 0.875 but was retained despite the Corrected Item-Total Correlation being low, namely 0.530. The findings are shown in Table 5. Table 5. Impact of group dynamics Group dynamics I have to work with people from backgrounds that I do not understand I have to work with people that I do not like These people frustrate me and make me lose my enthusiasm for the module My group consists of people who do not contribute to the solution of the problem
Mean
Std Dev
Rank
2.615
1.235
1
2.230
1.274
2
2.038
1.148
3
2.038
1.455
4
The students generally appeared to be comfortable with the composition of their groups and with individual group members despite the stringent
Proceedings: 9th Built Environment Conference
2-4 August 2015, Durban, South Africa
ISBN 978-0-620-67120-0
page 75
requirements imposed on the manner in which their groups had to be formed. They disagreed that they had to work with students from backgrounds that they did not understand, they did not like, frustrated them and affected their enthusiasm for their studies or did not contribute to the solution of the assigned problems. f.
Characteristic of graduates
During the gap-analysis workshop at the commencement of the academic year, the group of instructors produced a list of desirable qualities or descriptors that they wanted the graduates to have upon graduation. This list was presented to students who were asked to respond to a series of 22 personal defining characteristics that their studio classes helped them develop. There is a very high degree of internal consistency for the scale used for this construct of 22 items, namely a Cronbach Alpha statistic of 0.909. The removal of the items “socially responsible and culturally aware” would increase the internal consistency to 0.911 but was retained despite the Corrected Item-Total Correlation being low, namely 0.250 and 0.239 respectively. The findings are shown in Table 6. Table 6. Characteristics of graduates Characteristic Mean Responsible 4.636 Planner 4.363 Independent thinker 4.363 Communicator 4.318 Problem solver 4.227 Leader 4.227 Forward thinker 4.181 Socially responsible 4.136 Human skills 4.136 Practical 4.136 Critical thinker 4.045 Pro-active 4.000 Adaptable 3.909 Knowledgeable 3.863 Entrepreneur 3.863 Culturally aware 3.818 Lifelong learner 3.727 Negotiator 3.681 Visionary 3.590 Informed 3.500 Skilled Professional 3.500 Employable 3.454
Std Dev 0.581 0.581 0.657 0.567 0.528 0.812 0.394 0.560 0.710 0.833 0.575 0.690 0.683 0.639 0.774 0.588 0.827 0.716 0.908 0.597 1.011 0.962
Rank 1 2 3 4 5 6 7 8 9 10 11 12 13 14 15 16 17 18 19 20 21 22
An element of doubt was still evident in their responses about whether they would be informed, skilled professionals and employable.
Proceedings: 9th Built Environment Conference
2-4 August 2015, Durban, South Africa
ISBN 978-0-620-67120-0
page 76
Comparison of composite means of constructs By calculating the composite means for each construct it is possible to gauge the level of agreement with the various constructs. These are shown in Table 7. Table 7. Comparison of composite means Construct Composite Mean Nature of design problems 4.227 Graduate profile 3.985 Group dynamics 2.230 Performance of instructors 3.727 Student engagement 3.724 Mode of delivery 3.402
Given that the means of group dynamics are indicative of the lack of agreement with the statements in this construct, the inverse mean is 5.0002.230 = 3.770. From Table 7 it is evident that students agreed most with the nature of the design problems as described in the statements of this construct or theme and experienced by them. Similarly, they agreed least with the mode of delivery as described in the statements of this construct and experienced by them. 5. CONCLUSION This study examined after a period of eight weeks into the semester the views of second year students about their experience of studio based learning in a three-module cluster. It is evident that the distinguishing features of this form of instructional delivery or transmission mode were reflected in their views despite the instructional space being far from ideal. However, given that this was their first experience they were apprehensive about the benefits of the approach to them personally especially in terms of whether their acquired knowledge base was broad and deep enough for them to be confident about their future careers. The mapping of the learning outcomes of the modules against the project phases demonstrated that only the mode of transmission had in fact changed. Students were reticent about taking responsibility for their own learning possibly because they perceived that as being too risky. The greatest fear expressed by the students was that they would not be adequately prepared for the world of work. In order to instil more confidence and reassurance in the studio based learning approach it will be necessary for the instructors to develop additional means of evaluating their performance using professional industry practitioners. The next phase of the study involves a national comparative survey of samples of university students in studio based learning and those in traditional programs.
Proceedings: 9th Built Environment Conference
2-4 August 2015, Durban, South Africa
ISBN 978-0-620-67120-0
page 77
6. ACKNOWLEDGEMENT This work is based on the research supported in part by the National Research Foundation of South Africa (Grant number 90499).
7. REFERENCES Burroughs, S., Brocato, K., and Franz, D. 2009. Problem based and Studio based learning: Approaches to promoting reform thinking among teacher candidates. National Forum of Teacher Education Journal, 19 (3), 1-15. Cennamo, K., Brandt, C., Scott, B., Douglas, S., McGrath, M., Reimer, Y. and Vernon, M. 2011. Managing the Complexity of Design Problems through Studio-based Learning. Interdisciplinary Journal of Problembased Learning, 5 (2), 12-36. Green, L. and Bonollo, E. 2003. Studio-based teaching: history and advantages in teaching of design. World Transactions on Engineering and Technological Education, 2 (2), 269-272. Haupt, T.C. 2009a. Preliminary Findings of South African Construction Industry-Academia Survey: Part 1, Journal of Construction, 2 (2), 26-31, ISSN 1994-7402. Haupt, T.C. 2009b. Preliminary Findings of South African Construction Industry-Academia Survey: Part 2, Journal of Construction, 3 (1), 30-36, ISSN 1994-7402. Kuhn, S. 1998. The software design studio: An exploration. IEEE Software, 15 (2), 65-71. Kuhn, S. 2001. Learning from the Architecture Studio: Implications for the Project-based Pedagogy. International Journal of Engineering Education, 17 (4 & 5), 349-352. Mathews, J. 2010. Using a studio-based pedagogy to engage students in the design of mobile-based media. English Teaching: Practice and Critique, 9 (1), 87-102. Monson, C. and Poros, J. 2003. ACHIEVE Mississippi Workshop, Mississippi State University. Novak, V.M. and Monson, C. (2013). Rethinking Construction Education: th Lessons learned from Industry Innovations. Proceedings of the 49 ASC Annual International Conference. Raidal, S. and Volet, S. 2009. Preclinical students’ predispositions towards social forms of instruction and self-directed learning: a challenge for the development of autonomous and collaborative learners. High Education, 57, 577-596. Savery, J. 2006. Overview of problem-based learning: Definitions and distinctions. The Interdisciplinary Journal of Problem-based Learning, 1 (1), 9-20. Yin, R.K. 2003. Case Study Research. Designs and Methods. Third edition. Sage Publications, London.
Proceedings: 9th Built Environment Conference
2-4 August 2015, Durban, South Africa
ISBN 978-0-620-67120-0
page 78
ASOCSA2015- 72
Determinants of Skill Shortages of Construction Workers at the Eastern Cape Province of South Africa Aiyetan, Ayodeji Olatunji
[email protected] Department of Construction Management and Quantity Surveying, Fac. of Engr., Built Env. And Sciences, Durban Univ. of Techn., Durban, KwaZulu-Natal, South Africa. 031 373 2585, 0748426297 ABSTRACT AND KEYWORDS Purpose of this paper Skills shortage could lead to bad image both of the contractor and the industry. This study aims to access the determinants of skill shortages in the Eastern Cape of South Africa and suggest ways of mitigating them. Design A questionnaire survey was conducted to identify and access determinants of skills shortage. A total of thirty questionnaires were analysed for this study. Findings Findings include: government policies, skills development predicaments, and condition of working environment are determinants of skill shortage. Effects are: adversely affect quality of work, late payment and affect company’s image. The strategies for the reduction skill shortages are: training, giving of incentives, and rewards, and recruitment and retention. Practical implications Arising from the finding, the application of strategies to mitigate skill shortages could lead to sustaining high quality of work in the industry. Value of paper The mitigation of findings will ensure adequate supply of skilled workers. Keywords: Construction, Practice, Skill shortage, Construction workers
Proceedings: 9th Built Environment Conference
2-4 August 2015, Durban, South Africa
ISBN 978-0-620-67120-0
page 79
1. INTRODUCTION The amount of resources possessed by a company reflects its image and is a key criterion for competitive advantage. Skill is required for productivity of quality product. Skilled labourers are assets to a company, because they reflect good image and serve as means for continuous existence of the company. Clients are always satisfied with high standard of work and lead to client continuous patronage. Skilled labour shortages causes poor quality product, bad company’s image, delay in the delivery of project, increases in final cost figure of project, client dissatisfaction, and so on. It is in the interest of contractors to continuously seek for ways of improving labourer’s skills, because it will positively impact on company image. The public and private sector have roles to play in the provision of skilled labour in the building construction industry. Government (the public sector) should provide enabling environment for new entrants into the industry to bridge the gap of skill shortages. The private sector should stand as mentor to labourer’s relative to training labourer’s to acquire a skill. This study aims to access determinants of skill shortages in the building construction industry with particular reference to the Eastern Cape Province in South Africa. 2. LITERATURE REVIEW 2.1. Causes of skilled labour shortage Several author, such as Janse Van Rensburg et al. (2012); Morton, (2009), and the Construction Industry Development Board (CIBD) (2007) have identified causes of skill shortage. These are discussed as follow. 2.1.1. Younger Generation unwilling to take part in industry The focus of the younger generation is to go through a tertiary institution, graduate and get an office work. Learning a trade to obtain a skills for work is unattractive to them Saleh (2008). The younger generation view construction work as physically challenging, unstable as it entails moving around and often dangerous, thus resulting in opting to pursue other careers. 2.1.2. Wage Problems Low wages constitute a major cause of shortage of skill. This is coupled with the non- permanent nature of job in the industry, this situation has the potential to cause skilled labourers in the construction industry not to have a stable income.
Proceedings: 9th Built Environment Conference
2-4 August 2015, Durban, South Africa
ISBN 978-0-620-67120-0
page 80
2.1.3. Conditions of the working environment The poor conditions of work associated with construction contribute to younger generation’s lack of interest in picking up a career in construction. The work environment is exposed to weather elements, which is harsh and safety issues are not always guaranteed. The activities of construction work usually take place outdoors under risky conditions, extremely hot or cold weather, with sometimes no safety and safety and health conditions considered. Inspection conducted by Department of Safety and Health (DOSH) (2010) found that one of the main contributory factors of accidents at construction sites was the lack of commitment by employers to implement measures to improve occupational safety and health. 2.1.4. Economic Factor Increased construction activities give rise to people having opportunity to work. It stands as an encouragement to the younger generation to learn skills and having a career in the construction industry that will eliminates skills shortage. The lack of high construction activities may lead to fewer entrants to the industry and lead to skill shortages. 2.1.5. Government policy Government policies in the form of regulating basic wage pay relative to specific jobs, such as construction trades may go a long way to reduce skills shortages in the construction industry. 2.1.6. Skills development predicaments There exist predicament relative to skills development of potential workers these in terms of material, mentors and funds are required for skills development. Another version expressed by Jansen (2012) states that large sums of money are often forgone through a high number of black learners and students opting to drop-out of, or taking longer than the minimum period to complete their learner ships and university courses. 2.1.7. Incorrect use of skills development The incorrect matching of interest of candidate to skills development and relevance to the construction industry have high influence on skills shortage.
Proceedings: 9th Built Environment Conference
2-4 August 2015, Durban, South Africa
ISBN 978-0-620-67120-0
page 81
2.2. Impacts of skilled labour shortage to the construction industry The Department of Labour (2006/2007) and Development Policy Research Unit (2007) have identified impacts of skill shortage, they are discussed below. The problem of skilled labour shortage has directly or indirectly brought negative impact to the construction industry. The impact brought by the problem of skilled labour shortage can lead to the end-results affecting the construction cost and quality. The impact of poor capacity, during project implementation, has significant implication for the whole project delivery as projects are exposed to possible cost and time overruns. Battaineh (1999) evaluated progress reports of 164 building and 28 highway projects constructed between the years 1996 – 1999 in Jordan, and established that extensive delays existed with average ratios between actual completion to the planned duration of 160 %, for road projects and 120 % for building projects. Assaf and Al-Hejji (2006) that found that only 30 % of construction projects in Saudi Arabia were completed within scheduled time and that the average time overrun was between 10 % and 30 %. 2.2.1. Quality of the work affected Quality with regard to construction project is a major concern to clients and therefore the non-achievement of quality leads to client dissatisfaction. Dainty et al (2005) describe skills shortages as critical in the construction industry that it results in poor quality work. This arises from contractors employing unskilled labour to perform task. 2.2.2. Increase in construction cost Due to skill shortages and in order to attract skilled workers to perform task, wages may have to be raised, this will increase the construction cost. This is done to avoid delays and to satisfy the client and the consultants. 2.2.3. Construction delay Skills shortages will cause delay in the delivery of a project. This will imply the sourcing skilled labour outside the vicinity of the project constituting time wastage relative to their importation and cost increases. Shortage of skilled labour cause delay of construction projects, since skilled labour is one of the important resources that is required for construction. Therefore, lack of skilled labour may result in snail speed of development.
Proceedings: 9th Built Environment Conference
2-4 August 2015, Durban, South Africa
ISBN 978-0-620-67120-0
page 82
2.2.4. Effects of delay There are several studies that have been conducted regarding the effects of delay. Studies from Aibinu and Jagboro (2002), Sambasivan and Soon (2007), and Sun and Meng (2009). From the contractor’s viewpoint, delays are simply an additional liability as construction period becomes longer. The longer the period, it results in higher overheads, costs and expenses, and the entire contractor’s working capital may become trapped in one project. Of all the effects of delay, six most common effects of delay were identified and these are discussed below. 2.2.5. Cost overrun Sambasivan and Soon (2001) in their study of delay effects in the construction industry found cost overruns to be the second most influencing factor relative to effects of delay. Aibinu and Jagboro (2002) found that cost overrun is the most frequent effect of delay. 2.2.6. Late payment Poor quality of work may attract late payments; client dissatisfaction may lead to is lack of commitment and cause late payment. This is supported by Assaf and Al-Hejji (2006) who found that late payment is a major problem in Western countries. 2.2.7. Rescheduling Rescheduling is the change of original schedule of time in order to respond to disruption and problems which have occurred. Rescheduling occurs as a result of repetitive work prolonging the delivery date of project and are traceable to poor quality of work stemming from workout from unskilled labour on employment as a result of skills shortages. 2.2.8. Affect company reputation Reputation refers to overall performance of a firm over a long time. The reputation of a company is very important because an adversely affected reputation can become a business threat, according to Aiyetan et al. (2014). 2.2.9. Lost productivity and efficiency Skills shortages lead to delays caused by construction mistakes will need rework, and this leads to a significant increase in the amount of
Proceedings: 9th Built Environment Conference
2-4 August 2015, Durban, South Africa
ISBN 978-0-620-67120-0
page 83
work the labourers are required to complete. This directly reduces the productivity and efficiency of the working labourers. Lost productivity and efficiency of the labourers always occurs when delays happen. 2.3. Possible strategies to overcome shortage of skilled labour Further, The Department of Labour (2006/2007) and Development Policy Research Unit (2007) enumerated possible strategies to mitigate skill shortage, they are discussed as follow. There are various types of possible methods that can be adopted to overcome the problem of skilled labour shortage. Each of these ways differ in relation to degree of effectiveness. These methods are to raise the image of construction industry and make work in construction industry more attractive to labourers. These methods are as follows: 2.3.1. Apprenticeship There are a number of ways to alleviate skills shortage. The ways include; increase wages and other incentives (overtime), implementation of training incentives, employing foreign labour or event outsourcing construction work to foreign sources, and reduction of demand through automatic and technology). 2.3.2. Training Training the preparation of oneself through the performance of a set of instructions, which are later recalled at the workplace. This could be formal or informal. This training could be relative to company’s employees to acquire new skills to match a demand and retaining the employee. In this way skills shortage could be reduced. 2.3.4. Incentives / Rewards Attaching lucrative incentives / rewards, such as housing loan, car loan, holiday abroad, free education of children, to a skill with a view to attract younger generation to pick up career in such skills acquisition. In addition, a retention mechanism and a performance driver, long-term incentive schemes form a key component of executive pay that could lead to a reduction in the level of skills shortages. 2.3.5. Recruitment and Retention In order to recruit or retain the skilled labour in the market, the employers need to do their best to attract them by providing higher
Proceedings: 9th Built Environment Conference
2-4 August 2015, Durban, South Africa
ISBN 978-0-620-67120-0
page 84
salaries and better benefits. Better benefits, high salaries and greater job security will attract new employees and retain the skilled labour. 2.3.6. Improvement of the working conditions The perceptions of the industry are a major barrier to attracting the participation of labour. This is relative to accidents which are fatal, construction is hard, difficult, and workers expose to extremes of weather conditions. A respectable image of the industry will attract more locals to joins the industry, thus leading to a reduction of skill shortage and migration of labour. 2.3.7. Extension of the retirement age The extension of retirement age of skilled laour may assist in the alleviation of skill shortages. This older worker could train the young generation relative to skills acquisition. The older worker may stand only to supervise work. In this way the bridge of skill shortages may be blocked. The most experienced phase of a person’s life is between the ages of 55 to 65. The private or government agencies need to take full advantage of this human resources. This will allow them to take part in construction, and thereby live a more high value life. It is also an effort to extend their working lives in the labour force. 2.3.8. Use of simplified construction method Industrialised Building Systems (IBS) is a construction process that utilises techniques, products, components, or building systems which involve prefabricated components and on-site installations. IBs can be recommended as an alternative approach of construction that will change the scenario of the current local construction industry towards a systematic approach of mass production of construction materials. The advantage of IBS are the reduction of labour, less wastage and increase in the construction site cleanliness and better quality control. 3. RESEARCH METHODOLOGY The study aims to assess determinants of skill shortages in the building construction industry of the Eastern Cape province of South Africa. Registered companies with the CIDB were surveyed. The sample frame consists of contracting firms (50). All were surveyed, due to the small size of the sample frame. Questionnaire survey was conducted. Questionnaires were administered via post. Thirty (30) questionnaires were returned filled representing (60%) response rate was achieved. Descriptive statistics is employed for the analysis of data. Cronbach’s coefficient α value for all the construct were > .70, which indicates
Proceedings: 9th Built Environment Conference
2-4 August 2015, Durban, South Africa
ISBN 978-0-620-67120-0
page 85
adequate proof of internal consistency of all factors in each construct. Factor analysis test was conducted to test the agreement between factors in each in each category. Factor analysis loading obtained for factors, the majority are greater than 0.60, which is acceptable for the sample size. Respondents with B.Tech (30.3%), followed by Diploma in construction management (26%). Few of the respondents are registered with their professional bodies. Respondents with years of experience above six years (85%) predominate. Respondents’ organisations have being involved with over 16 projects on the average. Standard deviation is used to enable ranking of factors with the same mean score. 3.1. Data presentation and analysis Below are presented data obtained for the study and their analysis. Table 1: Factors contributing to skilled labour shortage S/N 1 2 3 4 5 6
Factors Government policy Skills Development Predicaments Condition of Working Environment Economic Factor Incorrect use of skill development Wages problem
Mean Score 3.10 3.00 2.96 2.70 2.60 2.50
Ranking 1 2 3 4 5 6
It is noteworthy that all factors that contribute to skill shortage have MS’s equal or greater than 2.5 on a five point Likert scale. This indicates a moderate to near high influence. Table 1 presents factors contributing to skill shortages in the Eastern Cape of South Africa. Government policy (MS=3.1). This is attributable to the following government inherited a workforce that lacked skill as a result of the system of governance that was in place. Most people are skilled in other sectors of the economy, such as mining and agriculture. Since the inception of a new type of governance, not much have been achieved in terms of changing policies to empower its citizens particularly in the construction industry where policies have been put in place the effect is not felt relatively to meeting current demand. This phenomenon has affected the construction industry in the Eastern Cape. Next to government policy is skills development predicaments (MS-= 3.0). There are quite a number of problems regarding labour skills development. The problem ranges from venues, equipment and instructor. These compound the problem of skills development of labourers. Next to skills development predicament is conditions of working environment (MS=2.9). The condition of working environment
Proceedings: 9th Built Environment Conference
2-4 August 2015, Durban, South Africa
ISBN 978-0-620-67120-0
page 86
in the construction industry is harsh, exposed to weather elements. This discourages new entrants into the industry, leading to skills shortage. Unlike the white collar jobs where work is done under controlled room temperature, which is attractive. Least among factors contributing to skills shortage is wage problems (MS=2.5). Wages are low for labourers are low in construction industry compared to some other industries like mining, and having better condition of service to labourers. This contributes adversely to skills shortage. Table 2: Effects of skilled labour shortage S/N 1 2 3 4 5 6 7 8 9 10
Factors Quality of the Work Affected Late Payment Affect Company Reputation Construction Delay Lost production and efficiency Extension of Time Rescheduling Cost overrun Increase in Construction Cost Extension of Time
Mean Score 3.70 3.65 3.61 3.60 3.50 3.4 3.38 3.28 3.20 3.10
Ranking 1 2 3 4 5 6 7 8 9 10
Table 2 reveals the effect of skills shortage in the Eastern Cape province of South Africa. The factor with the most effect is quality of the work is affected (MS=3.40). Inexperienced labourers perform work and in most cases, work is not done to high standard. This affects company’s image and also the image of the industry and may lead to low patronage. Next to quality of the work affected is late payment (MS=3.65). Late payment results from client dissatisfaction relative to poor quality of workmanship. Late payment may lead to late delivery of project and lack of commitment on the part of labourers and cause absenteeism. Next to late payment is affect company’s reputation (MS=3.61). Arising from poor quality work and late payment, this ultimately leads to lack of commitment and absenteeism of Labourers Company’s image may be adversely affected. This does not positively contribute to a strong competitive advantage factor to the company. The least effect of skill shortage is extension of time (MS=3.10), this results from additional time taken to remedy work, warranting extension of time. Next to extension of time is increase in construction cost (MS=3.2). This increase in construction cost is relative to this contractor. It’s a result of rework caused by the construction the final construction cost may have increased based on using unskilled labour to execute work. Next to increase in construction cost is cost overruns (MS=3.28). This is relative to the project, as a result of professionals
Proceedings: 9th Built Environment Conference
2-4 August 2015, Durban, South Africa
ISBN 978-0-620-67120-0
page 87
staying longer than required on the project. Fees will have to be paid, overhead cost increased, plant and equipment staying longer than required on site, payment of accommodation and other increases causes cost overruns. Table 3: Strategies for reducing skills shortages S/N 1 2 3 4 5 6 7 8
Strategy Training Incentives / Rewards Recruitment and Retention Improvement of the working conditions Use of simplified construction method Extension of the retirement age Attract the young generation Apprenticeships
Mean Score 4.10 3.70 3.40 3.38 3.36 3.30 3.25 3.20
Ranking 1 2 3 4 5 6 7 8
Table 3 indicates strategies for reducing skills shortages. The best strategy for reducing skill shortage is training (MS= 4.10). This could be formal or in formal training of labourers. Company may train workers and make them sign bond regarding time of serving the company in return. In this way skills shortage may be reduced. Next to training is incentives and rewards (MS=3.7). The inclusion of good incentive and rewards scheme, such as housing loan, furniture loans and holiday expenses could attract new entrants to the industry thereby eliminating skills shortage. Next to incentives and rewards is recruitment and retention (MS=3.4). Job security is a main factor to labourers being retained on a job. The understanding of labourers of them having a career and a future in a company makes them want to spend their working years with the company and develop on the job. The least strategic factor that reduces skill shortage is apprenticeship (MS=3.2). Apprenticeship is rated least compound to other study that rates this factor among the first three top ranking factors. The likely reason for this may be the need to earn a living as a result of family responsibility. Next to apprenticeship is attract the young generation (MS=3.25). Attracting the young generation may be through incentives, security of job, qualifying for pension scheme and so on. 4. CONCLUSIONS AND RECOMMENDATIONS 4.1. Conclusions The following are the conclusion reached based on the analysis of data:
Proceedings: 9th Built Environment Conference
2-4 August 2015, Durban, South Africa
ISBN 978-0-620-67120-0
page 88
Government policy, skills development predicaments, and condition of working environment are the main determinants of skill labour shortages in the eastern cape of South Africa. The most felt effects of skill shortages are, quality of work is affected, late payment, and affects company’s image. The best strategies to mitigate skill shortages are, training, 4.2. Recommendations Recommendations were drawn based on the conclusions reached from data analysis, they are: Government should put in place policies that will attract young generation to enter the industry, such as vocational centres and incentives. Continuous training should be given to labourers attached to company and absorbing them into the company at the completion of training ensuring job security will mitigate skill shortages. Retirement age of skilled workers should be reviewed. An increase in the age for retirement of skilled worker will enable skills transfer and mitigate shortages. 5. REFERENCES Aibinu, A.A. and Jagboro, G.O., 2002, The Effects of Construction Delays on Project Delivery in Nigeria Construction Industry. International Journal of Project Management, 20(4), 593599. Assaf, S.A. and Al-hejji, S., 2006, Causes of Delay in Large Construction Projects. International Journal of Project Management, 24(7), 349-357
Construction Industry Development Board (CIDB). (2007), Skills for Infrastructure Delivery in South Africa: The Challenge of Restoring the Skills Pipeline. Pretoria: cidb. Dainty, A.R.J., Cheng, M. and Moore, D.R., 2003, Redefining Performance Measures for Construction Project Managers: An Empirical Evaluation. Journal of Construction Management and Economics, 21, 209-218. Department of Safety and Health (DOSH). 2012, Construction Regulations. Government Gazette, Notice 391 of 2010. Department of Labour. 2006/2007, State of Skills in South Africa. Pretoria: Government Press. Development Policy Research Unit (DPRU). 2007, Skills shortages in South Africa: Key issues. DPRU Policy Brief Series. School of Economics. Cape Town: University of Cape Town.
Proceedings: 9th Built Environment Conference
2-4 August 2015, Durban, South Africa
ISBN 978-0-620-67120-0
page 89
Janse van Rensburg, D.J., Visser, M., Wildschut, A., Roodt, J. and Kruss, G., (2012), Impact Assessment of National Skills Development Strategy II. A Technical Report on Learnership and Apprenticeship Population Databases in South Africa: Patterns and Shift in Skills Formation. HRSC Press. Morton, R. (2009), Construction UK: Introduction to the industry, 2nd ed. Oxford, Blackwell Publishing Ltd. Saleh, S.B. @ Aman, 2008, Causes of Poor Participation of Local Workers In Malaysia Construction Industry And Strategies For Improvement, University Technology Malaysia, Malaysia. Sambasivan, M. and Soon, Y.W. 2007, Causes and Effects of Delays in Malaysian Construction Industry. International Journal of Project Management, 25(5), 517-526
Proceedings: 9th Built Environment Conference
2-4 August 2015, Durban, South Africa
ISBN 978-0-620-67120-0
page 90
ASOCSA2015-019
Challenges for Higher Education for energy efficiency in buildings in KwaZulu-Natal, South Africa Vadinie Moodley1, Vittorio Tramontin2
[email protected],
[email protected] 1,2 School of Engineering, Property Development Department, University of KwaZulu-Natal, Howard College, Durban 4041, South Africa. (Tel.: +27 312601183. Cell.: +27 745897223) 1
ABSTRACT AND KEYWORDS Purpose: This research investigated the challenges for relevant undergraduate programmes at the University of KwaZulu-Natal in preparing future design team members to implement new energetic requirements in buildings in KwaZulu-Natal. Design/methodology/approach: Qualitative and quantitative research design was used. Survey questionnaires were distributed to professionals, relevant lecturers and results were quantified. Interviews were conducted with Programme Coordinators and lecturers, and then coded and analysed. Research limitations: The context of the analysis was limited to the relevant UKZN undergraduate curricula and modules. A low response rate from one programme was apparent due to there being no current running second and third year courses. Findings: Results showed that professionals of the design team believed that an improvement of energy efficiency undergraduate education would be beneficial for their practice. Certain UKZN programmes do face challenges in embedding these aspects into the current curricula, especially due to a lack of awareness amongst students and potential clients as well as programme constraints. Response to conference theme: Innovating construction education programmes by embedding the topic of energy efficiency in buildings would benefit the entire construction industry and built environment. Practical implications: The outcomes of this study could aid in upgrading and developing undergraduate curricula on building design and technology in South Africa. Proceedings 9th Built Environment Conference Challenges for Higher Education for energy efficiency in buildings in KwaZulu-Natal
Proceedings: 9th Built Environment Conference
31 May - 2 June 2015 Durban, South Africa ISBN ……………………..
2-4 August 2015, Durban, South Africa
ISBN 978-0-620-67120-0
page 91
Keywords: Energy efficiency in Buildings, Undergraduate Education. Conference sub-theme: Sustainable Green Building 1. INTRODUCTION Priorities within the building industry have evolved significantly over the past decade with regard to recent sustainability requirements (Brunsgaard et al., 2013). Developing countries, such as South Africa, have only recently been addressing the challenge of sustainable development with regards to the implementation of green and energy-efficient measures in buildings. The national regulation on energy efficiency in buildings, for example, came into effect only in 2011. In order for South Africa to move toward a more sustainable future, proper education of professionals in sustainable and energy-efficient design is required in order to achieve sustainability goals in the construction industry. The lack of capacity of the construction sector to implement sustainable practices has been identified as a major barrier to sustainable construction in developing countries (Reffat, 2004). This gap is emphasised by a limited research production about green buildings and sustainability of the built environment in the country. According to the Green Star South Africa certification, KwaZulu-Natal, in particular, has few "certified" green buildings. Thus, there is very limited experience in green and energy-efficient buildings, including the education and training on this specific topic. Along with the increasing awareness of the sustainability issues, the need for education towards sustainable development is becoming more evident (Pavlova, 2007). Knowledge and skills should be primarily acquired through education, and particularly Higher Education plays a key role in preparing professionals of the built environment to implement sustainable and energy-efficient requirements in buildings and to embrace the challenge of leading the construction industry towards sustainability targets and energy efficiency principles. Previous research (Hankinson and Breytenbach, 2012) highlighted the need to make sustainable design a priority in higher education curriculum to achieve this aim. Desha and Hargroves (2009) reported the results of a report of the US National Council for Science and the Environment that marked the very limited information about the status of sustainability education and practice in any nation. Reasons were primarily related to the lack of surveys across building technology degrees and possible lack of enthusiasm amongst university professionals to participate in them. Considering these premises, this paper addresses the issue of education as a barrier to implementing energy-efficient strategies in the built environment in the context of a developing country such as South Africa. The aim of this study is to investigate whether the current undergraduate curricula at the University of KwaZulu-Natal (UKZN) focusing on building design, construction and management prepare future
Proceedings: 9th Built Environment Conference
2-4 August 2015, Durban, South Africa
ISBN 978-0-620-67120-0
page 92
members of design teams to adequately implement the new energetic requirements in buildings in KwaZulu-Natal. Related objectives include: to establish the perception of the level of current design team individuals’ undergraduate education on the topic of energy efficiency in buildings; to find possible gaps and causes with regard to the integration of energy efficiency within the relevant UKZN curricula; to provide recommendations of improving the current education of energy efficiency in buildings in UKZN. The study primarily utilised a qualitative approach to research by means of surveys and interviews to gather data. Initially, an online survey was conducted amongst professionals of the built environment located in the KwaZulu-Natal. Another survey as well as personal interviews were conducted amongst academics of the main UKZN programmes related to building design and technology. Results were quantified by means of a combination of various bar graphs and radar charts. The subsequent section includes a review on the literature about the topic of education for green and energy efficiency in buildings. Following this, the methodology of the research is explained in detail. The main results obtained are summarised and commented on in the next section, and finally conclusions and recommendations are proposed based on the findings of the study. 2. EDUCATION AS A CRITICAL STEP FOR ACHIEVING ENERGY EFFICIENCY IN BUILDINGS Green construction refers to a building that is environmentally sensible and energy and resource efficient throughout the building’s life cycle (GBCSA, 2014a). The United States Environmental Protection Agency (USEPA, 2012) recognised energy efficiency and renewable energy as one of the main components of green building. Energy efficiency in buildings is achieved by introducing sensible and practical energy saving measures when buildings are designed or built (SABS, 2014). The reason for constructing energy-efficient buildings is to contribute toward the movement of sustainable development. Education has a primary role in this transition: as Zografakis et al. (2008: 3226) observed, “a lot of today’s world vices can be eliminated if certain targeted modules and adapted curricula are introduced in the schooling system. One of these vices is energy squandering with all its negative consequences for the planet”. Previous studies observed that energy consumption can be cut down to less than fifty percent in green buildings in comparison to that of a conventional building without compromising on cost (GBCSA, 2014b). However, reaching these targets imply firstly to equip future professionals of the built environment with adequate knowledge and skills. In South Africa, the regulation on energy efficiency requirements of buildings has only come into effect very recently in 2011. The country, before the end of 2011, had no mandatory regulations governing the use of energy (Reynolds, 2012). National Building Regulations can be complied with by fulfilling the standards in SANS 10400-XA: Energy Usage in Buildings. SANS
Proceedings: 9th Built Environment Conference
2-4 August 2015, Durban, South Africa
ISBN 978-0-620-67120-0
page 93
204 regulations are not mandatory at the current stage, but under certain conditions are complementary to SANS 10400-XA for the compliance with some requirements. Reynolds (2012) explained that the SANS 204 standard is more complex than SANS 10400-XA as its requirements are more rigid and aim to a higher energetic quality of buildings. For this reason, SANS 204 is used as a reference base for the Green Star South Africa Rating system adopted by the Green Building Council of South Africa. Both SANS 10400XA and SANS 204 aim to reduce the consumption of energy resources, such as fuel and electricity, for the operation of buildings. Since the two standards are relatively new, it is likely a significant reason for higher education curricula (in building design and construction related programmes) possibly not covering all the relevant topics on energy efficiency requirements for buildings. The key sections affecting the energy consumption of buildings in accordance with the energy efficiency standards are site and building orientation, building architectural design, materials and assembly, and building services. Designing and constructing energy-efficient buildings require a greater sensibility and preparation of designers and professionals involved in the construction process. Brunsgaard et al. (2013: 2) observed that the development and operation of such buildings are complex tasks “that fully require the combined effort of designers in the development of the projects, qualified architects and engineers with different skills....as well as building operators capable of maintaining the building in its full energy performance”. The necessity for personnel qualified in energy-efficient building has proven to be highly important in the construction industry today. South Africa has committed to foster the country to achieve energy efficiency through “awareness campaigns, demonstration programmes, audits and education” (DME, 2009: 10). It is understood that furthering the education of scholars and professionals would lead to an increase in the number of qualified professionals practicing green building design, management and maintenance, which in turn would lead to an improvement of the energetic quality of the built environment. Reffat (2004: 4) highlighted that the “lack of capacity of the construction sector to implement sustainable practices” is a major barrier to sustainable construction. Results from a study done by Landman (1999) indicated that education in the implementation of sustainable building strategies is often more significant than the stage of technical training. In South Africa, where the topic of energy efficiency in buildings has been addressed only recently, the issue of education as a barrier to implementing energyefficient strategies, should be addressed as one of the first steps in the process of implementation of sustainable measures in the built environment. Providing sufficient education in sustainable strategies is not without its challenges. A multitude of barriers to embedding these topics of sustainability and energy-efficient construction in education were identified. Dawe et al. (2005) highlighted that curricula were extremely crowded to consider the inclusion of more modules and that these new topics required additional knowledge and skill development from academics, and that there
Proceedings: 9th Built Environment Conference
2-4 August 2015, Durban, South Africa
ISBN 978-0-620-67120-0
page 94
was little institutional motivation and dedication to the work that goes into renewing the curricula. Also, Tomkiewicz (2011) observed that educational institutions have unsuccessfully communicated a thorough analysis of sustainability and are ignoring the more holistic aspects of the topic. She concluded that these information gaps proceeded to create and give rise to an increase of infrastructure problems and perceived obstacles to sustainable development. The inclusion of sustainable strategies in Higher Education curricula has been described as a recent challenge with academic systems by several research (Barth and Rieckmann, 2011; Gelegenis and Harris, 2013; Wang et al., 2013). Generally, it has been found that cooperation and backing from university leadership, protection of lasting monetary resources, advancement of suitable managerial capabilities and the integration of courses in sustainability and energy efficiency in present curricula are crucial aspects for the short and long-term ecological advancement of disciplines (Wang et al., 2013). This paper therefore provides a contribution to this debate by investigating the topic in the KwaZulu-Natal context and particularly looking at the undergraduate curricula at the University of KwaZulu-Natal. KwaZulu-Natal, the second highest populated province in South Africa, is currently home to only 5 out of the 48 Green Star rated buildings in the country (GBCSA, 2014c). That is a mere 10% of the officially recognised green buildings of the country. The need of qualified local professionals and education that can promote environmental and energetic quality in the built environment is particularly evident. 3. METHODOLOGY The paradigm chosen for this study is based on positivism which helped the researchers investigate the hypothesis that the UKZN curricula are struggling to incorporate the strategies and criteria for energy efficiency in buildings. The research adopted a mixed method approach. Qualitative research was used as main approach whilst investigating and collecting data about final users’ opinion and history. Qualitative data is in fact primarily “descriptive in character” (Walliman, 2011: 73), thus a qualitative approach was favoured to give importance to personal experiences and descriptions of survey and interview participants (Davies, 2007). The quantitative approach was limitedly adopted to quantify results from investigative research such as surveys and interviews. This aided in analysing the results of the research and drawing conclusions from the collected data. The data collection primarily involved desktop studies, surveys and interviews. A comprehensive literature review was conducted investigating the necessary education needed in implementing energy efficiency in buildings and of the existing gaps in higher education training in other parts of the world. This information was used to design survey questionnaires.
Proceedings: 9th Built Environment Conference
2-4 August 2015, Durban, South Africa
ISBN 978-0-620-67120-0
page 95
Firstly, an online survey questionnaire was created and submitted to a sample of design firms to their current practicing design teams. The research sample was selected through purposive sampling oriented to focus on a group that was most likely to provide significant and appropriate data in terms of relevance and depth (Oliver, 2006). Within the selected group of professionals of the built environment, a cluster random sample of fifteen architectural firms, fifteen mechanical engineering firms and five quantity surveying firms was selected within the KwaZulu-Natal area. The questionnaire contained mainly multiple choice and declarative questions aimed at investigating the professionals’ perception of the importance of the topic of energy efficiency in buildings and related regulation within their common practice, their perception of the standard of their undergraduate tertiary education in this topic, with regard to UKZN graduates, and their opinion about the importance of integrating this topic within Higher Education curricula. The results of the survey were quantified by means of graphs and tables and were used as a preamble to the following phases of the research, as they reinforced the problem statement and the hypothesis. Secondly, the programme coordinators and lecturers in undergraduate curricula of Architecture, Mechanical Engineering and Property Development, as well as Housing at UKZN were specifically selected through purposive sampling due to the relevance to the study. The selection was driven by the relevance of the topic of energy efficiency in buildings to their curriculum and related specific modules. A survey questionnaire was created based on the findings of the literature review, using a combination of open, dichotomous, multiple-choice and declarative questions, and submitted to the lecturers or relevant subjects. A similar survey investigation was successfully conducted by Desha and Hargroves (2009) in Australian engineering curricula. The questionnaire aimed primarily to gain insights about the relation of the modules with and their coverage of the topic of energy efficiency in buildings and related new SANS regulation, and to understand the effort from academics and the Institution, into renewing the curricula to support education in such a sensitive topic. The outcomes were then interpreted, summarised and illustrated through graphs, and compared to the findings from the literature, in order to find possible gaps. The quality of the information and data gained was enriched through face-to-face semistructured interviews, mainly based on open ended questions conducted with the programme coordinators. The aim was to gain a more in-depth perception of the problem from leadership and coordination positions in the various curricula, investigate possible causes for the gaps emerged and outline potential solutions. Finally, based on the findings of the previous phases and a review of the literature in the international context, conclusions and recommendations for possible ways of improving Higher Education in energy efficiency in buildings in KwaZulu-Natal were proposed. Ethical aspects were carefully considered while conducting the research. The participants were previously informed about the nature and aim of the study, and about the contents of the surveys and interviews
Proceedings: 9th Built Environment Conference
2-4 August 2015, Durban, South Africa
ISBN 978-0-620-67120-0
page 96
through an informed consent form. The participation in the study was on a voluntary basis. The responses were kept confidential and disclosed as group data and not individually. Anonymity was an option for the respondents and interviewees of the study. 4. RESULTS AND DISCUSSION 4.1 Built environment professionals’ survey Built environment professionals of the design team were the centre of the preamble study, which was used to support the research by reinforcing the hypothesis that professionals need an improved tertiary education to effectively implement energy efficiency and green strategies in the industry. Furthermore, the survey questionnaire helped assess the areas of education that are lacking and indicated whether or not the respondents furthered their education in energy efficiency and how. Within the 40 firms selected to which the questionnaire was sent, 55 professionals responded. Only the UKZN graduates were selected, reducing the sample to 41 individuals (17 architects, 15 mechanical engineers and 9 quantity surveyors), of whom 59% graduated after 2006. It was found that the majority of the respondents were dealing in their practice with energy efficiency requirements in accordance with SANS 10400-XA and SANS 204 regulations (88% of Architects, 80% of Mechanical Engineers and 89% of Quantity Surveyors). However, their understanding of the subject was relatively lacking: apart from Architects, who mostly declared a sound understanding of the topic, most Mechanical Engineers and Quantity Surveyors declared to have an understanding between average (67% of QS and 53% of Mech Engs), poor (22% of QS and 27% of Mech Engs) and very poor (11% of QS). Results indicated that, although most participants declared that they learn about green buildings and energy-efficient strategies during their undergraduate degree, most of them described the level of the education as inadequate (figure 4.1) to effectively implement the strategies and comply with the requirements of new regulation (53% of Architects and 17% of Mech Engs declared average; 29% of Architects, 58% of Mech Eng and 40% QS stated insufficient; 60% of QS and 25% of Mech Engs declared very insufficient).
Proceedings: 9th Built Environment Conference
2-4 August 2015, Durban, South Africa
ISBN 978-0-620-67120-0
page 97
0%
29% %
Architectts
6%
53% 5
112% 25%
Mecha anical Engineerrs
Qua antity Surveyorrs
58%
17%
0% 0%
60%
40%
0% 0% 0%
0% 20% 40% 60% 880% Very insufficie ent Insufficie ent Average e Sufficient Very sufficieent 4 Opinions on n the level of un dergraduate ed ducation to effec ctively implemennt energy Figure 4.1 efficient strate egies and complly with the requiirements of the new regulation
e who said they were not taught these topiccs (only Most of those nical Engine eers and Q Quantity Surveyors) did d not furtheer their Mechan educatiion on the su ubject after g graduation. This T would se eem to be a misstep and a hindrance h to o implementin ng the energ gy-efficient strategies s in building projectss. With rega ards to the ssubject mattter within cu urricula, the topic of ‘Properrties of build ding materialls and energ gy efficiency y parameterss of the building g envelope’ seemed to o be the mo ost lacking amongst thhe three disciplin nes investiga ated (figure 4 4.2).
39% Architects
12 %
29 9% 19% 22% 22%
Mechanical Engineers
31% 3 25% 32% 32%
Quantiity Surveyors
18% 18% 0% 0
10%
20%
30%
40%
Properties of buuilding materials and eenergy efficiency param meters of the building envvelope Passive designn principles
Energy efficientt VAC principles for HV systems Renewable eneergy systems and technologies
F Figure 4.2 Main n critical aspectss not addressed d within undergrraduate curriculla
Th he results of the survey a also showed that the bulk k of the respoondents believe ed that the inclusion of these topics s of green building b and energy efficien ncy are rathe er significantt in the prep paration of design d professsionals for indu ustry and sho ould be inclu ded in underrgraduate curricula.
Proceedings: 9th Built Environment Conference
2-4 August 2015, Durban, South Africa
ISBN 978-0-620-67120-0
page 98
4.2 Lecturers’ survey The purpose of this questionnaire was to establish whether the UKZN courses related to building design and construction are including topics of energy-efficient strategies related to the SANS 204 and SANS 10400-XA and to determine what lecturers believe can be done to improve the embedding of these topics into relevant UKZN curricula. Of the 22 questionnaires submitted, 15 were received and used for the data analysis. The education in energy efficiency in buildings seemed to be taught mostly at third year level during the undergraduate programmes. This suggested that the topic requires a certain level of maturity that follows the foundational concepts taught in first and second year. Elective courses within the Mechanical Engineering discipline seemed to be more focused on the topic. However, compulsory courses would likely better prepare students for implementing energy-efficient design in buildings during their employment after they graduate. The majority of the courses (53%) had only been offered for a period of 5-10 years and 74% the courses had renewed their curriculum in the last five years. This could mean that these courses, related to buildings and energy efficiency, have been taught at UKZN as a component of recent curricula advancement as result of changing legislation and new technologies. The recent nature of the topic could be a cause for the lack of students understanding the relevance of energy efficiency in buildings. Lecturers emphasised that awareness is key amongst students within the discipline. It was apparent that many of the courses (73%) deal with aspects of SANS 10400-XA regulation. However, just half of the lecturers believed that their course will help students to practically implement these strategies in buildings as a professional. Over 40% of courses surveyed indicated that energy efficiency in buildings was viewed as a ‘minor component’ of the course. The extent of the education on building type energy efficiency within the surveyed courses seemed to be lacking and many of the concepts and principles are not addressed in detail. The degree to which the courses surveyed are lacking in education on the awareness of energy efficiency in buildings, roles and responsibilities and its value for the society is even greater (only 18% of the courses cover these aspects in detail). Required and optional reading lists are generally not a favoured approach used by lecturers. Most lecturers (80%) believed that their courses cover the topic sufficiently and those who did not, indicate that improvement can be made in areas of fundamental principles and base theory, information and application of theory. Heads of school seemed to be playing a part from lecturers’ perspective in encouraging the inclusion of the topic. However, the University’s dedication was found to be average in their opinion in terms of its depth and level of commitment to integration of the topic in education.
Proceedings: 9th Built Environment Conference
2-4 August 2015, Durban, South Africa
ISBN 978-0-620-67120-0
page 99
4.3 Programme coordinators’ interviews The results of the interviews with the programme coordinators suggested that a main concern amongst all areas of interview topics was “awareness” amongst academics. A minority of the programme coordinators believed this topic was more of a bonus topic than a necessary core component. Curricula shortfalls were generally believed to be a combination of issues relating to programme structure, funding, awareness and a lack of research. The majority of interviewees reinforced the idea that the undergraduate degree is responsible for adequately preparing students to implement these energy-efficient building strategies after graduation. However, there was mention that only a basic level should be addressed in the undergraduate degree. Programme coordinators understood the relevance of the topic which suggested that they were open to improvement, should opportunities come along to develop their curricula. The biggest change that interviewees believed UKZN could become involved with is the education of allied disciplines on the topic of energy efficiency in buildings. This could require large scale programme curriculum renewal which might be costly. Lecturers’ opinions on improvement from their side were increasing awareness and dedicated annual renewal of course material. These small changes were considered doable for lecturers and could greatly improve course content over the years. International methods of improvement reported in the literature (Desha and Hargroves (2009), including case study development, frequent auditing and awareness raising, were generally considered adaptable to the UKZN context. According to a list of possible resources, gained from the research on the literature, which could be used to further develop education in energy efficiency, Programme Coordinators rated special guest lecturers as the most effective methods, followed by provision of specific readings, case studies and notes. This may suggest that Programme Coordinators are open to outside expertise and are willing to utilise their knowledge to improve the education at UKZN. 5. CONCLUSIONS AND RECOMMENDATIONS The research sought to uncover the challenges and gaps in relevant undergraduate Higher Education curricula, with regard to how they prepare future built environment professionals to implement energy efficiency requirements in buildings in KwaZulu-Natal, particularly in relation to new legislative framework (SANS 10400- XA and SANS 204). Two surveys were conducted, firstly into the built environment professions and secondly within the academic environment and relevant disciplines. Results revealed that professionals of the built environment confirmed that their level of understanding of the topic is quite average amongst Mechanical Engineers and Quantity Surveyors. However, Architects were shown to have a considerably better understanding than the rest, probably
Proceedings: 9th Built Environment Conference
2-4 August 2015, Durban, South Africa
ISBN 978-0-620-67120-0
page 100
because they are now obliged to deal with these aspects to obtain approval of their projects from local authorities. Although the professionals say they have touched on these topics during their undergraduate studies, their perception was that the topics on energy efficiency were not covered in sufficient detail for an effective practical application in their profession. This may probably be related to the recent new legislative framework for the South African context, whose effects on the construction industry need time to be fully understood and to be consequently integrated within higher education. However, a more in-depth knowledge of some core concepts for energy efficiency in buildings (e.g. properties of construction materials, energy performance parameters for building elements, energy-efficient criteria for HVAC systems) emerged as critical aspect that professionals would have needed from their undergraduate education. Main findings of the survey within the undergraduate academic programmes revealed that there is room for curricula improvement within the Architecture, Mechanical Engineering and Property Development programmes. In addition, it was found that the currently saturated time table does not allow for the addition of building specific modules within Mechanical Engineering. An overall belief of low funding from the university was apparent which, if available, could permit the hiring of experts and the training of academics to improve education and curricula. On the whole, it was established that there are challenges faced by the undergraduate programmes to adequately prepare professionals to implement energy efficiency requirements in buildings. Possible solutions deriving from the investigation within the academic environment were identified in the gradual and continuous curriculum renewal, special guest lecturing, information and awareness raising campaigns, supporting learning material as notes and case studies. However, a closer discussion between academic environment and professional bodies could improve the curriculum development in the light of the shortfalls highlighted by the professionals, with regard to what they have received by the undergraduate studies. Promoting this discussion will have positive implications for both parties. 6. ACKNOWLEDGMENTS The authors would like to thank all the firms, lecturers and programme coordinators at UKZN that participated in the study. 7. REFERENCES Barth, M. and Rieckmann, M., 2011. Academic Staff Development as a Catalyst for Curriculum Change Towards Education for Sustainable Development: An Output Perspective. Journal of Cleaner Production, 26, 28-36.
Proceedings: 9th Built Environment Conference
2-4 August 2015, Durban, South Africa
ISBN 978-0-620-67120-0
page 101
Brunsgaard, C., Dvo_ráková, P., Wyckmans, A., Stutterecker, W., Laskari, M., Almeida, M., Kabele, K., Magyar, Z., Bartkiewicz, P. and Op’t Veld, P., 2013. Integrated energy design-Education and training in crossdisciplinary teams implementing energy performance of buildings directive (EPBD). Building and Environment, 72, 1-14. Davies, M., B., 2007. Doing a Successful Research Project: Using Qualitative or Quantitative Methods. New York: Palgrave Macmillan. Dawe, G., Jucker, R. and Martin, S. 2005. Sustainable Development in Higher Education: Current Practice and Future Developments. A report for The Higher Education Academy. UK. Desha, C., J. and Hargroves, K., 2009 (a). Surveying the state of higher education in energy efficiency, in Australian engineering curriculum. Journal of Cleaner Production, 18 (2010), 652-558. DME (Department of Minerals and Energy), 2009. National Energy efficiency Strategy of the Republic of South Africa. Pretoria. GBCSA (Green Building Council of South Africa), 2014a. About green building. [Online] Available at: http://www.gbcsa.org.za/about/about-greenbuilding/ [Accessed 01/02/2015] GBCSA, 2014b. Green Star SA Certified Projects. [Online] Available at: https://www.gbcsa.org.za/projects/certified-projects [accessed 13/03/2015]. GBCSA, 2014c. Certified Projects. [Online] Available at: https://www.gbcsa.org.za/projects/certified-projects/?tool=&type=&rating= &province=KwaZulu+Natal&filter=rated [Accessed 13/03/2015] Gelegenis, J., J. and Harris, D., J., 2013. Undergraduate Studies in Energy Education- A Comparative Study of Greek and British Courses. Renewable Energy, 62 (2014), 349-352. Hankinson, M. and Breytenbach, A., 2012. Barriers that impact on the implementation of sustainable design. University of Johannesburg, South Africa. Landman, M., 1999. Breaking through the Barriers to Sustainable Building: Insights from Building Professionals on Government Initiatives to Promote Environmentally Sound Practices. Masters. United States: Tufts University. Oliver, P., 2006. Purposive Sampling. In V. Jupp (ed.), The SAGE Dictionary of Social Research Methods. SAGE Publications, Ltd. pp. 245246. Available at: http://srmo.sagepub.com/view/the-sage-dictionary-ofsocial-research-methods/SAGE.xml [Accessed 10/03/2015] Pavlova, M., 2007. Two pathways, one destination: TVET for a sustainable future. Virtual conference. October 22 - November 10 2007. n.p. Reffat, R., M., 2004. Sustainable construction in developing countries. Unpublished paper delivered at the proceedings: ‘First Architectural International Conference’, Cairo University, Egypt. Reynolds, L., K., 2012. South African Energy Efficiency. Sustainability Development Executive. SABS, 2014. Energy Efficiency-Overview. South African Bureau of Standards. [Online] Available at: https://www.sabs.co.za/Sectors-andServices/Services/Energy/index.asp. [Accessed 15/02/2015]
Proceedings: 9th Built Environment Conference
2-4 August 2015, Durban, South Africa
ISBN 978-0-620-67120-0
page 102
Tomkiewicz, H., E., S., 2011. Barriers to Implementation of Sustainable Construction Practices in the Homebuilding Industry. Masters. Lincoln: University of Nebraska. USEPA, 2012. Frequent Questions. [Online] Available at: http://www.epa.gov/greenbuilding/pubs/faqs.htm#4. [Accessed 02/02/2015] Walliman, N., 2011. Research Methods. The Basics [Online] Milton Park: Routledge. Available at: http://www.afghanjc.com/wp-content/uploads /2013/02/Research-Methods-The-Basics.pdf [Accessed 31/01/2015] Wang, Y., Shi, H., Sun, M., Huisingh, D., Hannson, L. and Wang, R., 2013. Moving Towards an Ecologically Sound Society? Starting from Green Universities and Environmental Higher Education. Journal of Cleaner Production, 61, 1-5. Zografakis, N., Menegaki, A., N. and Tsagarakis, K., P., 2008. Effective education for energy efficiency. Energy Policy, 36, 3226-3232.
Proceedings: 9th Built Environment Conference
2-4 August 2015, Durban, South Africa
ISBN 978-0-620-67120-0
page 103
ASOCSA 2015- 76
The Effect of Repeating a Test after an Initial Poor Performance on Students’ Subsequent Performance Ephraim Zulu1 (
[email protected]) and Theo C Haupt2 (
[email protected]) 1 School of Engineering, Property Development Department, University of Kwa-Zulu Natal, Howard College, Durban 4001, South Africa (Tel.: +27 312602719, Cell.: +26 09690560) 2 School of Engineering, Property Development Department, University of Kwa-Zulu Natal, Howard College, Durban 4001, South Africa (Tel.: +27 312602712, Cell.: +27 826863457) ABSTRACT AND KEYWORDS Purpose of this paper To investigate whether a repeated test after a poor performance in Measurements will significantly improve students’ performance. Design/methodology/approach A quasi-experimental design was used whereby a test in the Measurements module of third year Construction Management and Quantity Surveying Students in the School of Built Environment at the Copperbelt University in Kitwe, Zambia was repeated without the students’ prior knowledge of this. The resulting total of 26 test one and the repeated test scores were compared with each other using a paired t-test. The sample was then divided into three quartiles and again a paired t-test computed. Findings It was established that repeating a test after poor performance in Measurements yields significantly better results especially for students who performed poorly or average in the first test. Research limitations/implications The sample of the 26 test scores for the research is quite small to be valid for a broad generalisation. Further, the division of the sample into three quartiles farther reduces the sample size for each quartile into very small quartile samples.
Proceedings: 9th Built Environment Conference
2-4 August 2015, Durban, South Africa
ISBN 978-0-620-67120-0
page 104
Practical implications (if applicable) Repeating a test after a poor performance by students may lead to improved understanding. What is original/value of paper? Repeating a test after an initial poor performance by students is an initiative which can be used by lecturers in any field. Keywords: Repeated Test, Poor test performance, Measurements Test.
1.
INTRODUCTION
Reserach has established that, often, one lesson session is not sufficient to deliver the relevant lessons to students. For example, Hdaib et al., (2015) in assessing nurisng students knowledge of administering intra-muscular injections found that one educational session is insufficient to considerably change the knowledge level of students. Kinder and Knecht (2011), while assessing the acdemic performance of fourth year pharmacy “A”, “B”, “C”, “One-D” and repeating students, found that repeating students performed better than other “C-or-below” students. Repeating students had failed some courses and were consequently not allowed to progress to the following year and therfore were repeating the courses under study. In Bukina faso, due to large class sizes and frontal teaching, learning to read is difficult for elementary school pupils (Boiley, 2015). In order to establish whether reading fluency could be improved, an assisted repeated reading programme was used on third grade pupils. The programme involved students reading and re-reading an assigned passage individually until they reached an appropriate level of fluency. It was found that very poor, poor and average readers significantly improved their reading fluency while very strong and strong students remained at the same fluency level (Boiley, 2015). Therefore, Hdaib et al., (2015), Kinder and Knecht (2011) and Boiley (2015) establish that learning a lesson for the second or more times leads to better lesson understnading. For university students who are expected to engage in self study to understand any lessons which may have been missed in class, it remains to be established how much learning takes place when students are required to study the same material for a second time. Therefore, in order to establish whether students would improve on their understanding after an intial poor performance in a Measurements test, the same test was repeated without the students prior knowledge.
Proceedings: 9th Built Environment Conference
2-4 August 2015, Durban, South Africa
ISBN 978-0-620-67120-0
page 105
2.
METHODOLOGY
Noting the poor performance of students in Measurements test one for 2013 and also in test one for 2014, a repeated test was introduced to give students a second opportunity to learn the concepts covered in test one. The exactly same test was repeated without the knowledge of the students. Results of the 2014 test one and the repeated test were compared to establish whether a repeated test would yield significantly better results and therefore suggest that students have a better chance of learning when they have to work on the same material at least more than once. The data were analysed using the Statistical Package for Social Sciences version 16.0 (SPSS) and the results displayed in graphs and tables. Mean error bars of the 2013 test one and 2014 test one were used to show the poor performance of the students. Histograms were used to show the distribution of the scores while adjusted mean error bars of the 2014 test one and the repeated test were used to show that the two test results were different. The dependant t-test was used to establish whether the difference in the mean scores of the 2014 test one and the repeated test seen in the mean error bars was significant after the KolmogrovSmirnov and Shapiro-Wilk tests of normality established that the data were suitable for the parametric t-test. The data were further divided into three quartiles and the parametric t-test performed to establish whether there was any significant difference in the mean scores for the two tests in the different quartiles.
3.
FINDINGS
The average test result for the 2013 test one was 24% and that for 2014 test one was 38.08% as shown in figure 1 below. The performance of the students in the first test for both 2013 and 2014 were below the 50% pass mark set by the university and definitely are a poor performance.
Proceedings: 9th Built Environment Conference
2-4 August 2015, Durban, South Africa
ISBN 978-0-620-67120-0
page 106
Figure 1 Average Test One O Results forr 2013 and 2014 4 with Error Bars s
Figure 2 Histogram of 2014 2 Test One R Results
er to give stu udents a seccond opportu unity to learn n the conceppts, test In orde one wa as repeated and yielded d an average e mark of 52.31% as shhown in figure 3 below. Th he repeated test result show an im mprovement of 14%
Proceedings: 9th Built Environment Conference
2-4 August 2015, Durban, South Africa
ISBN 978-0-620-67120-0
page 107
when
compared
to
the
first
test
results.
Figure 3 Histogram of 2014 Test Two Results
In order to find out if the observed difference between the scores of tests one and the retest were significantly different, an adjusted values error bar at 95% CI was computed. Because the data are from a repeated measures design, it is necessary to adjust the data since SPSS treats the data as though they are from different groups of participants and therefore the unadjusted error bars do not reflect the true error around the means for repeated measures design (Field, 2009). The computation of the adjusted error bars is done in four steps in SPSS and these steps are, calculate the mean for each participant; calculate the grand mean (the mean of all scores); calculate the adjustment factor (difference between the grand mean and the mean for each participant) and finally create adjusted values for each variable (sum of each participants score and the adjustment factor) (Field, 2009). The resulting adjusted error bar graph is shown in figure 4 below. The figure suggests that there is a significant difference between the score of the first test and the repeated test.
Proceedings: 9th Built Environment Conference
2-4 August 2015, Durban, South Africa
ISBN 978-0-620-67120-0
page 108
Figure 4 Average 2014 Test One and Test Two with Adjusted Error Bars
In order to establish whether the repeated test results are significantly better than the first test result, the paired samples t-test, which is a parametric test, was performed. Before this, the data were analysed to see if they meet the conditions for the parametric t-test. The conditions are that the sampling distribution of the difference between scores should have a normal distribution and the data must be measured at an interval scale or better (Field, 2009). The measurement scale of the data is a ratio scale and therefore the data meets the measurement condition. While the histogram of both the test one and repeated test results shown in figure 2 and figure 3 above and the Kolmogorov-Smirnov and Shapiro-Wilk tests of normality suggest that the sampling distribution of the data has a normal distribution (D (26) = 0.07, p > 0.05, and 2014 repeated test scores, D (26) = 0.10, p > 0.05), the paired t-test requires the sampling distribution of the difference between scores, and not necessarily the scores themselves to follow a normal distribution (Field, 2009). A new variable which is the difference between scores was therefore computed. A histogram of the difference between scores, shown in figure 5 below, suggests that the new variable follows a normal distribution. The Kolmogorov-Smirnov and Shapiro-Wilk tests in table 2 below also suggest that the difference between scores, with results D (26) = 0.15, p > 0.05, follows a normal distribution. Table 1 Kolmogrov-Smirnov and Shapiro-Wilk Tests of Normality for 2014 Test One and Test Two
Proceedings: 9th Built Environment Conference
2-4 August 2015, Durban, South Africa
ISBN 978-0-620-67120-0
page 109
Kolmogorov-Smirnova Statistic df Test2014One Test2014Two
.066 26 .102 26
Sig.
Shapiro-Wilk Statistic df
*
.200 .200*
Sig.
.983 26 .960 26
.930 .400
a. Lilliefors Significance Correction *. This is a lower bound of the true significance.
Figure 5 Histogram of the Differences Between 2014 Test One and Test Two Scores Table 2 Kolmogrov-Smirnov and Shapiro-Wilk Tests of Normality for the Differences Between 2014 Test One and Test Two Score
Kolmogorov-Smirnova Statistic df ScoreDifferences
.149 26
Sig. .142
Shapiro-Wilk Statistic
df
Sig.
.947 26 .193
a. Lilliefors Significance Correction
The summary statistics of the data are reported in table 3 below which show that the repeated test has a much higher mean with a slightly lower standard deviation than the first test. Table 4 below shows that the 2014 test one and the repeated test are fairly strongly and significantly correlated, r = 0.45, p (two-tailed) < 0.05.
Proceedings: 9th Built Environment Conference
2-4 August 2015, Durban, South Africa
ISBN 978-0-620-67120-0
page 110
Table 3 Paired Samples Summary Statistics
Mean Pair 1
N
Std. Deviation
Std. Error Mean
Test2014One
.3808 26
.17602
.03452
Test2014Two
.5231 26
.16112
.03160
Table 4 Paired Samples Correlations
N Correlation Pair 1
Test2014One & Test2014Two
26
Sig.
.452
.020
The t statistic of -4.102, reported in table 5 below shows that on average, students performed significantly better in the repeated test (M = 52.31, SE = 3.16) than in the first test (M = 38.08, SE = 3.452), t (25) = -4.102, p < 0.05, with a very large effect size, r = 0.63. The mean of the paired samples shown in table 5 below (which is the difference between the individual means of the two statistics) is negative indicating that the mean score in the second test was higher than in the first test consistent with the summary statistics in table 3 above. Table 5 Paired Samples Tests
Paired Differences 95% Confidence Interval of the Difference
Std. Std. Deviatio Error Mean n Mean Lower Upper
t
Sig. (2df tailed)
Pair Test2014 1 One -.14231 .17691 .03470 .2137 -4.102 25 Test2014 .07085 6 Two
.000
While students clearly performed significantly better in the repeated test than the first test, it remains to be established whether this is true across all quartiles of scores. Therefore, in order to ascertain whether the improved performance is significant across all quartiles, the scores were divided into three quartiles to represent average performance scores (Mid; 8 scores), below average performance scores (Low; 9 scores) and above average performance scores (Upper; 9 scores). The parametric t-test was used for the analysis since all data are drawn from the scores that meet all requirements for the parametric test.
Proceedings: 9th Built Environment Conference
2-4 August 2015, Durban, South Africa
ISBN 978-0-620-67120-0
page 111
Table 6 Paired Samples Statistics of Lower Quartile
Mean N Std. Deviation Std. Error Mean Pair 1
Low1
.2000 9
.08832
.02944
Low2
.4811 9
.14903
.04968
The lower quartile scored below average on both the first and the repeated test as shown in table 6 above but showed a remarkable improvement of 28.11% in the repeated test over the first test with a strong and significant correlation between the two tests, r = 0.74, p (two-tailed) < 0.05 as shown in table 7 below. Table 7 Paired Samples Correlation of Lower Quartile
N Correlation Sig. Pair 1
Low1 & Low2
9
.743 .022
On average, students in the lower quartile performed significantly better in the repeated test (M = 48.11, SE = 4.97) than in the first test (M = 20.00, SE = 2.944), t (8) = -8.245, p < 0.05, with a very large effect size, r = 0.946 as shown in table 8 below. Table 8 Paired Samples Test of Lower Quartile
Paired Differences
Mean
95% Confidence Interval of the Std. Std. Difference Deviati Error on Mean Lower Upper
t
Sig. (2df tailed)
Pair Low1 -.28111 .10228 .03409 -.35973 -.20249 -8.245 8 1 Low2
.000
The middle quartile also improved on its score as shown in table 9 below by 14.50%. However, the improvement in scores is not significantly correlated in the two tests, r =0.39, p (two-tailed) > 0.05 as shown in table 10 below.
Proceedings: 9th Built Environment Conference
2-4 August 2015, Durban, South Africa
ISBN 978-0-620-67120-0
page 112
Table 9 Paired Samples Statistics of Middle Quartile
Mean Pair 1
N Std. Deviation Std. Error Mean
Mid1
.3712 8
.03796
.01342
Mid2
.5162 8
.17582
.06216
Table 10 Paired Samples Correlation of Middle Quartile
N Pair 1
Mid1 & Mid2
Correlation
8
.388
Sig. .342
On average, students in the middle quartile performed significantly better in the repeated test (M = 51.62, SE = 6.216) than in the first test (M = 37.12, SE = 1.342), t(8) = -2.488, p < 0.05, as shown in table 11 below, with a very large effect size, r = 0.685. Table 11 Paired Samples Test of Middle Quartile
Paired Differences
Mean
Std. Std. Deviati Error on Mean
95% Confidence Interval of the Difference Lower
Upper
t
Sig. (2df tailed)
Pair Mid1 -.14500 .16484 .05828 -.28281 -.00719 -2.488 7 1 Mid2
.042
The upper quartile only improved on its scores by 0.11% as shown in table 12 below but with no significant relationship between the two scores, r = 0.54, p (two-tailed) > 0.05 as shown in table 13 below. Table 12 Paired Samples Statistics of Upper Quartile
Mean Pair 1
Std. N Deviation Std. Error Mean
Upper1
.5700
9
.10308
.03436
Upper2
.5711
9
.16503
.05501
Proceedings: 9th Built Environment Conference
2-4 August 2015, Durban, South Africa
ISBN 978-0-620-67120-0
page 113
Table 13 Paired Samples Correlation of Upper Quartile
Correl ation
N Pair 1
Upper1 & Upper2
9
Sig.
.541
.133
On average, students in the upper quartile did not perform significantly better in a repeated test (M = 57.11, SE = 5.501) than in the first test (M = 57.00, SE = 3.436), t (8) = -0.024, p > 0.05, with a very small effect size, r = 0.008 as shown in table 14 below. Table 14 Paired Samples Test of Upper Quartile
Paired Differences
Std. Std. Deviati Error Mean on Mean
95% Confidence Interval of the Difference Lower Upper
t
Sig. (2taile df d)
Pair 1 Upper1 -.00111 .13950 .04650 -.10834 .10612 -.024 8 .982 Upper2
4.
DISCUSSION OF FINDINGS
Test one results show that students are struggling with the measurements course. The poor results of a course which relies on a good and detailed understanding of building construction technology and the application of basic numerate skills suggests that students are not adequately equipped in building construction technology and that while they poses the relevant basic numerate skills, they fail to apply these in a non-mathematical setup. On average, repeating tests after a poor performance by students leads to significantly improved test scores as suggested by the results of the dependant t-test and correlation coefficient above with the repetition creating a large effect size. This can be attributed to students taking their studies more seriously after an initial poor performance. It can also be attributed to a better understanding by the students after realising areas in which they are not performing well and taking the opportunity to approve upon them. When the data are divided into three quartiles and each quartile analysed separately, all statistics (correlations, percentage increase and effect size) are very large and significant for the lower quartile suggesting that poor performing students improved the most in the repeated test. Poor performing students, after realising that they are failing the course are
Proceedings: 9th Built Environment Conference
2-4 August 2015, Durban, South Africa
ISBN 978-0-620-67120-0
page 114
prompted to work harder in the repeated test. Average performing student in the middle quartile also improved but by much lower margins than poorer performing students. Perhaps a certain amount of contentment with average marks in a course which is perceived to be difficult leads to complacency in the repeated test. Above average students in the upper quartile showed no improvement at all suggesting that no further effort was put into preparing for the repeated test because they were content with being above average.
5.
CONCLUSION
While students perceive measurements to be difficult, their poor performance can mainly be attributed to a lack of detailed understanding of building construction technology and the inability to apply basic numerate skills in a building construction setup. Repeating tests leads to significantly improved test results especially for poorly perfuming students. Repeating tests on a specific topic or groups of topics is therefore a good way of getting students to improve on their test results and also improve on their understanding of the subject matter. This system is particularly effective for poor performing students. It can also be effectively used for a class which is poorly performing or has performed badly in a particular assessment.
6.
REFERENCES
Boily E., Ouellet C., Turcotte C., 2015, Effects of an Assisted Repeated Reading Program on Student Fluency in a Large Class in Burkina Faso, Procedia - Social and Behavioural Sciences, Volume 174, Pages 244250, ISSN 1877-0428, rd Field A., 2009, Discovering Statistics using SPSS, 3 Edition, Sage Publications, 55 City Road, London Hdaib M.T., Al-momany S.M., Najjar Y.W., 2015, Knowledge level assessment and change among nursing students regarding administering intra-muscular injection at Al-Balqa'a Applied University: An interventional study, Nurse Education Today, Available online, ISSN 0260-6917, Kinder D.H., Knecht K.T., 2011, Impact of non-passing grades and academic retention on subsequent academic performance in a cohort of pharmacy students, Currents in Pharmacy Teaching and Learning, Volume 3, Issue 2, Pages 92-100, ISSN 1877-1297,
Proceedings: 9th Built Environment Conference
2-4 August 2015, Durban, South Africa
ISBN 978-0-620-67120-0
page 115
ASOCSA2015-59
Determinants predicting mathematics success for Civil and Built Environment students at a Comprehensive University Justus N. Agumba¹; Theo Haupt² ¹Department of Construction Management and Quantity Surveying, University of Johannesburg corner Siemert and Beit Streets, Doornfontein, 2028, Johannesburg, South Africa,
[email protected], Tel No. +27 11 559 6488 ²Department of Construction Management and Quantity Surveying, University of KwaZulu-Natal, Durban, South Africa
[email protected] ABSTRACT Purpose of this paper This paper focuses on determining the socio-economic and demographic factors that predict mathematics success for civil and built environment students at a comprehensive university in South Africa. Methodology Data was obtained through, questionnaire survey from 197 students purposively sampled. The questionnaire was developed from literature review. The socio-economic and demographic determinants predicting mathematics success were identified. The data was analysed using statistical package for the social sciences (SPSS) version 22. Binary logistic regression analysis was used to analyze the mathematics success predictors. Findings The study found that when mathematics outcome (failed/passed) for students was modelled with gender, students accommodation, education sponsor, entry to the university, final high school maths result, citizenship and weekly allowance, only gender predicted mathematics outcome (pass/fail). However, when gender, citizenship and final high school maths were modelled to predict mathematics outcome all the independent
Proceedings: 9th Built Environment Conference
2-4 August 2015, Durban, South Africa
ISBN 978-0-620-67120-0
page 116
variables were insignificant. Furthermore, it is also interesting to note that when high school math result was modelled with tertiary mathematics outcome the prediction was insignificant. Value This study informs the university management to render support on female students pursing mathematics subject in any engineering discipline, in order for them to succeed at their first major evaluation at the end of the first semester. Keywords: Determinants, Built Environment, Engineering, University. 1.
INTRODUCTION
Education success is typically measured by higher achievement in examinations. It can further be indicated that, the quality of education improves the quality of human resources and is directly related to increased individual earnings and productivity, and economic growth. However, the benefits of education in the engineering and built environment courses might not be fully realized by students as they perform poorly in mathematics which is a subject taught in most of these courses. Furthermore, several media reports i.e. in newspapers; television and radio have indicated that South Africa has the worst mathematics and science education in the world. According to the World Forum Economic report (2015), it indicated that South Africa was ranked last of the 143 countries surveyed on the quality of mathematics and science education. The mean value was 1.9 in a 7 point Likert scale. This value is an indicator that the quality of mathematics and science education was somewhat extremely poor. On the quality of its education system South Africa was ranked 139 out of 143 countries surveyed. The mean value was 2.2 in a 7 point Likert scale. The mean value indicated that the quality of education system was tilting towards not well. This current report supports MacGregor (2009) news article, which indicated that vice-chancellors warned the South African government to expect more student drop out, following shocking results of pilot national benchmarking tests (NBT). They further indicated that higher education institutions face greater challenges in relation to mathematics. The NBT revealed that only 7% of students were found to be proficient, therefore ready to study first year mathematics. Furthermore, the Alternative Admissions Research Project (2009) found that majority of students would find it difficult to pass mathematics at university level without additional support (Dennis and Murray, 2012). In relation to the aforementioned, student academic performance have attracted the attention of academic researchers from different fields. They have tried to determine which variables impact student performance in positive and negative direction. Determining the factors that affect the
Proceedings: 9th Built Environment Conference
2-4 August 2015, Durban, South Africa
ISBN 978-0-620-67120-0
page 117
student academic performance is important, because, primarily institutions and lecturers have to find ways to increase student mathematics achievement. In order to achieve this in mathematics at the university, it is imperative to determine which socio-economic and demographic factors play a significant role in student mathematics performance. This study purports that socio-economic and demographic factors are predictors of mathematics success for civil engineering and built environment students. This study contributes towards unraveling those significant socio-economic and demographic determinants of students’ performance in mathematics that need to be addressed. The findings of this study may also be applicable to related courses (those that require the application of Mathematics knowledge) especially with high failure rates. 2.
LITERATURE REVIEW
According to Spaho and Godolja (2014) lecture attendance of more than ten hours predicted success in general mathematics academic performance for economics students. Furthermore, in their second model they found that attending lectures more than ten hours predicted mathematics success. Students with an average grade of eight (8) and above in mathematics in high school are likely to pass mathematics at the university. Study hours were a predictor of passing mathematics at 10% confidence level. Among the factors predicting students’ mathematics achievement according to Murray (2013) were prior academic achievement, learning styles and academic resources. In a generic study of students’ performance achievement, Aromolran et al., (2013) found that, student class/year of study and education level of the mother had significant effect on the overall student academic performance. Rajandran et al., (2015) conducted a study in Malaysia on student academic performance. They revealed that gender and place of origin as insignificant determinants, the entry qualification as a weak factor, and the student’s Cumulative Grade Point Average (CGPA) of entry qualification as the strongest variable that determines the Cumulative Grade Point Average (CGPA) of first year students. In a study by Uyar and Güngörmüş (2011), grade point average, high school type, age of the student and attendance were significant variables which influence student performance. Grade point average, high school type, attendance had positive influence on student performance, whereas age of the student had negative influence. According to Mlambo (2011), gender, age, learning preferences, and entry qualifications did not cause any significant variation in the academic performance of students. The researcher suggested further research on other factors that are known to influence academic performance (such as student motivation, socioeconomic status, and attendance). Kara et al., (2009) found that seven determinants were significant viz; gender, course (micro vs macro), the number of hours worked, instructor
Proceedings: 9th Built Environment Conference
2-4 August 2015, Durban, South Africa
ISBN 978-0-620-67120-0
page 118
six, whether or not to recommend the course, the number of missed classes, and SAT scores, while the number of hours per week spent on studying for the class, textbook rating were not significant. Moreover, gender, university housing and SAT score had positive effect on students’ grades, while the effect of number of missed classes, expected grade at the beginning of the semester and number of hours per week worked at a job was negative. According to Malik and Basu (2009) they found that unit 2 mathematics; mathematics extension 1 and extension 2 are important determinants of students’ success in the first year level economics subjects at the university. On the other hand, general mathematics had negative impact on economics subject grades. Ushie, et al., (2012) suggested that family structure does not determine students’ academic performance, but rather parental socio-economic background. Adejumo and Adetunji (2013) conducted a study using Ordinal Logistic Regression (Proportional Odds Model). The results reveal that only sex of students is not a determinant factor of final grade that students may attain at graduation. This research also suggested that there is equal chance for both male and female students to graduate from a university with First Class. The study further established that younger students perform better than the older ones. The researchers also established that the odds of graduating with First Class are obtained by students who were admitted through Direct Entry (DE). These are students who are academically mature as they have spent at least two academic sessions in their previous college mostly Polytechnics. The findings of Whannell (2013) indicated that, the background information (gender, age, ethnicity, disability, secondary school, work status, and early enrolment) gathered during the enrolment process, does not contain sufficient information for an accurately separation of successful and unsuccessful students. However, Hijazi and Naqvi (2006) found that class attendance; mother education and study hours had significant impact on student performance. Class attendance and mother education had positive impact on student performance, while study hours had negative impact. According to Tewari (2014) their findings indicated that matric math score is a better predictor of academic performance of the first year courses at the Faculty of Management, University of KwaZulu-Natal. In a study by Vanthournout et al., (2012) they found that academic success is predicted by relating and structuring, lack of regulation, and lack of motivation on students at the end of the year. As indicated in the aforementioned discussion. Many studies have been carried out to identify and analyze the numerous factors that affect academic performance in various centers of learning. However, few studies have focused on separate disciplines of studies. In light of the aforementioned discussion on socio-economic, demographic and motivational factors as predicators of academic achievement, this current
Proceedings: 9th Built Environment Conference
2-4 August 2015, Durban, South Africa
ISBN 978-0-620-67120-0
page 119
study will attempt to fill this gap in South Africa context in mathematics success for engineering and built environment students at a selected university. 3.
PROBLEM STATEMENT
Mathematics is viewed as important subject for students pursuing engineering courses. However, despite its importance students at high school have not been performing well according to the Department of Higher Education in South Africa. This same trend has been evident at tertiary institutions where mathematics is taught to engineering and built environment students. Based on this sentiment, researchers have conducted studies to determine the factors predicting academic achievement and some extend mathematics outcome i.e. pass/fail. However, these studies have established different determinants as predictors of passing/failure of mathematics in tertiary institutions. Hence, no consensus has been reached on the socio-economic and demographic determinants that policy maker in universities can use to identify students at risk in mathematics. This is a major gap in the current study. In relation to this gap, this study delved on the following specific research questions i.e. What are the socio-economic and demographic predicators of mathematics success at university for engineering and built environment students? Does matric result predict success in mathematics for engineering and built environment students? Specific research objectives are: To determine the socio-economic and demographic predicators of mathematics success for engineering and built environment students at the university; and To determine if matric or high school mathematics result predicts university mathematics success for engineering and built environment students. 4.
RESEARCH METHOD
The study population consisted of students from the department of civil engineering technology third years and construction management and quantity surveying third and second years. These were students attending the 2015 academic year in the Faculty of Engineering and Built Environment (the university name is withheld for confidential purposes). Using purposive sample, 199 students completed a questionnaire survey in the middle of the first semester of 2015. Two of questionnaires were not suitable for analysis. The questionnaire included personal questions about age, gender, students’ accommodation, education sponsor, entry to the university, final high school maths result, citizenship and weekly allowance.
Proceedings: 9th Built Environment Conference
2-4 August 2015, Durban, South Africa
ISBN 978-0-620-67120-0
page 120
Other sections included extra-curricular activities in the university and study skills which are not discussed in this paper. The outcome variable was the students were to indicate whether they passed mathematics at first attempt in the first major assessment at the end of the first semester. The response was either Yes or No. Statistical Package for Social Sciences (SPSS) version 22 was used to perform binary logistic regression analysis on this dichotomous outcome. A binary logistic regression model with a dichotomous response of Yes or No was modeled. Yes response was defined as having passed mathematics at first attempt at the university. Students who did not pass at first attempt were considered to have failed hence responded as No. For the outcome analysis, the responses were coded as 1 and 0, respectively. The independent variables of the logistic regression model were dummy variables that indicated the socio-economic and demographic characteristics of the students: gender if male 1 and female 2; students accommodation, on campus 1, off campus 2 and home 3; education sponsor, myself 1, parents/guardian 2, government 3; entry to the university, high school 1 and college 2; final high school maths result, less than 50, 1 and 50 and above 2; citizenship, South African citizen 1, permanent resident 2 and international student 3; and weekly allowance, less than R200, 1, R200-R399, 2; R400-R599, 3 and R600 and above, 4. Logistic regression is recommended over linear regression when modeling dichotomous responses and allows the researcher to estimate probabilities of the response occurring (Hosmer and Lemeshow, 2004). The logistic regression equation takes the following form ln (p/1-p) = β + β x + β x +… + β x 0
1 1
2 2
k k
Where p is the estimated probability of passing, and x
(1.1) 1,
x
2, …,
x
k
are
independent variables. The estimated probability of the response occurring or passing (p) divided by the probability of it not occurring or not passing (1-p) is called the odds ratio. Maximum likelihood method is used to estimate the odds ratios of the model. Values of odds ratios higher than 1 indicate positive association between the variables, odds ratios equal to 1 indicate no association, while odds ratios lower than 1 indicate negative association between each independent variable and the dependent variable of the model. Furthermore, in order for an independent variable to be a predicator of the dependent variable the p-value should be less than 0.05 at 95% confidence, which connotes its significance in the model. 5.
RESULTS AND DISCUSSIONS
Table 5.1 indicates that male students are majority i.e. 60.4% pursuing civil engineering and built environment courses at this comprehensive university. Furthermore, 92.30% of the students are under the age of 25 years. It is interesting to note that of the 197 respondents only 155 students
Proceedings: 9th Built Environment Conference
2-4 August 2015, Durban, South Africa
ISBN 978-0-620-67120-0
page 121
revealed their age. 55.30% of the parents had tertiary qualification of this percentage 32.50% had a university qualification. 48.70% of parents/guardians are responsible for their children university tuition fee. A meager 9.60% of students are self-sponsored. 52.80% of the respondents have a weekly allowance of less than R200.00 as compared 9.8% of students with an allowance more than R600.00. It is important to note that only 26.90% of students are accommodated on campus. Table 5.1 Profile of respondents Gender Male Female Race Asian/Indian African/Black Coloured White Age groups 18-21 years 22-25 years Over 26 years Parents highest education qualification No schooling Elementary school Secondary/high school College University Do not know Education sponsor Myself Parent/guardian Government/bursary Weekly income/allowance Less than R200 Between R200 - R399 Between R400 – R599 Above R600 Accommodation Home On campus Off campus
Frequency 119 78 Frequency 3 188 3 3 Frequency 73 70 12 Frequency
Percentage 60.4% 39.6% Percentage 1.50% 95.40% 1.50% 1.50% Percentage 47.10% 45.20% 7.70% Percentage
14 5 59 45 64 8 Frequency 19 96 82 Frequency 104 45 24 18 Frequency 44 53 98
7.10% 2.50% 29.90% 22.80% 32.50% 4.10% Percentage 9.60% 48.70% 41.60% Percentage 52.80% 22.80% 12.20% 9.10% Percentage 22.30% 26.90% 49.70%
The result in Table 5.2 indicates that gender predicted the mathematics outcome i.e. passing/failure among the civil and built environment students at this comprehensive university. Hence, gender was a significant predictor. However, the citizenship of students i.e. being South African citizen, permanent resident and non-South African were not significant. Hence, it was a poor predicator of mathematics success. Furthermore, students’ accommodation i.e. housed in campus, off campus or living at home were not predicators of mathematics outcome (pass/failure) as the significance
Proceedings: 9th Built Environment Conference
2-4 August 2015, Durban, South Africa
ISBN 978-0-620-67120-0
page 122
was greater than 0.05. The other factors that were analyzed i.e. entry to university from high school or college, the education sponsor, weekly allowance and final matric marks were not good predictors of mathematics outcome at this comprehensive university among civil and built environment students. This result was in contrast to the finding of Tewari, (2014) who suggested that matric result is a predictor to mathematics success at the university. The results further indicated that male students are less likely to fail mathematics at their first attempt at this university than female students. The odds of female students failing is at 0.395 times than male students as the odds ratio is less than 1 and the coefficient (B) is negative i.e. -0.93. However, prior to testing this model, the goodness of fit of the model was tested which indicated a good fit. This result was justified by the Hosmer and Lemeshow test. The significance of the model was greater than 0.05 at 0.822. The result suggests that the independent variables were fitting in the proposed theoretical model. Table 5.2 Binary logit on determinants of passing mathematics (model 1) Variables
B
S.E.
Wald
Df
Sig.
Exp. (B) Odd ratio
Lower 95% C.I. for EXP(B)
Upper 95% C.I. for EXP(B)
Gender female (1) Citizenship Permanent resident (1) Non South Africa (2) Accommodation On campus (1) Off campus (2) Entry to university college (1) Education sponsor Parent/guardian (1) Government (2) Weekly allowance R200-R399 (1) R400-R599 (2) Over R600 (3)
-0.93
0.43
4.58
1
0.03
0.395
0.17
0.93
0.39
1.23
0.58 0.10
2 1
0.75 0.75
1.471
0.13
16.29
0.69
0.97
0.51
1
0.48
1.992
0.30
13.27
0.56 0.28 -1.07
0.62 0.53 0.59
0.83 0.82 0.27 3.27
2 1 1 1
0.66 0.36 0.60 0.07
1.750 1.322 0.342
0.52 0.47 0.11
5.86 3.76 1.09
3.30
2
0.19
Final high school mark 50 and above (1) Constant
-1.91
1.14
2.80
1
0.09
0.148
0.02
1.39
-1.51
1.17
1.66 0.66
1 3
0.20 0.88
0.222
0.02
2.20
0.03 -0.44 19.37
0.00 0.60 0.00
1 1 1
0.95 0.44 1.00
2.70 1.96
0.89
1
0.34
1.031 0.643 2588207 23.4 1.646
0.39 0.21 0.00
0.50
0.49 0.57 923 6.41 0.53
0.59
4.62
2.91
1.29
5.09
1
0.02
18.311
Dependent variable: Passing mathematics at University (0=No; 1=Yes) sig. at 5%
Proceedings: 9th Built Environment Conference
2-4 August 2015, Durban, South Africa
ISBN 978-0-620-67120-0
page 123
A further binary logistic regression analysis was undertaken to establish if gender, citizenship and final high school mathematics result could predict the success of mathematics of these students at university level. The result in Table 5.3 indicates that gender was not significant in predicting the passing/failure of mathematics among the civil and built environment students at this comprehensive university. Furthermore, the citizenship of students i.e. being South African citizens, permanent residents of South Africa and non-South Africa students and the final matric result in mathematics were not significant, hence not good predicators of mathematics success/failure at this comprehensive university. This result suggests that the fewer the independent variables in the model the lesser the significance of predicting mathematics outcome. However, prior to testing this model, the goodness of fit of the model was tested which indicated a good fit. This result was justified by the Hosmer and Lemeshow test. The significance of the model was greater than 0.05 at 0.892. Hence, indicating that the independent variables were fitting in the proposed theoretical model. Table 5.3 Binary logit on determinants of passing mathematics (model 2)
0.55
Lower 95% C.I. for EXP(B) 0.26
Upper 95% C.I. for EXP(B) 1.41
0.93 0.74
1.45
0.16
12.78
1
0.84
1.17
0.24
5.66
0.93
1
0.34
1.61
0.61
4.27
7.02
1
0.01
3.78
Variables
B
S.E.
Wald
Df
Sig.
Exp. (B) Odd ratio
Gender female (1) Citizenship Permanent resident (1) Non South African (2) Final high school mark 50 and above (1) Constant
-0.60
0.38
2.59
1
0.11
0.37
1.11
0.15 0.11
2 1
0.16
0.80
0.04
0.48
0.50
1.33
0.50
Dependent variable: Passing mathematics at University (0=No; 1=Yes) sig. at 5%
The result in Table 5.4 indicates that final result of mathematics in high school was not significant. This implies that high school mathematics result is not a strong predicator of succeeding in mathematics among the civil and built environment students at this comprehensive university. This finding is justified from the previous models tested in this current study where it was insignificant. This finding is in contrast to the finding of Mallik and Basu (2009). They found that, the level of and performance in secondary school mathematics has strong predictive power on students' performance at university level economics. This conflicting finding might have been as a result of the goodness of fit of the theoretical model being poor as tested using Hosmer and Lemeshow test. The significance output of the model
Proceedings: 9th Built Environment Conference
2-4 August 2015, Durban, South Africa
ISBN 978-0-620-67120-0
page 124
was not obtained. Hence, an indication the independent variable is not a good fit of the proposed theoretical model. Table 5.4 Binary logit on high school math result on passing mathematics (model 3) Variables
B
S.E.
Wald
Df
Sig.
Exp. (B) Odd ratio
Final high school mark 50 and above (1) Constant
0.58
0.49
1.40
1
0.24
1.78
0.999
0.44
5.10
1
0.02
2.71
Lower 95% C.I. for EXP(B) 0.69
Upper 95% C.I. for EXP(B) 4.62
Dependent variable: Success in mathematics at University (0=No; 1=Yes) sig. at 5%
6.
CONCLUSIONS AND RECOMMENDATIONS
The study found that gender is a strong predictor of mathematics success for students in the civil and built environment school. Furthermore, the findings suggest that female students were less likely to pass mathematics at their first attempt in the university compared to male students. However, in a related model, when some of the proposed determinants were removed from the model, gender did not predict success of mathematics at the university. This is an indication that other determinants influence gender indirectly as a predictor to mathematics success. High school results did not predict mathematics success at this university. This finding is contradictory to the previous findings which predicted that passing mathematics in high school will predict passing it at the university. Based on these findings, the researchers recommend that: The university should inform the female students to be studious in the quest to pass mathematics at their first attempt in their course. More assistance will be required for female students in order to succeed in mathematics. The researchers also propose the need to use other determinants in relation to the socio-economic and demographic factors as these factors are not exhaustive in relation to the full characteristic of a student. The other factors recommended for testing are extra-curricular activities the student is involved in at the university and their study skills. A further study is also recommended for all Engineering and Built Environment courses at the University of Johannesburg. 7.
REFERENCES
Adejumo, A. O., and Adetunji, A. A., 2013, Application of ordinal logistic regression in the study of students’ performance. Mathematical Theory and Modelling, 3, 11, 10-19. Aromolaran, A.D., Oyeyinka, I.K., Olukotun, O., Okon, B.E., 2013, Binary logistic regression of students’ academic performance in tertiary
Proceedings: 9th Built Environment Conference
2-4 August 2015, Durban, South Africa
ISBN 978-0-620-67120-0
page 125
institution in Nigeria by socio-demographic and economic factors. International Journal of Engineering Science and Innovative Technology, 2, 4, 590-596. Dennis, C.R., and Murray, D.M., 2012, Success in first-year mathematics: school-leaving examinations and first-year performance. South Africa Journal of Science; 108(7/8), Article #1325, 3 pages, http:// dx.doi.org/10.4102/sajs.v108i7/8.1325 Hijazi S.T. and Naqvi, R.S.M.M., 2006, Factors affecting students’ performance: A case of private colleges. Bangladesh E-Journal of Sociology. 3, 1, 90-100. Hosmer, D.W. and Lemeshow, S., 2004, Applied Logistic Regression, 2nd Edition. Kara, O., and Chiu, I-M., 2009, The effect of gender on learning and success in economics classes. In the Proceedings of the Annual Conference of Pennsylvania Economic Association, June 4th–6th, West Chester University of Pennsylvania West Chester, PA, USA, (Edited by Jozefowicz, J.J) 63-70. MacGregor, K., 2009, South Africa: Shocking results from the University tests http://www.universityworldnews.com/article.php?story=2009081608204 7397 last accessed on the 20/05/2015 Mallik, G., and Basu, K.P., 2009, Does high school mathematics improve student learning in economics in the university? The International Journal of Learning, 16, 4, 517-520. Mlambo, V., 2011, An analysis of some factors affecting student academic performance in an introductory biochemistry course at the University of the West Indies. Caribbean Teaching Scholar, 1, 2, 79-92. Murray, J., 2013, The factors that influence mathematics achievement at the Berbice campus, International Journal of Business and Social Science, 4, 10, 150-164. Rajandran, K., Hee, C.T., Kanawarthy, S., Soon, K.L., Kamaludin, H., and Khezrimotlagh, D., 2015, Factors affecting first-year undergraduate students academic performance. Scholars Journal of Economics, Business and Management, 2, 1A, 54-60. Spaho, A., and Godolja, M., 2014, Lecture attendance and success on general mathematics: Case study of first year business students, university of Tirana, Albania. International Journal of Research in Business Management, 2, 5, 72-78. Tewari, D.D., 2014, Is matric math a good predictor of student’s performance in the first year of university degree? A case study of faculty of management studies, university of KwaZulu-Natal, South Africa. International Journal Education Science, 8, 1, 233-237. Ushie, M.A., Emeka, J.O., Ononga, G.I., and Owolabi, E.O., 2012, Influence of family structure on students’ academic performance in Agege Local Government Area, Lagos State, Nigeria. European Journal of Educational Studies, 4, 2, 177-187.
Proceedings: 9th Built Environment Conference
2-4 August 2015, Durban, South Africa
ISBN 978-0-620-67120-0
page 126
Uyar, A., and Güngörmüş, A.H., 2011, Factors associated with student performance in financial accounting course. European Journal of Economic and Political Studies, 4, 2, 139-154. Vanthournout, G., Gijbels, D., Coertjens, L., Donche, V., and Van Petegem, P., 2012, Students' persistence and academic success in a first-year professional bachelor program: The influence of students' learning strategies and academic motivation. Educational Research International, Volume 2012, Article ID 152747, 10 pages doi:10.1155/2012/152747. Whannell, R., 2013, Predictors of attrition and achievement in a tertiary bridging program. Australian Journal of Adult Learning, 53, 2, 280-301. World Economic Forum, 2015, The global information technology report 2015, ICTs for inclusive growth. Edited Dutta, S., Geiger, T., & Lanvin, B http://www3.weforum.org/docs/WEF_Global_IT_Report_2015.pdf last accessed on the 20/05/2015.
Proceedings: 9th Built Environment Conference
2-4 August 2015, Durban, South Africa
ISBN 978-0-620-67120-0
page 127
ASOCSA2015- 010
Stakeholder Conceptualizations of Sustainable Design and Construction in Tanzania Victoria Marwa Heilman
[email protected] Institute for Design and Construction (IEK), Faculty of Architecture and Planning, University of Stuttgart, Keplerstr 11, 70174, Stuttgart, Germany, +49 1577 595 8801
ABSTRACT Purpose of this paper This paper focuses on the understandings of sustainable design and construction among key stakeholders in the construction industry in Tanzania. This paper offers empirical evidence regarding different conceptualizations of sustainable design and construction among policy, managerial and operational stakeholders in Tanzania and possible explanations for their understandings. Methodology Data was obtained through in-depth interviews, a questionnaire survey, and literature review of previous studies on the understandings of sustainable design and construction in developing countries. Data was analysed using SPSS Statistics 20, Stata SE 12 and a qualitative content analysis. Findings Important differences exist in the conceptualization of sustainable design and construction among key actors in the construction industry and there is a lack of practical knowledge, which hinders sustainable design practices. The paper concludes by suggesting that the Government, academic institutions and professional associations must make a greater effort to establish a clear meaning and create more awareness for sustainable design and construction to be mainstreamed in the construction industry in Tanzania. Originality/value The paper as part of the ongoing doctorate research contributes to the mainstream of sustainable design and construction practices in developing
Proceedings: 9th Built Environment Conference
2-4 August 2015, Durban, South Africa
ISBN 978-0-620-67120-0
page 128
countries. It is a step in engaging major stakeholders in the building construction industry in debates about the meaning of sustainable design and construction and what can be done to achieve a sustainable built environment in developing countries. Keywords: Construction, stakeholders, sustainable design, Tanzania. 1. INTRODUCTION The United Nations Environmental Programme, Sustainable Building and Construction Initiatives (UNEP - SBCI, 2009) has identified the construction industry as having a big potential for reducing environmental problems. It is estimated that buildings and their associated functions are responsible for 40% of the world energy consumption (USGBC, 2009), 30% of the CO2 emissions and generate approximately 40% of all manmade waste (Sjostrom & Bakens, 1999). Thus, if properly designed and constructed, their share of these environmental problems could be significantly reduced. However, the construction industry in developing countries shows little environmental concern (Ofori, 1998). Due to a rising understanding from scientific research of the impact of the construction industry on the environment worldwide, sustainable design and construction has received considerable attention in developed countries’ design and construction practices. In contrast, for developing countries, as pointed out by Du Plessis (2001), in the International Council for research and innovation in building and construction, (CIB) “Agenda 21 for Sustainable Construction”, the construction industry has neglected sustainable construction. The lack of information and research on sustainable construction solutions is a major obstacle that needs to be overcome. In Tanzania the study of sustainability in the construction industry has not been given enough attention by researchers, especially on understanding how stakeholders conceptualize sustainable design and construction and how this is reflected in the built environment. This paper examines how key stakeholders understand sustainability in the construction industry. The major contribution of this study is to provide an in-depth holistic understanding of the design and construction experience of architects, planners, engineers, building contractors, real estate developers, building owners, building users, academicians, researchers and municipal and central government policy makers. This will lay a needed foundation from which stakeholders in the construction industry can promote sustainable development by fostering a wider awareness of its essence, hence creating an incentive for changes at the policy, managerial and operational level. As a first step, this paper focuses on describing and explaining how key stakeholders (policy, managerial and operational) of the construction industry in Tanzania conceptualize sustainable design and construction.
Proceedings: 9th Built Environment Conference
2-4 August 2015, Durban, South Africa
ISBN 978-0-620-67120-0
page 129
2. THEORETICAL FRAMEWORK This paper adopts and adds to McLennan’s idea of sustainable design as a “design philosophy and construction techniques that seeks to maximize the quality of the built environment while minimizing or eliminating the negative impacts to the natural environment” where environmental, social and economic aspects of the building are the key aspects for consideration (McLennan, 2004). The notion of sustainability became global after the 1987 Brundtland Report for the World Commission on Environment and Development (WCED) titled: Our Common Future. In this report sustainable development is defined as “the development that meets the needs of the present, without compromising the ability of the future generation to meet their own needs” (WCED, 1987). Although this definition does not necessarily focus on architecture and the built environment, it is nonetheless applicable as a base for understanding sustainability in architecture and many other professions. Sassi (2006) divided the principles of sustainable design and construction into two major groups. First, sustainable buildings should “metaphorically tread lightly on the earth by minimizing the environmental impact associated with their construction, their life in use, and at the end of their life, sustainable buildings should have small ecological footprints”. Second, “sustainable building should make a positive and appropriate contribution to the social-economic environment they inhabit, by addressing peoples’ practical needs while enhancing their surrounding environment and their psychological and physical wellbeing”. A number of studies focusing on the construction industry in developing countries (Ozolins, 2010; Sev, 2009; Hakmat and Nsairat, 2009; du Plessis, 2005, and 2007; Reffart, 2004; and Gibberd, 2003) have paved a way by showing different approaches as to how sustainability can be instilled in design and construction in Africa. However, developing the requirements for sustainable design and construction for developing countries and devising ways of integrating them in the design and construction stage will only be successful with the mainstreaming of sustainability among stakeholders. In terms of the understanding and awareness of sustainable design and construction among stakeholders, a study by Alsanad, Gate and Edwards (2011) revealed that in Kuwait, where the building industry is ranked second (after oil) as an investment priority, a majority of stakeholders have only a moderate level of knowledge and understanding of sustainable design and construction concepts and the level of implementation is very low. Abidin (2009) argues that Malaysian developers have between a low and moderate level of knowledge on sustainable design and construction concepts. Gibberd (2003) found that the understanding of the implications of sustainable development for
Proceedings: 9th Built Environment Conference
2-4 August 2015, Durban, South Africa
ISBN 978-0-620-67120-0
page 130
building and construction in developing countries is lacking. As such, developing an understanding of sustainable development and integrating it into mainstream practice in the construction industry will be increasingly important for sustainability to be achieved in Africa (Gibberd, 2003). Ozolins (2010) suggested that for sustainability to be achieved, research that contributes to an improved understanding of the key issues of sustainability related to a developing country’s context needs to be carried out. Similarly, Abidin (2009) suggested that progress towards understanding sustainability in developing countries mainly depends on improving awareness, knowledge, and understanding of the impact of people’s actions on the environment. Research in Tanzania on sustainability in the construction industry has largely been neglected, especially understanding how stakeholders perceive the concept of sustainable design and how these understandings are reflected in the built environment. This paper focuses on understanding the conceptualization of sustainability among stakeholders in the construction industry in Tanzania.
3. METHODOLOGY A case study using both qualitative and quantitative methods was carried out in Dar es Salaam. Heads of professional associations and academic departments of architecture, engineering and quantity surveying as well as director generals of private firms, presidents of the professional associations, registrars of the professional regulatory bodies, local government official and retired architects were purposefully selected for indepth interviews. A total of forty-two in depth interviews were conducted, representing 18 operational (architects, engineers, quantity surveyors and contractors), 15 policy (professionals associations, regulatory bodies, academic institutions, government officials), and 9 managerial stakeholders (urban planners, local government officials and building users). Qualitative content analysis using pattern coding was used to analyse qualitative data. A total of 415 questionnaires were distributed (230 to operational stakeholders, 100 to managerial stakeholders and 85 to policy stakeholders). Questionnaires were delivered in person or e-mailed to respondents using the available contact information. Filled and returned questionnaires were 262, including 181 from operational stakeholders, 45 from managerial stakeholders and 36 from policy stakeholders. The response rate represents 79% of the operational stakeholders, 45% for the managerial stakeholders and 42% of the policy stakeholders, with the overall response rate of 61% of all the stakeholders. Returned questionnaires were analysed using SPSS Statistics 20 and Stata SE 12. The table 1 provides a description of the 262 questionnaire survey respondents.
Proceedings: 9th Built Environment Conference
2-4 August 2015, Durban, South Africa
ISBN 978-0-620-67120-0
page 131
Table 1: Description of the Questionnaire Survey Respondents No
Background Information
1
Age 18 - 25 26 - 35 36 - 45 46 - 55 56 - 65 Gender Female Male Education Diploma Grad. Dip. Bachelor Master Doctorate Work experience 1 - 10 11 - 20 21 - 30 31 - 40 41 - 50
2
3
4
Operational Stakeholders
Policy Stakeholders
Managerial Stakeholders
All
Freq.
%
Freq.
%
Freq.
%
Freq.
3 51 48 31 13
2.05 34.93 32.88 21.23 8.90
3 2 16 8 2
9.68 6.45 51.61 25.81 6.45
10 15 9 4
26.32 39.47 23.68 10.53
6 63 79 48 19
30 147
16.95 83.05
14 22
38.89 61.11
4 45
8.89 91.11
48 214
4 17 78 70 11
2.22 9.44 43.33 38.89 6.11
5 17 14 -
13.89 47.22 38.89 -
2 1 13 22 7
4.44 2.22 28.89 48.89 15.56
6 23 108 106 18
92 40 31 7 1
53.80 23.39 18.13 4.09 0.58
15 10 8 1 -
44.12 29.41 23.53 2.94 -
13 18 2 6 -
33.33 46.15 5.13 15.38 -
120 68 41 14 1
4. RESULTS AND DISCUSSION 4.1
Familiarity with the concept of sustainable design and construction
Measuring awareness of the term sustainable design and construction is one step to understand how stakeholders conceptualize this key concept. In the questionnaire survey, familiarity was measured using a scale of 1-3 with 1 = not familiar, 2 = slightly familiar and 3 = very familiar. For this study, very familiar, means a stakeholder possesses knowledge on how to achieve a sustainable building. Slightly familiar means a stakeholder can define the term but lacks knowledge on how sustainable buildings can be achieved. Not familiar means they have never heard of the term sustainable design and construction. Analysis was done using the percentages of the responses recorded.
Proceedings: 9th Built Environment Conference
2-4 August 2015, Durban, South Africa
ISBN 978-0-620-67120-0
page 132
Figure 1: Familiarity with the term sustainable design and construction
The questionnaire survey findings revealed that most of the policy respondents (51%), managerial respondents (63%) and many operational stakeholders (47%) are slightly familiar with the term sustainable design and construction. Generally speaking while most stakeholders have an understanding of sustainable design and construction, many lack practical knowledge on how to achieve a sustainable building. As indicated in Figure 1, 46% of the policy stakeholders, 32% of the managerial stakeholders and 50% of the operational stakeholders are very familiar with the term sustainable design and construction. The term sustainability has recently been used in many areas, like sustainable economy, sustainable environment, sustainable education, sustainable health and the like. In Tanzania a step towards the concept of sustainability in design and construction was officially introduced into the construction industry in 2014, following the signing of a resolution to establish a Tanzania Green Building Council. It may be that familiarity with sustainable design and construction is based on the term being highly publicized in many areas. However, the extent to which sustainable design and construction is very familiar among stakeholders and has become a part of urban Tanzania design and construction practice is a debatable point. In 1998 Ofori argued that the concept of sustainable design and construction in the construction industry in terms of its response to environmental concerns was still lagging behind. Ofori (1998) and Du Plessis (2001) argued that the construction industry in
Proceedings: 9th Built Environment Conference
2-4 August 2015, Durban, South Africa
ISBN 978-0-620-67120-0
page 133
developing countries has neglected sustainable construction and recently, in 2015, Ozolins argued that development projects in developing countries do not contribute to sustainable development. In Tanzania, for example, the first green building was officially recognized only recently, in 2013 by using the Singapore green mark rating tool. 4.2
Meanings of Sustainable Design and Construction (SDC)
Meanings of sustainable design and construction revealed from in-depth interviews with 42 key stakeholders in three categories (policy, managerial and operational) are summarised using seven emerging themes in table 2. Table 2: Meanings of sustainable design and construction S/ n
Meanings
1
Environmental, cultural and economic Low cost Environment friendly Efficient and effective Durability of building products Meeting clients’ needs and urban development standards Doing the right thing Don’t know
2 3 4 5 6
7 8
Polic y
Manageria l
Operational
% of the total respondents
2
1
4
17%
3 2 4 4
2 -
6 3 2 -
26% 12% 14% 10%
-
4
-
10%
-
2
2 -
5% 5%
4.2.1 Environment, cultural and economic responsive design and construction In-depth interviews with stakeholders revealed that only 17% of the respondents conceptualize sustainable design and construction in line with the definition guiding this study. The rest, 83% of the respondents, conceptualize it as one or a combination of the following: low cost design and construction, environmental friendly design, traditional design and construction, efficient and effective design and construction, durability of buildings, meeting clients’ needs and urban development standards and as ‘doing the right thing’. Only 17% of the respondents had a holistic description of the meaning of sustainable design and construction describing it as activities that take care of the environment, nature, culture, traditions and people of a given place. Terminologies like continuity, which represent a dictionary meaning of sustainability and the word friendly were used often by the respondents to explain the meaning of sustainable design and construction. It was noted
Proceedings: 9th Built Environment Conference
2-4 August 2015, Durban, South Africa
ISBN 978-0-620-67120-0
page 134
that 17% of the respondents possess more of a theoretical meaning of sustainable design and construction rather than expressing a practical understanding when asked to describe how sustainability can be achieved in the Tanzania context. It was also noted that among the 17% of respondents who stated the meaning of sustainable design and construction as adopted by this study, there is only one respondent in the managerial category. 4.2.2
Low cost design and construction
26% of the respondents discussed the meaning of sustainable design and construction in terms of affordability of buildings by consumers, less building maintenance cost, and less time for design, approval, and construction implementation, which is reflected in lower overall project cost, and lastly building operational costs. In particular, they relate it with up-todate design and low cost of construction using locally available materials and avoiding delays in project implementation as key factors for controlling the cost of the project. It is obvious that one way of looking at the concept of sustainability in the construction industry is to look at the economic dynamics of a country, where efforts to lower ongoing and capital costs of the building is key to achieving sustainable design and construction. In that sense affordability of building products, which results from minimizing the costs involved in the design, construction and maintenance of buildings are key. Based on these stakeholders’ explanations of sustainable design and construction, it appears that cost is considered in isolation from environmental and cultural issues. The concept of sustainable design and construction encompasses controlling resource costs. In developing countries, particularly in Tanzania, resources that go in buildings need to be controlled because of the economic challenges facing the country. Therefore, the amount and type of resources has implications for cost. 4.2.3
Environmentally friendly design and construction
Environmentally friendly design and construction and ecological design and construction are widely used to represent green design and construction activities, and sometimes used as a synonym for sustainable design and construction. This study reveals that 12% of the respondents from the operational and policy category described the meaning of sustainable design and construction as environmentally friendly design and construction. According to the respondents, environmentally friendly design and construction are activities that consider climate, context, and they are ecological in the sense that they respond to the contextual aspects including materials, terrain and the like to create comfort. In addition, the environmental consciousness of a building needs to be evaluated for sustainability in all stages of the building’s existence from design to demolition (after building use). Although respondents were concerned with
Proceedings: 9th Built Environment Conference
2-4 August 2015, Durban, South Africa
ISBN 978-0-620-67120-0
page 135
only an environmental evaluation of buildings, this study argued that sustainable design and construction is more than environmentally friendly design and construction. Social, cultural, and economic sustainability need to complement environmental sustainability for sustainable design and construction to be achieved. This finding implies that for some of the respondents, sustainable design and construction is exclusively about protecting the environment, or protecting buildings from environmental forces, or taking advantage of the environment in designs and construction activities, thus indicating a need to create more awareness of social and economic sustainability. 4.2.4
Efficient and effective design and construction
In-depth interviews revealed another meaning of sustainable design and construction as efficient design and construction. 14% of the respondents used the term efficient design in explaining the meaning of sustainable design and construction by relating it with the efficient use of energy in buildings, efficient use of space in and outside the building, and the overall efficiency of the intended function of the building by allowing easy movement from one point to another, by creating convenience for building users, by allowing optimal use of space for comfort and by considering people with disabilities. It was also noted that the term efficient design was explained differently in interviews among operational and policy stakeholders. Policy stakeholders referred to efficient design as the optimal use of space and convenience for all space users and allowing flexibility in the use of space. On the other hand, operational stakeholders relate efficient and effective design and construction to energy efficiency. Based on interviews, energy efficiency was described in two ways. One description of energy efficiency was using less embodied energy for building construction activities, meaning efficient use of energy in the preparation of building materials, construction and demolition of building structures. The other description of energy efficiency was centred on the efficiency of buildings’ operational energy used to create comfort conditions in buildings, for example for lighting and cooling. Considering the meaning of sustainable design and construction guiding this study, energy efficiency is one step on the ladder of environmental sustainability, which is one pillar towards sustainable design and construction. 4.2.5
Durability of building products
10% of the respondents, all policy stakeholders, defined sustainable design and construction as the durability of building products. In describing the meaning of sustainable design and construction, durability was explained in terms of a long building lifespan, which results from good quality building material, design style, and specifications. According to the respondents, durability of building products is based on the design specifications, which
Proceedings: 9th Built Environment Conference
2-4 August 2015, Durban, South Africa
ISBN 978-0-620-67120-0
page 136
entails less building maintenance activities and hence is less costly to maintain. Key features from the respondents’ explanation of sustainable design and construction are good quality building materials used in the construction, efficient use of the buildings based on the intended purpose and longevity of building products. As such designers, developers, and contractors play a major role in the design and material specification and construction of a durable building. 4.2.6
Meeting client needs and urban development standards
10% of the respondents, all from the category of managerial stakeholders, specifically in the local government offices, conceptualized sustainability as design and construction that meets clients’ needs and that are in compliance with the urban development standards. This implies that the meaning of sustainable design and construction as meeting client needs and urban development standards is based on the stakeholders’ day to day activities and procedures of managing the built environment. For example, in issuing building permits, the drawings are scrutinized based on the urban development standards established by the municipal council. Building permits are issued when the drawings are in conformity with the standards for the total built up area allowed, plot coverage, plot ratio, buildings height and setbacks. Drawings need to be approved by the Municipal Land Officer, Municipal Town Planner, Municipal Environmental Health Officer, Municipal Architect, and Municipal Engineer before gaining the consent of the urban planning committee. As such, for the project to be approved by the municipal council, meeting urban development standards and client’s needs is a normal practice for the local government officials, which was also reflected in their meanings of sustainable design and construction. 4.2.7
Doing the right thing
5% of the respondents, all from the operational stakeholder category, conceptualized the meaning of sustainable design and construction as “doing the right thing”. These respondents are retired architects and their work and contribution to Tanzania architecture by designing with the climate, using passive cooling systems to create comfort in buildings, is recognised. One respondent among them received a 2012 Green Africa Award in the category of Green Design and Building for his “lifelong contribution for sustainable architecture in Tanzania”. The Green Africa Award was established in 2010 and officially announced in 2011 in Mauritius by the Allied Network for Policy Research and Advocacy for Sustainability (ANPRAS) in agreement with the US based Earth Day Network (EDN) “to give special recognition to its Green Awards”. This respondent revealed that to him sustainable design and construction means “Doing the right thing”. The respondents felt the term sustainable design and construction was “just a new terminology for the right practice”.
Proceedings: 9th Built Environment Conference
2-4 August 2015, Durban, South Africa
ISBN 978-0-620-67120-0
page 137
The respondent also argued that doing the right thing has a component of doing justice to the clients, to the environment, culture and economy while following professional ethics and that this is essential for sustainable design and construction. This is in line with another retired architect interviewed who described the term “doing the right thing” as designing and building using the basic knowledge of design with climate, context, and budget as taught in architecture schools.
5.0
CONCLUSION AND RECCOMENDATIONS
The findings from a questionnaire survey and in-depth interviews with key leaders in the construction industry, show that there are two ways of conceptualizing sustainable design and construction that cut across the three categories of stakeholders. These are first environmental, cultural and economic design and construction and second low cost design and construction. Low cost design and construction is considered by a plurality of stakeholders (26%) as the meaning of sustainable design and construction. Only 17% of the respondents understood sustainable design and construction in line with the holistic meaning that guided this research. Meanings revealed by 83% stakeholders adopt one but not all of environmental, economic and social sustainability. For example, for some respondents low cost or energy efficiency carries the whole meaning of sustainable design and construction. This implies the need for a comprehensive meaning of sustainable design and construction to be more widespread within the construction industry in Tanzania in order to contribute to the goal of promoting national sustainability. In terms of a general understanding of the concept of sustainable design and construction among the three categories of stakeholders, indepth interview results indicate that managerial stakeholders, especially local government officials, show a minimum understanding despite the questionnaire survey results, which show that managerial stakeholders are very familiar with the concept. It is recommended that the government of Tanzania, through the ministry of works establish a clear legal definition of sustainable design and construction so that stakeholders will share a holistic understanding of the concept facilitating the creation of a common goal of promoting sustainability in the Tanzanian construction industry. The Ministry of works must establish clear policy and legislation to promote and mainstream sustainable design and construction practices. Academic institutions need to invest in and carry out structured training about the concept of sustainable design and construction for stakeholders in the construction industry to acquire a stronger practical understanding. Professional associations and regulatory bodies should endeavour to create awareness and understanding of the benefits of sustainable design and construction practices among professionals in the construction industry.
Proceedings: 9th Built Environment Conference
2-4 August 2015, Durban, South Africa
ISBN 978-0-620-67120-0
page 138
6.0
REFERENCES
Abidin, N. (2009). Sustainable Construction in Malaysia - Developers' Awareness. Proceedings of World Academy of Science, Engineering and Technology Vol. 41, 807-814. Alsanad, S. et al, (2011). Challenges of Sustainable Construction in Kuwait: Investigating level of Awareness of Kuwait Stakeholders. World Academy of Science, Engineering and Technology.59. Brundtland, G. (1987). Our Common Future: The World Commission on Environment and Development. Oxford University Press. Oxford. Du Plessis, C. (2001). CIB A Special Agenda 21 for Sustainable Construction in Developing Countries. International Council for Research and Innovation in Buildings and Constrution. Gibberd, J. (2003). Intergrating Sustainable Development into Briefing and Design Process of Buildings in Developing Countries: An Assessment Tool. Pretoria: University of Pretoria, South Africa - PhD Thesis. Hakmat, H and Nsairat, S. (2009). Developing a Green Building Assessment Tool for Developing Countries. Case of Jordan. Building and Environment, 44: 1053-1064. McLennan, J. (2004). The Philosophy of Sustainable Design: The Future of Architecture. Ecotone LLC, Kansas City, Missouri Ofori, G. (1998). Sustainable Construction Principles and Framework for Attainment Comments. Construction Management and Economics 16: 2, 141 - 145. Ozolins, P. (2010). Assessing Sustainability in Developing Countries Context: The Applicability of Green Building Rating Systems to the Building Design and Construction in Tanzania and Madagascar. Virginia: Virginia Polytechnic Institute - PhD Thesis. Reffart, R. (2004). Sustainable Construction in Developing Countries. First Architectural International Conference. Cairo. Sassi, P. (2006). Strategies for Sustainable Architecture. Taylor and Fransis, New York. Sev, A. (2009). How can the Construction Industry Contributes to Sustainable Development?A Conceptual Framework. Sustainable Develoment. 17: 161-173 Sjostrom, C., & Bakens, W. (1999). CIB Agenda 21 for Sustainable Construction: Why, How and What. Building Research and Information, 27:6, 345-353. UNEP - SBCI. (2009). Buildings and Climate Change: Summary for Descion Makers. Paris. USGBC. (2009). Green Building Design and Construction. Washington, DC.
Proceedings: 9th Built Environment Conference
2-4 August 2015, Durban, South Africa
ISBN 978-0-620-67120-0
page 139
ASOCSA2015-48
Sustainable Energy in the South African Built Environment ¹Gerrit Le Roux Nel, ²Brink Botha & ³CM Adendorff; 1
Student, Built Environment and Information technology, Nelson Mandela University, Port Elizabeth. 2 Department of Construction Management, Nelson Mandela University, Port Elizabeth, email:
[email protected] 3 NMMU Business School, Nelson Mandela University, Port Elizabeth, email:
[email protected]
ABSTRACT AND KEYWORDS Purpose of this paper The purpose of this paper is to report on methods to supply sustainable energy to the increased demand by the South African Built Environment leading to sustainable supply and to determine how the environment chain can be satisfied. Design/Methodology/approach The study consists out of two types of data sources namely primary and secondary data. Primary data was obtained through an online web survey questionnaire being sent out via email. Findings Sustainable energy supply to the South African Built Environment is critical to allow for expansion and growth of the country’s infrastructure and to increase international investment within our country. Effective estimations for future developments are required to see that a country’s energy reserve margin remains at about 15 percent of the demand. South Africa contains great potential for further development of sustainable renewable energy. Originality / Value The paper would add value to developers to inform them of what measures they need to implement into new developments to ensure uninterrupted energy supply. Keywords Sustainable energy, energy reserve margin, renewable energy, energy supply and environmental impact.
Proceedings: 9th Built Environment Conference
2-4 August 2015, Durban, South Africa
ISBN 978-0-620-67120-0
page 140
1. INTRODUCTION AND BACKGROUND Globally, there was a rapid increase in the world’s economic growth in the 1950s and 1960s. These economic growths led to an increase in energy consumption that in turn increased the energy demand. Social needs started to rise in the 1970s. According to Davidson 2002b, it was realised that the richest 20% of the world’s population received 83% of the world’s income while the poorest 20% only received 1.4%. In South African context, the post-apartheid provision of infrastructure and energy posed a unique challenge. Current and historic systems structured to supply energy to the South African built environment mainly consist of the combustion of coal. Coal is responsible for 72.1% of South Africa’s primary energy needs and is unlikely to change significantly in the next decade as suitable alternatives to supply energy is limited (Eskom, 2013: 1). Providing a more sustainable supply and use of energy remains a challenge for future development in South Africa. According to Winkler (2006: 1), energy plays a critical factor in economic and social development while any energy system has an impact on the environment. More sustainable energy developments, the national level, would have a positive effect on global sustainability through decreasing climate change. Earthlife Africa Jhb (2009: 14) confirmed that the country’s energy crisis has resulted in power cuts, load shedding and an unreliable supply of electricity. A number of issues attributed to the cause of the energy crisis, including a shortage of coal at Eskom’s power stations, South Africa’s economic growth and rapid increase in electrified homes, which grew from 1.2 million to 4 million from 1990 – 2007. The energy generating capacity also declined from 45 000MW in 1994 to between 37 000 – 40 000MW in 2008. This crisis forced Eskom to produce rapid solutions. Old coal-fired stations were brought online and new ones were built, with little focus put on renewable and sustainable energy sources. Edkins et al. (2010: 1) indicates that South Africa has very good natural resources (solar and wind), but the deployment of renewable technologies has been slow. More than 90 percent of South Africa’s electricity is generated from the burning of coal. The state-owned company, Eskom, produces 40,7 GW electricity from 27 operational stations in South Africa. The additional capacity from Independent Power Producers results in a total capacity of 43.5 GW. The following summary of primary data explaining the related literature will highlight the variables that were addressed during the empirical study as part of this research explained in this paper.
Proceedings: 9th Built Environment Conference
2-4 August 2015, Durban, South Africa
ISBN 978-0-620-67120-0
page 141
2. REVIEW OF THE RELATED LITERATURE In global context During the late 1970s and early 1980s, there was a tremendous demand in the international arena to include environmental concerns alongside these of economic and social issues. The population started to notice the detrimental effects that the pollution had on the environment. Sustainable development is a development that satisfies the population’s current needs and goals without decreasing the future generations’ abilities to comply with their needs and goals. The three elements that are necessary for development to be sustainable are: 1. Economic development can be defined as the process that influences growth and restructuring of an economy to increase the economic well-being of a country or community (Kempner 2004); 2. Social development is the process of change that leads to improvements in human well-being and social relations, and are compatible with principles of democratic governance and social justice (UNRISD 2011); 3. Environmental development is the managing of the impact that the Human being and its activities have on his entire surroundings from water, the sun, air and all livening organisms; In the South African context South Africa’s energy is mainly supplied and generated by the state-owned utility, Eskom. According to Bekker et al., in Du Toit 2014, Eskom started as the Electricity Supply Commission (Escom) in 1923 which was renamed to Eskom in 1987. In 2001, Eskom was converted into a public company, with the state being the only shareholder (Eskom 2001 in Du Toit 2014). During the apartheid era, the South African government was only concerned to electricity supply services to the white population group and industrial sector, as it drove the economic grow of the country (Du Toit 2014). According to Eskom 1987 in Du Toit 2014, there was overbuilding of energy supply sources which lead to a 55 percent reserve margin and Eskom launched their ‘low-income electrification’ programme in 1987.Eskom has 27 operational stations in the country that produce 40.7 GW electricity (Eskom, 2009a). Independent Power Producers (IPPs) and imports from other countries increase the total electricity capacity to 43.5 GW. More than 90% of South Africa’s electricity is generated from the burning of coal (Edkines et al., 2010:8). The remainder of the electricity
Proceedings: 9th Built Environment Conference
2-4 August 2015, Durban, South Africa
ISBN 978-0-620-67120-0
page 142
come from nuclear and hydropower as well as newly commissioned renewable energy plants including the wind and solar. South Africa’s industrial sector (including mining) was the major consuming sector in 2008 by consuming 58 percent of the total electricity supply. At 20 percent, the residential sector consumed the second most electricity. The commercial and services sector consumed 15 percent while the remaining 7 percent were divided between the Agriculture, Transport and other sectors at 3, 2 and 2 percent respectively (DBSA, 2011:126). Coal as energy source Coal is currently the most widely used primary fuel, as it is used for 36% of total fuel consumption to produce electricity internationally. South Africa is one of the five largest coal users together with China, USA, India and Japan. These five countries account for 82% of total global coal use (Eskom, 2013). The coal demand increased with the rapid increase in the South African mining industry. At first the coal was used to generate steam, compressed air and then electricity. The use of coal has developed over the years and is currently being used mainly for electricity generation, petrochemicals, steel production, brick making and lime calcining. The burning of coal causes air pollution and the extractive activities have a severe impact on the environment. The technological advances provide information on the effect on the environment and guide industries on how they can control the use of fossil fuels, especially coal. Existing and emerging clean coal technologies enable the production, processing, conveyance and utilisation of coal in an environmental friendly manner. Coal is a non-renewable resource, as it takes millions of years to form, but there is still plenty of it in the ground (Du Toit, 2014). Coal is mined some distance away from the generating plants and then transported to the plants by coal trains. At the beginning of the twenty-first-century, coal experienced a rapid increase in usage, as oil, natural gas and other combustibles to generate electricity grew short. Coal remains a temporary solution for humankind’s energy problems while we are working towards more sustainable supplies of energy (IRP, 2011). Although there is a large quantity of coal available, it is not infinite. The combustion of coal produces carbon dioxide, carbon monoxide, sulfur oxides, nitrogen oxides and mercury compounds. Coal mining leaves long-lasting landscape scars with a possible runoff of toxic substances eg. lead, mercury and arsenic (Gibilisco, 2013). Alternative energy sources The Koeberg nuclear power station in the Western Cape is currently the only nuclear power station in Africa and produces 1800 MW power to provide 6.9% of South Africa’s electricity supply (Eskom, 2013). Nuclear energy relies on uranium, which is a by- product from gold mining (Du Toit,
Proceedings: 9th Built Environment Conference
2-4 August 2015, Durban, South Africa
ISBN 978-0-620-67120-0
page 143
2014). According to Kenny, in Winkler 2006, South Africa’s uranium reserves have been estimated at 261 000 tonnes. The government’s IRP identified nuclear power as one of the primary energy uses to produce electricity in the future. The IRP aims to construct nuclear power plants to the capacity of 9600 MW by 2030, which would lead to a total of 11 400 MW of nuclear power being generated in South Africa. Du Toit, 2014 states that the government appears committed to proceed with hydraulic fracturing and has recently published draft Technical Regulations for Petroleum Exploration and Exploitation. Renewable energy is energy that is generated from renewable and non-depletable energy sources. This includes hydropower, wind energy, solar energy, marine energy and biomass energy. Omer 2012 highlights the fact that water is one of the human’s basic needs for survival and can be effectively utilised as a source to produce renewable energy. As water is a finite commodity that cannot be created but only stored, we need to manage it to the best of our abilities (Omer, 2012). That is the reason why we are capable of using stored water to generate hydropower without depleting the stored water. According to Du Toit 2014, South Africa’s energy supply currently contains 668 MW of installed hydropower and 1580 MW of pumped storage schemes. The government plans to increase this 2248 MW hydropower to 5499 MW in 2023 by starting to import hydropower from Mozambique and Zambia in 2020 (IRP, 2010). South Africa is a country that utilises wind energy for many years already. Wind energy is the transformation of natural occurring wind energy into power or electricity by windmills or wind turbines respectively (NERSA, 2009: 5). When large wind turbines operate together in a ‘wind farm’, they produce electricity that can be fed into the national grid. Holmet al, 2008 in (Edkins et al., 2010:6) estimates that South Africa produce 23 MW of wind power off-grid through windmills to operate boreholes across the country. According to (Edkins et al., 2010: 6) South Africa only had two existing wind energy plants before the governments IRP in 2010. Decrease is supply security Since the 1990s, Eskom’s performance was good until recent years. Newbery et al., (2008: 51) states that quality and security of supply used to improve, progress was made in extending access to electricity and the utility decreased its debt. In recent years, we saw that the quality of supply has deteriorated as the ageing plant is run to its maximum capacities. Security of supply has been prejudiced by delays in investment planning. South Africa’s reserve margin capacity experienced a large fall to around 8 percent in recent years (15 percent is seen as normal), which placed immense pressure on the industry (DME, 2008: 8). In 2010 the South African Department of Energy (DoE) presented an Integrated Resource Plan (IRP) for the country, when the Minister of Energy determined that new generation was required in terms of section 34 of the Electricity
Proceedings: 9th Built Environment Conference
2-4 August 2015, Durban, South Africa
ISBN 978-0-620-67120-0
page 144
Regulations Act (DoE, 2006). This plan was developed to guide the energy sector to indicate the necessary new built power plants to reduce the power shortage of the country and increase the energy reserve margin for South Africa. This IRP included the provision of 1 000 000 solar water heaters to reduce electricity consumption (DoE, 2006). The IRP was developed for the period 2010 to 2030 and was planned to be updated at least every two years. The IRP was revised and the final plan allowed for a total increase of 44.54 GW in 2010 to 89.53 GW by 2030. The plan included 6.3 GW for coal, 9.6 GW for nuclear fleet, 2.6 GW from imported hydro power, 6.3 GW from other generation sources and 17.8 GW from renewable resources (8.4 GW Solar PV, 1 GW CSP, 8.4 GW Wind). The proposal ensures the security of supply of energy and is a major step for South Africa in terms of climate change commitment as expressed at the Copenhagen summit (DoE, 2011). New Infrastructure & governance The Electricity Regulation Act 4 of 2006 states the government’s interest to develop South Africa’s infrastructure. The Act’s objects are amongst other to achieve efficient, effective, sustainable and orderly development and operation of electricity supply infrastructure in South Africa (DOE, 2006: 6). When planning to develop new infrastructure, it is important to consider the integration of generation facilities into the transmission grid (DBSA, 2011: 137). It is important because of the intermittency of the wind and solar energy where it cannot be stored. The location of new energy facilities is also important, as the resource to produce the energy (e.g. wind) must be available and it would create the potential to change energy flow patterns (DBSA, 2011: 138). South Africa saw electricity shortages in 2007/2008 and 2014 which lead to ‘load shedding’ across the country (Du Toit, 2014: 67). The Department of Minerals and Energy (DME) predicted in their White Paper in (1998: 53) that South Africa would see a shortage of electricity in 2007 if no increase is made to their supply. Until recently it was seen as the premier policy document which guides all subsequent policies, strategies and legislation within the South African energy sector (Du Toit, 2014: 206). In 2004, the DME published a White Paper on the Renewable Energy Policy of the Republic of South Africa (the REWP). This REWP states the government’s vision of developing an economy that increases the renewable energy consumption share and provide affordable access to energy throughout the RSA, and thus contributing to sustainable development and environmental conservation (DME, 2004: 1). The REWP states that ‘The Department of Minerals and Energy will take overall responsibility of renewable energy policy coordination in South Africa, working closely with the relevant Government Departments and institutions’ (DME, 2004: 41). The Electricity Regulation Act No.4 of 2006 was developed in order to regulate the electricity supply industry of South Africa (DOE, 2006: 10). The National Energy Act 34 of 2008 is the framework
Proceedings: 9th Built Environment Conference
2-4 August 2015, Durban, South Africa
ISBN 978-0-620-67120-0
page 145
regulation of South Africa by regulating the country’s entire energy supply where the Electricity Regulations Act only regulates the country’s electricity sector. Among the objects of the Act it includes uninterrupted supply of energy to the Republic; diversity of energy supply and sources; appropriate standards and specifications for the equipment, systems and processes used for producing, supplying and consuming energy; optimal supply, transformation, transportation, storage and demand of energy that are planned, organized and implemented in accordance with a balanced consideration of security of supply, economics, consumer protection and a sustainable development; and ensure effective planning for energy supply, transportation and consumption (DOE, 2008: 6). The load shedding in 2007/2008 led to the development of the Integrated Resource Plan (IRP) 2010-2030. The IRP was first published in 2010 when the Minister of Energy determined that it was necessary for a new generation in terms of section 34 of Electricity Regulations Act (Du Toit, 2014: 214). The objectives of the IRP 1 (2009: 9) were to produce 10 000 GWh renewable energy by 2013; implement energy efficiency and demand side management through a financial incentive scheme; and install one million solar water heaters. The National Energy Regulator of South Africa (NERSA) introduced a feed-in tariff (FIT) policy in 2009 through its Renewable Energy Feed-In Tariff (REFIT) approval by the government. Du Toit (2014: 170) states that for effective FIT policies it is important that grid operators connect renewable energy installations to the grid, purchase the generated energy at pre-determined prices and to upgrade the grid to accommodate renewable energy sources. Environmental demands Human activities are warming the planet (Earthlife, 2009: 2). Du Toit indicates in (2014: 26) that greenhouse gases (GHGs), including carbon dioxide (CO2), methane and nitrous oxide, naturally occur in the Earth’s atmosphere and have a heat-trapping effect that is responsible for naturally warming the global surface air temperature. Without this natural warming process, the earth would be well below freezing point. During the Industrial Revolution, there was a rapid increase in energy demand, which was supplied primarily through the combustion of coal (Winkler, 2006). This lead to a dramatic increase in the GHG emissions and resulted in an increase in the average global temperatures. Du Toit also informs in (2014: 30) that some of the vulnerabilities already experienced by South Africa include high incidents of diseases such as tuberculosis and HIV/AIDS, water scarcity and a lack of access to services such as clean water and sanitation. Winkler states in (2006: 98) that South Africa’s reliance on coal energy sources is the main reason behind South Africa’s high CO2 emissions. South African CO2 sources that are coal-related include electricity generation and the production of synthetic liquid fuels, and energy-intensive industries such as mining, iron and steel, aluminum,
Proceedings: 9th Built Environment Conference
2-4 August 2015, Durban, South Africa
ISBN 978-0-620-67120-0
page 146
ferrochrome and chemicals (Winkler, 2006: 98). Climate change is described by the United Nations Framework Convention on Climate Change (UNFCCC) in (Du Toit, 2014: 26) as change of climate which is attributed directly or indirectly to human activity that alters the composition of global atmosphere and which is in addition to natural climate variability observed over comparable time periods. Bhattacharyya, 2010 confirms that natural disasters such as heat waves, flooding and drought are some of the effects of climate change, and accelerates the destruction of ecosystems (including the extinction of animal and plant species). South Africa is one of the developing countries that have a large share of responsibility to the climate change situation, due to its high levels of GHGs emitted from its fossil-fuel powered economy (National Climate Change Response White Paper, 2011: 5). The International Energy Agency (IEA) ranked South Africa as one of the worlds’ top 20 carbon emitters and the country is seen as between industrial and developing economies. According to the IEA tables (2013: 48-57), South Africa has a level of 7.27 tonnes carbon dioxide per capita. This relates to well developed countries such as New-Zealand at 6.87 t CO2/capita, Norway at 7.69 t CO2/capita and the United Kingdom is at 7.06 t CO2/capita. Other developing countries have a much lower rate of emission for example India at 1.41 t CO2/capita, China at 5.92 t CO2/capita and Kenya only at 0.28 t CO2/capita. In the year 2000, 79 percent of South Africa’s GHG emissions came from CO2. This is due to South Africa’s high dependence on coal to produce 72 percent of its energy and 85 percent of its electricity (Eskom, 2013: 1). Legislation governing environmental concerns The UNFCCC was planned in 1992, due to the international concerns about climate change and the need to control it and started in 1994. The UNFCCC’s primary objective is to reach stabilisation of GHG concentrations in the atmosphere at a level that would prevent dangerous anthropogenic interference with the climate (UNFCCC). Such a level should be reached within a sufficient time frame to allow natural adaption for ecosystems, without threatening food production and enable economic development to proceed in a sustainable manner (UNFCCC). South Africa joined the UNFCCC in 1997 (UNFCCC). The UNFCCC require joint countries to take various listed actions in order to protect the climate system for current and future generations. The UNFCCC also recognises the special difficulties of especially developing countries whose economies are dependent on the use and exportation of fossil fuels to reduce their GHG emissions, with specific to South Africa. The Kyoto Protocol was drafted by the UNFCCC and it provides specific emission reduction targets (Du Toit, 2014: 19). Environmental Assessment
Proceedings: 9th Built Environment Conference
2-4 August 2015, Durban, South Africa
ISBN 978-0-620-67120-0
page 147
Assessment means the process of collecting, organizing, analysing, interpreting and communicating information that is relevant for decisionmaking. Strategic Environmental Assessment (SEA) is the process of integrating the concept of sustainability into decision-making. (Strydom et al., 2009: 983). When evaluating a potential development project which have potential environmental impacts, an Environmental Impact Assessment (EIA) must be conducted (Turpie in Strydom et al., 2009: 51). The EIA can be defined as the process of examining the possible/potential environmental effects of a development (DEA, 2010: 13). The National Environmental Managing Act (NEMA) has split the process into two types of assessment, namely a basic assessment process and a scoping and Environmental Impact Assessment Report (S&EIR) process (DEA, 2010: 13). The difference between these processes relates to the proposed developments’ nature and the potential impact on the environment. Well known activities are easily predictable and likely to receive basic assessment, compared to the not well-known activities that would require S&EIR (DEA, 2010: 13). The DEA (2010: 22) informs that the S&EIR entails a scoping phase and an environmental impact assessment phase. In the scoping phase, issues are identified and it includes a plan of study for the EIA. Issues identified in the scoping phase are assessed in the EIA phase and includes an EIP (DEA, 2010: 22). Information on the proposed activity and the manner in which potential impacts will be reduced are discussed in the EMP. Current situation and protocol South Africa’s current electricity supply is not sufficient to comply with the demand and Eskom informed (March 2014) that the electricity supply system would remain under pressure until a substantial amount of the newly built programme is complete. Daim et al. (2011:71) acknowledge the fact that implementation of energy efficiency technologies are complex and need to be complying with society, economy and perspective of technology. Lee et al. confirms in (2013: 631) that the development of energy sources (alternatives to fossil fuel) takes a lot of time and the immediate solution to the energy shortage is the reduction of energy consumption through IT in all economic sectors. Ngoma (2014: 47) confirms that the use of ITCs creates intangible assets in the form of managerial improvements, which would increase the overall efficiency of production and therefore increase the total factor of production which in turn leads to a sustainable economy. Energy profiling & hydrogen production
Proceedings: 9th Built Environment Conference
2-4 August 2015, Durban, South Africa
ISBN 978-0-620-67120-0
page 148
Energy profiling in the built environment involves the analysis of the actual / predicted energy performance of buildings and the energy embodied in the used materials and methods to construct the building (Crosbie et al., 2009: 22). The aim of this analysis is to improve the building in terms of energy performance. Energy profiling may also include energy consumed and CO2 emissions to produce the energy (Crosbie et al., 2009: 22). The rising environmental concerns and electricity prices lead to great interest internationally to optimise energy performance of commercial and domestic buildings through their entire life cycle (Crosbie et al., 2009: 22). Hydrogen is the most abandoned element on the planet and cannot be destroyed but only change state during consumption, e.g. water to hydrogen and back to water. Omer (2012: 47) informs that hydrogen is now accepted as a form to store energy for reuse onto or from the grid. Electrical power generated from wind and wave farms can produce hydrogen through electrolysis of water. Electrolysis split water into hydrogen and oxygen which are caught as gases (Omer, 2012: 47).
3. RESEARCH METHODOLOGY This paper reports on research based on a quantitative research methodology that obtained the primary data which was supported by the secondary data in order to test each sub-problem’s hypothesis. The primary data was gathered via e-mail in the form of an online survey as well as a manual attached document. This data was then analysed and interpreted. The sample was determined according to the delimitations of the study. The candidates were mostly Engineers, Project Managers, Sustainability Consultants, Suppliers to the Grid and Government officials. The questionnaire was only sent to professionals that are currently involved with the South African energy sector to ensure that the data is accurate and trustworthy. The 5 point Likert-type scale was used for the questionnaire. This scale ranges from 1 – 5, where 1 is considered being not important or strongly disagree and 5 being very important or strongly agree. A mean score (MS) was calculated from the completed questionnaires to indicate the percentage of responses allocated to each of the 5 options per question. This enables me to categorise the data into tables, graphs and pie charts according to their importance.
4. RESULTS It is notable (with a mean score of 4.22) that respondents believe that insufficient energy resources contribute in a near major extent to a major extent in the Built Environment electricity shortage. Respondents also believe that our South African culture to waste / increased human population and new property developments contribute in some extent to
Proceedings: 9th Built Environment Conference
2-4 August 2015, Durban, South Africa
ISBN 978-0-620-67120-0
page 149
near the major extent to the electricity shortage. The respondents indicated that RDP houses / free-basic-electricity and previously low electricity prices also contribute to a near important extent to some extent in the electricity shortage. Table 1: Percentage contribution to electricity shortage in Built Environment Aspect
Unsure
Not……………………………….Very
Mean
Rank
Score
New property
U
1
2
3
4
5
0.0
6.5
15.2
17.4
37.0
23.9
3.57
4
developments RDP houses
4.3
8.7
19.6
23.9
19.6
23.9
3.32
5
Free-Basic-Electricity
6.5
4.3
30.4
19.6
15.2
23.9
3.26
6
Insufficient energy
0.0
4.3
6.5
9
23.9
56.5
4.22
1
0.0
2.2
8.7
28
26.1
34.8
3.83
3
resources Increased human population Culture to waste
2.2
0.0
6.5
11
39.1
41.3
4.18
2
Previous low electricity
0.0
17.4
13.0
23.9
28.3
17.4
3.15
7
price
With a mean score of 4.57 the respondents also believe to a near major to major extent that South Africa contains large potential for renewable energy resources (wind, solar PV, CSP). Furthermore respondents ranked Insufficient planning for the increased demand resulted in unsustainable energy supply the 3rd highest with a mean score of 4.48 which indicates that it contributes in a near major to major extent to the limited infrastructure. Respondents also believe to a near major extent (with a mean score of 4.18) that the electricity shortages of 2007-2008 forced the development of new power plants.
Agree
Strongly agree
SD
D
N
A
SA
2.2
0.0
0.0
4.3
26. 1
67. 4
4.6 4
1
The electricity shortages of 2007 – 2008 forced the development of new power plants Insufficient planning for the increased demand resulted in unsustainable energy supply
2.2
0.0
4.3
8.7
50. 0
34. 8
4.1 8
4
0.0
4.3
0.0
0.0
34. 8
60. 9
4.4 8
3
Proceedings: 9th Built Environment Conference
2-4 August 2015, Durban, South Africa
Rank
Neutral
Mean Score
Disagree
U South Africa postponed their duty to increase the electricity generation capacity for too long
Unsure
Strongly disagree
Statement
Table 2: Extent to which certain factors contribute to the limited electricity supply infrastructure
ISBN 978-0-620-67120-0
page 150
The low selling price of electricity prevented the development of sustainable energy technologies South Africa contains large potential for renewable energy resources (wind, solar PV, CSP)
0.0
13. 0
26. 1
13. 0
30. 4
17. 4
3.1 3
5
0.0
0.0
0.0
6.5
30. 4
63. 0
4.5 7
2
It is notable that the respondents believe that all the factors are important to more than important with a mean score range from ≥ 3.26 to ≤ 4.12. The respondents perceive the low reserve margin of energy to support a rapid increase in demand (with a mean score of 4.12) to contribute to a near major extent to the unsustainable energy supply as it is ranked 1st. The respondents ranked the focus on medium term sustainable investment and not enough long term sustainable investments the 2nd highest with a mean score of 3.81. It is also noted that the respondents ranked both slow implementation of net metering (small producers feed into grid and offset supply against consumption) and a feed-in-tariff by government to purchase renewable energy at a pre-determined price that it economy related in the 4th position with mean scores of 3.30 and standard deviations of 1.45 and 1.69 respectively. Table 3 Contribution of the following factors to an unsustainable energy supply Unsure
Not…………………..…….Very
U 6.5
1 4.3
8.7
0.0
6.5
Aspect Small versatility in energy supply mix (mostly coal) Low reserve margin of energy to support a rapid increase in demand Slow implementation of net metering (small producers feed into grid and offset supply against consumption) A Feed-In-Tariff by government to purchase renewable energy at a pre-determined price that is economy related. An interconnection between neighboring countries’ electricity networks. Focus on medium term sustainable investment and not enough long term investments
Mean Score
Ran k
3.26
6
4.12
1
2 28. 3 2.2
3 17. 4 19. 6
4 26. 1 34. 8
5 17. 4 34. 8
6.5
19. 6
23. 9
26. 1
17. 4
3.30
4
6.5
10. 9
10. 9
23. 9
34. 8
13. 0
3.30
4
13.0
8.7
8.7
26. 1
23. 9
19. 6
3.43
3
6.5
2.2
4.3
28. 3
32. 6
26. 1
3.81
2
With a mean score of 4.04 and ranked 1st it is apparent that respondents perceive South Africa’s dependence on coal as energy resource to contribute some extent to a near major extent to increase the renewable
Proceedings: 9th Built Environment Conference
2-4 August 2015, Durban, South Africa
ISBN 978-0-620-67120-0
page 151
energy implementation from an environmental perspective. The 2nd highest ranked factor, GHG emissions from coal energy, has a mean score of 4.00 and is also considered by respondents to contribute some extent to a near major extent to the environmental demand to increase renewable energy supply. With a mean score of 3.78 (ranked 3rd) it is apparent the respondents perceive Health and Safety implications from air pollution and coal dust as an important to more than important factor to increase renewable energy implementation from an environmental point of view.
Table 4: Environmental factors contributing to increased renewable energy implementation Aspect
South Africa’s dependence on coal as energy resource GHG emissions from coal energy Water usage from coal power plants leads to insufficient and toxic water supply for human consumption Health and Safety implications from air pollution and coal dust Global rise in air temperature Carbon Tax levies Low running cost of renewable energy
Unsure
Mean Score
Rank
U
Minor………………….…………….… Major 3 1 2 4 5
2.2
4.3
4.3
21.7
19.6
47.8
4.04
1
4.3
2.2
6.5
13.0
41.3
32.6
4.00
2
4.3
8.7
8.7
17.4
30.4
30.4
3.68
4
0.0
6.5
8.7
10.9
47.8
26.1
3.78
3
2.2
8.7
10.9
21.7
23.9
32.6
3.62
5
2.2
6.5
10.9
21.7
39.1
19.6
3.56
6
8.7
10.9
10.9
15.2
26.1
28.3
3.55
7
With a mean score of 4.17 and ranked 1st, respondents believe the fact that not all South African municipalities accepted net-metering installations play an important to more than important part in the slow implementation of the technologies to ensure better generation and utilisation of electricity. The high initial capital outlay of these new technologies (ranked 2nd) is
Proceedings: 9th Built Environment Conference
2-4 August 2015, Durban, South Africa
ISBN 978-0-620-67120-0
page 152
also rated to contribute some extent to a near major extent (with a mean score of 4.09) to the slow implementation of the new technologies. The respondents also perceive that the following three factors: public not aware of building life-cycle savings, slow development of specialist knowledge in the field and limited interest from public to implement technology all contribute some extent to a near major extent on the slow implementation of better new technologies to generate and utilise electricity with mean scores of 3.91, 3.89 and 3.60 respectively. With a mean score of 3.59 the fact that uneducated building occupants do not prefer new technologies are ranked 7th and contribute some extent to a near major extent.
0.0
2.2
2.2
2.2
0.0
2.2
13. 0 17. 4 8.7
6.5
2.2
2.2
10.9
0.0
0.0
0.0
4.3
17. 4
Slow development of specialist knowledge in the field Limited interest from public to implement technology Public not being aware of all the available technologies Public not aware of building lifecycle savings Not all South African municipalities accepted netmetering installation Uneducated building occupants do not prefer new technologies
N 10. 9 8.7
SA 34. 8 32. 6 17. 4 28. 3 23. 9 30. 4
4.0 9 3.9 1 3.6 0 3.8 9 4.0 0 4.1 7
2
15. 2 15. 2 13. 0 15. 2
A 41. 3 43. 5 45. 7 45. 7 52. 2 43. 5
15. 2
41. 3
21. 7
3.5 9
7
Rank
D 4.3
Mean Score
Disagree
SD 2.2
Strongly agree
Strongly disagree
U 6.5
Agree
Unsure
High initial capital outlay
Neutral
Factors
Table 5: Extent to which factors influence the slow implementation of new technologies
4 6 5 3 1
5. RECOMMENDATIONS The rapid increase in accessibility to electricity by South African citizens without increasing the supply of electricity leads to the supply shortages. The recommendations to deal with this supply shortage are to increase the energy supply mix. The country therefore has to increase the variety of energy sources used to produce electricity in order to ensure sustainable supply. Coal fired power plants need to be stocked with good quality coal that is able to be used at all times to ensure sustainable supply of electricity. Infrastructure is run to its maximum to ensure adequate supply for the demand. This continuous maximum capacity production makes it difficult to conduct preventative maintenance on current plat. The recommendations would be to increase to generation plant capacity. This
Proceedings: 9th Built Environment Conference
2-4 August 2015, Durban, South Africa
ISBN 978-0-620-67120-0
page 153
would allow shutting down plants in order to execute maintenance procedures. New renewable and nuclear energy should be developed. These types of energy are very sustainable and require minimal operational costs. Renewable energy must be used to supplement other energy sources such as coal and nuclear. The predictions for future energy demand is very accurate up to date and plans are put in place to effective expansion of energy generation plant, but it is not implemented. Competent educated people need to develop plans for executing and funding the developed plans and execute it. The state owned governance need to allow for more privatisation of the energy supply sector in order to create competition and support in a similar manner. Nuclear power plants need to be developed to ensure sustainable supply in the future. Too much focus is being placed on supplying the current and medium growth instead of long term sustainable developments. South Africa is a major contributor to the immense GHG emissions in the world. South Africa’s dependence on coal as a source of energy is the main reason for the high emission rate. The recommendation would be to install renewable energy measures in all new developments that allow for complete generation of their own electricity while connected to the grid. This must be a bi-directional connection that allows to building owner to use grid electricity when his current demand exceeds is supply and feed electricity into the system is his supply exceeds his demand. Better quality coal should be kept for the country’s own use and not only exported to reduce the GHG emissions. New advanced technological support systems to increase energy efficiency do exist, but are slowly implemented within South Africa. The costs of these new technologies should not be seen as an expense by the client, but rather as an investment as it would reduce the building’s operational costs and increase the value of the building when being sold. These technologies such as energy profiling must become compulsory for the construction as well as the life-cycle phase of projects. Existing buildings should also be refitted with these green energy saving technologies.
6. CONCLUSIONS A sustainable supply of energy is one of the structural factors to ensure social and economic development. Energy supply and sustainable development are inseparable from one another. Sustainable energy supply to the South African Built Environment is critical to allow for expansion and growth of the country’s infrastructure and to increase international investment within our country. Research has shown that it is essential to plan and execute the plans to ensure a sustainable supply of energy to the built environment. Effective estimations for future developments is required to see that a country’s energy reserve margin remains at about 15 percent of the demand to allow for unexpected rapid increases in energy demand. South Africa contains great potential for further development of sustainable
Proceedings: 9th Built Environment Conference
2-4 August 2015, Durban, South Africa
ISBN 978-0-620-67120-0
page 154
renewable energy. The technologies already exist and are slowly being implemented. It is very expensive to start, but has minimal running costs throughout its life-cycle. These renewable energy sources (wind, solar PV and CSP) are effective to strengthen the energy supply chain, but need to be supported by large amounts of coal and nuclear energy to comply with the energy demand.
7. FUTURE RESEARCH Further studies should be conducted in the following areas:
How to finance sustainable nuclear energy plants within the country; The development of new construction projects with minimal dependence on grid electricity; How to effectively implement a wide mix of energy source to produce sustainable energy to the South African Built Environment; The cost saving aspect throughout a development’s life-cycle if selfsustaining measures are incorporated into the design; The effects that energy shortages (i.e. load shedding) have on the built environment and economy;
REFERENCES Abdeen, M.O. 2010. A review of non-conventional energy systems and environmental pollution control. Soil Science and Environmental Management, volume 1, no. 7, pp. 127-154. Bhattacharyya, S.C. and Timilsina, G.R. 2010. A review of energy system models: International Journal of Energy Sector Management Vol. 4 No. 4, 2010 pp 494-518. Crosbie, T., Dawood, N. and Dean, J. 2009. Energy profiling in the lifecycle assessment of buildings. Management of Environmental Quality, volume 21, no. 1, pp. 20-31. Davidson, O. 2002a. Sustainable energy and climate change: African perspectives. Cape Town: Energy and Development Research Centre: 145-152. Davidson, O. 2002b. Business opportunities and sustainable development. South African journal of economic and management sciences, volume 5, no. 2, pp. 288-296. Du Toit, L. 2014. Promoting renewable energy in South Africa through the inclusion of market-based instruments in South Africa’s legal and policy framework with particular reference to the feed-in tariff. Cape Town: University of Cape Town. (PhD-thesis).
Proceedings: 9th Built Environment Conference
2-4 August 2015, Durban, South Africa
ISBN 978-0-620-67120-0
page 155
Earthlife Africa Jhb. 2009. Climate change, development and energy problems in South Africa: Another world is possible. Johannesburg: Wits University Press. Edkins, M., Marquard, A. and Winkler, H. 2010. South Africa’s renewable energy policy roadmaps. Cape Town: Energy research Centre. Eskom Fact Sheet 2013 available at http://www.eskom.co.za/AboutElectricity/FactsFigures/Documents/CO0 007CoalSARev12.pdf Gibilisco, S. 2013. Alternative Energy: Electricity from Fossil Fuels. Access Engineering. [Online]. Available: http://0accessengineeringlibrary.com.wam.seals.ac.za/browse/alternativeenergy-demystified-second-edition/c9780071794336ch10 [Accessed 24 February 2014]. Kempner, R. 2004. The Innovation Imperative, Economic Development Administration, US Department of Commerce conference. Washington, D.C. Kenny in Winkler, H. (ed). 2006. Energy Policies for Sustainable Development in South Africa: Options for the future. Cape Town: University of Cape Town, Energy Research Centre. Lee, S.M., Park, S.H. and Trimi, A. 2013. Greening with IT: practices of leading countries and strategies of followers. Management Decision, volume 51, no. 3, pp. 629-642. National Energy Regulator of South Africa (NERSA). 2009. South Africa Renewable Energy Feed-In Tariff (REFIT): Regulatory Guidelines 26 March 2009. Johannesburg: NERSA. Newbery, D. and Eberhard, A. 2008. South African Network Infrastructure Review: Electricity. A paper written for National Treasury and the Department of Public Enterprises Government of South Africa. Omer, A.M. 2012. Clean energies development in the built environment. World Journal of Science, Technology and Sustainable Development, volume 9, no. 1, pp. 45-63. Paul, D.I. and Uhomoibhi, J. 2014. Solar electricity generation: issues of development and impact on ICT implementation in Africa. CampusWide Information Systems, volume 31, no. 1, pp. 46-62. Republic of South Africa. National Planning Commission 2011. National Development Plan: Vision for 2030. Republic of South Africa. Department of Energy 2006. Electricity Regulations, 2006: Determination regarding the Integrated Resource Plan and new generation capacity. GN 1243 in Government Gazette No. 32837 dated 31 December 2009. Republic of South Africa. Department of Energy 2008. National Energy Act No. 34 of 2008. Republic of South Africa. Department of Energy 2011. Electricity Regulations on the Integrated Resource Plan 2010-2030. Republic of South Africa. Department of Energy 2013. Integrated Resource Plan for Electricity (IRP) 2010-2030: Update Report 2013.
Proceedings: 9th Built Environment Conference
2-4 August 2015, Durban, South Africa
ISBN 978-0-620-67120-0
page 156
Republic of South Africa. Department of Environmental Affairs 2010. Compantion to the EIA Regulations 2010, Integrated Environmental Management Guideline Series 5, Pretoria, South Africa. Republic of South Africa. Department of Environmental Affairs 2011. South Africa’s Second National Communication under the United Nations Framework Convention on Climate Change. Pretoria. Republic of South Africa. Department of Minerals and Energy (DME) 2008. Electricity Pricing Policy of the South African Electricity Supply Industry. Republic of South Africa. Department of Minerals and Energy (DME) 1998. White Paper on the Energy Policy of the Republic of South Africa. Republic of South Africa. Department of Minerals and Energy (DME) 2003. Integrated Energy Plan for the Republic of South Africa. Strydom, H.A. and King, N.D. Eds. 2009. Fuggle & Rabie’s Environmental Management in South Africa. 2nd edition. Cape Town: JUTA Law. Turpie, J. in Strydom, H.A. and King, N.D. Eds. 2009. Fuggle & Rabie’s Environmental Management in South Africa. 2nd edition. Cape Town: JUTA Law. Ummel, K. 2013. Planning for Large-Scale Wind and Solar Power in South Africa: Identifying Cost-Effective Development Strategies Using Spatiotemporal Modeling. Working Paper 340. Washing DC: Center of Global Development. UNFCCC. 1992. In Du Toit, L. 2014. Promoting renewable energy in South Africa through the inclusion of market-based instruments in South Africa’s legal and policy framework with particular reference to the feed-in tariff. Cape Town: University of Cape Town. (PhD-thesis). United Nations Framework Convention on Climate Change Status of Ratification of the Convention. [Online] http://unfccc.int/essential_background/convention/status_of_ratification /items/2631.php [Accessed 24 July 2014]. Van der Linde, M. in Strydom, H.A. and King, N.D. Eds. 2009. Fuggle & Rabie’s Environmental Management in South Africa. 2nd edition. Cape Town: JUTA Law. Van Horen, C. 1994. In Winkler, H., 2006. Energy policies for sustainable development in South Africa’s residential and electricity sectors. Cape Town: Energy research center. Winkler, H. 2006. Energy policies for sustainable development in South Africa’s residential and electricity sectors. Cape Town: Energy research center. 18 March 2014. Eskom asks coal mines to help avert crisis. [Online]. Available: Green Business guide http://www.greenbusinessguide.co.za/eskom-asks-coal-mines-to-helpavert-crisis/ [Accessed 24 March 2014].
Proceedings: 9th Built Environment Conference
2-4 August 2015, Durban, South Africa
ISBN 978-0-620-67120-0
page 157
ASOCSA2015- 063
The primary factors contributing to the low implementation of green building practices in South Africa 1
Nishani Harinarain1
[email protected]
1
Property Development Programme, School of Engineering, College of Argiculture, Engineering & Science. University of KwaZulu-Natal, King George V Avenue, Durban,4041, South Africa. Tel.: +27312602687
ABSTRACT AND KEYWORDS Purpose of this paper Even though green building has gained significant momentum in recent years, the South African construction sector seems to still be in the wake of other countries, experiencing resistance and barriers which prevent the uptake of such construction methods. The purpose of this paper is to investigate the primary factors contributing to the low implementation of green building principles in South Africa. Design/methodology/approach An extensive review of literature was conducted in order to ascertain a comprehensive list of common factors inhibiting the adoption of green building practices. This was then used in the questionnaire which was sent to a random sample of 180 professionals, namely, quantity surveyors, architects and engineers. A total of 42 responses were received. Research Limitations/implications Only architects, quantity surveyors and engineers were sent the questionnaire. Future research can consider the opinions of contractors. Findings This study revealed that cost is the primary factor contributing to the low implementation of green building principles. It is recommended that education is the key to overcoming the factors inhibiting the widespread implementation of green building. Life cycle costing was also identified as a
Proceedings: 9th Built Environment Conference
2-4 August 2015, Durban, South Africa
ISBN 978-0-620-67120-0
page 158
key component of this finding and the means of overcoming it by revealing long term cost savings. Practical implications This study can be used for further research to assist the construction industry in green building practices. Originality/value of the paper The investigation serves to create awareness as to the fundamental problems causing the low implementation of green building practices, as well as providing clarity on the important areas which need to be addressed. Keywords: Construction industry, South Africa, Green Building 1. INTRODUCTION The construction industry is very dynamic and in a state of constant change. There is a large influx of new technologies and materials into the construction market all the time. Society has created a need for diversity and change as they aim to satisfy their own needs and wants. Much of this change is therefore driven by limited resources and unlimited wants (Powell, Parkin & Mathews, 2008). With various economic perspectives in mind, this principle of limited resources and unlimited wants has, in all industries, led to ‘over-indulgence’, whilst neglecting to realise how future generations may be adversely affected. In the construction industry, until recently, little thought has gone into how current construction materials and methods are negatively impacting the environment, as resources such as land, water, etc. are still fairly abundant. This being said, diminishing resources have led to a greater awareness of the future effects of current practices, calling for an intervention. Even though green building has gained significant momentum in recent years, the South African construction sector seems to still be in the wake of other countries, experiencing resistance and barriers which prevent the uptake of such construction methods. This study is therefore concerned with green building practices, and more specifically, the reason why these concepts are not implemented to a degree that would be optimally beneficial to the South African construction industry. By this it is meant that, although green building practices have been adopted to a certain degree, the extent to which they are implemented is not yet sufficient to firstly, increase sustainability for the future, and secondly, to become part of regular built environment practices. The study was conducted by investigating the views of three major built environment professionals, namely, quantity surveyors, architects and engineers. These professionals were asked to fill in a questionnaire in order to gain insight into their perceived reasons for the lack of green building practices.
Proceedings: 9th Built Environment Conference
2-4 August 2015, Durban, South Africa
ISBN 978-0-620-67120-0
page 159
2. GREEN BUILDING PRINCIPLES Construction process not only meets shelter needs to humans but also involves a process called ‘negotiation’ with nature, which has resulted in a displacement of our natural flora and fauna. Buildings permanently substitute plant life on the earth’s surface with structures, which alone, cannot sustain human and animal life in the long term. World Commission on Environment and Development (1987) defined sustainable development as ‘a development that meets the needs of the present without compromising the ability of future generations to meet their own needs’. Overall, the built environment contributions significantly to environmental degradation. In South Africa, operation of the building sector accounts for 23% of greenhouse gas emissions, while emissions from the manufacture of major building materials for the building sector amounts to 2 approximately 4% of total CO emissions (Gunnell, 2009). The building construction sector has a vital role to play in combating the current threat faced by humankind. In fact, Gunnell (2009) suggests that the building construction sector has the largest potential for reducing greenhouse gas emissions, specifically with energy efficiency. There are seven principles according to Kibert (2008) on which sustainable construction is based which are: Reduce resource consumption; Re-use resources; Use recyclable resources; Protect nature; Eliminate toxic products and bi-products; Apply life cycle costing (LCC); Focus on quality. The challenge facing South Africa like another developing country, is how the provision of national building needs can be attained in a sustainable manner whilst maintaining the life quality and prevailing standard of living (Appelby, 2011). 2.1 The need for the implementation of green building principles The consideration of social, environmental and economic imperatives is commonly referred to as the triple bottom line (Wilkinson and Reed, 2007). It is critical for built environment professionals to understand this concept in order to keep abreast with the industry’s demand pertaining to enhanced environmental performance, in an ethically accountable manner as illustrated in Figure 1 below.
Proceedings: 9th Built Environment Conference
2-4 August 2015, Durban, South Africa
ISBN 978-0-620-67120-0
page 160
Figure 1: The triple bottom line of sustainable development (Wilkinson and Reed, 2007).
This is essential as it serves to be a significant, innovative shift in the methodology which the building industry uses to approach building projects and also trigger the industry awareness that the current building delivery system is not only affecting the environment, but also the way we do business and the industry’s bottom line (Montoya, 2010). 2.1.1 Environmental aspects The world is increasingly aware of the detrimental impacts of pollution on our environment and quality of life. Pollution results in global warming, which is the most pervasive threat to human well-being, and in many respects the most intractable and has been linked to; weather events becoming more severe and unpredictable, increased flooding and drought in different areas, melting ice-caps, rising sea levels, and oceans becoming more acidic (Fitzpatrick, 2011). The prevailing environmental damage cannot easily be rectified; however a recovery process can be initiated. This suggests that if no urgent precautionary measures are implemented, the situation for our future and that of our future generations is dire (Fitzpatrick, 2011). 2.1.2 Economic aspects There exists a misconception that the implementation of green building is very costly when compared to that of conventional construction methods. This perception has therefore become a major barrier to green building implementation making strides in South Africa and other developing countries (Langdon, 2007; Montoya, 2010). It is evident that this barrier could be overcome in various ways, first of which is by changing the approach used for development appraisal. This involves embracing the life cycle costing method on project appraisal. Lifecycle costing (LCC) assesses the cost of a building throughout its useful life, instead of purely focusing on the initial capital development costs.
Proceedings: 9th Built Environment Conference
2-4 August 2015, Durban, South Africa
ISBN 978-0-620-67120-0
page 161
Where green buildings may have a higher initial cost due to their more specialised construction methods and materials, their financial savings are all long term. By performing a LCC for a green building project, its long term savings come into play and may give it the edge over the traditional alternative (Kibert, 2008; Montoya, 2010). Another way is to promote the green building movement awareness. Then once the movement has gained significant popularity amongst building stakeholders, green building technologies will become more affordable (Kibert, 2008; Montoya, 2010; Powell, et al., 2008). This knowledge is critical for builders who want to develop a long-term market share, for evidence suggests that green building practices are here to stay and will soon be considered “best practice” for construction designers in the foreseeable future (Montoya, 2010). 2.1.3 Social aspects Building projects have an effect on the overall community and society they are built in (Appelby, 2011). They define and affect the community spaces where people live and interact. This is to say that buildings create not only a physical environment, but also a social environment. Social sustainability considers and promotes social interactions and cultural enrichment to its occupants and neighbouring communities and stretches as far as the global community (Montoya, 2010). Socially sustainable developments consider, meet and address the basic social needs of people and communities by providing basic needs for food, shelter, education, work and safe living and working conditions (Montoya, 2010). Green building projects generate green construction jobs and skills. Green buildings will result in lower operating costs over the life of a building and therefore, potentially reduce living costs for the occupants (Langdon, 2007). 2.2 The barriers to green building Although the benefits of green building are becoming more recognised and acceptable, there are still barriers which inhibit the adoption of green building efficiency measures (Green building Council of Australia (GBCA), 2008) such as psychological, technical, financial, regulatory, socioeconomic and informational barriers. A) Psychological barriers Hoffman (2008) argued that environmental progress in the construction industry will continue to stall if the significant social and psychological barriers that remains are not addressed. When a construction project begins, participants certainly do not intend to build in an environmentally harmful way. Instead, unrecognised cognitive and social barriers stand between technical and economic solutions, and ultimately the successful adoption of green building methods (Hoffman, 2008).
Proceedings: 9th Built Environment Conference
2-4 August 2015, Durban, South Africa
ISBN 978-0-620-67120-0
page 162
B) Technical barriers Technical and design barriers are one of the main considerations when looking at the feasibility of green buildings. It has been revealed that one of the primary technical issues with the construction of green buildings is the integration of sustainable technologies into small scale developments due to the perception that these technologies are unreliable. There exists a belief that green technologies, when used, are to the detriment of profit, functionality and aesthetics and that there are added service and maintenance responsibilities to owners (Davis and Harvey, 2008). A further design barrier is that contractors are reluctant to deviate from their standard methods of construction (Williams and Dair, 2007). It has been revealed that the lack of green product and material supply chain is a significant barrier challenging designers (GBCA, 2008; Landman, 1999), since stockists are unwilling to stock these products and materials that are perceived to lack demand in the market. C) Financial barriers The cost of alternatives to conventional building methods and materials are important to consider as the general perception is that green building costs are higher than those of conventional buildings (GBCA, 2008). Studies (Landman, 1999; Williams and Dair, 2007) have revealed that this barrier can be attributed to many factors including the following: the unfamiliarity of the design team and contractor with sustainable methods and lack of education on the economic benefits is a contributing factor; developers assumed that anything other than ‘business as usual’ would cost more; that certain products or skills may be unavailable or prohibitively expensive in developing countries. D) Regulatory barriers The government and other institutions play an important role in implementing regulations which will enforce developers to undertake green building practices. A lack of clear leadership has also been identified as a significant barrier (Davis and Harvey, 2008). The regulations should be clear and unambiguous to avoid unintended interpretation to the various role players. There is a lack of regulation regarding fiscal incentives, subsidies and rebates for green building (Davis and Harvey, 2008). E) Socio-economic barriers Adam and Dada (2009), propose that South Africa is in a situation where it is trying to juggle three imperatives to change, namely development, poverty eradication and climate change. It was also asserted that any development progress made without a focus on climate change will only serve to increase greenhouse gas emissions, and that the resulting climate change could have the effect of increasing poverty through droughts, floods and disease.
Proceedings: 9th Built Environment Conference
2-4 August 2015, Durban, South Africa
ISBN 978-0-620-67120-0
page 163
F) Informational barriers While green building is still a relatively new concept in South Africa (Gunnell, 2009). The fact that it is still in its infancy stage gives rise to a lack of knowledge, awareness and understanding surrounding its concepts. Landman (1999); Wilkinson and Reed (2007) and Williams and Dair (2007) all assert that a lack of information and understanding proves to be a major barrier to sustainable construction. A study by Williams and Dair (2007) revealed that stakeholders often lacked the information they needed to make choices about which development options would be more or less sustainable. 3. RESEARCH METHOD This was a quantitative study. Questionnaires were used because of their advantages which include the fact that they are cheap to administer and saves time because a large number of people from a wide geographical area can be sent the questionnaire at one time. The anonymity that questionnaires provide allows for sensitive questions to be asked (Leedy & Ormrod, 2010). A random sample of email addresses of architects, engineers and quantity surveyors were selected from online directories (Association of South African Quantity Surveyors (ASAQS), Consulting Engineers South Africa (CESA) and South African Institute of Architects (SAIA). Architects, engineers and quantity surveyors were chosen due to their knowledge and experience of the built environment. They are also all involved, to varying degrees, with different aspects and phases of construction projects allowing for a more holistic range of perspectives. One hundred and eighty questionnaires were emailed (60 per profession). In the end forty two responses were received, even after numerous reminders to complete the questionnaire. Some of the reasons given for not completing the questionnaire included the fact that they were too busy and they were not involved in to many green building projects. A pilot study was carried out with 5 members from the construction industry. The pilot study was conducted to ensure that the instructions were clear and understandable, that the participants understood their role, to remove ambiguities and to determine the timeframe.
4. RESULTS AND DISCUSSION A total of 19 quantity surveyors, 13 architects and 10 engineers responded to the questionnaire. Of the total number of 42 respondents, 38% indicated that they have received some form of green building training and 62% indicated that they never received any training in green building. Some of the forms of training specified by respondents are as follows; Accredited Green Star Professional Course;
Proceedings: 9th Built Environment Conference
2-4 August 2015, Durban, South Africa
ISBN 978-0-620-67120-0
page 164
Continuous Professional Development Workshop; Green Building Conference; University (stated by the Architects). The above finding indicates that green building training is one of the aspects that could be improved upon. A rate of 62% of respondents claiming to have not received any form of green building training is very high. This is an educational issue which can be combated through the implementation of more green building training programmes, not only in tertiary education institutions, but also for professionals who have received their qualification and are working in the industry. The results showed that 80% of respondents felt that the adoption of green building is very important. This shows that the awareness of the need for green building exists among professionals. Of all the built environment professionals who responded to the survey questionnaire, 76% feel that the architect is most responsible for the promotion of green building principles at the design stage of a project, 12% indicated that the quantity surveyor is most responsible, while 8% felt that the engineer is most responsible. Only 4% of respondents selected the ‘other’ category, which could include the client and/or project manager. The findings indicate that green building awareness is being promoted in a satisfactory manner, considering the 72% positive response rate as to whether respondents have encountered some form of green building awareness campaign or programme. Although the above finding is positive, 28% of respondents indicated that they have never come across such a campaign, which does leave room for improvement in this regard. Some of the campaigns/programmes specified by respondents include; Green Building Council of South African Regulations e.g. SANS; eThekwini Municipality Sustainability Programmes (e.g. Municipality); Green building conferences; Courses, workshops and seminars promoting green building. 4.1 Comparison of factors in their categories Table 1. Comparison of factors as per group Factor Psychological Technical Financial Regulatory Socio-economic Informational
Mean
Rank
3.44 3.32 3.57 3.44 3.30 3.49
3 4 1 3 5 2
Table 1 depicts how the different categories of factors ranked against each other. The categories were rated on a scale of 1 to 5 by the respondents. The highest ranking category, with a score of 3.57, is the financial category.
Proceedings: 9th Built Environment Conference
2-4 August 2015, Durban, South Africa
ISBN 978-0-620-67120-0
page 165
This category includes factors related to the financial aspects of green building. Factors in this category include aspects such as: Cost premiums of green buildings as compared to traditional buildings. Life cycle costing not considered and therefore, the possible long term benefits aren’t realised. Old valuation techniques not rewarding green buildings with higher values than traditional buildings. As this was the highest ranking category, it can be deduced that professionals perceptions about the financial implications of building green is the biggest obstacle to the implementation of green building in South Africa. The financial category was followed closely by the informational category, with a mean score of 3.49. This category includes factors related to a lack of information regarding green building. Such factors include those related to: Lack of understanding of green building principles. Lack of awareness of the benefits of green building. Lack of information on new technologies pertinent to green building. All these factors can be attributed to a lack of education and knowledge of the green building industry. This category also ranks highly as an obstacle to the green building movement. The regulatory and psychological categories each shared a mean score of 3.44 and were the third highest ranking categories in the study. Regulator factors deal with: Lack of governmental/financial incentives for green buildings; Lack of clear legislation requiring green building practices to be implemented in developments. Such factors include a lack of governmental incentives and a lack of clear legislation regarding green building. Psychological factors include any preconceived mental barriers which may play a role in an individual’s unwillingness to consider green building as an option. Such factors include: Resistance by traditional professionals to changes in their practices. The perceived extra work/complications brought about by green building. Perceptions of developers preventing their want/need to investigate the use of green technologies. Finally, the two lowest ranked categories were technical and socioeconomic, with mean scores of 3.32 and 3.30 respectively. The technical
Proceedings: 9th Built Environment Conference
2-4 August 2015, Durban, South Africa
ISBN 978-0-620-67120-0
page 166
category involves any factors relating to issues with green building technologies and materials. Such factors include: Suspicions about the performance and reliability of new, untested green technologies. Lack of supply of affordable green technologies. The socio-economic category includes any factors related to social or economic issues which contribute to inhibiting green building implementation. Such factors include: Lack of environmental concern. Other issues in the country carry more importance than that of environmental concern/green building. 4.2 Comparison of individual factors Table 2. Most significant factors Factor Cot premiums of green building as compared to traditional buildings Lack of clear legislation requiring green building practices to be implemented in buildings Lifecycle costing not considered and therefore, the possible long term benefits of green building are not realised Resistance by traditional professionals to changes in their practices Lack of information on new technologies pertinent to green building
Mean
Rank
4.12
1
3.72
2
3.64
3
3.60 3.60
4 5
Table 2 indicates the top 5 factors inhibiting the adoption of green building in South Africa according to respondents of the survey. The factor which was rated most significant is ‘Cost premiums of green buildings as opposed to traditional buildings’ with a mean value of 4.12. The second highest ranked factor was found to be ‘Lack of clear legislation requiring green building practices to be implemented in developments’. The factor ‘Life cycle costing not considered and therefore, the possible long term benefits of green building aren’t realised’ was the third highest ranked factor. The fourth and fifth highest rated factors were ‘Resistance by traditional professionals to changes in their practices’ and ‘Lack of information on new technologies pertinent to green building’ respectively. Of these top 5 ranked factors, two fell into the category of financial factors, and one each under the psychological, regulatory and informational categories. Table 3. Least significant factors Factor Old valuation techniques not rewarding green buildings with higher values than that of traditional buildings Suspicions about performance and reliability of new, untested green technology Lack of governmental/financial incentives for green buildings The perceived extra work/complications brought about in green building Other issues in South Africa carry more importance than that of environmental concern/green building
Proceedings: 9th Built Environment Conference
2-4 August 2015, Durban, South Africa
Mean
Rank
2.96
15
3.08
14
3.16
13
3.20
12
3.24
11
ISBN 978-0-620-67120-0
page 167
Table 3 shows the 5 least significant factors inhibiting the adoption of green building. The factor with the lowest rating was ‘Old valuation techniques not rewarding green buildings with higher values than that of traditional buildings’. The questionnaire provided respondents with an opportunity to supply some qualitative data, to add any other factors they felt were relevant to the study. Most of the respondents did not make use of that opportunity, however a certain portion did. Some of these comments received are outlined below: It was noted that built environment professionals capacity on environmental issues is an important factor, and further suggested that it could be improved through the implementation of educational programmes. It was also suggested that tertiary education programmes, and legislation or planning requirements to enforce compliance with green building specification would help to increase its uptake. High green building rating and registration costs was identified as another factor which is discouraging clients from going for green building designs. Clients’ lack of awareness was raised as another issue of concern that needs to be addressed. Clients do not want to spend more on a project and do not appreciate the whole-life benefits of green building implementation. They need to understand the trade-off between higher initial costs versus the lower life costs of green buildings. It was also perceived that South Africa is not aware of how critical green building implementation is. The above indicates that a lack of awareness, and suspicions about the higher cost associated with green building are major factors. 5. CONCLUSION The purpose of this research was to investigate the primary factors contributing to the low implementation of green building in South Africa, as perceived by architects, quantity surveyors and engineers. The research findings indicate that the cost premium associated with green building is the primary factor contributing to the low implementation of green building practices. One of the most effective ways of decreasing the significance of the abovementioned factor would be the large scale implementation of life cycle costing in building projects. It is recommended that education is the key to overcoming the factors inhibiting the widespread implementation of green building. Only through knowledge of the benefits of green building, and an awareness of the harmful impacts of current methods, can the concept of sustainability be brought to the attention of the construction industry. Education would have positive effects for the green building movement by equipping
Proceedings: 9th Built Environment Conference
2-4 August 2015, Durban, South Africa
ISBN 978-0-620-67120-0
page 168
professionals, not only with an understanding of the effects of green building, but also in being able to implement strategies geared toward sustainable development. 6. REFERENCES Adam, F. and Dada, R., 2009, Climate Change, Development and Energy Problems in South Africa: Another World is Possible, Earthlife Africa Johannesburg and Oxfam International, South Africa. Appleby, P., 2011, Integrated Sustainable Design of Buildings, Earthscan, London Washington DC. Davis, I. and Harvey, V., 2008, Zero Carbon: What Does it Mean to Homeowners and Housebuilders? NHBC Foundation, United Kingdom. Fitzpatrick, T., 2011, Understanding the Environmental and Social Policy. The Policy Press and the Social Policy Association. Green building council of Australia (GBCA), 2008, The dollars and sense of green buildings: Building the business case for green buildings in Australia, Green building council of Australia, Australia. Available at: www.gbca.org.au [Accessed September 6, 2014] Gunnell, K., 2009, Green building in South Africa: Emerging trends. Available at: http://soer.deat.gov.za/dm_documents/Green_Building_ in South_Africa_Emerging_Trends_GyzKE.pdf [Accessed January 27, 2015]. Hoffman, A., 2008, Overcoming the social and psychological barriers to green building. Sage Publications. University of Michigan. Kibert, C.J., 2008, Sustainable construction: Green building design and delivery. 2nd Edition. John Wiley & Sons, New Jersey, USA. Landman, M., 1999, Breaking through the barriers to sustainable building: Insights from building professionals on government initiatives to promote environmentally sound practices. TUFTS. Langdon, D., 2007,Cost of Green Revisited: Re-examining the Feasibility and Cost Impact of Sustainable Design in the Light of Increased Market Adoption. Davis Langdon, United States of America. Leedy, P.D. and Ormrod, J.E., 2010, Practical Research: Planning and Design (9th Ed.). Upper Saddle River, New Jersey: Pearson Education Inc. Montoya, M., 2010, Building Fundamentals: Practical Guide to Understanding and Applying Fundamental to the Construction Practices nd and the Leed System. 2 Edition. Pearson Education, Inc. Powell, Parkin and Mathews, 2008, Economics. 7th edition. Pearson Education, Inc. Wilkinson, S.J., Reed, R.G., 2007, The Structural and behavioural barriers to sustainable real estate development, ARES Conference. Williams and Dair, 2007, what is stopping sustainable building in England? Barriers experienced by stakeholders in delivering sustainable development. Wiley, Oxford Brookes University, UK. World Commission on Environment and Development (WCED), 1987, Our Common Future, Oxford University Press, London: Oxford.
Proceedings: 9th Built Environment Conference
2-4 August 2015, Durban, South Africa
ISBN 978-0-620-67120-0
page 169
ASOCSA2014- 058
Cost and Benefits Analysis of Sustainable Building Production in Western Cape Province, South Africa. Julius A. Fapohunda1, Annelise Nicholson2, Bukola H. Solanke3, Bashir O. Ganiyu4. *Correspondence author contacts:
[email protected] 1234 Department of Construction Management and Quantity Surveying, Cape Peninsular University of Technology, Cape Town South Africa. ABSTRACT AND KEYWORDS PURPOSE OF THIS PAPER The increasing demand for shelter in the developing world is alarming. The provision of these facilities involves intense construction activities. Although construction activities in the past decades have been observed to impact the environment adversely, researchers opined that the adoption of sustainable buildings will significantly reduce the impacts of construction activities on the environment. Conversely, the high cost of total production has been a barrier to sustainable building adoption. Hence, this paper is set to ascertain the cost benefits of sustainable building production DESIGN/METHODOLOGY/APPROACH This paper evaluates the perceptions of construction stakeholders (contractors. consultants and clients) on the cost and benefits of sustainable buildings using a questionnaire survey. Quantitative data collected were analysed using descriptive statistical techniques. FINDINGS Findings from the analysis shows that the concepts and benefits of sustainable building production are familiar ideologies in the construction industry. In addition, the evaluation disclosed that achieving the benefits of sustainable buildings depends on the collaborative effort of the construction stakeholders and government towards construction materials cost reduction during construction.
Proceedings: 9th Built Environment Conference
2-4 August 2015, Durban, South Africa
ISBN 978-0-620-67120-0
page 170
RESEARCH LIMITATIONS/IMPLICATIONS This paper provides empirical findings to the conference sub-theme on sustainable green building thus promoting sustainable construction education. WHAT IS ORIGINAL/VALUE OF PAPER This paper has recognised that the costs of materials for construction and procurement processes are core contributors to the high cost of producing sustainable buildings. The results can be useful to all construction stakeholders to enhance the adoption of sustainable buildings with the cost and benefits of production in perception. These combined efforts encourage stakeholders’ participation in the production of sustainable building to reduce the environmental impacts of construction and improve social-economic statues of the population. Keywords: Building production, Construction cost, Construction materials, Construction stakeholders, Sustainable building. 1.0: INTRODUCTION Construction industries in developing countries have over the years intensify its pursuit to provide comfortable, affordable and sustainable structures. This is to satisfy the increasing demand for housing and infrastructure. Notably, the negative environmental impacts of these construction activities have increasingly become a concern in the construction industry towards sustainable development. In the quest to reduce these impacts, the concept of sustainable building production emerged in the late 1980’s by the United Nation’s World Commission on Environment and Development (WCED). In the past few decades, sustainability has been defined by various researches and writers in different ways. Although, literatures reveal that sustainable development was first defined by WCED (1987) in the “Brundtland report” as ‘the ability to meet the present needs without compromising the ability of the future generations to meet their own needs’. Consequently, the essence of sustainability in every aspect of the human life (economic, social & environmental) cannot be over emphasized as every choice and actions made in the present affects the future. Several researchers notably (Azis et al., 2012; Lindahl et al., 2014; Singhaputtangkul et al., 2014; Gan et al., 2015) have carried out studies in the area of sustainability and sustainable building production. Worthy of note, these studies and reviews indicates that sustainability has been a focus of study amongst researchers, with the most studies emphasising on how best to produce and deliver sustainable buildings (Khalfan et al., 2011; Gan et al., 2015; Yudelson, 2009). Relatively, these studies were focused on sustainable building production in the context of design, decision making and stakeholder’s perspectives during construction. Comparatively,
Proceedings: 9th Built Environment Conference
2-4 August 2015, Durban, South Africa
ISBN 978-0-620-67120-0
page 171
few articles have investigated on the cost benefits of sustainable building (Kats, 2013), which poses as a major concern amongst contactors who perceive sustainable buildings as outrageously expensive. This research aims at addressing this gap by conducting a study on the cost benefit of producing sustainable buildings in the Western cape of South Africa. In modern construction techniques, buildings that significantly consume less energy and water with reduced environmental impact than traditional conventional buildings have been termed as sustainable buildings (SP). Therefore, sustainable buildings according to Yudelson (2010) are buildings designed and constructed to reduce negative environmental impacts and improve the health of the habitat with the significant use of minimum water and energy. Consequently, Kubba (2012) describes sustainable buildings as structures designed, built, renovated, operated, or reused in an ecological and resource-efficient manner to meet the objectives of enhancing the health status of the occupants and efficient utilization of materials, water and other resources. Thus, this paper is set to ascertain the cost benefits of sustainable building production to encourage the adoption of the concept of sustainable construction in the industry.
2.0: OVERVIEW OF SUSTAINABLE BUILDING DEVELOPMENT 2.1: Sustainable construction The term ‘sustainable construction’ is often interchanged with the term ‘sustainable. According to Kibert, and Kibert, (2008), the term ‘Sustainable construction’ embodies issues related to the ecological, economic and social aspects of a building. Conversely, Kibert (2012) further stressed that sustainable construction is the process of creating and operating a health facility based on ecologically designed building plans and resource efficiency while sustainable buildings are the end products of applying this processes throughout the lifecycle of the building. Sustainability in building production is a subset of sustainable development aimed at restoring or maintaining a balance between built environment and the eco-system to create a settlement that promotes economic and social equity. Kibert (2012) in Figure 2.1 illustrates the framework for sustainable construction which is applicable throughout the construction phase of a building. Accordingly, Vatalis et al., (2013), highlighted that the principles of sustainable construction is attainable where the construction resources are efficiently utilized and planned for at every phase of construction. Abeysundara et al., (2009) buttressed further that the construction resources, especially materials should be selected in line with the principles of sustainability as it is essential to note that buildings are characterised by the materials used in its construction. Thus, the adoption
Proceedings: 9th Built Environment Conference
2-4 August 2015, Durban, South Africa
ISBN 978-0-620-67120-0
page 172
of sustainable construction principles effectively reduces the negative impacts of conventional construction. Phase Deconstruction Modification Maintenance Use & Operation Construction Design Development Planning Land
1. Reduce
Resources Materials Water Energy Ecosystems
2. Reuse 3. Recycle 4. Protect Nature 5. Eliminate Toxics 6. Life‐Cycle Costing 7. Quality Principles
Fig. 1: Framework for sustainable construction (adapted from Kibert, 2012)
2.2: Barriers and Challenges of Sustainable building production The construction industry has been faces with theoretical and practical issue that have lingered over the years as a result of rapid growth in construction projects. Doubtless, the rapid growth of construction activities in a particular jurisdiction has delivered social necessities as well as contributing significantly to the economic growth of that territory (Azis et al., 2012). On the contrary, the process of constructing these facilities deters adverse environmental impacts, excessive resource wastes and budget overrun as a result of project schedule delays (Azis et al., 2012). As a result, authors notably (the Construction Industry Development Board: CIDB, 2002; Häkkinen, & Belloni, 2011) identified the following as barriers to attaining sustainable buildings in South Africa as a developing country:
Proceedings: 9th Built Environment Conference
2-4 August 2015, Durban, South Africa
ISBN 978-0-620-67120-0
page 173
Lack of capacity of construction sector to implement sustainable principles Poverty, high demographic growth and low urban investment Declining government investment in construction Lack of interest in sustainability issues among stakeholders Resistance to new technology Lack of effective enforcement on existing sustainability rules. Unforeseen high cost of production Lack of client understanding on the components of sustainability. 2.3
Significance of sustainable building production
Sustainable buildings basically built to create a balance between the social, economic and environmental statues of humans. As established earlier, the rapid growth of urbanization in developing countries such as South Africa has initiated an unprecedented opportunity for the provision of sustainable buildings by the government (Gan et al., 2015). Du Plessis, (2007) highlighted that the conception of sustainable building production over the years has also afforded developing countries stable solutions to the challenges of urbanization through the production of adequate, safe, sufficient housing and social infrastructure for the populace. As a result, the social-economic and ecological development experienced by these countries enhances the eradication of poverty and deteriorating health conditions in that territory (Golubchikov & Badyina, 2012). GBCSA, (2010) have noted global warming, along with rising temperatures and sea levels, severe climate events and the extinction of various species are also other persistent threats to our planet and according to experts we have ten years to reduce gas emissions or face the consequences. The CIDB (2009) reported that the operation of the building sector in South Africa accounts for 23% of greenhouse gas emissions, while emissions from the manufacture of the major materials for the building sector amounts to around 18mt CO2 per year, or around 4% of total CO2 emissions. This challenge can be brought under control by the implementation of sustainable principles at the planning and materials selection stage. 2.4
Benefits of sustainable building production
In a research study, the World Green Building Council (WGBC, 2013) reported that sustainability in building production have compelling benefits over the traditional or conventionally built structures. However, the benefits which included environmental, social and economic benefits seemed incomplete without the financial benefits, raised a controversial questionable issues amongst stakeholders in the industry. In an effort to
Proceedings: 9th Built Environment Conference
2-4 August 2015, Durban, South Africa
ISBN 978-0-620-67120-0
page 174
answer this controversial question, WGBC (2013), catalogued the following as benefits of sustainable buildings:
Table 1: Benefits of sustainable building
Environmental benefits
Social benefits
Economic benefits
Enhancing and protecting biodiversity and ecosystems
Enhance occupant health and comfort
Reduce operating costs
Improving air and water quality
Improve indoor air quality
Improve occupant productivity
Reducing waste streams
Minimize strain on local utility infrastructure
Enhance asset value and profits
Conserving and restoring natural resources
Improve overall quality of life
Optimize life-cycle economic performance
Financial benefits Financially, sustainable buildings afford investors benefits that the traditional buildings cannot offer. The financial benefits of sustainable buildings to building owners, private investors, government investors or the population at large includes: provision of employment during construction, greater employee comfort/productivity, reduced employee health costs, energy and water savings, reduced waste, improved indoor environmental quality and lower operations and maintenance costs. In summary, Azis et al (2012) and Gan, et al. (2015) buttressed that the adoption of sustainable principles in building production could either be long-term or intangible summed-up as follows: i). Reduced planning risk. ii) Reduction of building operation and maintenance cost during the building service span. iii) Enhancement of environmental performance. iv). Construction waste minimization. v) Provision of healthier working and living environments. vi). Enhances the efficient process of materials procurement with extended building lifespan .vii). Enhance asset value and profits. 2.5: Cost of producing sustainable buildings Kats (2003) argues that there has been a common perception in the realestate industry that the cost of green building is considerably more than a traditional method of development. Allegedly, the biggest barrier to the adoption of sustainable building principles is the perception that it cost more than conventional building (Kubba, 2012). In order to effectively attain sustainability in the production of buildings and social infrastructures,
Proceedings: 9th Built Environment Conference
2-4 August 2015, Durban, South Africa
ISBN 978-0-620-67120-0
page 175
Kubba (2012) bolstered that the following factors should be considered for implementation throughout the construction phase of the building: Setting clear cost values at the design stage. i.e. defining cost management rubrics. Implement the principles of sustainability at the materials selection phase to avert construction waste. Create awareness on the benefit sustainable building in by industry through seminars, workshops and practical integration in projects. Integrating government policies and regulations as an effective approach to enforcing economic, environmental, social and economically friendly construction activities. 3.0: METHODOLOGY AND RESULTS OF DATA ANALYSIS A preliminary literature search was carried out to investigate the perception of the construction industry professionals regarding the cost benefits of producing sustainable building. From the information derived from the reviewed literatures, a well-structured questionnaire was developed and distributed amongst a randomly selected sample consisting of quantity surveyors, architects, engineers, developers and contractors operating in the Western Cape Province of South Africa. The questionnaire was distributed via E-mail to reputable companies which included a covering letter of invitation to participate in the study. From the total of fifty (50) questionnaires distributed, 32 (64%) questionnaires were completed and retrieved. Questionnaires were completed anonymously to ensure a true reflection of the respondents’ opinions and to meet the ethical criterion of confidentiality. It is therefore assumed that the respondents were sincere in their responses. The data collected were analysed with SPSS statistical software. Descriptive statistics was used to describe and summarise the data. Frequency analysis technique was used to for analysis in this study. 3.1: Background information of respondents 3.1.1: Professional affiliation of respondents The respondent demography was included in the survey so as to review the proficiencies of the respondents in appraising issues relating to the cost-benefit of sustainable buildings. The first demography, Figure 2, illustrates the organisation of respondents. It was derived that majority of the respondents were Quantity surveyors, 28%, followed by Architects, 22%, Engineers, 19%, Contractors, 19%, Developers, 9%, and the lowest were denoted as others, 3%. As a result, Quantity Surveyors played a vital and influential role in this study.
Proceedings: 9th Built Environment Conference
2-4 August 2015, Durban, South Africa
ISBN 978-0-620-67120-0
page 176
Figure 2: Professional affiliation of the respondents
3.1.2: Years of working experience The working experience of the respondents in the construction industry was evaluated as well. It was discovered that two sets 25% of the respondents have the working experience of 0-5 years and 6-10 years respectively, followed by 22% having over 22years working experience, 16% of 16-20 years of experience and 12% of 11-15year work experience as illustrated in Figure 3. The chat (fig 3) indicates that 75% of the respondents have between 6 - over 20 years of work experience. This implies that majority of the respondents have the adequate knowledge on the concerns of the industry on the cost-benefits of sustainable buildings production.
Figure 3: Working experience of respondents in construction
3.1.3: Respondents educational qualification The highest qualification attained by the respondents as shown in figure 4, indicates that 69% of the respondents obtained Bachelor degrees, followed
Proceedings: 9th Built Environment Conference
2-4 August 2015, Durban, South Africa
ISBN 978-0-620-67120-0
page 177
by 19% of the respondents who are Diploma holders. The Masters’ degree holders occupied the third largest position of 6%. The smallest percentages of respondents were Matric certificate and other qualification holders with 3% each. This indicates that the majority of the respondents obtained at least a Bachelors’ degree, 75%. Hence, it could be deduced that the all the respondents were satisfactorily educated.
Figure 4: Highest qualification of qualification
3.2: Sustainable construction experience The respondents were evaluated on the frequency of their participation in the adopting sustainable principles in construction. The responses are presented in Table 1. Table 1 reveals that majority of the respondents, 65% “rarely” participate in sustainable construction. However, 22% of respondents indicated that they “often” participate in sustainable construction, followed by 9% indicating that they participate in sustainable construction “very often”.
Proceedings: 9th Built Environment Conference
2-4 August 2015, Durban, South Africa
ISBN 978-0-620-67120-0
page 178
Table 2 Frequency of Participation in the adoption of sustainable principle in construction Frequency and numerical counts of participants Not Very at Rarely Often Total often all Profession
Quantity Surveyor
Architect
Engineer
Developer
Contractor
Other
Total
Count % within profession Count % within profession Count % within profession Count % within profession Count % within profession Count % within profession Count % within profession
0
7
0
2
9
0
77.8
0
22.2
100
1
5
1
0
7
14.3
71.4
14.3
0
100
0
2
4
0
6
0
33.3
66.7
0
100
0
1
1
1
3
0
33.3
33.3
33.3
100
0
5
1
0
6
0
83.3
16.7
0
100
0
1
0
0
1
0
100
0
0
100
1
21
7
3
32
3.1
65.6
21.9
9.4
100
3.3: Cost-benefits of Sustainable Buildings 3.3.1: Benefits of sustainable buildings The questionnaire survey explored respondents’ perception of the perceived benefits of sustainable building. A summary of the responses is presented in Table 2 The table shows that majority, 63% of the respondent strongly agreed that they are assured of savings in energy and water as a result of sustainable building, followed by 34% that “Agree”, then 3% “Disagree”. This benefit was ranked 1st... The analysis of other beneficial factors are as follows.
Proceedings: 9th Built Environment Conference
2-4 August 2015, Durban, South Africa
ISBN 978-0-620-67120-0
page 179
Table 3: Benefits of Sustainable buildings Questions Higher building value
Higher return on investment
Increase in employee productivity
Enhanced occupant comfort and health
Energy and water savings
Reduced waste
Frequency Disagree Agree Strongly Agree Total
1 17 14 32
Disagree
5
Agree Strongly Agree Total
17 10 32
Disagree
5
Agree Strongly Agree Total
13 14 32
Disagree
4
Agree Strongly Agree Total Disagree Agree Strongly Agree Total Disagree Agree Strongly Agree Total
13 15 32 1 11 20 32 2 14 16 32
Mean value 3.406
Rank 3
3.156
6
3.281
5
3.344
4
3.594
1
3.438
2
3.3.2: Cost of sustainable buildings The questionnaire focused on evaluating the perspectives of respondents on the cost of producing and maintaining sustainable buildings. This evaluation was based on the derived information that 65% of the respondents are conversant with the concept of sustainable construction. Table 3 clarifies that majority of the respondents “Strongly agreed and “agreed”, 46% respectively, with 6% of the respondents “disagreed” that initial cost of sustainable building construction are higher than the cost of conventional building. The respondents were also asked of their perspective on the decrease of operation cost based on the use of sustainable and cumulatively 87.5% of the respondent “agreed” and “strongly agreed” with only 12.5% disagreeing to this factor. Finally, A total of 68.7% of the respondents indicated that they “agree” and “strongly agree” that sustainable building design decreases maintenance cost, while 3.6% and 25% “disagree” and “strongly disagree”, respectively.
Proceedings: 9th Built Environment Conference
2-4 August 2015, Durban, South Africa
ISBN 978-0-620-67120-0
page 180
Table 4: Cost of sustainable building Question Initial costs of sustainable building construction are higher than cost of conventional building
Frequency Disagree
2
Agree Strongly agree Total
15
Disagree
4
Agree Strongly agree Total
20
decreases maintenance costs
3.406 1
32
decreases operation costs
Strongly disagree Disagree Agree Strongly agree Total
Rank
15
Sustainable building design
Sustainable building design
Mean value
3.125 2
8 32 2 8 17
2.781 3
5 32
4.0: DISCUSSION OF RESULTS The results from the study reveal the 5 factors as indicated by the Built Environment stakeholder as the perceived benefits of sustainable building in ranking order as: energy and water savings, reduced waste, higher building value, followed by enhanced occupant comfort and health, resulting in an increase in employee productivity. A study done by Katz in 2003, confirm these findings. The results also reveal that majority of the respondents (96%) are in agreement that sustainable building construction cost more initially compared to that of conventional building, The majority also agree that sustainable building design decrease the operation and maintenance costs which is a cost benefit and are confirmed by the literatures reviewed. From the findings, it is interesting to note that despite the level of stakeholders’ awareness on the benefits of sustainable building production, majority of construction professionals do not implement the principles of sustainable construction in their projects. 5.0: CONCLUSION. The findings of this exploratory study has enhanced in identifying the longterm cost-benefits of producing sustainable building in developing countries. The most significant benefits of sustainable buildings are reduced construction waste, reduced operational and maintenance cost,
Proceedings: 9th Built Environment Conference
2-4 August 2015, Durban, South Africa
ISBN 978-0-620-67120-0
page 181
energy and water saving, higher building value, enhanced occupant comfort and health, resulting in an increase in employee productivity. Hence, these findings will give a better understanding to construction stakeholders, most especially the clients, who play an influential role in adopting the practice of sustainable buildings production in the construction industry for future construction projects. REFERENCES Abeysundara, U. Y., Babel, S., and Gheewala, S. (2009). A matrix in life cycle perspective for selecting sustainable materials for buildings in Sri Lanka.Building and environment, 44(5), 997-1004. Azis, A. A. A., Memon, A. H., Rahman, I. A., Nagapan, S., & Latif, Q. B. A. I. (2012). Challenges faced by construction industry in accomplishing sustainablity goals. In Business, Engineering and Industrial Applications (ISBEIA), 2012 IEEE Symposium. pp. 630-634 CIDB and UNEP-IETC. (2002). Agenda 21 for Sustainable Construction in Developing Countries A discussion document. http://www.cidb.org.za/ publications/ext_pubs_a21_sustainable_construction.pdf CIDB. (2009), Greenhouse Gas Emission Baselines and Reduction Potentials from Buildings in South Africa. Available online: http://www.unep.org/sbci/pdfs/SBCI-SAreport.pdf [Accessed 9th June, 2014] Du Plessis, C. (2007). A strategic framework for sustainable construction in developing countries Construction Management and Economics, 25. 67– 76. Gan, X., Zuo, J., Ye, K., Skitmore, M., and Xiong, B. (2015). Why sustainable construction? Why not? An owner's perspective. Habitat International, 47, 61-68. GBCSA. 2010. What is a green building? Available Online: http://www.gbcsa.org.za/about/about.php [Accessed: 17 May 2010]. Golubchikov and Badyina, (2012). Sustainable housing for sustainable cities: A policy framework for developing countries UN-HABITAT, Nairobi, Kenya. Häkkinen, T., and Belloni, K. (2011). Barriers and drivers for sustainable building. Building Research & Information, 39(3), 239-255. Kats, G. (2003). Benefits of green buildings: A report to California’s sustainable building task force. [Online] Available on: http://www.usgbc.org/Docs/News/News477. (Accessed 12 March 2104). Khalfan, M., Maqsood, T., and Noor, M. (2011). Attitude towards sustainable construction amongst construction contractors. Built Environment Journal, 8(2), 9-21. Kibert, C. J. (2012). Sustainable Construction: Green Building Design and Delivery: Green Building Design and Delivery. John Wiley & Sons.
Proceedings: 9th Built Environment Conference
2-4 August 2015, Durban, South Africa
ISBN 978-0-620-67120-0
page 182
Kibert, N. C., and Kibert, C. J. (2008). Sustainable Development and the US Green Building Movement-Profitable Development Projects Can Be Good for the Planet, Too. Prob. & Prop., 22, 21. Kubba, S. 2012. Handbook of Green Building Design and Construction: LEED, BREEAM and Green Globes. Oxford: Elsevier. Lindahl, P., Robèrt, K. H., Ny, H., and Broman, G. (2014). Strategic sustainability considerations in materials management. Journal of Cleaner Production, 64, 98-103. Singhaputtangkul, N., Low, S. P., Teo, A. L., and Hwang, B. G. (2014). Analysis of criteria for decision making to achieve sustainability and buildability in building envelope design. Architectural Science Review, 57(1), 20-30. Vatalis, K. I., Manoliadis, O., Charalampides, G., Platias, S., and Savvidis, S. (2013). Sustainability components affecting decisions for green building Projects. Procedia Economics and Finance, 5, 747-756. WCED: World Commission on Environment and Development. 1987. Our Common Future. Oxford: Oxford University Press: 1-300. World Green Building Council (WGBC). (2013). Financial value of Green Buildings to Business Communities. Available online: https://www.gbcsa.org.za/news_post/world-green-building-councilshowcases-cost-effective-green-building-benefits-throughout-the-world/ th [Accessed 28 November, 2014]. Yudelson, J. (2009). Green Building through Integrated Design. United States of America: The McGraw-Hill Companies Inc.
Proceedings: 9th Built Environment Conference
2-4 August 2015, Durban, South Africa
ISBN 978-0-620-67120-0
page 183
ASOCSA2015- 60
Challenges in implementing sustainable building practices in the residential sector Brightman Smiso Ngcobo 1 and Nishani Harinarain2 1
[email protected], 2
[email protected] 1,2
Property Development Programme, School of Engineering, College of Argiculture, Engineering & Science. University of KwaZulu-Natal, King George V Avenue, Durban,4041, South Africa. Tel.: +27312602687 ABSTRACT AND KEYWORDS Purpose of this paper Residential sustainable building practices do not only apply to new environmentally orientated construction designs but also new environmental friendly operation and maintenance procedures. The purpose of this paper is to identify the challenges that prevent sustainable building practices in the residential sector in KwaZulu-Natal (KZN). Design/methodology/approach This was a qualitative study and forms the first part of a national study. Data were collected by means of ten telephonic interviews with residential contractors that were purposefully selected. The focus groups consisted of five participants each and were purposively selected. Research Limitations/implications This paper forms the first part of a bigger study and therefore a small sample was selected. Therefore the results of this study are indicative of the condition in KZN and cannot be generalized to the rest of South Africa. Findings Issues that affect the sustainable building practices in residential sector such as high costs of sustainable building materials and lack of education in sustainable building methods are key factors that builders identified as hindrance in achieving sustainability in residential sector. Careful selection of environmental sustainable building materials by architects is the easiest way for architects to start incorporating sustainable design principles in residential buildings. The contractors believe that ultimately it is the client who is responsible for sustainable residential building practices as they are the ones paying for it.
Proceedings: 9th Built Environment Conference
2-4 August 2015, Durban, South Africa
ISBN 978-0-620-67120-0
page 184
Practical implications This study will be used as the foundation on which a comprehensive national study into sustainable residential building practices will be performed. Originality/value of the paper With the emphasis now been placed on sustainable contraction and green buildings, very few studies have focused on the residential sector. This paper highlights the challenges experienced by residential contractors in implementing sustainable practices. Keywords: sustainability, residential building, contractors, sustainable design. 1. INTRODUCTION Sustainable building practices are practices that aim to reduce resource inputs such as energy, water, materials and waste outputs while at the same time improving the liveability of citizens (Horne and Hayles, 2008). The ecological damage that transgresses from harvesting natural resources and their conversion into building materials includes loss of wildlife habitat, erosion, water and air pollution (Kim and Rigdon, 1998). People are in a relationship with the natural world and the two are acutely interdependent in addressing the complex problem of construction and the environmental efforts towards sustainable construction and it is therefore important to put in place practices that restore the balance between the two (Du Plessis, 2002). Residential sustainable building practices do not only apply to new environmentally orientated construction designs but also new environmental friendly operation and maintenance procedures (Du Plessis, 2002). Not only should construction materials and components be produced in a sustainable way but their use must also answer to environmental requirements (ibid). Residential building construction has an important role to play in sustainable development, because constructed houses has a great influence on life quality, comfort, security and health (Zabihi, Habib and Mirsaeedie, 2012). By creating an airtight envelope, home owners can lower heating and cooling costs by over 50% or more (Schmidt, 2008). Kim and Rigdon (1998) argue that sustainable residential building practices include the in-situ mixing of concrete to reduce the amount of concrete waste that is discharged to landfills. Sourcing locally produced materials also reduces carbon emissions hence using locally produced bricks/blocks and other materials are encouraged in the residential building sector to improve sustainability. Re-using building materials, broken bricks or blocks for filling in required sections can also reduce waste that is taken to dumping sites (ibid).
Proceedings: 9th Built Environment Conference
2-4 August 2015, Durban, South Africa
ISBN 978-0-620-67120-0
page 185
The purpose of this paper is therefore to identify the challenges that prevent sustainable building practices in the residential sector in KwaZuluNatal (KZN). 2. SUSTAINABLE BUILDING To sustain means to support, to keep alive and to keep going. Sustainable construction is an integrated process aiming to restore the balance in the natural and the built environment and create settlements that affirm human dignity and encourage economic equity (CSIR, 2001). There are direct benefits in sustainable building methods which include economies in fuel bills, market advantage and lower long term exposure to environmental or health problems (Edwards, 2003). The risks that are associated with these direct benefits include issues such as the building performance, the cost of green building and the reliability of technology (ibid). Winston and Eastway (2007) claim that the Agenda 21 protocol produced a global action plan for sustainable development. The Agenda 21 is a charter of 27 basic principles covering rights and responsibilities of states and their citizens. Some of the identified areas include the promotion of sustainable land use planning management, promoting sustainable energy use and transport systems in human settlements and promoting sustainable construction industry activities, but it is a non-binding agreement. Halliday (2008) argues that the overriding assumption is that sustainable building practices costs more or is less profitable but there is pressure to work towards a more sustainable construction industry with a better processes and products. There has been a growing trend in recognising waste minimisation and energy efficiency as good practice for sustainability while healthy housing, affordable warmth and clean air are recognised as aspects of social justice that should be available to all. Schmidt (2009) highlights that if savings from energy conservation are greater than the increase in the monthly costs of the mortgage or construction loan, the homeowner is literally making money month after month, energy conservation is not a cost it’s an investment that only gets more valuable over time. Benefits of sustainable building practices include: Reduced operating costs; Reduced waste; Reduced liability in municipal expenses and running cost; and Enhanced productivity (Halliday, 2008). 2.1 Sustainable Building Materials Careful selection of sustainable building materials by the architects is the easiest way for architects to start incorporating sustainable design principles in buildings. But in most cases the price of sustainable building materials are a concern when considering sustainable building practices
Proceedings: 9th Built Environment Conference
2-4 August 2015, Durban, South Africa
ISBN 978-0-620-67120-0
page 186
compared to the similar alternative materials (Kim and Rigdon, 1998). There is a need to pay attention to the use of modern building materials with reference to energy intensiveness of materials, natural resources and raw materials consumed, recycling and disposal and the impact on environment (Reddy, 2009). Stabilised mud blocks, compacted fly ash blocks, rammed earth walls and low intensive roofing systems are some measures that the builders can undertake to achieve sustainable building homes (ibid). Kim and Rigdon (1998) believe that there are three phases of building materials that relate to sustainable building practices, these are prebuilding phase, building phase and post building phase. The pre-building phase describes the production and delivery process of a material up to but not including the point of installation. This has to do with discovering new materials in nature as well as extracting, manufacturing, packaging and transportation to a building site. The pre-building phase has the most potential for causing damage to the environment. Understanding the environmental impacts in the pre building phase will lead to a wide selection of building materials by the architects (ibid). The architects need to be aware of the raw materials procurement, methods of manufacturing process and the distance from the manufacturing location to the actual residential construction site. The extraction of raw materials whether from finite or renewable sources is a severe ecological damage which can impact negatively with the environment. It is not easy to meet the ever growing demand for buildings by adopting only energy efficient traditional materials like mud, thatch and timber hence more innovative methods are needed (Reddy, 2009). The building phase refers to a materials useful life, this phase begins with materials assembly into a structure and it includes the repair and maintenance of materials and it extends throughout the life cycle of the material within or as part of the building (Kim and Rigdon, 2008). In the post building phase material usefulness after the building has expired is a key concern as it involves the material re-usability and materials being converted to other products (ibid). The innovation of new building materials and the reduced reliance on energy intensive materials such as cement, steel, aggregates and aluminium can make a huge difference to the global environment (Du Plessis, 2002). Sustainability as a concept has just been introduced to developing countries and is not yet regarded as a priority whereas the major challenge for sustainable construction would be to get sustainability to the agenda of the construction industry. Schmidt (2009) argues that in residential homes harvesting rainwater for irrigation and other non-drinking purposes is a must in order to achieve sustainable homes. Tank less water heaters are also an option as they produce warm water as required, low pile and natural fibre carpets are presumed good as they trap fewer allergens, porous pavements and un-compacted gravel, crushed stone and open paving blocks reduce or eliminate runoff and allows water to filter in to the ground. It is therefore important to understand why contractors are not implementing sustainable practices in the residential sector.
Proceedings: 9th Built Environment Conference
2-4 August 2015, Durban, South Africa
ISBN 978-0-620-67120-0
page 187
3. RESEARCH METHOD This was a qualitative study that focused on the challenges experienced by residential building contractors in implementing sustainable building practices in KZN. Data was collected by means of an interview from ten residential building contractors in order to obtain their insight, perceptions and reasoning about sustainable residential building practices. The residential contractors were selected via purposive sampling which is a non-probability sampling method (Leedy and Ormrod, 2010). Interviews are used tool to access people, experiences and their inner perceptions of reality (ibid). The authors selected interviews because they are more flexible, it’s a quick and cheaper method to obtain information, responses can be recorded without causing embarrassment to respondents and the interviewer has more leverage to explain the requirements more easily (Kothari, 2004). This paper maintains total confidentiality in relation to the data that was collected from residential contractors. 4. RESULTS AND DISCUSSION After conducting the interviews the authors read through them to determine the emergent themes. The interviews were transcribed verbatim and were organised by theme. Of the ten residential contractors sampled for the study, five were owners of a construction firm. The five other people interviewed included a financial director, quantity surveyor, partner, director and a member of the firm. The number of years in the profession of the respondents ranged from two years to 35 years. Nine residential contractors have undertaken some form of sustainable residential building since their companies were incorporated. This indicates that most residential contractors are aware of sustainable residential building practices. On average the residential construction firms have been practising for 5.4 years, with nine respondents having completed at least 2 sustainable residential buildings. All residential contractors do believe that the living conditions of the occupant can be improved by using sustainable residential practices however one respondent stated that “they can improve residential living conditions if the materials are available at reasonable prices”. Nine residential contractors believe that the oil spills from plant that contaminates the soil is very minimal in residential projects. Another respondent highlighted the fact that “labourers are well aware on how to deal with oil spills on site”. All respondents do believe that the finished product of the landscaped areas will be in perfect condition if there was minimal or no oil spillage at all. All the respondents believe that using sustainable building materials made from recycled glass tiles, insulation and dry wall can improve the sustainable building practices. There are however challenges with sourcing
Proceedings: 9th Built Environment Conference
2-4 August 2015, Durban, South Africa
ISBN 978-0-620-67120-0
page 188
these materials as one respondent highlighted that “small scale hardware’s where they procure materials do not stock these type of materials most of the time because they are hardly purchased because they are expensive”. Eight residential contractors believe that the materials that the professional team and architects prescribe are easy to understand and obtain but it was also stated that “the specifications are easy to understand but not easy to obtain. The materials may be obtained easily in small quantities, but at later stages of the project, the materials might have to be imported from far as the demand might be too much for local suppliers to produce and supply and some are specialised materials that local producers cannot produce”. The majority of the residential builders outlined that in professional team meetings the materials are clarified and recommendations of suppliers who supply those materials are given or suggested to the builders but the long lead time that it takes suppliers to bring materials to site is another challenge that residential contractors face. Minimisation of waste is also a major concern in the residential building industry, the respondents agreed that waste minimisation is always prioritised on site as it positively impacts the environment. Seven out of ten respondents believe that it is not the role of the residential contractors to drive sustainable residential building practices. One respondent went as far as saying “it is the architect’s responsibility to design sustainable homes and its onus is on the owner to choose a sustainable home, the contractors simply follow the architects design instruction”. Another respondent stated that the “home owner is the one who is responsible as they have the final say as to what should go in the construction of their houses”. A further respondent highlighted that “the awarding of the work only happens once the design, bill of quantities and necessary documents are all completed and they only receive the tender documents to tender for the job and there is very little that they can do to influence the design or project at this stage”. Three respondents do believe that the residential contractors can be key drivers on residential projects as “they drive the project and are aware of benefits – it is to their advantage”. One respondent highlighted that “residential contractors have leverage as they can influence the choice of material that the client wants as the projects progresses”. The third respondent stated that “with the experience in the residential building sector they understand it more and they can influence the client but the client should be willing to opt for it”. All ten respondents do believe that recycling materials on site can benefit the contractor in cost savings and it can benefit the environment. Most respondents argue that wastage is always kept minimal. One respondent highlights that “the contractor can benefit from recycling materials in that he would save on transporting new materials to site, which cuts fuel cost and buying new materials”. The majority of the respondents highlighted that there are major cost savings as less material will be procured. One respondent highlighted that “using different skips for nonreusable materials and one for re-usable materials such as steel off cuts, planks etc. is a good practise”.
Proceedings: 9th Built Environment Conference
2-4 August 2015, Durban, South Africa
ISBN 978-0-620-67120-0
page 189
All respondents agree that the use of modern lighting systems such as compact fluorescent light bulbs reduces energy consumption and impacts positively on the environment. One residential contractor stated that “incandescent light bulbs produce light from heat which makes them consume more energy as compared to fluorescent light bulbs which consume less energy”. Seven out of ten builders do believe that regulations from the National Home Builders Registration Council (NHBRC) are in favour of sustainable residential building practices but the emphasis is more on energy efficiency. One respondent went so far as saying “yes it is incorporated but not in finer details, there are lot of grey areas”. The three residential contractors who believe that the NHBRC guidelines are not in favour of sustainable residential practices mentioned issues such as “they are not in complete favour of residential sustainability building practices as they do not impose strict compliance with sustainability practices”. One respondent mentioned that “should the municipalities put all the residential building practices to its bylaws and have strict measures in place the clients and contractors will comply, the NHBRC guidelines are general basic building codes”. Eight respondents are positive that if they are involved in planning stages of residential projects they can add more value. One respondent went as far as saying “residential contractors are more hands on, they have experience and they also know what is capable and possible”. One respondent argues that “residential contractors input is vital in early stages as the contractor understands site conditions better than most people who are involved in the project”. Some of the respondents do believe that they can add value if they were to be involved in early planning stages however it is highly unlikely since they only get involved in later stages. The two residential contractors that believe it is not possible for residential contractors in early planning stages to add value on the project mentioned that “typically builders are not always included in initial planning or design stages, they are only appointed after these have been finalised and a quantity surveyor has created a bill of quantities based on the completed design”. The other respondent highlighted that “even if builders add input or suggest certain aspects the clients call the shots and they have a final say”. All the respondents believe that sustainable residential building materials inflate building costs. One respondent highlighted that “the market is a niche market and therefore highly priced”. The other respondent mentioned that “the sustainable building materials are expensive and often discourage owners or clients from opting to use sustainable building materials. The materials increase the cost of construction because they cannot be found locally and have to be imported from neighbouring towns”. Another respondent pointed out that the “residential sector is a different sector; the sustainable materials are ordered in low volumes and this leads to higher prices unlike in other sectors of construction where they can order in bulk”. Some respondents went as far as highlighting that the cost of sustainable building materials do inflate building cost “but you do find clients that are prepared to pay the
Proceedings: 9th Built Environment Conference
2-4 August 2015, Durban, South Africa
ISBN 978-0-620-67120-0
page 190
premium so that they can see savings in water bills and electricity in the long run” The respondents do believe that there are savings in the long run if the home owner opts for sustainable building practices. One respondent claims that “there will be savings in the long run for the home owner, but the current costs of sustainability building practices becomes too much for the owner to adhere to such”. Some respondents recommended that “lower energy costs equates to lower maintenance in the long run”. Another respondent pointed out that “harvesting rain water for irrigation and outdoor use benefits the owner in water bills and there are major savings in electricity”. In general some residential contractors believe that “for the home owners and contractors to be able to adhere to sustainable building practices, the current cost of implementing sustainability needs to be affordable and there must be future benefits that will exceed the cost of implementing sustainability”. Another respondent believes that “the government needs to subsidise this industry as there is no competition at all and prices are way too inflated”. 5. CONCLUSION This study has established that residential contractors are aware of sustainable residential building practices but they do experience challenges in its implementation. The challenges experienced by the residential contractors are that architects do not always design sustainable options, these contractors have to pay high prices to procure materials as they buy them in small quantities, they are not involved in the early stages of the design process where they can have a say and overall they believe that clients are responsible for sustainable residential building practices as they are the ones paying for it. A recommendation would be for government departments or even the Construction Industry Development Board (CIDB) to conduct awareness programmes for the clients informing them about the green building products and sustainable building practices. Continued education programs for professionals and technicians as well as concerted public education programmes is also important. 6. REFERENCES Du Plessis, C. 2002. Agenda 21 for Sustainable Construction in Developing Countries. [Online] Available from http://www.cidb.org.za/documents/kc/external_publications/ext_pubs_a2 1_sustainable_construction.pdf [Accessed 13 March 2015]. Edwards, E. 2003. Green Building Space. Second edition. Taylor and Francis Group: London. Halliday, S. 2008. Sustainable Construction. First edition, Gala Research. Horne, R. and Hayles, C. 2008. Towards Global Benchmarking for Sustainable Homes, and International Comparison of the Energy
Proceedings: 9th Built Environment Conference
2-4 August 2015, Durban, South Africa
ISBN 978-0-620-67120-0
page 191
Performance of Housing. [Online] Available from http://link.springer.com/article/10.1007%2Fs10901-008-9105-1 [Accessed on 11 March 2015]. Kothari, C. R. 2004. Research Methodology: Methods and Techniques 2nd Revised Edition, New Age: New York. Kim, J. and Rigdon, B. 1998. Qualities, Use, and Examples of Sustainable Building Materials: Sustainable Architecture Module. [Online] Available from http://www.umich.edu/~nppcpub/resources/compendia/ARCHpdfs/ ARCHsbmIntro.pdf [Accessed 06 March 2015] Leedy, P.D. and Ormrod, J.E. 2010. Practical Research: Planning and Design, 10th Edition, Pearson Education Inc: New Jersey. Reddy, B. V. 2009. Sustainable Materials for Low Carbon Buildings, [Online] International Journal of Low-Carbon Technologies, Available from http://ijlct.oxfordjournals.org/content/4/3/175.full.pdf+html [Accessed 11 March 2015] Schmidt, C. W. 2008. Bringing Green Homes within Reach: Healthier Housing for More People. Environmental Health Perspectives, 116(1): A24–A31. Winston, N. and Eastway, M.N. 2007. Sustainable Housing in the Urban Context: International Sustainable Development Indicator Sets and Housing. [Online] Available from http://link.springer.com/article/10.1007/s11205-007-9165-8 [Accessed on 11 March 2015] Zabihi, H.; Habib, F. and Mirsaeedie. 2012. Sustainability in Buildings and Construction: Revising Definition and Concepts. [Online] Available from http://ijes.info/2/4/42542406.pdf [Accessed 07 March 2015]
Proceedings: 9th Built Environment Conference
2-4 August 2015, Durban, South Africa
ISBN 978-0-620-67120-0
page 192
ASOCSA2015-017
The final users’ perception of the indoor environmental quality of green buildings: a case study in KwaZulu-Natal, South Africa Vittorio Tramontin1, Ashley Parbhoo2, Claudia Loggia3
[email protected],
[email protected], 3
[email protected] 1,2,3 School of Engineering, Property Development Department, University of KwaZulu-Natal, Howard College, Durban 4041, South Africa. (Tel.: +27 312601183. Cell.: +27 745897223) 1
ABSTRACT AND KEYWORDS Purpose: The aim of this paper is to investigate the benefits of accredited green buildings in the KwaZulu-Natal context as perceived by the final users, especially in terms of Indoor Environmental Quality (IEQ) and its possible influence on the perceived productivity. Design/methodology/approach: A survey using a Post-Occupancy Evaluation questionnaire was conducted for investigating a case study of a Green Star SA certified office building in the Durban area. An unstructured interview with the office manager provided a greater understanding of the IEQ benefits in terms of organisational aspects from the management perspective. Research limitations: The study was limited to one office building. The same methodology should be applied to other green buildings to confirm and generalise the results achieved. Findings: Most IEQ parameters were considered comfortable from the users and in particular some of them were perceived as enhancing their productivity level, providing a positive outlook on the internal environment created by green design principles. Response to conference theme: Understanding the perception of the final users is a crucial step for recognising the benefits of the environment created by green buildings. Practical implications: The findings could lead developers and owners to understand more deeply the benefits of green buildings and to orient their choice towards green building developments. Keywords: Green Star SA, Post Occupancy Evaluation, Indoor Environmental Quality.
Proceedings: 9th Built Environment Conference
2-4 August 2015, Durban, South Africa
ISBN 978-0-620-67120-0
page 193
Conference sub-theme: Sustainable Green Building 1. INTRODUCTION Regulatory and voluntary instruments are essential to overcome the barriers to the development of sustainable construction (UNEP, 2007: 3). While building energy regulations exist in most developed countries, more and more developing countries are still introducing and implementing such codes (UNEP, 2007: 4, as cited in Iwaro and Mwasha, 2010: 7745). Countries as South Africa have become recently more sensitive to the topic of sustainable construction and green buildings, particularly thanks to the activities of organisations such as the Green Building Councils established all over the world. The activities of these organisations include among others information campaigns, training and the release of voluntary instruments such as the green building rating systems. In South Africa, the green building market is growing rapidly, and stakeholders start looking at green buildings as a possible alternative solution to traditional construction, which might be necessary in a near future perspective (GBC SA, 2015). Environmental and energetic benefits of green buildings, often implying also lower operating costs, are generally beyond dispute (Milne, 2012: 8). What is less apparent, particularly in a young green building market such as the South African one, is whether the potential benefits of sustainable design are actually perceived by the final users of the building in relation to the high-quality indoor environment that such building is supposed to create. Creating a comfortable environment for the building occupants is considered a key aspect of a green building, as clearly documented by green building rating systems such as the Green Star SA released by the Green Building Council of South Africa (GBC SA, 2014). In this regard, the occupants’ perception of the indoor environment in a green building can form a foundation on the capability of that building in providing greater benefits to its occupants than a conventional building. Businesses have taken note to these possible advantages and are considering green buildings as they can play a key role for a healthier working environment, which can imply an increase in employees’ productivity and consequently financial benefits for owners (Clements-Croome, 2000: 15). Green buildings should therefore provide to occupants a good Indoor Environmental Quality (IEQ), which affects their comfort level and wellbeing (GBC SA, 2014: 39). IEQ is one of the most important environmental impact categories for Green Star SA certified buildings, particularly office buildings (GBC SA, 2014: 365). However, there has been little investigation locally into the perception whether the environment produced by green principles actually benefits building occupants. The acknowledgement of these benefits might contribute to foster further decision making from owners and developers towards green buildings, thus encouraging the development of a more active green building market. This paper aims to investigate if the indoor environment provided by a certified green building in KwaZulu-Natal produces actual beneficial effects
Proceedings: 9th Built Environment Conference
2-4 August 2015, Durban, South Africa
ISBN 978-0-620-67120-0
page 194
as perceived by the occupants and to which extent they actually view the quality of this environment. The main objectives include the identification of the factors that influence the satisfaction of building occupants, the understanding of occupants’ perception of the indoor environmental quality of certified green buildings, and finally the understanding whether the effects of a green building environment influence the organisational outcomes as perceived by occupants and a management perspective. A case study research method focusing on a Green Star SA certified office building in KwaZulu-Natal was adopted for this study. A questionnaire survey investigation was conducted on the occupants of the green building, which formed part of a Post Occupancy Evaluation (POE). Accompanying this was an unstructured interview with the office manager with the focus on occupant relation with their surroundings and organisational outcomes. A literature review focusing on IEQ factors of green buildings, their subsequent effects on occupants, and POE of green buildings is provided in the next section. Then the methodology and the case study are described in detail, in order to present and discuss the main results, also in the light of the literature findings. Finally conclusions and recommendations are proposed. 2. POST OCCUPANCY EVALUATION AND INDOOR ENVIRONMENTAL QUALITY OF GREEN BUILDINGS A Post Occupancy Evaluation can provide essential information about the actual users’ perception of a building, in order to make a comparison with what was expected from the design perspective according to the strategies implemented. POE can thus represent a useful method to evaluate the effectiveness of design strategies from a users’ perspective, and also can identify methods in which final users can use the building’s equipment and features more efficiently. Meir (2008) observed that conducting these evaluations can help determine ways to decrease energy consumption and improve building comfort for its final users. The IEQ is in fact linked to the energetic performance of the building and the well-being of its buildings occupants. Gou and Siu-Yu Lau (2012: 262) observed a dissatisfaction with the perceived IEQ of a building to be associated with “Sick Building Syndrome” (SBS) symptoms. The term SBS is used to describe instances in which building occupants experience, often, negative health and well-being effects due to a poor indoor environment. Looking for example at the Indoor Air Quality (IAQ), which is an important factor of IEQ, research demonstrated that inadequate IAQ proved to be more credible source to occupant’s poor health and well-being (Santamouris, 2013). The accompanying physical health symptoms can also affect the mental wellbeing of an occupant as Jaakkola (1998) described in terms of link between the office environment and the well-being of a person. The perception of the indoor environmental quality of a building is an essential aspect that can be investigated through a POE. The features of a
Proceedings: 9th Built Environment Conference
2-4 August 2015, Durban, South Africa
ISBN 978-0-620-67120-0
page 195
green building are often related to the IEQ created, mainly due to the associated organisational productivity and the health, comfort and wellbeing of building final users. The common features that usually affect building occupants include: mechanical ventilation, simulated lighting, surrounding noise environment, thermal well-being, air circulation and air quality. The negative aspects created by an unmaintained mechanical ventilated system include the prolonged exposure of its faulty ducting or filters used which can affect its buildings occupant’s health (Burge, 2004). According to Nimmermark and Gustafsson (2005: 11), thermal changes have been shown to affect surrounding air quality. Buildings that have higher temperatures, either caused by solar gains or HVAC systems, may cause increased emissions of Volatile Organic Compounds (VOCs) (Godish, 2000: 310-311). These VOCs are largely human made and are air-borne compounds that are emitted in their surroundings, often leading to negative health symptoms. Similarly, a deficiency or lack of air circulation and the movement of fresh air has been described as being the primary cause of negative health symptoms experienced by building occupants. This lack of air circulation and possibly inadequate ventilation can increase the amount of CO₂ emissions, as well as VOCs, in the building environment (Hanie et al., 2010). The IEQ factors of a green building not only have an effect on the occupants’ physical well-being, but also on their psychological well-being. Some researchers observed that these psychological effects could result in physical health problems. For example, interactions with nature play a fundamental role in both their mental and health well-being. Buildings that integrate contact with outdoor nature are likely to give the person a feeling of “escape” and clear their mind of “busy thoughts” and overall well-being than buildings that lack these features (Kaplan and Kaplan, 1990). Integrating and implementing green design features to achieve a green building certification (e.g. following the criteria of the Green Star SA rating system) should provide occupants a healthy environment that does not physically and psychologically harm the occupants or hinder with their activities. Research into the relationship between the physical work environment of the workers and the organisation are commonly found. Sehgal (2012) debated that by providing relaxed ambient environment and by decreasing health and safety hazards, a building can encourage the capability of occupants to execute their activities. Von Paumgartten (2003: 29) cited a study from the Buffalo Organisation for Social and Technological Innovation which showed that the physical workplace affected job satisfaction by as much as 24%. An investigation by Cooper et al. (2009) observed that the building physical features and techniques affecting its environment had an influence on psychological wellbeing of its occupants. They found that these features related to the physical environment, like a thermal regulation, lighting and ventilation, had a much stronger effect on the satisfaction of the employees than symptoms of psychological distress. In the South African context, the green building market is still at an embryonic stage. A more in-depth understanding of the benefits of green buildings from the users’ perspective could foster their development in the
Proceedings: 9th Built Environment Conference
2-4 August 2015, Durban, South Africa
ISBN 978-0-620-67120-0
page 196
local context and promote initiatives from developers and owners in this regard. This research offers a contribution in this sense. 3. METHODOLOGY In determining a suitable research method, previous studies conducted by Heerwagen (2000), Meir et al. (2009) and Singh et al. (2010) showed that a qualitative research approach was used with great success for similar studies. The aim was in fact in line with the one of this research, oriented to understand the experiences of the building occupants in order to look mostly into the human element, perception, attitudes and views. A qualitative method was therefore primarily used by conducting a post occupancy evaluation, using questionnaires and unstructured interviews, and dealing with the occupants’ perceived experiences within a green building. According to Baker (1999: 389), triangulation can bring together quantitative and qualitative data drawn from distinctly different research methods. The results of the qualitative investigation were improved by quantitative methods used to support and analyse the results of the qualitative research. This together with the in-depth literature review helped develop a stronger background and understanding of the problem, and a more robust interpretation of the results of the investigation. For the purpose of this research, a case study method was adopted. The case study approach fitted the objectives of the study as it provided the researchers to focus on one entity (person, group or organisation) allowing greater examination and in-depth investigation into their perceptions and views. Benbasat et al. (1987: 370-371) further explained that a case study approach endorsed the researchers to focus on present-day views of the occupants in their natural environment, which aligns with the aim of this research. In selecting a suitable building for the case study, a convenience sampling method, which is under the non-probability sampling technique, allowed to choose samples that are more accessible, in terms of distance and availability of information, thus saving costs and time (Marshall, 1996: 523). Given the objectives, it was logical to choose a green building whose primary function is that of an office block. Under this condition, the green buildings that have been rated and certified under the Green Star SA Office v1 rating system were considered in the local context of KwaZulu-Natal. The office buildings were determined from the Green Star SA certified reference list from the GBC SA website. The Richefond Circle Office park in Umhlanga was selected and the Shepstone and Wiley Attorney Offices, which is a four-star certified building according to the Green Star SA Office v1 design and as-built certification, was assessed. This building is the Durban offices for the exclusive use for Shepstone and Wylie attorneys and has approximately seventy employees. Green features of the building relating to IEQ include among others maximising on the potential of the natural setting by taking advantage of the beautiful east facing sea views,
Proceedings: 9th Built Environment Conference
2-4 August 2015, Durban, South Africa
ISBN 978-0-620-67120-0
page 197
systems with variable speed drivers responding to CO2 sensors, deep overhangs to provide shade to the windows, open plan layout. Meir et al. (2009: 205) explained that questionnaire surveys allow researchers to understand and determine the relations between a building system and its users. For the purpose of this research, the researchers used a post occupancy evaluation questionnaire as main method of data collection. The questionnaire focused on the users’ perception of the indoor environmental quality aspects of the building and their effects on satisfaction and productivity at work. The questionnaire survey was divided into six main sections: Biological Information, Occupant Satisfaction with Indoor Environmental Quality, Perceived Productivity, Visual Comfort, Physical Aspect, Building Contrast. Parts of the questionnaire, referring to the well-being and health of the occupant, were structured with reference to the two scales of measurements, namely Warwick-Edinburgh Mental WellBeing Scale (WEMWBS) and Sick Building Syndrome (SBS). Questions were mainly tailored with multiple choice and declarative options, using the Likert scale of measuring and usually following a rating scale based on “mostly liked”, “neutral” and “mostly disliked” categories. Management of the offices permitted the researchers to sample only fifty employees to be used for the study, which ended up to thirty six agreed participants. This equated to 72% of the sample size. In addition to the questionnaire, an unstructured interview was conducted with the office manager to enrich the findings of the survey. This interview focused on the organisational behaviour, establishing which IEQ factors occupants complained about and seeking greater clarity. This included the rate of absenteeism, perceived benefits from work capabilities of occupants, mental and physical well-being, increased productivity, etc. The results of the implemented methods were analysed, interpreted, synthesized and presented using graphs. The data analysis was conducted by structuring the collected information into sections that refer to the aim and objectives of the study. These sections were named: occupants’ satisfaction with the IEQ; occupants’ health symptoms; effect of IEQ on the employees’ perceived productivity; effect of external views on employees’ comfort and perceived productivity; occupants’ satisfaction with office surroundings. Ethical clearance was obtained for this study from the UKZN Ethics Committee. All the aspects relating to the research and the involvement of participants were treated with confidentiality and the results were disclosed as a group and not individually. All the participants were provided with an informed consent form that explained the aim of the study, the contents of the survey, and clarified the nature of participation to be on a voluntary basis. 4. RESULTS AND DISCUSSION The main results of the survey are summarised in the following paragraphs. With reference to thermal comfort (figure 4.1), the majority of the participants were very happy with the indoor temperature during summer (66.67% comfortable and 5.56% very comfortable). Also with regard to
Proceedings: 9th Built Environment Conference
2-4 August 2015, Durban, South Africa
ISBN 978-0-620-67120-0
page 198
indoor temperature in winter, most participants (77.78%) were satisfied (25% fair, 41.67% comfortable, 11.11% very comfortable). The positive results for thermal comfort over the seasons instil the success of the HVAC system in place, and the positive effects of solar gains through windows in winter and the window screening systems in summer. The office manager reported that employees sometimes criticised too cold temperature during winter, but this might refer to a common problem of HVAC services’ practice in the South African context. Summer
Winter 66.67%
70%
% of participants
60% 50%
41.67%
40% 30% 20% 10%
25.00% 11.11% 2.78%
25.00%
11.11%
11.11% 5.56%
0.00%
0% Considerably Uncomfortable
Uncomfortable
Fair
Comfortable to Reside in
Considerably Comfortable to Reside in
Figure 4.1 Perception of thermal comfort in summer and winter
A substantial number of participants conveyed that daylight was adequate, with recorded majority at satisfactory (30.56%) and considerably satisfactory (25%). These results are indication to the successfulness of the design choices (large windows only on north and south orientation, open-plan layout, etc.). The provision of screening apparatuses also reduced the level of surrounding glare exposure, even though the office manager remarked that glare from windows tended to increase in summer. The majority of the participants‘ were comfortable with the air quality answering that the air was odourless (58.33%), following this the second largest group of participants answered that they felt neutral (33.33%). This provided confirmation that the materials used in the construction of the building, including those for finishes, have a small risk of producing VOCs that can affect negatively health of occupants. In addition to this, the proper maintenance of air filters of the HVAC system contributed to a higher air quality level. Also the noise from building services was rarely considered by most occupants as a possible reason from distraction. Almost three fourth of participants declared to have full (19.44%) or partial view (52.78%) to the exterior environment, which provided beneficial effects on their well-being (47.22% moderate effects, 22.22% major effects). This was primarily related to the open plan layout and large windows. These results are in line with the theory of biophilic design discussed by Molthrop (2011), with the aim of creating beneficial up-liftment to a person’s well-being. On the other hand, the open-plan layout was recognised to affect negatively the noise within the work environment. The majority of participants complained a distracting noise (47.22% always, 30.56% often)
Proceedings: 9th Built Environment Conference
2-4 August 2015, Durban, South Africa
ISBN 978-0-620-67120-0
page 199
from daily work activities of other occupants. However, open plan layouts are a common good practice in green buildings, due to the several benefits they can provide. Open plan workplaces enable communication and interaction between co-workers, thus encouraging organisational productivity and increasing the level of control on the work activities. Also, they allow to maximise the use of natural light for a healthy work environment and energy saving. Furthermore, open-plan layouts guarantee higher levels of flexibility of space and adaptability for future uses (Ferreira et al., 2010: 198). Sustainable design solutions often require trade-off and compromise between various possible effects. Therefore, the negative effects on noise must be weighted with many other positive effects provided by that specific design choice. Proper code of conducts and management rules could be helpful to limit noise levels and its negative effects. It is also to be noted that despite the noise level, most participants declared to be happy with the office layout and satisfied with the privacy they had in their work environment. Over 50% of participants declared to have personal control over their environment, particularly in relation to natural light. This percentage must consider that only workspaces close to the building envelope might ensure full control over the natural energy flows entering the building. Previous research (Newsham et al., 2009) concluded that personal environmental control in an open plan office improved occupant environmental satisfaction. Overall, the majority of the respondents (figure 4.2) were satisfied with their work environment (58.33% satisfied, 5.56% very satisfied, 25% fair). This confirmed the quality of the green design recognised by the Green Star SA certification. IEQ generally gives an important contribution to the award of the Green Star SA office certification, having the second largest weighting factor (or category weighting) amongst the environmental impact categories (GBC SA, 2014: 365). % of particpants
70%
58.33%
60% 50% 40% 25.00%
30% 20% 10%
2.78%
8.33%
5.56%
0% Cons iderably Uns atisfied (Bui lding envi ronment doe sn’t fit my needs)
Unsatisfied
Fair
Satisfied
Considerably Satisfied (Building environment does fit my needs)
Figure 4.2 General satisfaction with the work environment
Also, 41.67% of participants declared to be convinced that residing in a green building improved (moderately or significantly) their mental or physical well-being. The positive perceived effects to occupants of the IEQ of the investigated green building are in line with the results of other international studies (US GBC, 2009).
Proceedings: 9th Built Environment Conference
2-4 August 2015, Durban, South Africa
ISBN 978-0-620-67120-0
page 200
In terms of symptoms related to possible SBS, the investigation revealed that the majority of respondents experienced rarely or never common health symptoms. These results are a direct representation of the satisfaction of participants with the IEQ factors of their work environment, particularly thermal comfort, air quality and circulation, lighting. Most experienced symptoms (congested nose: 47.22%; headache and fatigue: 22.22%) might have been related to the small portion of respondents that were not comfortable with glare, noise and brightness of their surroundings, as headaches might be an effect of glare and high noise levels as discussed by Reese (2004: 164) and Bluyssen (2013: 355). The large portion of respondents that answered to having congested nasal problems may have been related to the portion that were not satisfied with air quality and circulation (New York Committee for Occupational Safety and Health, n.d.), but this might have been most likely caused by humidity and temperature during the varying seasons (Means, 2011: 157). Also, it is to be noticed that these symptoms seemed to stay with the occupants also after leaving the building, as most participants declared (61%), showing that the causes were unlikely to be relating to the working environment. Participants were finally asked to rate the indoor environmental factors affecting positively or negatively their productivity and performance at work. The factors that participants perceived as assisting them in their ability to perform their daily work were those factors that were mostly liked by the bulk of the respondents. The high response rate declaring that the surrounding temperature helped their office activities (67% work is easier to complete) is of similar results to the study by Lan et al. (2012). The other most important factors considered beneficial by respondents to complete easily activities at work were identified in the amount and quality of light, both natural and artificial, and the quality of air. Also, almost half of the respondents declared to be convinced that the view of natural external environment enhanced their mental attitude to conduct their daily work. The IEQ factor that participants perceived as hampering them in their ability to carry out their daily work was the one that was mostly disliked by the majority of the participants, namely internal noise. The negative perception of the internal noise was related mainly to the open plan layout, which has previously already been commented on. Ultimately, the measurement of productivity is a difficult aspect to determine as Amar (2002: 108) discussed, being not only the accounting measurement and decrease of absenteeism that determines productivity levels. The interview with the office manager provided similar results to which Amar discussed: he did not seem to notice an employee productivity changes whilst working in the building, providing a fairly neutral response (the absenteeism rate was however not determined neither records were made available). The office manager interview did not provide the researchers specific IEQ factors to which the manager might have considered aiding the employees’ productivity levels. However, from the employees’ perception and view, it can be distinguished that certain IEQ factors did have an effect on their productivity, as showed by the results of the survey. Providing a comfortable indoor environment produces a
Proceedings: 9th Built Environment Conference
2-4 August 2015, Durban, South Africa
ISBN 978-0-620-67120-0
page 201
constructive working environment for employees where they can carry their work effectively without disrupting factors. Conversely, if surrounding conditions are not comfortable or acceptable for employees, the prior will create avoidable disorders that will inhibit employees from executing to their broadest capability.
out the the the
5. CONCLUSIONS AND RECOMMENDATIONS The development of the green building market is still at an early stage in the context of a developing country such as South Africa. A clear and comprehensive understanding of the actual benefits in terms of postoccupancy and operational phase, and in terms of economic implications in the long term has not fully been reached yet. More research and comprehensive post-occupancy data would be necessary in this sense to reveal the real long-term implications of investing in green strategies and to foster owner and developers to move towards green building developments. In this regard, the Indoor Environmental Quality represents a critical indicator of the well-being of the occupants of a building, which can affect satisfaction and productivity at work, implying also possible financial benefits for owners. Considering the limited research production on the topic in the South African context, this research analysed a local case study of a certified green office building. The aim was to understand through a post-occupancy survey if the sustainable solutions implemented in the design and construction phases reflected on actual benefits perceived by the occupants in terms of indoor environmental quality of their work environment. The results showed a general satisfaction and positive reaction of the occupants with regard to the indoor environmental quality of the green environment. The results demonstrated a general effectiveness of the green strategies implemented through design and construction, and align with the findings of other international studies. Few factors were considered not satisfactory from occupants, in particular internal noise due to the open plan layout. However, sustainable design often implies to research trade-off and compromised solutions that can achieve higher benefits when weighted amongst various impact categories. Open plan layouts can affect negatively internal noise, but are highly beneficial to favourite natural cross-ventilation, to improve natural light, to ensure higher degree of flexibility of indoor space and guarantee future easier adaptability, to create a shared working environment, to improve teamwork, communication and collaboration at work. This paper offers therefore a contribution towards strengthening the awareness of the implications of green building design on the final users and on the perceived indoor environmental quality. The replication of the adopted methodology and post-occupancy evaluation to other local case studies would be essential towards this aim in order to reach generalised data. This would represent an important step for encouraging developers
Proceedings: 9th Built Environment Conference
2-4 August 2015, Durban, South Africa
ISBN 978-0-620-67120-0
page 202
and owners to invest in green strategies and for fostering the development of the local green building market.
6. ACKNOWLEDGMENTS The authors would like to thank the staff of Shepstone and Wiley Attorney Offices for their availability to participate in this study. 7. REFERENCES Amar, A., D., 2002. Managing Knowledge Workers: Unleashing Innovation and Productivity. USA: Greenwood Publishing Group. Baker, T.L., 1999. Doing Social Research, Third Edition. Boston: McGraw-Hill. Benbasat, I., Goldstein, D.K. and Mead, M., 1987. The Case Research Strategy in Studies of Information Systems. MIS Quarterly, 2(3), 369-386. Bluyssen, P.M., 2013. The Healthy Indoor Environment: How to Assess Occupants' Wellbeing in Buildings. London: Routledge. Burge, P. S., 2004. Sick Building Syndrome. Occupational and Environmental Medicine, 61 (2), 185-190. Clements-Croome, D., 2000. Indoor environment and productivity. In Clements-Croome, D. (eds), Creating the Productive Workplace. 1st ed. London: Spon-Routledge. Cooper, R., Boyko, C. and Codinhoto, R., 2009. The Effect of the Physical Environment on Mental wellbeing. In Cooper C, Goswami, U. and Sahakian, B.J. (eds), Mental Capital and Wellbeing. London: Wiley- Blackwell, 966-972. Ferreira, E. J., Erasmus, W. and Groenewald, D., 2010. Administrative Management. London: Juta and Company Ltd. GBC SA (Green Building Council of South Africa), 2015. Green Building Council celebrates milestone 100 Green Star SA certifications. [Online] Available at: https://www.gbcsa.org.za/news_post/green-building-council-celebratesmilestone-100-green-star-sa-certifications/ [Accessed 2015/05/28] GBC SA (Green Building Council of South Africa), 2014. Technical Manual GSSA Office v1.1. Godish, T., 2000. Indoor Environmental Quality. New York: CRC Press. Gou, Z. and Siu‐Yu Lau, S., 2012. Sick building syndrome in open‐plan offices: Workplace design elements and perceived indoor environmental quality. Journal of Facilities Management, 10(4), 256-265. Hanie, O., Aryan, A., Mohammadreza, L. and Elham, L., 2010. Understanding the Importance of Sustainable Buildings in Occupants Environmental Health and Comfort. Journal of Sustainable Development. 3 (2), 194-200. Heerwagen, J., 2000. Green buildings, organizational success and occupant productivity. Building Research & Information, 28, 353–367. Iwaro, J. and Mwasha, A., 2010. A review of building energy regulation and policy for energy conservation in developing countries. Energy Policy, 38, 7744-7755.
Proceedings: 9th Built Environment Conference
2-4 August 2015, Durban, South Africa
ISBN 978-0-620-67120-0
page 203
Jaakkola, J.J., 1998. The office environment model: a conceptual analysis of the sick building syndrome. Indoor Air, 8 (3), 7-16. Kaplan, R. and Kaplan, S., 1990. Restorative experience: the healing power of nearby nature. In Francis, M. and Hester, R., T., Jr. (Eds), The Meaning of Gardens: Idea, Place and Action. Cambridge: The MIT Press, 238-243. Lan, L., Wargocki, P. and Lian, Z., 2012. Optimal thermal environment improves performance of office work. REHVA Journal, 49, 12–17. Marshall, M., N., 1996. Sampling for qualitative research. Family Practice, 13(6), 522-525. Means, R.S., 2011. Green Building: Project Planning and Cost Estimating. Canada: John Wiley and Sons. Meir, I.A., Garb, Y., Jiao, D. and Cicelsky, A., 2009. Post-Occupancy Evaluation: An Inevitable Step toward Sustainability. Advances in Building Energy Research, 3, 189-220. Meir, I. A., 2008. Apology for architecture. In Roaf, S. and Bairstow, A. (Eds.), The Oxford Conference: A Re-evaluation of Education in Architecture. Southampton/Boston: WIT press, 33–36. Milne, N., 2012. The Rands and sense of green building. Green Building Council of South Africa. Molthrop, E. (2011). Biophilic Design A Review of Principle and Practice. Environmental sciences. 37 39. [Online] Available at: http://dujs.dartmouth.edu/ wp-content/uploads/2011/06/11s_final-37-39.pdf [Accessed 2015/03/10]. New York Committee for Occupational Safety and Health, n.d. Indoor Air Quality. [Online] Available at: http://nycosh.org/index.php?page=IndoorAir-Quality [Accessed 2015/01/14]. Newsham, G.R., Mancini, S., Veitch, J.A., Marchand, R.G., Lei, W., Charles, K.E. and Arsenault, C.D., 2009. Control strategies for lighting and ventilation in offices: Effects on energy and occupants. Intelligent Buildings International, 1 (2), 101 - 201. Nimmermark, S. and Gustafsson, G., 2005. Influence of Temperature, Humidity and Ventilation Rate on the release of Odour and Ammonia in a Floor Housing System for Laying Hens. Agricultural Engineering International: the CIGR Ejournal, Vol. VII, Manuscript BC 04 008. Reese, C.D., 2004. Office Building Safety and Health. USA: CRC Press. Santamouris, M., 2013. Environmental Design of Urban Buildings: An Integrated Approach. UK: Earthscan. Sehgal, S., 2012. Relationship between Work Environment and Productivity. International Journal of Engineering Research and Applications, 2 (4), 1992-1995. Singh, A., Syal, S., Grady, S.C. and Korkmaz,S., 2010. Effects of Green Buildings on Employee Health and Productivity. American Journal of Public Health, 100(9), 1665-1668. UNEP (United Nations Environment Programme), 2007. Assessment of policy instruments for reducing greenhouse gas emissions from buildings. [Online] Available at: http://3csep.ceu.edu/sites/default/files/field_attachment/ project/node-1679/unepfullreport.pdf [Accessed 2015/04/10].
Proceedings: 9th Built Environment Conference
2-4 August 2015, Durban, South Africa
ISBN 978-0-620-67120-0
page 204
US GBC (U.S. Green Building Council), 2009. Regional Green Building Case Study Project: A post‐occupancy study of LEED projects in Illinois. [Online] Available at: http://www.cnt.org/repository/Regional-GreenBuilding-Case-Study.pdf [Accessed 2015/03/10]. Von Paumgartten, P., 2003. The business case for high-performance green buildings: sustainability and its financial impact. Journal of Facilities Management, 2(1), 26-34.
Proceedings: 9th Built Environment Conference
2-4 August 2015, Durban, South Africa
ISBN 978-0-620-67120-0
page 205
ASOCSA2015- 004
Public Capital Investment in Infrastructure Development and Economic Growth in Ethiopia Denamo A. Nuramo E-mail:
[email protected], University of KwaZulu-Natal, Durban, South Africa Tel: +27 712 960-884(mobile); +27 31 260-3241 (office) Prof. Theodore C. Haupt E-mail:
[email protected] University of KwaZulu-Natal, Durban, South Africa Tel: +27 82 686-3457 (mobile); +27 31 260-2712 (office) ABSTRACT Purpose The paper attempts to explain the relationship between public capital investment in infrastructure development and economic growth in Ethiopia. Methodology A thorough literature review on studies made in developing countries forms the theoretical background of the research. The research is an empirical study based on the secondary time series data collected from the World bank, Ethiopian Road Authority and the Ethiopian Ministry of Finance and Economic Development. The empirical model for the study was developed from the endogenous growth framework using the Ordinary Least Squares (OLS) estimation technique and time series properties tests conducted on four variables. Granger causality test was conducted to determine the link between selected economic infrastructure sectors namely road, electricity and telecommunications. Data for the study covered from 1992 to 2010 and the source data comprises the yearly trend of growth in investment in road, electricity and telecommunication infrastructure and the corresponding economic growth. Findings The unit root Dickey-Fuller test has shown that all variables except growth in telecommunication investment are stationary at level and investment in telecommunication infrastructure found to be stationary at order I. Granger causality tests shows that there is a strong one way causal relationship
Proceedings: 9th Built Environment Conference
2-4 August 2015, Durban, South Africa
ISBN 978-0-620-67120-0
page 206
between growth in investment in road infrastructure and economic growth running from the former to the latter. No causal link was found between economic growth and growth in investment in the other two infrastructure sectors. Limitations The research is limited to investment in economic infrastructure namely road, electricity and telecommunication infrastructure Performance of infrastructure is not taken into account Relationship and interdependence between different economic sectors are not considered Long run and short run causality is not considered Economic growth and infrastructure provision disparity in the eight regional states across the country is not accounted in the study Practical implications The results of the research would help the Ethiopian Government and other countries with a similar economic setting to make informed budget allocation decisions in infrastructure development. Value The study focuses on selected infrastructure sectors and assesses their individual impact on economic growth. Key words: economic growth, infrastructure, GDP, development, Ethiopia 1.
INTRODUCTION
Infrastructure is envisaged to be the life blood of prosperity and economic confidence across the globe (Miller, 2013). Infrastructure development is one of the major determinants of economic growth and it creates a bottleneck for sustainable growth and poverty reduction if it not adequately provided (Sahoo, et al., 2010). Availability and accessibility of basic infrastructure particularly in developing countries is considered to be an important factor for development and an essential component for private firms' productivity (Enimola, 2010). Rodriguez (2007) showed with empirical evidence that infrastructure provision has a positive effect on productivity and growth. Investment in infrastructure in a developing country is essential for poverty reduction (Fay, et al., 2011) and it positively and strongly correlates with economic growth (Myres, 2013). Despite irregularity (Romp & Haan, 2005; Straub, et al., 2009; Briceño-Garmendia, et al., 2004; Prud’homme, 2005; Srinivasu & Rao, 2013) particularly about the magnitude of the effect, literature support the notion that infrastructure has positive impact on economic growth. Studies suggest that the impact of infrastructure on economic growth and productivity seems higher at a lower level of income
Proceedings: 9th Built Environment Conference
2-4 August 2015, Durban, South Africa
ISBN 978-0-620-67120-0
page 207
where the developing countries indwell (Romp & Haan, 2005; BriceñoGarmendia, et al., 2004; Estache, 2008). Literature stipulated that both public and private capital investment positively influence economic growth in the long run (Kayode, et al., 2013). Infrastructure development in developing countries is highly dependent on Government capital budget and the involvement of private investment is minimal (United Nations Human Settlements Programme, 2011) (The World Bank, 1994). Hence it is imperative to investigate the impact of public capital investment on infrastructure and its impact on economic growth in developing countries in this case Ethiopia. This article has six sections. Section two outlines the literature review followed by sections three and four where the research methodology and data used in the analysis presented correspondingly. Section five stipulates the empirical analysis whereby discussion is made. The conclusion and recommendations are presented under section 6. 2.
LITERATURE REVIEW
2.1 Infrastructure defined Infrastructure may refer to the basic systems and services that are necessary for a country or an organization to operate smoothly (Oxford University Press, 2015). While infrastructure and its related services have been with us for centuries, the term is new (Prud’homme, 2005). The Online Etymology Dictionary (2015) indicates that the word infrastructure originated from French and it is used to describe installations that form the basis for any operation or system. In 1980s and 1990s the term infrastructure became so popular and its meaning has extended so much that it is being used to describe undertakings in wide range of spectrum (Prud’homme, 2005). In the broader context the term may refer to either "soft" or "hard" infrastructure. Hard infrastructure entails provision of physical structures for basic services including energy, water supply, sewerage, transportation, waste removal, sanitation, communication, health and education (Casey, 2005). While hard infrastructure is about provision of physical assets, soft infrastructure is about development of skill and knowledge and access to appropriate services (Casey, 2005). Infrastructure can also be categorized as economic and social infrastructure where economic infrastructure is part of an economy's capital stock used to facilitate economic production (United Nations Human Settlements Programme, 2011). Structures including power utilities, piped gas, telecommunication, roads, drainage, railways, runways and seaport are typical examples of economic infrastructure. Social infrastructure on the other hand facilitates investment in human capital with a result of improving workforce productivity (United Nations
Proceedings: 9th Built Environment Conference
2-4 August 2015, Durban, South Africa
ISBN 978-0-620-67120-0
page 208
Human Settlements Programme, 2011). Social infrastructure includes health, education and recreation services. The scope of this paper is limited to hard infrastructure and economic infrastructure categories only. 2.2 Impact of infrastructure investment on economic growth Considerable efforts have been exerted in the last couple of decades to study the impact of infrastructure on economic growth and development in several countries. These studies, on the whole, implicated that under the right conditions, infrastructure has notable impact in promoting growth and equity (United Nations Human Settlements Programme, 2011). Apparently, there is an increasing consensus that infrastructure contributes to economic growth by raising labour productivity and lowering production and transaction costs (Dissou & Didic, 2013). Time series analysis and crosssectional national studies have shown that infrastructure investment has high rate of return on economic growth and infrastructure variables are positively and significantly correlated with economic growth in developing countries (The World Bank, 1994). Enimola (2010) conducted an empirical research to investigate the impact of infrastructure on the economic performance of the Nigerian economy and indicated that sustainable growth won't be embraced until governments generate enough funding towards eliminating infrastructure bottlenecks which impede productivity and economic growth. The study (Enimola, 2010) has also found out that an increase in the share of expenditure in infrastructure is necessary and productive for Nigeria. Kumo(2012) conducted a study in South Africa for the period 1960 to 2009 and found out a strong two-way causality between economic infrastructure investment and GDP growth. Calderon and Serven(2004) used a panel data from 1960 to 2000 encompassing over 100 countries and found out that quantity of infrastructure has a robust effect on growth where a one standard deviation increase in the stock of infrastructure results in a 3% increase in economic growth rate. Sahoo and Dash (2009) attempted to estimate impact of infrastructure quantity on economic growth in India using a data over 1970 - 2006. The results of the study indicated that long-run output elasticity of infrastructre is positive and statistically significant. A study performed to investigate the role of infrastructure in promoting economic growth in China has shown that infrastructure development has significant positive contribution to growth and there is unidirectional causality from infrastructure development to output growth (Sahoo, et al., 2010).
Proceedings: 9th Built Environment Conference
2-4 August 2015, Durban, South Africa
ISBN 978-0-620-67120-0
page 209
2.3 Infrastructure in developing countries Infrastructure access gap looms large in the developing world where an estimated 748 million people live without access to safe water, 1.2 billion without electricity, 2.8 billion still cook their food with solid fuel such as wood, 1 billion people live more than two kilometres away from an allweather road, 2.5 billion without sanitation, and more than 1 billion without access to telephone services (Lin, 2005; The World Bank Group, 2008; Fay, et al., 2011). According to the World Bank report (Fay, et al., 2011) despite the fact that 10 percent increase in infrastructure investment contributes to one percent growth in GDP, there is a gap in infrastructure provision which is estimated at $1 trillion in low- and middle-income countries, and the demand continues to grow as countries develop. While developing countries are engaged in massive construction undertakings to curb their infrastructure deficiencies, only limited progress has been made so far (Fay, et al., 2011). African countries, especially, sub Saharan Africa countries trail behind other regions in terms of infrastructure delivery and quality becoming an impediment to their economic development and a major constraint on poverty reduction (United Nations Human Settlements Programme, 2011). To fill the infrastructure gap an estimated USD 93 billion, which is about 15% of GDP a year investment in infrastructure is needed in Africa (United Nations Human Settlements Programme, 2011). 2.4 Infrastructure development in Ethiopia Ethiopia is one of the fastest growing economies in the world with an average growth rate of above 10% for the last decade and this momentum is expected to continue at a rapid pace over the next five years (AfDB; OECD; UNDP, 2014). With a population of more than 90 million it is the second most populous country in Africa following Nigeria. As depicted in Figure 1, agriculture is the backbone of the Ethiopian economy and it contributes about 47% to GDP and about 80% of employment (AfDB; OECD; UNDP, 2014). The Global Competitiveness Report 2014-2015 (World Economic Forum, 2014), positioned Ethiopia 125th out of the total 144 countries considered in the survey in terms of overall quality of infrastructure where the report highlighted the need for significant improvement to enhance competitiveness of the country's competitiveness in the global market. According to the United Nations report (United Nations Human Settlements Programme, 2011), only less than 20 percent of the Ethiopian population has access to any modern infrastructure. Surveys indicated that infrastructure constraints are responsible for an estimated 50 percent of the productivity handicap faced by Ethiopian firms (Foster & Morella, 2011).
Proceedings: 9th Built Environment Conference
2-4 August 2015, Durban, South Africa
ISBN 978-0-620-67120-0
page 210
Figure 1 Structure of the Ethiopian Economy (%of GDP), 1975 to 2010. (Siraj, 2012)
A report by the World Bank has indicated that infrastructure has contributed 0.6 percentage points to Ethiopia's annual per capita GDP growth over the years from 2001-2010 (Foster & Morella, 2011). In recent years, Ethiopia has made notable progress in infrastructure development performing relatively well when compared with other lowincome countries (Foster & Morella, 2011). Ethiopia's total infrastructure investment is among the highest in Sub-Saharan Africa, however, to reach its infrastructure targets, the country still needs a significant increase in its infrastructure funding amounting more than 40% of its GDP and a careful investment handling (Foster & Morella, 2011). The data used in the research is on infrastructure sectors - road, telecommunication and electricity and the period covered runs from 1992 to 2010. 3.
METHODOLOGY
3.1 Introduction The research follows Granger's time-series data based approach for determination of causality between GDP and selected economic infrastructure sectors investment growth. In this particular study three economic infrastructure growth variables namely total road infrastructure investment growth (RIIg), total telephone infrastructure investment growth (TIIg) and electric infrastructure investment growth (EIIg) are considered to test if they Granger-cause GDP growth variable. The results presented here are based on pairwise bivariate causality test between the previously mentioned variables. Below are three sets of hypotheses to be tested: 1. Electricity infrastructure investment growth (EIIg) Granger causes economic growth (GDPg) and vice versa,
Proceedings: 9th Built Environment Conference
2-4 August 2015, Durban, South Africa
ISBN 978-0-620-67120-0
page 211
2. Telecommunication infrastructure investment growth (TIIg) Granger causes economic growth (GDPg) and vice versa and 3. Road infrastructure investment growth (RIIg) Granger causes economic growth (GDPg) and vice versa 3.2 The Model Examination of the previously mentioned hypotheses requires selection of appropriate bivariate time series models. At the beginning, unit root tests are conducted to determine if the variables are stationary or not. This is followed by Engle-Granger residual-based test to check the existence of cointegration among variables. If no cointegration is found vector autoregression (VAR) model is applied. However, if cointegration is found vector error correction (VECM) model for multivariate system and a VAR model in levels for a bivariate system are applied. For Granger causality test between road infrastructure investment growth and economic growth, the following VAR equations can be stipulated: m
n
i 1
j 1
(GDPg ) t c1 c i (GDPg ) t i c j ( RIIg ) t j c t1
(1)
and p
q
k 1
l 1
( RIIg ) t c 2 c k ( RIIg ) t k cl (GDPg ) t l c t 2
(2)
where, ct1 and ct2 are error terms Based on the estimated ordinary least square (OLS) coefficients for equations (1) and (2), three different hypotheses about the relationships between road infrastructure investment and GDP growth can be formulated: 1.
Unidirectional Granger-causality from RIIg to GDPg. In this case investment in road infrastructure investment granger causes economic growth but not vice versa. Thus, cj ≠ 0 for j=1,....,n; and cl=0 for l=1,....q.
2.
Unidirectional Granger-causality from GDPg to RIIg. In this case economic growth granger causes investment in road infrastructure investment but not vice versa. Thus, cj = 0 for j=1,....,n; and cl ≠ 0 for l=1,....q.
3.
Bidirectional Granger-causality where investment in road infrastructure investment granger causes economic growth and vice versa. Thus, cj ≠ 0 for j=1,....,n; and cl ≠ 0 for l=1,....q.
Proceedings: 9th Built Environment Conference
2-4 August 2015, Durban, South Africa
ISBN 978-0-620-67120-0
page 212
4.
Bidirectional Granger-causality where investment in road infrastructure investment granger causes economic growth and vice versa. Thus, cj ≠ 0 for j=1,....,n; and cl ≠ 0 for l=1,....q.
The same hypotheses is formulated for each of the three relationships stipulated in section 3.1. 3.3 The Data Time series data used in this study is obtained from the Ethiopian Roads Authority (ERA), the World Bank data base and the Ethiopian Ministry of Finance and Economic Development (MoFED). GDP is measured by constant 2003 market prices and growth rates for each variable were annual average percentage changes. Table 1 Historical average growth rate of GDP and selected infrastructure economic activity at a constant prices (%) from 1992 to 2010
YEAR 1992 1993 1994 1995 1996 1997 1998 1999 2000 2001 2002 2003 2004 2005 2006 2007 2008 2009 2010
Electricity GDP investment growth (%) Growth (%) ‐8.7 11.4 13.1 4.9 3.2 5.2 6.1 5.0 12.4 0.7 3.1 2.4 ‐3.5 ‐0.5 5.2 1.8 6.1 20.2 8.3 1.6 1.5 12.3 ‐2.2 10.6 13.6 12.1 11.8 14.9 10.8 8.5 11.5 6.5 10.8 5.7 8.8 24.7 12.6 3.6
Proceedings: 9th Built Environment Conference
Telecommunication Road network investment growth investment (%) growth (%) 4.3 1.6 4.0 17.2 3.4 9.9 4.4 5.1 5.2 6.7 4.9 4.5 22.6 3.3 24.1 10.1 24.6 4.2 29.9 1.3 12.8 1.7 40.3 7.8 59.6 1.4 55.9 6.6 31.2 7.5 36.5 4.5 74.2 5.5 56.3 4.2 92.7 8.9
2-4 August 2015, Durban, South Africa
ISBN 978-0-620-67120-0
page 213
-10
0
Growth rate (%) 10 20
30
Figure 2 Economic Infrastructure Investment for Selected Sectors in Ethiopia 1992 - 2010
1990
1995
2000 Year GDPg TIIg
4.
2005
2010
EIIg RIIg
EMPIRICAL RESULT AND ANALYSIS
4.1 Economic growth and investment in economic infrastructure In recent years, public investment has become a major driver of economic growth in Ethiopia where the equivalent of two-fifth of total economic activity is linked to public sector activity (Access capital, 2011). Table 2 indicates that Ethiopia has the highest capital expenditure share in Government spending among African countries. There was a change of government system in Ethiopia in 1992 where the country's economic policy was changed from command economic system towards more free and market oriented system. During the government system before 1992 the average economic growth rate was 1.86% which indicates the unsatisfactory performance of the economy. Due to this major structural change this study focuses only on the economic performance after 1992.
Proceedings: 9th Built Environment Conference
2-4 August 2015, Durban, South Africa
ISBN 978-0-620-67120-0
page 214
Table 2 Capital expenditure in 10 largest African Economies 2011 (Access capital, 2011) Country Capital Expenditure Total Government Percent of Total (USD mln) Expenditure (USD mln) Expenditure Ethiopia 4,103 6,849 59% Tanzania 2,045 5,686 36% Kenya 2,899 9,175 32% Ghana 1,973 6,681 30% Zambia 1,224 4,432 28% Cameroon 1,271 4,693 27% Angola 8,543 33,330 26% Nigeria 6,887 27,307 25% Ivory Coast 686 4,718 15% South Africa 3,383 135,321 25%
After the change in government system total government spending to GDP ratio increased continuously in the late 1990s. The Ethio-Eritrean war during 1998 to 2000 has affected the economy as the government had to direct portion of its capital budget to war related expenses. However, as depicted in Figure 2 and Table 1, beginning from 2004 the country has registered a remarkable two digits economic growth with a corresponding capital expenditure. 4.2 Stationary time series tests Augmented Dickey-Fuller (ADF) unit root test was conducted to determine if the variables considered in study depict stationary time series. Results of the unit rate test is presented in Table 3. Table 3 ADF unit root test for road, electric and telecommunication infrastructure investment and economic growth Variable T-Statistic ADF critical ADF critical ADF critical Null Hypothesis: value 1% value 5% value 10% Series has a unit root GDPg -4.735 -3.750 -3.000 -2.630 Rejected RIIg -4.394 -3.750 -3.000 -2.630 Rejected TIIg -4.373 -3.750 -3.000 -2.630 Rejected* EIIg -4.326 -3.750 -3.000 -2.630 Rejected The symbol * indicates that TIIg is stationary at first difference I(1).
4.3 Granger causality tests The ADF test showed that the three variables namely GDPg, RIIg and EIIg are stationary at level and variable TIIg stationary at first order allowing use of VAR to conduct Granger causality test. Thus equations 1 and 2 are
Proceedings: 9th Built Environment Conference
2-4 August 2015, Durban, South Africa
ISBN 978-0-620-67120-0
page 215
specified for each of the three causality tests with a corresponding lag length of 4. Granger causality test results are presented in Table 4 below. According to the test result, of the six hypotheses presented only the null hypothesis that road infrastructure investment growth doesn't cause GDP growth is rejected at 5%. This indicates that road investment Granger causes GDP growth but not vice versa. Table 4 Pairwise Granger Causality Tests between Economic Growth, Road Investment Growth, Electricity Investment Growth and Telecommunication Investment Growth Null Hypothesis RIIg does not cause GDPg GDPg does not cause RIIg TIIg does not cause GDPg GDPg does not cause TIIg EIIg does not cause GDPg GDPg does not cause EIIg
F-Stat 9.77
df 4
Prob > F 0.0085
Decision Rejected
0.72597
4
0.6054
Not rejected
4.5007
4
0.0508
Not rejected
1.7029
4
0.2666
Not rejected
2.0345
4
0.2084
Not rejected
.09743
4
0.8697
Not rejected
The result further shows that telecommunication infrastructure investment and electricity infrastructure investment growths do not Granger cause GDP growth and vice versa. 5.
CONCLUSION
Researches both on theoretical and empirical aspects of economic infrastructure support the notion that investment in economic infrastructure drives economic growth. This is particularly true in developing countries where economic development is entangled with acute poverty, illiteracy, limited access to communication services, lack of health and energy facilities. Empirical result of this study through Granger causality tests for the period from 1992 to 2010 shows that there is a strong one way causal relationship between growth in investment in road infrastructure and economic growth running from the former to the latter. Apparently, no causal link was found between economic growth and growth in investment in the other two infrastructure sectors. Investment in road infrastructure appears to be the main driver of economic growth in Ethiopia given the current economic structure and level of development. Ethiopian economy largely relies on agriculture where
Proceedings: 9th Built Environment Conference
2-4 August 2015, Durban, South Africa
ISBN 978-0-620-67120-0
page 216
80% of the population depend on subsistence agriculture. As agricultural products needs to be transported to the urban areas the importance of access to transportation is vital. Ethiopia doesn't currently have functioning railway systems and transportation activities are heavily dependent on road network systems. This is coupled with the fact that Ethiopia is landlocked country with its major import and export activities largely relied on the road transportation system to and from the nearby seaports in Djibouti, Kenya and Somaliland. This support the findings of this study that investment in road infrastructure has a strong causal relationship with economic growth. On the other hand, the very weak or no causality link between economic growth and investment in electricity and communication indicates that the service and manufacturing sectors of the economy need to be developed more. It is also an indication that more investment needs to be put in electricity and communication to spur the country's economic growth. REFERENCES Access capital, 2011. Ethiopia: Macroeconomic Handbook 2011/12, s.l.: Access Capital Research. AfDB; OECD; UNDP, 2014. African economic outlook, s.l.: AfDB, OECD, UNDP. Briceño-Garmendia, C., Estache, A. & Shafik, N., 2004. Infrastructure Services in Developing Countries: Access, Quality, Costs and Policy Reform, Washington DC: World Bank Policy Research Working Paper 3468. Calderon, C. & Serven, L., 2004. The effects of infrastructure development on growth and income distribution. Washington: World bank policy research working paper. Casey, S., 2005. Establishing Standards for Social Infrastructure, Ipswich, Queensland: The University of Queensland. Dissou, Y. & Didic, S., 2013. Infrastructure and Growth. In: J. Silber, et al. eds. Infrastructure and Economic Growth. New York: Springer, pp. 5-45. Enimola, S. S., 2010. Infrastructure and Economic Growth: The Nigeria Experience, 1980–2006. Journal of Infrastructure Development, 2(2), pp. 121-133. Estache, A., 2008. Infrastructure and Development: A Survey of Recent and Upcoming Issues. In: F. Bourguignon & B. Pleskovic, eds. Rethinking Infrastructure for Development. Washington DC: The World Bank, pp. 4782. Fay, M., Toman, M., Benitez, D. & Csordas, S., 2011. Infrastructure and Sustainable Development. In: S. Fardoust, Y. Kim & C. Sepúlveda, eds. POSTCRISIS GROWTH AND DEVELOPMENT; A Development Agenda for the G-20. Washington DC: The World Bank, pp. 329-382. Foster, V. & Morella, E., 2011. Ethiopia’s Infrastructure: A Continental Perspective, Washington: The International Bank for Reconstruction and Development / The World Bank.
Proceedings: 9th Built Environment Conference
2-4 August 2015, Durban, South Africa
ISBN 978-0-620-67120-0
page 217
Kayode, O., Babatunde, O. A. & Abiodun, F., 2013. An empirical analysis of transport infrastructure investment and economic growth in Nigeria. Social Sciences, 2(6), pp. 179-188. Kumo, W. L., 2012. Infrastructure Investment and Economic Growth in South Africa: A Granger Causality Analysis, Tunis: African Development Bank. Lin, M. L., 2005. Strategies and ecological engineering considerations. Journal of Ecotechnology, 1(1), p. 9–28. Miller, J. D., 2013. Infrastructure 2013: Global Priorities, Global Insights. Washington: Urban Land Institute. Myres, D., 2013. Construction Economics: a new approach. 3rd ed. London, Newyork: Routledge. Online Etymology Dictionary, 2015. Online Etymology Dictionary. [Online] Available at: http://dictionary.reference.com/browse/infrastructure [Accessed 9 May 2015]. Oxford University Press, 2015. Oxford Dictionaries. [Online] Available at: http://www.oxforddictionaries.com/definition/learner/infrastructure [Accessed 9 May 2015]. Prud’homme, R., 2005. INFRASTRUCTURE AND DEVELOPMENT. Washington, The World Bank and Oxford University Press. Rodriguez, F., 2007. Have Collapses in Infrastructure Spending led to Cross-Country Divergence in Per Capita GDP?. New York: United Nations Department of Economic and Social Affairs. Romp, W. & Haan, J. d., 2005. Public capital and economic growth: a critical survey. In: A. Rless, ed. EIB PAPERS. s.l.:Farrah Baut-Carlier EIB Graphic Shop, pp. 40-70. Sahoo, P. & Dash, R. K., 2009. Infrastructure development and economic growth in India. Journal of the Asia Pacific Economy, 14(4), pp. 351-365. Sahoo, P., Dash, R. K. & Nataraj, G., 2010. Infrastructure development and economic growth in China. Chiba, Japan: Institute of Developing Economies. Srinivasu, B. & Rao, P. S., 2013. Infrastructure Development and Economic growth: Prospects and Perspective. Journal of Business Management & Social Sciences Research (JBM&SSR), II(1), pp. 91-91. Straub, S., Um, P. N. & Vellutini, C., 2009. Infrastructure and Economic Growth in the Middle East and North Africa, s.l.: The World Bank. The World Bank Group, 2008. SUSTAINABLE INFRASTRUCTURE ACTION PLAN :FY 2009-2011, Washington DC: The World Bank. The World Bank, 1994. World Development Report 1994: Infrastructure for Development, New York: Oxford University Press. United Nations Human Settlements Programme, 2011. Infrastructure for Economic Development and Poverty Reduction in Africa, Nairobi: UNHABITAT. World Economic Forum, 2014. The Global Competitiveness Report 2014– 2015, Geneva: World Economic Forum.
Proceedings: 9th Built Environment Conference
2-4 August 2015, Durban, South Africa
ISBN 978-0-620-67120-0
page 218
ASOCSA2015- 023
The use of real-time energy data in the establishment and financing of energy efficient smart building in South Africa D. Hayman, C. Loggia, V. Tramontin
[email protected],
[email protected],
[email protected] University of KwaZulu-Natal, School of Engineering, Property Development Programme, Howard College Campus, 4041 Durban, South Africa ABSTRACT AND KEYWORDS Purpose of this paper: This paper aims at critically analysing the existing single-agent model approach towards energy supply and sustainability, while highlighting the dual role of Microgrid development in reducing payback periods of retrofit solutions while enabling an overall reduction in grid complexity. Design/methodology/approach: The research combines a theoretical approach based on the available literature and industry input, along with a developing case study based on migration of an existing factory in Durban to a Microgrid. Findings: Microgrid adoption for the case building has a resultant minimum decrease of 11.5% of total energy spent with a potential 36.8% decrease, providing accelerated payback periods for renewable production and storage technologies with further potential for grid interaction Research limitations/implications Current regulatory restrictions towards energy export prohibit economic justification to an extent. Practical implications: The greatest design challenge is how to make socio-economic systems compatible with social imperatives and boundaries, whilst enabling coevolution with the socio-technical system of energy supply, active agents within the energy grid have the ability to enhance this co-evolution. What is original/value of paper:
Proceedings: 9th Built Environment Conference
2-4 August 2015, Durban, South Africa
ISBN 978-0-620-67120-0
page 219
The focus is on enhancing Energy Efficient measures via developing a new multi-agent system approach model, based on increased coordination through Micro-grid development. Keywords: Sustainability, smart grid, Microgrid, Interdependency, multi- agent system
1. INTRODUCTION Energy is an integral part of any developing economy; linked to poverty alleviation, job creation, economic growth, socio–economic progression and environmental health. As a social responsibility of the Government, Energy and its supply are explicitly linked to the enhancement in the standard of living for the population at all income levels. The challenges faced, and solutions, are both interdependent and integrated. Government often prefers integration to high degrees of interdependency, which is clearly demonstrated in the current crop of energy policies and action plans promulgated. In governmental terms, increased energy integration carries with it the connotation of the opening up and expansion of trade in energy supply on the side of the state, with the gains from supply enhancing economic welfare. Increased energy interdependence has the consequence of creating more independent trade partners (South African citizens or municipalities) increasing the risk of financial instability and reducing economic gains. This favouring of integration on the part of the state through the form of a single-agent system reduces the “transparency” of the energy market while increasing overall control (Appelman, 2014). However, levels of integration and interdependency need to be balanced and carefully coordinated in order to avoid the reduction of government’s ability to react to energy or financial crises through the implementation of national policies or action plans. The type of system within which these policies are shaped, plays a significant role in attaining sustainability. However the current single-agent system is inherently highly complex in nature, due to the centralized agent lacking the ability to create coordination among solutions when dealing with fixed complex tasks (Zlot and Stentz, 2006). The present research is part of an on-going project focused on enhancing energy efficient measures via developing a new multi-agent system approach model, based on increased coordination through Microgrid development. This paper seeks to critically analyse the existing single agent model approach towards energy supply and sustainability perspectives, highlighting the dual role that Microgrid development has in reducing payback periods of retrofit solutions, while enabling an overall reduction in grid complexity with a corresponding reduction in associated risk.
Proceedings: 9th Built Environment Conference
2-4 August 2015, Durban, South Africa
ISBN 978-0-620-67120-0
page 220
2. BACKGROUND A complex system is a system consisting of multiple agents, arranged in structures which can exist at multiple scales and whose process of change is not reducible and describable at only one level of explanation or scale. In a socio-techno system of energy use solving the complex system or understanding the underlying complexity is reliant on drawing in the knowledge base from multiple disciplines in order to understand the dynamic relationships present at the micro and macro level. This distinction between the micro and macro levels requires an altered approach when attempting to research the complex relationships present. With micro level complexity revolving around behavioral rules and the macro level incorporating environmental constraints, in the form of institutional, spatial and structural parameters, advocating an ontological perspective approach to researching and understanding not just the complex system but the underlying causes of the complexity represents a paradigm shift from the norm. This ontological viewpoint is often in conflict with the epistemological viewpoint, in which there is no clear agreement on how the micro and macro levels interact and thus how emergent properties develop or affect each level. With energy use and the quest for sustainable development being an intrinsically social problem, this disagreement means that developing an understanding of the socio technical system is heavily reliant on our views towards the research itself along with the affect our decision making process has on the socio economic environment. This intrinsic openness with regards to the potential for varying interpretations on the externality of the world itself and of the micro and macro components of the complex system neatly highlights the potential inherent within the framework of a complex setting if the correct knowledge is present when attempting to embrace such a system. An energy model needs to address climate related issues as well as having an interrelated focus on energy security and affordability. The shift from rigid linear policies detailing a stepwise process towards attaining sustainability, in favor of a non-linear dynamic complex method, allows for the development of an environment in which an individual is able to optimally participate within the energy framework. This shift in thought turns the idea that the collective is a cognizing agent, into the collective consisting of cognizing agents, representing what is fundamentally a shift from the macro towards a description of the micro level based on causative assumptions and complex characteristics such as emergence and selforganization. Facilitating the development of an adaptive, evolving complex energy system is reliant on a multitude of conditions drawn from an understanding of multiple theories in particular views from the Economic, psychological, sociological and educational theories are foreseen as being the best possible means of attaining sustainability. Each theory holds a
Proceedings: 9th Built Environment Conference
2-4 August 2015, Durban, South Africa
ISBN 978-0-620-67120-0
page 221
different view on what energy use is, however this complexity allows for a multiplicity of possible outcomes, each with not necessarily a negative outcome however each lacking the possible best case scenario. The term “outcome” is used over “solution” as ultimately the idea of a solution is fundamentally flawed in that there will always be a better scenario, particularly when dealing with the issue of sustainability. A nice representation of this is in the view that humans within a complex system will with time develop complex thoughts to their views of sustainability of future generations to that of a positive change in their overall environment. One commonality among the four branches is the development of the idea of what an individual is and how they position that individual within a system. There are two distinctly different scenarios with varying effects of outcomes. Scenario one: an energy user is conceived as an individual. And, in particular, an individual who is rational in his choice and in the actions and manners towards other individuals. Their actions are seen as being a direct consequence of the information available, or the external and internal prompts exhibited on them. This guides his decision-making process ultimately resulting in the end action and the outcome of that action. In terms of the important characteristic of rationality, the individual has an interest in the outcome with a particular preference of the various alternatives and who will make a decision that fulfills those preferences. This has the direct consequence of opening up an individual to high levels of uncertainty due to the reliance on knowledge of initial conditions and multiple unknown strategies. Economic and psychological theories in general follow this view of what an individual is and represents what is in effect a linear model where the collective is a cognitive agent with its stimulus basis in the macro level (Newell, 2008). Scenario two: focuses more on the idea of interaction and not process, moving away from the moment of decision, towards how a decision can be made to be inevitable due to the interactions at multiple levels on the individuals, setting conditions within which a decision is formed. This scenario moves away from the idea of focusing on the individual towards a focus on the actors within the individuals systems, which set conditions shaping those individuals actions. Educational and sociological theories represent this view towards that which is non-linear, dynamic model based on the importance of the micro levels drivers (Newell, 2008). Microgrid adoption has the potential to combine these two distinctly different views, moving away from an individualist model of behavior in favor of socially oriented behavioral model, viewing energy use and sustainability as an inherently social problem (micro) with the ability to be
Proceedings: 9th Built Environment Conference
2-4 August 2015, Durban, South Africa
ISBN 978-0-620-67120-0
page 222
shaped and guided by the infrastructure (macro) setting however with the knowledge that this shaping of the micro level reciprocally alters the macro. 2.1 Sustainability in current thought A key component of neoclassical economic thought is the Rational Choice Theory (RCT) (Browning, Halcli and Webster, 2000). This method for the quantification and justification of benefits exhibits an inherent instrumental rationality relationship (working directly to a solution through the identification of problems) between state and individual. Energy use (and, as an offshoot, efficiency in the face of shortages or greater calls for sustainability) is a socially interactive decision making process. At the level of the individual, instrumental rationality fails as a consequence of the individuals holding only partial control of the outcomes (Jones and Zhang, 2003), because of a lack of clear understanding and assumptions of behavioural patterns of other individuals within the energy grid. In the current climate of calls for energy efficiency to prevent grid collapse, the inability of the individual to accurately determine their expected maximum utility’s levels, often prevent sustainability measures from taking root. This inherent problem in the current sustainability framework will require an alternative able to include the role of individuals. An alternative to enhance energy sustainability is the enablement of individual players in the grid (consumers of all levels) to anticipate other individual’s actions though rational and common knowledge assumptions. Energy supply and its subsequent use, is an inherently complex process to model and attempt to predict. Complexity is created through the many facets in the energy supply model (source, legislation, actors etc.) as well as the vast numbers of interconnections involved within the current grid. This is exasperated as the current grid model lacks an adequate degree of high-level technology adoption in order to map and track energy demand in real time and at every level of use. This in turn leads to a high level of non-transparency due the supply and demand levels not being able to be fully described and comprehended. This high degree of non-transparency inhibits sustainability efforts when spontaneous changes, weather in the grid itself or amongst the individuals linked to the grid, lead to a dynamic complexity that cannot be correlated or accounted for within the framework of energy sustainability actions. Neoclassical economics is driven by the assumption that humans are intrinsically self-interested (Stegman, 1985) as exhibited by rational choice theory, while we do not actively seek to harm others or in that we do not have an overriding level of conceitedness leading to care of ourselves above others. We do, however, have a unique sense of what the preferred state of order is, hence this self-interest governs our actions and opinions as well as how we account for these actions and opinions.
Proceedings: 9th Built Environment Conference
2-4 August 2015, Durban, South Africa
ISBN 978-0-620-67120-0
page 223
2.2 Complexity in Single Agent Systems (SAS) The current model of centralized control of energy production, supply and the policies, which govern it, are representative of a Single-Agent System (SAS). Sustainability, in all its forms, is a fixed complex task, implying that a SAS approach is not optimal in that. On the contrary, using a multi-agent system approach (MAS) the level of complexity (when understanding the system) is reduced through distributing control among various interconnected agents. This division of control among various agents allows each agent to in effect become a simpler version of a single agent, in that no one agent is able to complete a task on their own, and instead completion relies on the collective contribution of multiple agents in achieving a task. A brief definition of an agent is important to go forward: “An agent is anything that can be viewed as perceiving its environment through sensors and then having the ability for action” (Russell, Norvig and Davis, 2010). The current SAS does not imply the non-existence of other independent agents. A SAS models itself, the environment and the interaction within the system, the Single agent entity is naturally a component of the system, however it is assumed that the single agent is also an independent agent with its own goals, actions and knowledge (extra-environmental components), while other independent agents may exist, there are not modelled as having goals, action, knowledge etc. and are modelled as only being part of the environment. 3. RESEARCH CRITERIA AND METHODOLOGICAL APPROACH This paper aimed at critically analysing the existing model towards energy supply and sustainability through a literature review. Formulating the framework for which a complex multi-agent model can be adopted, embracing the inherently dynamic environment in which energy supply and subsequent use exists within. The literature review dealt with providing an alternative through the development of a complex system embracing behavioural characteristics, cultivating coordination within the framework of a higher knowledge base allows for previously segregated agents to effectively contribute to their own sustainability as well as the collectives. The scope of the case study used, is investigating the pure economic benefit for the building owner in establishing a Microgrid. This does not aim to exclude the other benefits associated with Microgrids, however, it provides the basis for commercial adoption. The case study involved potentially establishing the Microgrid through consultation with eThekwini electricity and relevant renewable companies. Data was captured through, installing (temporarily) a meter to capture energy data. The findings were then presented to the building owner with the aim of adoption. Discussions post data gathering, gave insights into the decision process that an individual goes through, prior to coming to a conclusion on a subject such as sustainability of energy supply.
Proceedings: 9th Built Environment Conference
2-4 August 2015, Durban, South Africa
ISBN 978-0-620-67120-0
page 224
4. MICRO-GRID DEVELOPMENT IN ETHEKWINI Micro-grids are discrete energy systems able to operate parallel with or independently from the main grid providing autonomous capabilities with the security of grid backup (General Microgrids, 2013). This autonomy is accomplished, but not reliant on, Distributed Energy Resources (DER). DER are localized modular small-scale power sources which provide energy locally at the point of use. This includes; generation, storage and demand management (Electric power research Institute, 2014). The most common type of micro grid is a “true” or “customer” Microgrid (μgrid) (Berkely Lab, 2014). Microgrids are self-governed and independently owned and maintained by a private entity of any size or scale. The municipalities’ responsibility ends at the Point of Common Coupling (PCC). From the PCC onwards an “island” effect can be created allowing those connected to the PCC to run independently from the grid, if so desired, as well as allowing no disruption to the grid or surrounding utility users in case of system failure. The definition of a Micro-grid does not hint at a size prerequisite in order to be defined as a Micro-grid, instead it highlights two key areas. The first being that is a locally controlled load, and secondly it is able to act independently of the grid. These two characteristics of microgrids are convenient as they conform directly with, provided they are engineered to spec, Durban’s current energy regulations and guidelines. While this “independence” from the grid is not a fully achieved separation, it has the effect of creating a platform for energy independence, along with grid interactivity and the potential for financial return in the form of buy back and reduced usage charges. This synchronicity, in light of ever increasing national energy shortfalls has great benefits in allowing a reciprocated approach to energy usage, i.e. grid draw when available and if needed and μgrid supply to the common grid in times of low grid reserves or shortfalls and when economic viability is exhibited. Microgrid adoption creates a platform for users to take control of energy production and supply, in essence allowing a previous end user to become a power producer, breaking the linear traditional energy model that exists in the country.
4.1 The case study: a factory in the eThekwini Municipality (Durban) The case study incorporated a relatively small Microgrid (μgrid), which was developed and conceptualized with the primary focus on reduction of business-operating cost, through enabling the building owner to take control of his energy environment, thus making the business more cost competitive in the current market place. This solely focused on the benefits or a singe building and did not focus on the cooperative potential between neighbouring buildings of differing but potentially mutually beneficial energy use. In this case study there are two agents: Agent one being the DO
Proceedings: 9th Built Environment Conference
2-4 August 2015, Durban, South Africa
ISBN 978-0-620-67120-0
page 225
(eThekwini municipality) and Agent two being the factory owner/ μOP. Development was initially proposed in three stages 1. Stage one: Solar Adoption 2. Stage two: Chemical storage 3. Stage three: Microgrid Adoption Justification on financial grounds for agent two was the initial basis of the study, however this approach to justification proved to be a barrier to adoption (see discussion section)
4.1 Current supply models The current supply model has the municipality as the sole supplier and biller of energy to the end user. This exposes the end-user to various charges involved in the supply and use of that energy. The primary charge (above the energy cost) being a 22.5%voltage surcharge to step the voltage supply down from 11kVA to a usable 400v. That surcharge is calculated on the total bill (including all network demand charges) this charge is as a result of equipment cost and maintenance. With around 35% of the total energy costs being related to supply charges above actual electricity costs, this is an area that is often overlooked in energy efficiency measures as it does not provide any direct environmental benefit and investment does not provide any production capacity. .
Figure 4.1: Current grid connection
Proceedings: 9th Built Environment Conference
2-4 August 2015, Durban, South Africa
ISBN 978-0-620-67120-0
page 226
Figure 4.2: Proposed model
The new proposed model (as outlined in Fig.4.2) has the municipality as the bulk supplier, and the end-user as the secondary supplier and provider of energy to the separate sub meters in the building that supply the tenants. This has numerous advantages. First of all, an immediate reduction in monthly electricity bills of 11%, in itself would be sufficient to justify an investment. Secondly, the building owner can actually become a supplier of electricity; this allows the owner to take advantage of the two different pricing structures. Supply is at T.O.U tariff, while sub supply is at B.N.G. This allows the building owner to in essence charge a premium of on average 25c per kWh for the sub meters. Thirdly, the adopted solar plan has the effect of allowing the building owner to take advantage of the lower T.O.U tariff, while receiving payback from the solar electricity at the higher B.N.G rate. Furthermore, if the owner wished to supply back to the grid he is now able to currently at the same rate that Eskom supplies the local municipality. This provides greater flexibility and predictability for income form a solar retrofit and battery storage adoption, reducing overall risk and increasing the probability of sustainability The financial potential for renewable adoption in the Microgrid setting is represented in the table 4.1.
Proceedings: 9th Built Environment Conference
2-4 August 2015, Durban, South Africa
ISBN 978-0-620-67120-0
page 227
Table 4.1 Financial potential for renewable energy alternative scenarios Solar
Solar and chemical storage
Solar, chemical storage and tariff retrofit
Chemical storage and tariff retrofit
Capital costs [R]
1 404 000
3 904 000
4 004 000
2 600 000
Current energy costs
>15 years
5.6 years
3.2 years
2.6 years
12.5% year on year increase in energy costs
7.5 years
3.1 years
2.4 years
2.2 years
CO2 offset/ year
77tons
77 tons
77tons
77tons
Savings per year (worst case)
114300 5.2%
407000 18.5%
809 000 36.8% savings
490500 22.3%
Combined approach discounted payback periods
Financial Risk
Moderate due to nature of investment in renewables
Moderate due to nature of investment in renewables
Low due to short payback periods and the inclusion of renewables
Very Low due to short payback periods and high rate of return on investment
Benefit of investment
Low due to capital tie up versus monthly savings
Moderate due to capital tie up versus monthly savings
Very high, short payback period, significant savings an the investment in renewables ensures long term sustainability
Very high, short payback period, high savings coupled with low capital investment risk
5. RESULTS AND DISCUSSION Microgrid development was proven to be justifiable on economic grounds, reducing payback periods while providing an income potential which previously was not evident. This increased economic potential enables sustainability measures to be a less risky idea for business thus enhancing the probability of success through the associated reduction in risk. A 2.4-
Proceedings: 9th Built Environment Conference
2-4 August 2015, Durban, South Africa
ISBN 978-0-620-67120-0
page 228
year payback period with a reduction of 36.8% in energy bills, will significantly alter the business ability to compete in light of rising energy costs in the short term this reduction of risk and decrease in payback periods can provide justification for future adoption of increased renewable production. This adoption will enable a new enhanced level of knowledge to develop within the grid and its users. This will have a corresponding reduction in complexity, as the single agent system will be replaced with a multi agent system. This reduces sustainability’s success to a sum of its parts versus being reliant on the whole. Providing the individual with an identity promotes enhanced sustainability thinking in that actions have consequences for one self as these actions not incrementally diminished or altered by the collective inaction. 6. CONCLUSIONS AND RECOMMENDATIONS Microgrid potential is clearly evident for an individual or business. However, this benefit can be extended to the collective if accurate and real-time data is used to coordinate energy usage and renewable production. Allowing seamless energy export to the grid at a higher net rate then is currently afforded will further enhance the viability for renewable production promoting higher levels of investment in renewable generation and storage. This production can be used to supplement current supply deficiencies or in the long run can be used to replace the need for further non-renewable production means. This decentralized approach allows energy produced to be consumed in the same special frame, enhancing efficiency further as well as providing further incentive and control for municipalities to safe guard themselves against future shortfalls in supply. Future studies need to focus on creating Microgrid communities where interests are aligned in such a way that renewable production and storage are optimised, allowing the Microgrid to exist solely using off-peak grid power while being a net energy producer in peak periods. This approach will provide energy security and financial risk reduction for the individual as well as allowing sustainability goals being achieved via a combination of individuals benefiting the collective as a whole, thus accelerating sustainability success through the use of multiple agents’ actions. 7. REFERENCES Altman, Morris, 2008, Behavioral Economics, Economic Theory and Public Policy. Australasian Journal of Economic Education, p. 50, Available at SSRN: http://ssrn.com/abstract=1536853 Appelman, J., 2014, Green ICT & Energy. CRC Press. Berkeley Lab., 2014, Types of Microgrids. Retrieved 2014, from Microgrids at Berkeley lab: https://building-microgrid.lbl.gov/types-microgrids
Proceedings: 9th Built Environment Conference
2-4 August 2015, Durban, South Africa
ISBN 978-0-620-67120-0
page 229
Browning, G., Halcli, A. and Webster, F., 2000, Understanding contemporary society. Theories of the present. (pp. 126-139). London: SAGE Publications Ltd. Electric power research Institute, 2014, Distributed energy resources. Retrieved November 2, 2014, from EPRI: http://www.epri.com/OurWork/Pages/Distributed-Electricity-Resources.aspx General Microgrids, 2013, General Microgrids. Retrieved November 12, 2014, from General Microgrids: http://www.generalmicrogrids.com Jones, M. and Zhang, J., 2003, Which is to blame: Instrumental rationality, or common knowledge? Behavioural and Brain Sciences, 26(02). Russell, S., Norvig, P. and Davis, E., 2010, Artificial intelligence. Upper Saddle River, NJ: Prentice Hall. Soshinskaya, Mariya; Crijns - Graus, Wina; Guerrero, Josep M.; Vasquez, Juan C., 2014, Microgrids : Experiences, barriers and success factors Renewable and Sustainable Energy Reviews, volume 40, pp. 659 – 672 Stegman, T., 1985, On the rationality of the rational expectations hypothesis. Australian Economic Papers, 24(45), pp.350-355. The Department of Energy, 2010, Medium Term Risk Mitigation Plan (MTRM) for Electricity in South Africa ‐ 2010 to 2016. Medium Term Risk Mitigation (MTRM) Project Team. Zlot, R. and Stentz, A., 2006, Market-based Multirobot Coordination for Complex Tasks. The International Journal of Robotics Research, 25(1), pp.73-101 Prelec, Drezen., 1991, Consuming At The Wrong Rate: Lessons From The Harvard Game. Drezen Prelec. 1st ed. Oxford: Oxford University Press, 2015. 1-15. Web. 23 May 2015. Pollitt, M, and Shaorshadze I., 2011 'The Role Of Behavioural Economics In Energy And Climate Policy'. Cambridge working papers in economics, Available at https://www.repository.cam.ac.uk/bitstream/handle/1810/242021/cwpe11 65.pdf;jsessionid=44474CE00566D172A7E0FF1AFA227EB3?sequence= 1 Newell, C, 2008. The class as a learning entity (complex adaptive system): An idea from complexity science and educational research. Simon Fraser University,[Online].2,8-10.Available at:http://journals.sfu.ca/sfuer/index.php/sfuer/article/viewFile/31/44 [Accessed 20 May 2015].
Proceedings: 9th Built Environment Conference
2-4 August 2015, Durban, South Africa
ISBN 978-0-620-67120-0
page 230
ASOCSA2015-067
INCORPORATING RISK MANAGEMENT INTO THE DESIGN PROCESS TO REDUCE RISKS ASSOCIATED WITH BUILDINGS ADAPTIVE REUSE
Ayman A. E. Othman1 ,Farah I. H. Balaha2 Ferdinand Fester3 and Theodore Haupt4 Architectural Engineering Department, Faculty of Engineering The British University in Egypt (BUE) El Shorouk City - Cairo Suez Desert Road Postal No. 11837 - P.O. Box 43 Tel.: (+202) 26890000 University of Johannesburg South Africa 011 5596051 University of KwaZulu Natal Durban South Africa 031 2602712 E-mail1:
[email protected] E-mail2:
[email protected] E-mail3:
[email protected] E-mail4
[email protected]
ABSTRACT Purpose This paper aims to develop a framework to incorporate Risk Management (RM) into the design process as an approach towards reducing risks associated with building adaptive reuse. Design/methodology/approach To achieve this aim, a research methodology is designed to achieve four objectives. Reviewing literature related to the design process, adaptive reuse of buildings, RM and flexible design. Presenting and analysing three case studies to investigate the opportunities and risks associated with adaptive reuse.
Proceedings: 9th Built Environment Conference
2-4 August 2015, Durban, South Africa
ISBN 978-0-620-67120-0
page 231
Investigating the perception and application of RM’s incorporation into the design process as an approach for reducing risks associated with adaptive building reuse. Proposing a framework to facilitate the integration of RM into the design process.
Findings There are many risks associated with adaptive building reuse. However, despite all the risks it has been proven that adaptive reuse is a better option than demolition. To minimize risks associated with adaptive reuse, RM needs to be incorporated early in the design process. Research Limitations This research focused on office buildings as the most likely type of buildings to adaptive reuse due to the dynamic business environment. Practical Implications Incorporating RM in the design process will help developing flexible design that overcomes the risks associated with adaptive building reuse. Originality / Value Although, RM is well research area, its integration into the design process received scant attention in construction literature. This research highlights its role towards overcoming risks associated with adaptive building reuse, a novel approach for achieving sustainability in construction. Keywords: Risk Management, Design Process, Flexible Design, Building Adaptive Reuse, Office Buildings. 1 Introduction The design process is concerned with delivering projects that satisify clients’ needs and users’ requirements. Risk managemnt is usually used to identify and analyse the risks that may affect the construction of the project and therefore, develop proper response to mitigate their impacts (Smith, 1999). Due to the dynamic nature of the business environment, clients’ needs and users’ requirements may change over the time and the project is no longer beneficial to them. This necessiates demoliting the project or reusing it with its existing structure in order to extend its life cycle while perfroming a new function (Othman et al., 2004). Although, adaptive reuse of buildings is a widely adopted practice worldwide, it’s a costly and time consuming process that is associated with a multitude of risks. Literature review showed that futuristic risks resulted from changes in clients’ needs and users’ requirements is not commenlly considered during the design process. Adopting a flexible design approach that considers futristic changes will help in minimizing the long term risks by allowing for efficient and effective adaptive reuse of projects (Balaha and Othman, 2015). This paper aims to develop a framework that incorporates RM into the design
Proceedings: 9th Built Environment Conference
2-4 August 2015, Durban, South Africa
ISBN 978-0-620-67120-0
page 232
process as an approach towards reducing risks associated with building adaptive reuse. 2 Research Objectives and Methodology To achieve this aim, a research methodology consisted of literature review, case studies and survey questionnaire is designed to achieve four objectives: a) Building a comprehensive background about the research topic including design process, adaptive reuse of buildings, RM and flexible design. b) Presenting and analysing three case studies to investigate the opportunities and risks associated with adaptive reuse. c) Investigating the perception and application of RM’s incorporation into the design process as an approach for reducing risks associated with adaptive building reuse. d) Proposing a framework to facilitate the integration of RM into the design process. 4 Literature Review 4.1 The Design Process The phases of the design process according to Royal Institute of British Architects are (RIBA, 2013): 1) Preparation Identify the needed to develop initial project brief. Examine site information Prepare feasibility study Determine Client's risk profile, agree on project programme. Assemble project team 2) Concept Design Outline of proposed project strategies. Agree on initial project brief and develop a final one. Review procurement strategy, finalize design responsibility. Prepare project manual and construction strategy. 3) Develop Design Prepare developed design. Prepare and submit planning application. Implement control procedures for change. Review construction strategy. 4) Technical Design Technical design information. Performance specified work, integrate specialist subcontractor. Prepare building regulations submission. Review construction strategy. 5) Specialist Design Progress specialist design by subcontractors. Take actions for procurement strategies or building contract.
Proceedings: 9th Built Environment Conference
2-4 August 2015, Durban, South Africa
ISBN 978-0-620-67120-0
page 233
4.2 Adaptive Reuse of Buildings 4.2.1 Definition and importance “Adaptive reuse” is the process of modifying and adapting obsolete buildings to perform a new function (Burton, 2014). It is generally about reusing a building with its existing structure to extend its life cycle whist performing a new function. This is currently practiced worldwide, specifically when the building has a unique architectural character and still in stable condition (Bullen, 2007). The extension of building’s life cycle has many downsides as it causes various technical problems when reuse is considered. Technical changes need a very high level of renovation and refurbishment. In most cases this requires the involvement of innovative solutions that can be undertaken despite the range of constraints that are faced by both the design and construction teams. Experience shows that adaptive reuse avoids the demolition of old buildings that still have energy embedded in them as demolition is a waste of resources and the cost of re-constructing is very high (Burton, 2014). 4.2.2 Benefits and Barriers of Adaptive Reuse The benefits of adaptive reuse of buildings are (Bullen, 2007). Less use of resources, energy and emissions. Expanding the life cycle of buildings. Increasing the cost effectiveness. Recovering energy embodied in buildings over a large period of time. Giving value to resources of the community from properties that are not productive. Stimulating vacant neighborhoods. Decreasing consumption of land and urban slump. Giving a better aesthetic appearance to the built environment. Enhancing the demand for preserved existing buildings. However, Adaptive reuse has its barriers as follows Bullen (2007): The assumed perception that adaptive reuse of existing buildings is more expensive and less creative than new construction. Economic benefits are not clearly explained to by clients. Extensive and costly maintenance and refurbishment required for obsolete buildings can’t match with new buildings performance and meet sustainability standards. Difficulty with availability and price of matching existing materials; and inability to maintain the structural integrity of older buildings. 4.3 Risk Management 4.3.1 Risk and Risk Management “Risk” is the possibility of a threat to occur and cause damages, which can be avoided by using preventive actions. The two main features of risk are the chance of a certain hazard to occur and its consequences that will in turn have an impact on other aspects of the project. RM is a process used to identify, assess and prioritize risks of different types. Accordingly, the risk manager must start planning for the
Proceedings: 9th Built Environment Conference
2-4 August 2015, Durban, South Africa
ISBN 978-0-620-67120-0
page 234
minimization or elimination of the negative consequences of risk (Institute of Risk management, 2002). 4.3.2 Risk Management Process 4.3.2.1 Risk Identification Risk identification is a diagnostic process in which all the potential risks that could affect a construction project are identified and investigated, thus enabling the client understands the potential risk sources at an early stage in the project life cycle. This will help clients concentrate on strategies for the control and allocation of risk (Shen, 1999). Different methods are used in risk identification. They are brainstorming, historical data, checklist, tree diagram, and influence diagrams (Hamilton, 1997; Smith, 1999). 4.3.2.2 Risk Analysis Risk analysis aims to evaluate risks and ascertain the importance of each risk to the project, based on an assessment of the probability of occurrence (Likelihood) and the possible consequence of its occurrence (Severity). Risk = Likelihood x Severity Loss/Gain (Balfour Beatty, 2000). Risk analysis assesses both the effects of individual and combined risks on the project objectives. Risk analysis provides a project risk profile that the client can use to look ahead to possible future events and see the probability of those events to occur. The client can then decide whether or not to invest in the project, or adopt specific strategies for dealing with the major risks. Two techniques are used for risk analysis namely, quantitative risk analysis and qualitative risk analysis (Shen, 1999; Raftery, 1994). 4.3.2.3 Risk Responses As all projects are unique and risks are dynamic throughout the project life cycle, it is necessary to formulate a risk response strategy. The information gained from the identification and analysis of risks gives an understanding of their likely impact on the project. This enables an appropriate response to be chosen. Typically there are three main types of responses to risks: to avoid or reduce the risks, to transfer the risks or to retain the risks (Shen, 1999; Smith, 1999). Risk Avoidance or Reduction This strategy is usually performed during the earlier stages of the project, which allows the client to take a preventive action to avoid or reduce risks as early as possible. Rejecting a proposal is an obvious way of avoiding risks. Other approaches include detailed design review, further geographical / geotechnical investigation, more detailed study of the project environment, the use of alternative contractual agreement, closer co-ordination with the project team or the application of different technology or construction method (Shen, 1999; Smith, 1999). Risk Transfer This strategy involves transferring the risk from one part to another, without changing the total amount of risk in the project. Risk transfer can occur between the parties involved in the project or between one party and an insurer. The decision to transfer
Proceedings: 9th Built Environment Conference
2-4 August 2015, Durban, South Africa
ISBN 978-0-620-67120-0
page 235
or allocate risk to another party is implemented through an insurance policy or the conditions of contract. There are several factors that need to be considered before any risk transfer. First, the capability of the party whom the risk is being transferred to manage the risk and accept the consequences of risk transfer. Second, consideration is whether or not the risk premium that would have to be paid for the transfer of a risk is greater than the cost of the consequences (Shen, 1999; Smith, 1999).
Risk Retention In some situation the only option available is to retain a risk. The party that is holding a risk might be the only one that can manage the risk or accept the consequences. It is normal for the client to be left with some risks and these are termed residual risks (Shen, 1999; Smith, 1999). 4.4.4 Risks of Adaptive Reuse Endangering authentic fabric The core principle of adaptive reuse is to conserve the authentic pattern of the building, however this can be threatened. During the process of adaptive reuse, internal and external changes are made to the building. These changes could be intentional or unintentional. The intentional changes are made as a sacrifice for adapting the building to a new function, while unintentional changes are those due to errors during the planning and execution phases as a result of wrong site interpretation. Economic obstacles The requirement for conservation usually increases the cost of construction and operation. Moreover, the cost of maintenance of any old building is high no matter how the refurbishment is adequately done. Conservation of sites located in cities with massive pressure of redevelopment and high land prices has a high cost. A heritage consultant stated that adaptive reuse is a very expensive investment, if people only count the economic return and overlook the intangible non-economic values (Yung, 2012). Other economic obstacles include the low revenue and high energy cost of obsolete buildings and unavailability of materials required for conservation (Douglas, 2006). Functional disorder There is nothing that will ensure that the adapted building will meet the requirements of the new function it needs to perform. As the building typology of buildings built hundred years ago will make it hard to perform functions in the existing spatial configuration. There are also some restrictions regarding changes in layout and heights to be minimum. However, they will not be satisfactory to users as it will not meet their needs. This explains why design adaptation has many problems during its operation, specifically in adoptions that have a large and medium scale (Yung, 2012). Environmental impacts
Proceedings: 9th Built Environment Conference
2-4 August 2015, Durban, South Africa
ISBN 978-0-620-67120-0
page 236
The amount of contribution of old buildings to the surrounding townscape is usually neglected. Therefore, it is not necessary that the adapted building contributes to the improvement of the external environment. Furthermore, the appearance is another factor to be considered as it may not be enhanced, and also the energy efficiency of the building might decrease. Also the compatibility of the use with the surrounding buildings might not be suitable, as the adapted building may have a different density, nature and produce more waste. Mostly the environmental aspects of adaptive reuse are related to the efficiency in energy consumption and the performance of the building (Yung, 2012). Technical and legal difficulties The extent to which the adaption procedure will overcome the lack of good performance is not guaranteed. This is because some buildings might have defects that are difficult to resolve and will cost a lot. It is hard for some old buildings to fully comply with the new building regulations. Some constraints may concern construction and cause lack of accessibility to the public. Moreover, the standards used nowadays by designers are greatly different than those used long time ago. This may cause many obstacles to the adaptive reuse of buildings. Planning is also an issue that will rise, as the land use in the area is specific for a function and cannot be changed, this restraint will act as a limit to the adaptation of the building. Other constraints include license requirements along with planning requirements in order to get approved by the concerned authorities (Yung, 2012). Conflicting stakeholders’ interests The process of adaptive reuse is interdisciplinary, therefore it is dynamic, interesting and complicated. The stakeholders of the adaptive reuse process are those who spend their time, knowledge and resources on it. Some of them are clients, local community, developers, government officials, architects, contractors, engineers, planners and specialists in historic preservation. Coordination between the stakeholders during the various stages of the process with the different elements is vital and cannot be avoided. This can cause the process to be a potential nightmare, as it is hard to coordinate people to do the correct tasks at the given time. However, the lack of coordination and suitable communication between the stakeholders may cause delays and the process will not be completed on time (Yung, 2012). Social considerations There are many circumstances were the adaptation of old buildings raise many objections about the appropriateness of the new function to the existing community. Usually financial aspects are given more attention than social aspects. Redevelopment on the large scale usually creates a new touristic attraction when it comes to heritage buildings. Uncontrolled social changes are caused by gentrification and upgrading of projects. The correct balance in social diversity is a very important aspect; however it is usually overlooked by the rules and regulations. On the other hand, adaptive reuse projects that are on a small scale do not have an effect on the social life of the community (Yung, 2012).
Proceedings: 9th Built Environment Conference
2-4 August 2015, Durban, South Africa
ISBN 978-0-620-67120-0
page 237
Losing sense of place and identity Most clients are mainly concerned with the profit they will gain from changing the function of their obsolete properties to meet the market demand. However, the extent of the change might cause the building to lose its historical origin and identity. Some buildings that are adaptively reused only have their external skin left intact, where the sense of place inside it is completely destroyed. Due to the difficulty in tracing the connection of the place to the people living in, users prefer keeping the building as it is and are against the concept of adaptive reuse as well as the concept of renovation (Yung, 2012). 4.4 Design Flexibility 4.4.1 Definition of Flexibility and Adaptability Flexibility is mainly assumed to be responding adaptively to uncertainty regarding the environment. To be more specific, it is the extent to which a system can react and change with the minimum period of time, cost and performance loss. Therefore, it may be considered as designing a system proactively and not a system that has a reactive behavior. Adaptability has also been defined as the ability and flexibility as the competence. As capabilities are extracted from competences, adaptability is derived from flexibility (Gosling et al., 2008). 4.4.2 Forms of flexibility A building is usually needs to offer two fairly diverse forms of flexibility namely modifiability and service flexibility. Modifiability mainly focuses on the ability of a building to adapt to any change that may occur throughout its life cycle. Service flexibility has to do with the capability of a building to operate with different uses and functions according to the changing needs of the society. This type of flexibility can be enhanced in the design stage of the project. This can be done through different ways such as spaces with multipurpose that can be adjusted according to the need (Gosling et al., 2008). 4.4.3 Characteristics of a Flexible Design A flexible building is a building that has been designed to allow easy rearrangement of its internal fit out and arrangement to suit the changing needs of the occupants. Adaptability is capable of different social uses and flexibility as capable of different physical arrangements. The following definitions are used: Adaptable building is a building that has been designed, constructed and maintained with thought of how it might be easily altered to prolong its life, for instance by addition or contraction, to suit new uses or patterns of use. Flexible building is a building that has been designed to allow easy rearrangement of its internal fit out and arrangement to suit the changing needs of occupants (Gosling et al., 2008). 5 Case Studies 5.1 Adaptive reuse of 15 buildings in the Netherlands This case study discusses the adaptation of 15 office buildings to housing buildings in Netherlands. These buildings were constructed during the period between 1999
Proceedings: 9th Built Environment Conference
2-4 August 2015, Durban, South Africa
ISBN 978-0-620-67120-0
page 238
and 2011 (see figure 1). Findings showed that the main reason for their adaptation is that they were vacant office buildings and there is a tight housing market. The risks of adaptation that faced the client were: The specific architecture features that affect the opportunities and risks of adaptive reuse. The structural grid of office buildings acts as a barrier as it does not allow for the installation of partitions as there are too many columns. The facade, as office buildings are usually designed with a modern facade that incorporates curtain walls. On the other hand there are a number of opportunities that support the conversion process as follows: The load bearing capacity of office building is an opportunity to adaptive reuse as usually office buildings are designed withstand loads higher than those of residential buildings. The large number of elevator shafts. In any other type of building these shafts might not all be needed therefore this is seen as an opportunity to be used for HVAC and plumbing systems. This case proved that adaptive reuse is a better option than demolition and that it is widely used nowadays. Secondly, it showed the need for flexible designs and RM in the early stages of design (Remoy, 2014).
Figure(1) Building before and after conversion (Remoy, 2014)
5.2 Adaptive Reuse of Office Building in Massachusetts This case study investigates the adaptation of 30-40 square foot office building into an elderly housing project. This tests the practical and financial viability of the project. Two case studies are examined, they are both located in metro-west market of Boston Massachusetts. Site issues and cost of adaptive reuse were examined along with the development and renovation criteria. The process of conversion started with examining literature about elderly housing and interviewing developers and architects associated with elderly housing. Then two prototypical office buildings were chosen for the study, one was rectangular and the other was square. They were analyzed for the suitability of the redesign from the aspects of unit configuration, location and
Proceedings: 9th Built Environment Conference
2-4 August 2015, Durban, South Africa
ISBN 978-0-620-67120-0
page 239
financeability. A cost analysis was performed to compare the adaptive reuse to constructing new wooden frame buildings. Finally, the two buildings were compared to each other to identify the ease of redesign when considering all necessary factors. Analysis showed that: Rectangular buildings are easier to be adapted than square buildings as they allow for proper circulation and division of rooms that allows for natural ventilation and natural lighting. The systems used for air conditioning. It was found that water to heat pump is better when adapting a building than variable air systems. Also having a central system that cannot be adapted to be controlled from different units acts a huge barrier. A building having square windows is better than having rectangular ones as square windows can be easily adapted. Lastly a general aspect is that bigger buildings are easier to adapt.
ure (2) Medway Road Case study and East main street Case study (James,1992)
5.3 Standard Adaptable Office Buildings in Netherlands This case study first studies the cost of building new office buildings, then the cost of constructing them with enhanced elements to help ease the reuse in the future. This case study was based on a study of the legal, technical and financial feasibility of adaptable offices, aiming to respond to the following questions: “Which initial measures should be met in order to develop adaptable office buildings, and which costs and benefits are associated with these interventions?” (Hilde, 2011). The main focus was on two standard types of office buildings and how their transformation potential can be increased. First is the central core tower and second is the single corridor slab (see figure 3). The process followed was firstly analyzed literature review about transformation possibilities of office buildings. Then 15 expert interviews were conducted including architects, project developers, structural engineers and mechanical engineers. Then two projects developed for adaptability were examined. Adaptability was then studied according to the findings and how it can be applied to the two types of buildings. Finally, calculating the building cost and the total initial cost of standard and adaptable office buildings. Analysis showed that: The building's adaptability depends on its structure and on the amount of separation between its layers.
Proceedings: 9th Built Environment Conference
2-4 August 2015, Durban, South Africa
ISBN 978-0-620-67120-0
page 240
A set of rules concerning the construction, facade, circulation and extendibility have been studied. The main findings showed that the façade grid height should be a multiple of 1.8 meters and width of 7.2 meters. Another aspect concerning construction is the columns on the facade that can allow for future changes in the facade. Monolithic post stressed floors help in the future adaptability as they allow for making new shafts if needed. The central core type has the most suitable technical measures applied.
ure (3) Central Core Plan and Single Corridor Slab (Hilde,2011 6 Data Analysis Results of a survey questionnaire conducted by the authors with 20 architectural design firms in Egypt to investigate their perception and application of RM incorporation into the design process as an approach for reducing risks associated with adaptive building reuse showed that (Balaha and Othman, 2015). The main driver for adaptive reuse is achieving sustainability objectives of reducing waste in materials, resources and satisfying users’ needs. The most frequent risk is the financial risk as it is caused by all the other risks, while the most important benefit is enhancing the demand for the building. Adaptive reuse is a better option than demolition as stated in case studies and users are willing to use adapted buildings. Design flexibility can help in reducing the risks of adaptive reuse, therefore it is highly recommended. RM can help in improving adaptive reuse. It can be used during the planning and conceptual stage and then followed along with the design process to assess and prioritize the future risks. 7 A Framework to Integrate RM in the Design Process. Findings of literature review, case studies and survey questionnaire, showed that many risks are associated with adaptive reuse. These include: financial, economic, environmental and functional along with many other risks. However, despite all the risks it has been proven that adaptive reuse is a better option than demolishing the building. Therefore, the process of adaptive reuse is most of the time vital. However, for it to be effective and efficient it must be accounted for early in the design stage of the building. This can be done through incorporating RM into the design process. This will help achieving flexible design that take into consideration futuristic changes
Proceedings: 9th Built Environment Conference
2-4 August 2015, Durban, South Africa
ISBN 978-0-620-67120-0
page 241
that will take place in the future. Example of consideration include having an open plan buildings or modular building that can have its internal fit rearranged easily. Along with taking into consideration the structure system not being very rigid and allows for flexibility. Mostly focusing on applying flexibility throughout all the design aspects along with applying the principles of the RM process. As this will lead to minimizing the future risks that the building may face during the adaptive reuse process. Therefore, extending the building's life cycle and saving it from demolition in order to meet the principles of sustainability by decreasing the environmental and economic impact, (see figure 4).
Figure (4) Framework to incorporate RM in the Design Process 8 Conclusions and Recommendations Having reviewed literature review and case studies and keeping in mind the results of the survey questionnaire, the research comes to the following recommendations. 8.1 Recommendations for Design Firms Integrating the RM process with the design process from the beginning for it to be proactive not reactive. Focus on reducing the financial risks of adaptive reuse by decreasing the other types of risk that cause an increase in cost along with minimizing the time needed for adaptive reuse. Properly identify the market needs in the specific location as the most important benefit of adaptive reuse is enhancing the demand for the building. Therefore, the function needed by the market is what the building should be adapted to. Applying design flexibility in the design: Focus on applying layers approach in the design: divide the building into a modifiable part and a permanent part. Have a facade that can be easily altered by using columns on the façade that accommodate for different changes. Use a structural grid to be used for different functions. Use a central core design, which has all the elevators and shafts centralized.
Proceedings: 9th Built Environment Conference
2-4 August 2015, Durban, South Africa
ISBN 978-0-620-67120-0
page 242
Do not use heating and cooling systems that are for the whole building and cannot be controlled separately. Use square windows as they are easily adapted. Use a slab type that can allow for extra shafts to be added. Consider increase in the load bearing capacity. 8.2 Recommendations for the Government The government plays an important role in enhancing the adaptive reuse process by helping in saving time needed for paper and legal work which will help in reducing the costs as the more time needed to adapt the building the more it will cost. Therefore the government needs to ease the process of getting the legal agreement for adapting a building as long as it is being adapted to a new function that will be beneficial to the community. This will lead to reducing both the legal and financial risks of adaptive reuse. References Balaha, F. and Othman A.A.E. (2015). Design Flexibility as an Approach for Reducing Risks Associated with Office Building Reuse in Egypt. International Conference on Industry Academia Collaboration, 6-8 April 2015, Cairo, Egypt. Online Available from: https://www.researchgate.net/profile/Ayman_Othman. Balfour Beatty. (2000) Group Framework for Risk Management. Balfour Beatty Group. Bullen, P.A. (2007),"Adaptive reuse and sustainability of commercial buildings", Facilities, Vol. 25, No. 1/2 pp. 20-31. Burton.B (2014). "Adaptive Reuse of commercial buildings" Building Science Forum, Retrieved from: http://www.monstercommercial.com/adaptive-re-use-of-commercialbuildings/ Gosling, J, Naim, M, Sassi, P, Iosif, L and Lark, R (2008) "Flexible buildings for an adaptable and sustainable future". In: Dainty, A (Ed) Procs 24th Annual ARCOM Conference, 1-3 September 2008, Cardiff, UK, Association of Researchers in Construction Management, 115124. Hamilton, A. (1997). Management in Projects: Achieving Success in a Changing World. London: Thomas Telford. Hilde. R (2011). "Adaptable office buildings", Property management, Vol.29. Iss 5, pp.443-453. Institute of Risk management. (2002). " A risk management standard" Retrieved From: http://www.theirm.org/media/886059/ARMS_2002_IRM.pdf James.L. (1992). "Reuse and redesign of Suburban office buildings into elderly housing" Retrieved from: MTI libraries Othman, A.A.E., Hassan, T. M., and Pasquire, C.L. (2004) Drivers for Dynamic Brief Development in Construction. Engineering, Construction and Architectural Management Vol. 11, Issue 4, pp. 248-258. Raftery, J. (1994) Risk Analysis in Project Management. London: E & FN SPON. Remøy, H. T. & Vander Voordt, D.J.M. (2014), "Adaptive reuse of office buildings: opportunities and risks of conversion into housing". Building Research & Information 42:3, 381390. RIBA. (2013). "RIBA Plan of work".Retrieved from:http://www.architecture.com/Files/RIBAProfessionalServices/Practice/FrontlineLetters/RI BAPlanofWork2013ConsultationDocument.pdf Shen, L. Y. (1999) Risk Management. In: Best, R. and Valence, G. D. Building in Value: PreDesign Issues. New York: John Wiley & Sons Inc. Smith, N. J. (1999) Managing Risk in Construction Projects. Oxford: Blackwell Science Ltd.
Proceedings: 9th Built Environment Conference
2-4 August 2015, Durban, South Africa
ISBN 978-0-620-67120-0
page 243
Yung, E. H., & Chan, E. H. (2012). "Implementation challenges to the adaptive reuse of heritage buildings: Towards the goals of sustainable, low carbon cities." Habitat International, 36 (3), 352 – 361.
Proceedings: 9th Built Environment Conference
2-4 August 2015, Durban, South Africa
ISBN 978-0-620-67120-0
page 244
ASOCSA2015-066
A Review on Information Interface Management in Construction Design Process – Importance, Challenges and Management Methods Senthilkumar Venkatachalam* and Saleh Abu Dabous
[email protected];
[email protected] Department of Civil and Environmental Engineering, University of Sharjah, United Arab Emirates. ABSTRACT Purpose of this paper The construction industry has undergone significant changes during the 21st century. Innovative techniques such as supply chain management, total quality management and lean production principles have been applied to improve the execution phase of the construction projects, as it consumes a major part of the project cost. The paper outlines the different types of design interfaces and its interactions through a thorough literature review. Further, it reports the possible solution methods which are reported in the literature to effectively manage the design interfaces. Design/methodology/approach An interpretive research philosophy is used through archival research strategy. An inductive research approach is used in the current study to implement the above said research strategy in the study. The data collected through the published research on the design management around the globe in various design domains are critically reviewed. Findings Until recently, design was given low priority in the overall project planning, since it contributes less to project cost. However, many research studies reported that the significant part of rework in construction projects is design related. Information management plays a significant role in the management of interfaces during the design process. Understanding the various types of design interfaces and its interactions is important to design a suitable information interface management methods
Proceedings: 9th Built Environment Conference
2-4 August 2015, Durban, South Africa
ISBN 978-0-620-67120-0
page 245
Research limitations/implications (if applicable) The research is limited to the design management of construction projects only. Also less rigor in terms of the statistical justifications of the findings as this is a review paper. Practical implications (if applicable) The findings can be considered while designing the systems for the multidisciplinary design management process in infrastructure projects. The findings will assists in terms of introducing the relevant risk management strategies to avoid the adverse effect on the overall project outcome during execution. Keywords: Multi-disciplinary, Design process, Rework, Delay, Revision
1. Introduction A process is a sequence of steps that transforms a set of inputs into outputs (Ulrich and Eppinger, 2004). Design is the act of designing, which process the information by the various domains involved in it (Austin et al., 2001). Typically, design is driven by the three domains, 1. People (otherwise social), 2. Product (otherwise spatial) and 3. Process (otherwise temporal). These domains are strongly related and bind together through various dependencies (Bradley and Yassine, 2008; Tilstra et al., 2009a). Dependency relationships among these design entities characterise the design processes. The dependency relationships are characterised by the interaction types. These interactions introduce the dependencies among the process entities. Kusiak et al. (1999) have identified the dependencies among the various process entities as follows 1. Information dependency, 2. Technological or causal dependency 3. Common-sense or pragmatic dependency 4. Resource dependency 5. Preferential dependency and 6. Functional / structural dependency. Among these, the information dependency is the one which characterises the design process of any domain (Eppinger, 2001). Hence understanding the behaviour of these information dependencies can help to plan the design process effectively. The information dependencies have been classified in many ways. Typically it can be classified as independent, dependent and interdependent (Eppinger, 2001; Yassine, 2004). Another research study classified dependency relationships as direct, indirect, inner and cross dependency for the development of generic design process model (Wang and Jin, 1999). Yassine et al. (2008) classified information flow in two perspectives as internal and external with respective to its source as well as stationary and dynamic with respect to its temporal behaviour. From the review it is evident that the information dependencies have multiple
Proceedings: 9th Built Environment Conference
2-4 August 2015, Durban, South Africa
ISBN 978-0-620-67120-0
page 246
dimensions and complex as mentioned above. Hence the management of these multi-dimensional information flows become challenging. The paper has six sections, understanding the importance of information flow in the design process is paramount important and is discussed in the next section. The third section outlines the design process in construction projects followed by the interface management practices in construction projects in section four. To manage the same there exist, design interface management/ design process modelling tools, the tools around the world on managing the design processes are discussed in section five. The summary reports the literature findings on managing the design process in construction, its challenges and the possible solutions reported.
2. Importance of Information Flow in Design Process Design is generally iterative in nature because of information dependencies among design activities (Eppinger 2001; Oloufa et al., 2004). In addition, owners ofmodern day projects are keen on reducing total developmental time of projects. Concurrent engineering becomes the first choice for reducing the developmental time. This utilizes overlapping of design activities, hence requires incomplete and uncertain design information or assumptions. Each of the assumptions/ incomplete information creates a potential risk on the design process (Yassine et al., 2008) for iterations. In most instances these assumptions made at the initial stage undergo revision/ rework as the design progresses. Failure to communicate and update these shared assumptions results in knock-on effect also in the downstream design processes (Loch and Terwiesh, 2005). Further, mistakes and omissions made during the information transfer would also result in error, rework and delays (Keys et al., 2000; Assaf et al., 1995). These errors demand frequent design changes in projects (Fazio et al., 1998). These changes creates iteration in the design process especially when the activities have interdependent information flow among them (Koskela et al., 1997; Eppinger, 2001; Oloufa et al., 2004). These iterations may add value or diminish the value of the design. Based on the value which the iteration generates, it is classified as positive or negative (Ballard 2000). Another classification of iteration is based on its existence as – planned iteration and unplanned iteration (Eppinger, 2001; Browning, 2003). The iteration which is identified and used for design improvement before it gives impact to the design is classified as planned iteration. The iteration generated by the error is called unplanned iteration. From the literature, it is evident that poor management of these iterations and its information flow may create rework, error, delay and poor quality in the design process. Hence management of these iterative information flows is inevitable in modern multi-disciplinary design.
Proceedings: 9th Built Environment Conference
2-4 August 2015, Durban, South Africa
ISBN 978-0-620-67120-0
page 247
Figure 1 Influence line diagram of design process flow 3. Design Process in Construction Projects Construction design is different from the design process in other domains by three ways: 1. Project uniqueness 2. Resources uniqueness and 3. Environmental uniqueness (Austin et al., 2001). Further, the construction industry is characterized for its fragmented nature and its information intensive processes. These complexities haven’t produced adverse effect as the traditional project execution follows a sequential path. However the management of these complexities in the modern projects are challenging as it is executed in a concurrent manner. Figure 1 shows the influence of modern day’s concurrent construction projects due to the various factors which are interrelated. Now, construction companies have realized importance of design management and the fact that it is generally done through informal procedures. As a result, current design management practices are characterised by uncertain input information, poor information flow, poor information management, inadequate documentation, unbalanced resource allocation, lack of coordination between disciplines and variable decision making (Koskela et al., 1997; Hammond et al., 2000). These results in delay, rework, cost overrun, material waste, quality deficiency, productivity reduction, construction rework reduced stakeholder’s satisfaction etc (Palaneeswaran, 2006). Many of these inefficiencies in the design process can be eliminated through a structured information management system. Further, the uniqueness of each construction projects and its participants makes the design process complex and iterative. Scattered project
Proceedings: 9th Built Environment Conference
2-4 August 2015, Durban, South Africa
ISBN 978-0-620-67120-0
page 248
participants and concurrent execution of modern design projects further increase the complexity of the design process modelling. This creates a need for a collaborative management framework to the successful on time in budget completion. 4. Interface Management in Construction Projects Interface management involves the integration of various project management sub-areas or of the various technical disciplines participating in the project. Interface Management deals with inter-face issues through the management of common boundaries between people, systems, equipment, or concepts. However, it did not receive enough attention in project management for a long time (Nooteboom 2004; Chen et al 2006). This resulted in a variety of interface issues, such as mismatched parts, dimensional errors, systems performance failures, coordination difficulties, assembly conflicts between sub-contractors/trades, etc (Chen et al 2006). These problems necessitate Interface Management as a critical component for the success of construction projects (Pavitt and Gibb, 2003; Nooteboom 2004). The interfaces are categorized in many ways based on its context, starting from 1. Internal and External, 2. Physical, Contractual and Organizational (Pavitt and Gibb, 2003), 3. Intrinsic, Discipline and Project wide interfaces (Critsinelis, 2001), 4. Functional interfaces (Lann et al., 2000) 5. Physical, Functional, Contractual, Organizational, and Resource (Chen et al., 2006). According to Chen et al.(2006), accurate information modelling is very important in all the categories of the interfaces during the design process. In another study, Chua and Godinot (2006) have listed five functional aspects for any interface management, 1. Interface definition, 2. Visibility, 3. Communication, 4. Control and 5. Response to interface issues. Hence there is a need for a structured design interface management methodology which can create coordination, negotiation, assumptions, agreement and compromise on the design information among the design activities and the participants in modern construction projects.
5. Design Process Modeling Tools The design process modeling tools range from simple pen and paper to complex PC based tools. A Schedule is the expected outcome of any process modeling tool. Gantt Bar Charts have been used since the early 1900s (Melin and Whiteaker, 1981). However this representation cannot capture the relationships among the activities. The directed graphs were introduced to represent the directionality of the relationships. Despite being a useful representation of the
Proceedings: 9th Built Environment Conference
2-4 August 2015, Durban, South Africa
ISBN 978-0-620-67120-0
page 249
interactions within the design model, the directed graph/digraph does not aid the designer in identifying a sequence of activities (Whitfield et al., 2001). The network based planning techniques have been used since the 1950s (Fondahl, 1980). The well-known examples for the network based techniques are the critical path method (CPM) (Kelley and Walker, 1959) and the program evaluation review technique (PERT). Although the network techniques incorporate more information than the digraph, they are modelled with a one way progression along the paths ignoring iterations and feedback loops, which are the characteristic features of engineering design (Eppinger, 2001). The graphical evaluation and review technique (GERT) (Moder et al., 1983) in an improved version of the network based techniques. Further, DeMarco (1979) developed Data Flow Diagram (DFD). This method has four basic constructs: process (function), data or information flow, data store, and an external entity used as a source of data flow. This has been developed to model the software development process. The applicability of the same in construction process demonstrated by Abou-Zeid and Russell (1993). A Petri net is another graphical tool which can also incorporate the feedback loops and can provide a clear picture of activity sequences and resources (Petri, 1962). The application of Petri net in construction processes was demonstrated in some studies. (Sawhney, 1999). The stochastic dynamic design planning is done through Discrete Event simulation (DES) also. The application of DES produces an alternative solution to the complex dynamic construction systems and design operations (Lu, 2003). The modelling of the same is difficult for the designers as it involves rich probabilistic input data. The Design Structure Matrix (DSM) developed by Steward (1981) is an effective tool to represent the information flow and understand the relationships among the entities in the design process (Lindemann, 2009; Yassine, 2004; Steward, 1981). DSM can be formulated at various levels such as component, people, activity and parameter (Browning, 2001). It has been proven by many researchers that DSM method drastically reduces the design process time of multi-disciplinary projects that involves excessive iterations (Yassine et al., 2008). DSM provides a simple compact and visual representation of a complex system that facilitates novel solutions to decomposition and integration problems (Browning, 2001). The applicability of the DSM methodology in construction design has been tested by VTT in Finland (Huovila and Seren, 1998), Loughborough University (Austin et al., 1999), University of California (Tuholski and Tommelein, 2008) and IIT Madras (Maheswari and Varghese, 2005). Another matrix based method is called Domain Mapping Matrix (DMM). The DMM concept is based on Design Structure Matrices. But where DSMs model interdependencies within one domain, e.g. components, activities or people, the DMM models in the same way dependencies between domains, e.g. requirements vs design parameters,
Proceedings: 9th Built Environment Conference
2-4 August 2015, Durban, South Africa
ISBN 978-0-620-67120-0
page 250
components vs cost. This results usually in rectangular matrices (Danilovic and Browning, 2007). The DSMs and DMMs can then be used to model whole systems consisting of multiple domains, each having multiple elements, connected by various relationship types. This is called a Multiple Domain Matrix (MDM). MDM allows analyzing a system’s structure across multiple domains, condensing each single analysis into one DSM that represents multiple domains at a time (Lindemann, 2009).However, the implementation of the Matrix based DSM and its allied methodology faced challenges as capturing the interactions at various levels find difficulties. Another most widely used approach is based on the parametric modelling technique called Building Information Modeling (BIM). BIM is an object-oriented CAD system used in AEC sector. This can build a total building with the intelligent building objects. All data from the design and construction is stored in a digital dynamic 3D model. This can be shared or updated at any point of time. In addition, these 3D models are interrelated and the impacts of change or update are communicated to the dependent parameters and parties. Further, the critical information about the design data is readily available; hence the design related decisions can be made quickly. Though the methodology is good for the effective coordination capabilities, it’s mainly used as a visualization tool (Senthilkumar, 2014). Further, the applicability of the same is faced with challenges, such as the management of people, process and technological interfaces and many strategies are devised and are currently investigated to materialise the BIM implementation and maximize the project success through better information interface management.
6. Summary Design is a process of information exchange among various design domains and is generally iterative in nature, especially when multiple disciplines are involved. Poor management of these information exchanges will results in rework, error and delay. The modelling of information exchanges can improve the design process. Many research studies related to design process and its information flow have been done in various parts of the world. Further from the literature review, it is evident that there are many methodologies available for modelling the information flow in design processes. Among the available methods, it has been shown that the BIM and DSM methodology has potential to effectively manage the design process of various design domains. In recent years the BIM methodology is widely adopted than the DSM methodology. Though the DSM methodology was demonstrated for its applicability in construction projects, there is no widespread application; hence further investigation of existing DSM methodologies on the design process of construction is essential. However the potential to integrate the two methodologies are promising and may
Proceedings: 9th Built Environment Conference
2-4 August 2015, Durban, South Africa
ISBN 978-0-620-67120-0
page 251
complement each of the methodology in overcoming its inherent challenges.
7. References Abou-Zeid, A. and J.S. Russell, J. S (1993) Using Data Flow Diagrams to Study Communication Process between Construction Project Participants. Proceedings of 5th International Conference on Computing in Civil and Building Engineering, Anaheim, USA. June. Assaf, S.A., M. Al-Khalil, and M. Al-Hazmi (1995) Causes of Delay in Large Building Construction Projects, ASCE Journal of Management in Engineering, 11 (2), 45-50. Austin, S.A., A. Baldwin, J. Hammond, M. Murray, D. Root, D. Thomson, and A. Thorpe Design Chains – A handbook for Integrated Collaborative Design, Thomas Telford Publishing, UK, 2001. Ballard, G. (2000) Positive vs. Negative Iterations in Design. Proceedings of the 8th International Group for Lean Construction Conference, Brighton, England, July. Bradley, J. A. and A.A. Yassine (2008) A Multi-Domain Analysis Framework for Product Development. Proceedings of DETC ’08 ASME 2008 International Design Engineering Technical Conferences and 20th International Conference on Design Theory and Methodology (DTM), New York, USA, August. 1-12. Browning, T.R. (2003) PD Project Cost, Schedule, and Risk Management Using the Design Structure Matrix (DSM). Presentations Slides for Summary of Reworks in Knowledge Roundtable. Chen, Q., G. Reichard, and Y. Beliveau (2006) An Interface Object Model for Interface Management in Building Construction, Proc. of European Conference on Product and Process Modeling, September 13-15, Valencia, Spain, 119-126. Chua, D.H.K. and M. Godinot (2006) Use of a WBS Matrix to Improve Interface Management in Projects. ASCE Journal of Construction Engineering and Management, 132 (1), 67-79. Critsinelis, A. (2001) The Modern field development approach, Proc., OMAE 20th Int. Conf. on Offshore Mech. and Artic Eng., Rio de Janeiro, Brazil. Danilovic, M. and T. R. Browning (2007) Managing Complex Product Development Projects with Design Structure Matrices and Domain Mapping Matrices. International Journal of Management, 25, 300-314. DeMarco, T. Structured Analysis and System Specification. Prentice-Hall, 1979. Eppinger, S.D. (2001) Innovation at the Speed of Information. Harvard Business Review, 79 (1), 149-158. Fazio, P., O. Moselhi, P. Theberge, and S. Revay (1998) Design Impact of Construction Fast Track. Construction Management and Economics, 5, 195-208.
Proceedings: 9th Built Environment Conference
2-4 August 2015, Durban, South Africa
ISBN 978-0-620-67120-0
page 252
Fondahl, John. Network Techniques for Project Planning, Scheduling, and Control. Pp.442 – 471 In Frein, P. Joseph (eds.) Handbook of Construction Management and Organization. Van Nostrand Reinhold, New York, 1980. Hammond, J., H.J. Choo, S. Austin, I.D. Tommelein, and G. Ballard (2000) Integrating design planning, scheduling, and control with DePlan. Proceedings of 8th International Group for Lean Construction Conference, Brighton, England July. Huovila, P. and K.J. Seren (1998) Customer-Oriented Design Methods for Construction Projects, Journal of Engineering Design, 9 (3), 225–238. Kelley, J.E. and M.R. Walker (1959) Critical Path Planning and Scheduling. Proceedings of Eastern Joint Computer Conference, Philadelphia. December.160–173. Keys, A., A. Baldwin, and S. Austin (2000) Designing to Encourage Waste Minimization in the Construction Industry. Proceedings of CIBSE National Conference, CIBSE2000, Dublin, September. Koskela, L., G. Ballard, and V. Tanhuanpaa (1997) Towards Lean Design Management. Proceedings of 5th Annual Conference of the International Group for Lean Constrcution, Gold Coast, Australia, July. Kusiak, A., J. Wang, D.W. He, and C. Feng Engineering Design: Products Processes and Systems, Academic Press, San Diego, 1999. Lane, R. and G. Woodman (2000) Wicked Problems, Righteous SolutionsBack to the Future on large Complex Projects. IGLC 8, Brighton, UK. July. Lindemann, U. (2009) Technical DSM Tutorial last visited on 20/11/09. Loch, C. H. and C. Terwiesch (2005) Rush and be Wrong or Wait and be Late? A Model of Information in Collaborative Processes. Production and Operations Management, 14 (3), 331–343. Lu, M. (2003) Simplified Discrete-Event Simulation Approach for Construction Simulation Journal of Construction Engineering and Management, 129 (5), 537-546. Maheswari, J.U. and K. Varghese (2005) Project Scheduling using Dependency Structure Matrix. International Journal of Project Management, 23 (3), 223-230. Melin, J. W. and B. Whiteaker (1981) Fencing a Bar Chart. Journal of the Construction Division, Proceedings of the American Society of Civil Engineers 107 (3), 497–507. Moder, J.J., C.R. Phillips, and E.W. Davis, Project Management with CPM, PERT and Precedence Diagramming. Van Nostrand–Reinhold, 1983. Nooteboom, U. (2004) Interface Management Improves On-time, OnBudget Delivery of Megaprojects, JPT Online, Society of Petroleum Engineers. (http://www.aboutoilandgas.org/jpt/print/archives/2004/08/JPT2004_08_m anagement.pdf). Oloufa, A.A., Y.A. Hosni, M. Fayez, and P. Axelsson (2004) Using DSM for Modeling Information Flow in Construction Design Projects. Civil Engineering and Environmental Systems, 21 (2), 105-125.
Proceedings: 9th Built Environment Conference
2-4 August 2015, Durban, South Africa
ISBN 978-0-620-67120-0
page 253
Palaneeswaran, E. (2006) Reducing Rework to Enhance Project Performance Levels. Proceedings of One Day Seminar on Recent Developments in Project Management, Hong Kong, May. 5.1- 5.10. Pavitt, T.C. and A.G.F. Gibb (2003) Interface Management within Construction: in Particular, Building Façade. J. Constr. Eng. Mgmt. 129(1): 8-15. Petri, C.A. (1962) Kommunikation mit Automate., Ph.D. Thesis, Institut f ur Instrumentelle Mathematik, Bonn. Sawhney, A., O. Abudayyeh, and T. Chaitavatputtiporn (1999) Modeling and Analysis of Concrete Production Plant Using Petri nets. Journal of Computing in Civil Engineering, 13(3) 178-186. Senthilkumar. V (2014), A Study on the various possible policy frameworks for the effective adoption of Building Information Modeling (BIM) in South African Architectural Engineering and Construction (AEC), Proceedings of 8th Built Environment Conference, Durban, South Africa, August 2014. Tilstra, A., C. Seepersad, and K. Wood (2009a) Distributed Modeling of Component DSM. Proceedings of 11th International Design Structure Matrix Conference, DSM’09, Greenville, South Carolina, USA, October. Tuholski, S.J. and I.D. Tommelein (2008) Design Structure Matrix (DSM) Implementation on a Seismic Retrofit. Proceedings of 16th Annual Conference of the International Group for Lean Construction (IGLC 16), Manchester, UK. July. Ulrich, T.K. and S.D. Eppinger Product Design and Development. TATA McGRAW-HILL – India 2004. Wang, K. and Y. Jin (1999) Modeling Dependencies in Engineering Design. Proceedings of ASME Design Theory and Methodology Conference, Las Vegas, Nevada. September. Whitfield, R.I., A.H.B. Duffy, Z. Wu, and J. Meehan (2001) Intelligent Design Guidance. International Conference on Engineering Design ICED 03, Stockholm, Sweden. August. Yassine, A.A. (2004) An Introduction to Modeling and Analyzing Complex Product Development Processes Using the Design Structure Matrix (DSM) Method, Italian Management Review, 9. Yassine, A.A., S. Sreenivas, and J. Zhu (2008) Managing the Exchange of Information in Product Development, European Journal of Operational Research 184, 311-326.
Proceedings: 9th Built Environment Conference
2-4 August 2015, Durban, South Africa
ISBN 978-0-620-67120-0
page 254
ASOCSA2015 -71
Challenges of artisan skills development in the construction industry Makhetha L. Botsane1, Kahilu Kajimo-Shakantu2,
[email protected] [email protected] 1,2, Department of Quantity Surveying and Construction Management, University of the Free State. Tel. +27-514012248 1
ABSTRACT AND KEYWORDS Purpose of this paper The aim is to enhance development of artisan skills in the construction industry by investigating whether construction firms contribute to the development of artisans and to determine the barriers in the development of artisan skills which are perceived as hindrances to economic development of the country. Design/methodology/approach A survey was conducted among active construction firms in various categories from the CIDB register in Bloemfontein in the Free State Province, utilizing questionnaires. Findings The key findings suggest that small and medium construction firms struggle to put artisan mentorship structure in place because they focus primarily on firm survival and profit making therefore relegating mentorship programs as a second priority. Findings also reveal perceived poor practical knowledge by artisans, but with a relatively good implementation of mentorship programs among few larger construction firms. Research limitations/implications (if applicable) The empirical study was limited to a single province and therefore further research is recommended to include other geographic areas and a larger sample size.
Proceedings: 9th Built Environment Conference
2-4 August 2015, Durban, South Africa
ISBN 978-0-620-67120-0
page 255
Practical implications Artisan skills development is not always adequately addressed and its shortage in the construction industry compromises the growth of the economy and development. What is original/ value of the paper The paper contributes to the conference theme of skills shortages in the construction sector. Artisan skills shortage need to be addressed to contribute to industry development and promote economic development. Keywords; Artisans, construction development, mentorship.
firms,
intermediate
skills
1.INTRODUCTION Fourie (2012) highlights that the South African economic growth is under pressure from the lack or limited artisanal skills required to match the needs of the labor market to keep the economy competitive. The Institute for Management Development (IMD) (2010) ranks South Africa at number 58 out of fifty eight countries profiled with available skills for the labor market. Furthermore, Joint Initiative on Priority Skills Acquisition (JIPSA) (2006), National Skills Development Strategy III (NSD III) 2011 to 2016, and the National Development Plan (2012) identify the base of artisan skills as significantly scarce and critical in light of the shortages experienced in the labor market. The Act further defines an artisan as "a person that has been certified as competent to perform a listed trade in accordance with the Act” The Construction Industry Development Board (CIDB) (2007) reflects significant shortages of qualified artisans which is seen as a fundamental threat to the development and growth of South African economy. Similarly, CIDB (2007) highlight a shortage of experienced managers, engineers and supervisors within the category of critical skills. The reflection of shortages of technical skilled artisanal labor personnel at intermediate level is a great concern which poses a serious risk to the implementation of the public and private infrastructure investment programs in South Africa (JIPSA, 2006). According to Kraak (2005), intermediate and lower level skills are those skills which fall within level 1 and level 5 of the South African National Qualifications Framework (NQF). The aim of this study is to enhance development of artisan skills in the construction industry by investigating whether construction firms contribute to the development of artisans. The study also seeks to determine whether there are barriers in the development of artisan skills which are perceived as hindrances to economic development of the country.
Proceedings: 9th Built Environment Conference
2-4 August 2015, Durban, South Africa
ISBN 978-0-620-67120-0
page 256
2. LITERATURE REVIEW 2.1 Intermediate Skills Development within the South African Education Structure The DoE (1995) reflects the South African education system as having the National Qualifications Framework (NQF) which comprise the General Education and Training (GET) including primary to senior secondary education, Further Education and Training (FET) which comprises vocational and occupational education as well as training offered at colleges and Higher Education and Training (HET) which includes education offered at universities and universities of technology. DoE (2008) highlights the provision of skills development programmes through Sector Education and Training Authorities (SETAs) and provision of vocational education and training (VET), and post-literacy adult education and training through FET colleges. FET training and education comprise of three different paths namely; academic, vocationally orientated and occupation specific education (DoE, 2008). Vocational education refers to education which gives students knowledge and skills to enter into the economy. This is through provision of general, broad vocational orientation and general learning in essential areas such as Language and Mathematics (DHET, 2012). The DHET (2007) introduced the National Certificate which is vocational (NCV) through Public FET Colleges to try to solve the problem of poor quality and low relevance of NATED programmes and the chronic short supply of work placements available to private students, as well as the low technical and cognitive skills of FET graduates (DHET, 2010). A new program introduced in 2007 offered in 11 economic sectors which comprised: three engineering-related fields, five business aligned fields, and various other programs on information and communications technology, agriculture, tourism and hospitality. 2.2 Location of Intermediate Skills within the National Qualifications Framework (NQF) According to the Further Education and Training Act of (2008), FET means all learning and training programs which lead to a qualification from levels 2 to 4 of the National Qualifications Framework, as contemplated in the South African Qualifications Authority Act of (1995). These levels are regarded as above the general education below the higher education. Gamble (2003) identified four components within the Further Education and Training (FET) band which encompass provisions of education at level 2 to 4 within the NQF. These comprise public and private secondary schooling, public FET Colleges, private providers and industry-based centres (Gamble, 2003). The FET’s are a key mechanism in response to
Proceedings: 9th Built Environment Conference
2-4 August 2015, Durban, South Africa
ISBN 978-0-620-67120-0
page 257
the challenge of skills shortage (Akoojee and McGrath 2008). FET’s are appropriately placed to serve as access points into skills for less advantaged sectors, and as a response to the labour market needs. Their role as social and economic agents of transformation is therefore important. According to Kraak (2005), qualifications falling within level 1 to level 5 of the National Qualifications Framework represent the intermediate and low level skills which serve as prerequisite qualifications for an artisan in South Africa. Education Training and Development Practices Sector Education, and Training Authority (ETDP SETA) 2.3 Skills Demand Situation in the Construction Industry JIPSA (2006) indicates that South Africa had experienced an increase in infrastructure investment development since the beginning of 2003 which subsequently led to steady increase in the number of jobs. This also led to challenges of securing requisite skills which were reportedly to be lacking (JIPSA, 2006). Skills demand can be understood to refer to the private and public entities that seek to employ individuals based on the ability to perform efficiently and effectively a particular job. The national master scarce skills list of 2006 projected shortage of 40 000 artisans and in 2008 projected a shortage of 60 000 in the engineering and construction related skills. JIPSA (2006) estimated that 50 000 individuals with priority artisan skills will be needed by 2010 (JIPSA, 2006). The needed output translates to 12 500 artisans per annum or an additional 7 500 new artisans each year. The announcement of mega development projects in 2005 which included the Gautrain, the infrastructure development for the 2010 FIFA World Cup and government's R372bn infrastructure investment programme which was earmarked to contribute towards to already thinly spread skills demand across the country (CIDB, 2007). The government’s strong focus of the Expanded Public Works Programme (EPWP) on labour intensive construction also placed extra demands on qualified supervisors and managers (CIDB 2007). The increase in infrastructure development led to the increase in demand across all broad occupational categories. Moreover, it put more pressure on extraction and building trade workers who were 4,88 per cent than craft and other related trade workers who were averaged at 3,15 per cent (Department of Labour, 2008). However, the levels of training for artisans and other mid-level skills remain extremely low (Mukora, 2009). 2.4 Supply of Intermediate Skills in the Construction Industry The future prosperity and well-being of a country depends on how well it educates its citizens. The importance of focused and targeted skills development is a fundamental ingredient to support the development of any country. Skills supply can be understood as individual’s participation in the labour market with given endowments of human capital (Phillips,
Proceedings: 9th Built Environment Conference
2-4 August 2015, Durban, South Africa
ISBN 978-0-620-67120-0
page 258
2000).The National Skills Development Strategy III (NSDS III) has identified, among others, the following as key pressing challenges that are impacting on the ability of the South African economy to expand and to provide increased employment opportunities: inadequate skills levels and poor work readiness of many young people leaving formal secondary and tertiary education and entering the labour market for the first time. Continued skills shortage in the artisan, technical and professional fields is fundamental to the development and growth of the economy. Over-emphasis on NQF level 1-3 learnerships with insufficient progression towards more appropriate (intermediate and higher) skills is required for growth sectors in a knowledge economy (DHET, 2010). The skills challenge needs a broader understanding of South Africa is historic context which contributes towards There is a need to reflect the relationship interface of input and output between educational institutions in public sector and training providers in the private sector (Daniels, 2007). It is equally important to understand the difference between an Artisan and an Apprentice. An artisan is qualified via a Regulated formal assessment process viz Trade Test. Post level 4 An Apprentice is an individual who is in training to become an Artisan typically level 2-4 2.5 The Role of the Public FET College Sector in Skills Development Skills development is critical to the development of the economy of a country. The creation of jobs is a logical progeny of skills development and its role to strategically position the Public FET Colleges. Public FET Colleges need to be located within the broader context of the country’s developmental agenda (Financial and Fiscal Commission, 2013). Public FET Colleges need to target the unemployed or the underemployed youth as well as adults and others who need to update reskill and retrain to align to the changing economy of South Africa. The FET College sector in South Africa needs to be considered and publicized as a major contributor to the reduction of intermediate skills shortages in South Africa. According to the White Paper on post-school education released by DHET in (2013:11) "the key area of focus for expansion and skills development must be the public further education and training college sector.” The White Paper also highlights and alludes to the uncomfortable truth that the FET sector is small, weak and not up to the challenge presented by a burgeoning post-matric sector. The National Development Plan: Vision 2030 recommends that FET Colleges be developed in order to meet the required objective of contributing to producing at least 30 000 artisans a year. FET colleges cannot do this by themselves. The shortage of intermediate artisan skills exists alongside a massive expansion of FET College enrolments in engineering studies is a concern. In 2012, 46 272 learners were registered
Proceedings: 9th Built Environment Conference
2-4 August 2015, Durban, South Africa
ISBN 978-0-620-67120-0
page 259
for National Certificate (Vocational) (NCV) in Engineering fields, 38 116 in N1 to N3 (National Technical Education Diploma- NATED) programmes and 27 288 in N4 to N6 (DHET, Headcounts, 2012 2.6 Contribution of Construction Education and Training Authority in Skills Development For purposes of this study, it is important to understand that the CETA mainly supports the following categories of construction: Building construction and all related areas, Civil and roads construction and all related areas, Construction materials manufacturing, and Built environment professions. The sector skills plan of 2009/10 indicated that the CETA collaborated with eight HET institutions and was in the process of forging closer working relationships with FET Colleges. During that 2009/10 financial year, it also set an annual target of providing bursaries to 300 learners at FET institutions. In trying to lure more learners into construction, it also developed a manual or a guide document on learnerships in the sector which included a profile of careers, training providers and scarce and critical skills in the construction sector (CETA, 2009). The main challenge identified in the 2009/10 sector plan was a high drop-out rate and low pass rate for some scarce skills qualifications in the sector, particularly in the FET Colleges. The CETA also struggled to market and award bursaries to learners from rural areas. On average 1 817 learners wrote the three compulsory Level 2 vocational subjects for NC (V): Civil Engineering and Building Construction and achieved a pass rate of 44.5%.
3. RESEARCH METHODOLOGY 3.1 Research approach Data was collected utilising a questionnaire to identify the challenges of artisanal skills development in the construction industry. 3.2 Population The researcher targeted construction firms from the CIDB database based in Bloemfontein. The selected construction firms comprised only those who were active in the CIDB register of contractor statistics in 2014. Within the CIDB register of contractors, the registered firms were categorised according to their designation and class or grading. The designation in terms of grading contract amounts was in nine (9) categories which ranged between R0, 00 to R200 000 in the first category and from R130 000 000.00 to no limit in the last category. In order to accommodate all the
Proceedings: 9th Built Environment Conference
2-4 August 2015, Durban, South Africa
ISBN 978-0-620-67120-0
page 260
categories and to ensure acceptable spread of firms, a minimum of two construction firms per category was selected. Based on this sampling criteria, participating construction organisations added up to twenty (20) in total. 3.3 Sampling procedure The process followed was that of selecting every second construction firm from the CIDB register of contractors per category. The CIDB register for 2014 comprised a list of 250 construction firms who were only active in the database. It was not clear as to how many of these construction firms were located in Bloemfontein. For purposes of this study, a sample of twenty construction firms based in Bloemfontein was selected. 3.4 Data collection A questionnaire data collection strategy was used. A single questionnaire was designed for group of respondents being the twenty selected construction firms. The questionnaires included the fill in questions with a combination of closed and open ended questions.
4. RESULTS 4.1 Results Presentation and Discussion The categories of the firms that participated in the study are shown in Figure1.
Proceedings: 9th Built Environment Conference
2-4 August 2015, Durban, South Africa
ISBN 978-0-620-67120-0
page 261
Figure 1.1 Categories of construction firms Out of the 20 firms 85% (17) responded and participated in the study. 4.2 Knowledge level of artisans in training The level of knowledge of artisan training was investigated and the responses are as shown in figure 2.
Figure 1.2 Knowledge levels of artisans
Proceedings: 9th Built Environment Conference
2-4 August 2015, Durban, South Africa
ISBN 978-0-620-67120-0
page 262
The majority of respondents with fifty two percent report poor level of knowledge of artisans in training. The responses by the majority of respondents reflect the construction firms’ affirmation that the level of knowledge from artisans offered by FET colleges training is viewed as inadequate and poor. However, 24% of respondents viewed knowledge of artisans as average, whilst eighteen percent of respondents reflected fair knowledge of artisan knowledge. Remaining respondents with 6% reported knowledge of artisans as very good. Findings reflect knowledge levels of artisanal candidates as poor and inadequate which suggest the practical training of artisan as not sufficient according to the expectations of the construction firms. This was further confirmed by lack of experience of artisans whilst the FET Colleges increase their enrolment. 4.3 Reasons for persistent skills shortage of artisans The study also examined the reasons why skills shortage of artisan seems to persist in the industry. The findings are presented in figure 2.
Reasons for shortages of artisans 7 6 6 5 5 4 4 3 2 2 1 0 Poor Fair Average Good implementation of implementation of implementation of implementation of mentorship mentorship mentorship mentorship
Figure 1.3 Reasons for shortage of artisans Findings reflect lack of artisanal mentorship programs in construction firms by 12% of respondents, whilst 29% reported fair implementation of
Proceedings: 9th Built Environment Conference
2-4 August 2015, Durban, South Africa
ISBN 978-0-620-67120-0
page 263
mentorship programs aimed at improving the skills base of artisans. Nearly a quarter (24%) of the respondents reported an average implementation of mentorship programs in their respective construction firms. The majority of respondents with 35% indicate a very good implementation of mentorship programs in their construction firms. Although findings reflect a very good implementation of mentorship programs for artisans for the bigger firms implementation range from random to non-existent particularly in the small and medium designation category. The reasons put forward for this situation upon inquiry comprise mainly the budgetary and time constraints which are compounded by a lack of human resource capacity. Most small firms cited financial constraints and limited work opportunities to have structured programmes. The confirmation from the literature shows mentorship program success to rely to a large extent on mentor commitment, availability and a formal structured mentorship program. 4.4 Factors contributing to shortage of artisan skills The factors which contribute to the shortage of artisan skills were investigated and the results presented in figure 3.
8 6 6 4 4
4 3
2 0 Artisan skills There is a focus on Construction firms focus development is taken as acompany survival by firms on profit making secondary priority by small and medium firms
There is a lack of structured mentorship program by small & medium firms
Figure 1.4 Factors leading to shortage of artisans The majority of respondents at 35% reported lack of taking artisanal skills seriously as a contributing factor to skills shortage, as they indicated artisanal skills to be taken as a secondary priority by small and medium firms. However 23% of respondents reported small and medium firms as focussing their attention on survival than concentrating on development of artisan skills. A further 23% of respondents reported lack of structured mentorship programs by small and medium firms. Around 18% of respondents reported construction firms focussing on their profit making efforts and less on skills development. Findings revealed that small and
Proceedings: 9th Built Environment Conference
2-4 August 2015, Durban, South Africa
ISBN 978-0-620-67120-0
page 264
medium construction firms have to a large extent relegated skills development to second priority and are focused more on company survival and profit making. The trend poses a challenge as explained during interviews, with the managers of the firms in R200 000.00 to R650 000.00 designated category, in the sense that the small and medium construction firms, which are mainly supposed to serve as access and growth points for skills development will continue to have less skilled artisans. This will lead to a more compromised competitiveness of the firm. It further emerged that the mentors are organisational employees and consider mentorship as part of their job description. Top management take conscious decisions, based on company future expansion opportunities and needs. 5 Conclusion and recommendations Mentorship as an approach towards intermediate artisan skills development is largely limited to the high income designated group of firms in the construction sector which are also few in numbers. The accelerated development and acquisition of intermediary artisan skills remains a restricting factor towards economic growth and development. The skills pipeline as in both the secondary schooling system and the Public FET College sector continues to experience unintended but avoidable bottlenecks. The construction sector’s ability to acquire skilled labour force centres around the development of mentorship programmes within the small and medium income designated group of construction firms. Since the intermediate artisan skills development is a long term strategic intervention, mentorship programmes need collective planning by both the public and private sector to be sustainable and to continue to yield positive results. The foremost recommendation emanating from this study is that different stakeholders led by CIDB in the construction industry collectively adopt an approach of developing structural plans to implement mentorship programmes for learners in intermediate artisan training within the small and medium income designated construction sector. The following supporting recommendations must be integral to the adopted approach; to have incentive-based programmes for the small and medium firms, with a view of developing and implementing mentorship programmes towards the development of intermediate artisan skills. Development of policy guidelines will assist this process in the creation of various platforms for sharing of best practices within construction firms against the backdrop of the already existing pockets of excellence where mentorship programmes have yielded positive results. References Akoojee, S. 2008. FET college lecturers: the ‘devolving’ link in the South African skills development equation, Journal of Vocational Education & Training, 60:3, pp. 297-313, August.
Proceedings: 9th Built Environment Conference
2-4 August 2015, Durban, South Africa
ISBN 978-0-620-67120-0
page 265
Available from: www.timeslive.co.za/business/careers/ articles>(Retrieved 15/04/ 2014). Daniels, R. C. 2007. Skills Shortages in South Africa: A Literature Review. Development Policy Research Unit. Cape Town: University of Cape Town. Fourie, P. 2012. Talking civils, cement and national infrastructure. National Infrastructure Plan; timing & execution of development needs. Civil Engineering Magazine, September, p.62. Gamble, Jeanne. 2003. Curriculum Responsiveness in FET Colleges. Cape Town: HSRC Press. HSRC. 2012. Impact Assessment of National Skills Development Strategy II Scarce Skills Information Dissemination: A Study of the SETAs in South Africa. Cape Town: HSRC Press. Jones, G. 2013. Fitting SA for growth. 2013 declared the year of the artisan. (Online) Financial Mail, March 05 2013. Kraak, A. 2005: “Human Resources Development and the Skills Crisis in South Africa: The Need for a Multi-pronged Strategy”, in Journal of Education and Work, Vol. 18(1). Motlanthe K., 2010. Skills Council to Tackle Unemployment. Pretoria: Government Communication. Philips, Peter. 2000. A Tale of Two Cities: The High-skill, High-wage and Low-skill, Low-wage Growth Paths in US construction. Paper Presented to the International Conference on Structural Change in the Building Industry’s Labour Market, Working Relations and Challenges in the Coming Years. 19-20 Oct 2000. Institut Arbeit und Technik, Gelsenkirchen, Germany. South Africa. Department of Labour 2009. The Construction Education Training Authority (CETA) in its Sector Skills Plan of 2009/10 (CETA 2009).Pretoria: Government Printers. South Africa. Department of Higher Education and Training.2012. The Organising Framework for Occupations (OFO)., Department of Higher Education and Training (DHET), 2012.Pretoria: Government Printers. South Africa. 2006. Further Education and Training Colleges Act 16 of 2006. Pretoria: Government Printers. South Africa. Department of Higher Education and Training. 2011. National Skills Development Strategy (NSDS) III. Pretoria: Government Printers. South Africa. Department of Basic Education. 2010. Action Plan 2014: Towards the Realisation of Schooling 2025. Pretoria: Government Printers. South Africa. Department of Education. 2008. National Plan for FET Colleges. Pretoria: Government Printers. South Africa. Department of Education. December 2008. Abridged Report 2008 National Senior Certificate Examination results. Pretoria: Government Printers. South Africa. Department of Public Works. 2012. Construction Industry Development Board (CIDB), STRATEGIC PLAN, 2011/12 TO 2015/16. Pretoria: Government Printers.
Proceedings: 9th Built Environment Conference
2-4 August 2015, Durban, South Africa
ISBN 978-0-620-67120-0
page 266
South Africa. Department of Higher Education and Training.2010. Further Education and Training Colleges: Preliminary Report on the Examinations and Assessment results. Pretoria: Government Printers. South Africa. Department of Higher Education and Training. 2011. National Skills Development Strategy (NSDS) III. Pretoria: Government Printers. South Africa. Department of Higher Education and Training.2012.ETDP SETA Public Further Education and Training Sector Skills Plan 2013/14 UPDATE. Pretoria: Government Printers. South Africa. Department of Higher Education and Training.2012.Introduction to the National Artisan Moderation Body. Pretoria: Government Printer. South Africa. Department of Labour. 2005. Guide for the Development of Five Year Sector Skills Plans and Annual Updates for 2005 to 2010 Pretoria: Government Printers. South Africa. Department of Labour. March 2008.Research Consortium, Artisan/Trades, Scare and Critical Skills Research Project. Pretoria: Government Printers. South Africa. Department of Treasury. September 2013.South African Reserve Bank Quarterly Bulletin. Pretoria: Government Printers. South Africa. Presidency Office. 2011. Presidential Review Committee South Africa. Presidency Office. 2012. National Development Plan (NDP), 2012.Pretoria: Government Printers. South Africa.2006 & 2008. Office of the Presidency. Joint Initiative on Priority skills Acquisition (JIPSA). Pretoria: Government Printers.
Proceedings: 9th Built Environment Conference
2-4 August 2015, Durban, South Africa
ISBN 978-0-620-67120-0
page 267
ASOCSA2015-075
A Theoretical Perspective for Emerging Contractors’ Economic Sustainability: A Strategic Management Approach Iruka Chijindu Anugwo1, Winston Shakantu2
[email protected] [email protected] Department Of Construction Management, Nelson Mandela Metropolitan University, North Campus, Po Box 77000, Port Elizabeth, 6031, South Africa1,2 Tel: +2778478463611 & +27-41-50414002 ABSTRACT AND KEYWORDS
Purpose This paper target is to create consciousness and promote the contemporary strategic management and business concepts that could enhance the emerging contractors’ economic sustainability in the South African construction industry. Design / Methodology This is a preliminary study of an ongoing PhD research; as such the study was conducted with desk top research method, which made use of existing literature on the contemporary strategic management and business concepts for sustainable organizations in the construction industry. Research limitations/implications This survey is a preliminary study and an ongoing inquiry. In this regard, generalizing the study findings bears limitations. Findings The emerging contractors remain the power sources of job generation and of economic development in the developing nations. However, thw majority of them fail to grow into sustainable organisations as a consequence of insufficient knowledge of contemporary strategic management and construction business concepts. Response to conference theme and outcomes This work illuminates the crucial and potential business approaches that emerging contractors could strategically utilize in order to gain economic sustainability.
Proceedings: 9th Built Environment Conference
2-4 August 2015, Durban, South Africa
ISBN 978-0-620-67120-0
page 268
Practical implications This study evaluates how the emerging contractors in the South African construction industry could develop a competitive business strategy that would enhance and foster them to earn competitive advantage and economic sustainability in the industry. Keywords: Construction Business, Economic Sustainability, Emerging Contractors’, Strategic Management
1 INTRODUCTION
The construction industry is one of the most vital sectors in the world. It plays a huge and remarkable role towards any country’s economic growth and contributes significantly to the gross domestic product (GDP) (Shakantu, 2012; Orozco, Serpell, & Molenaar, 2011; & Egmond, 2012). The construction industry is saddled with the responsibility of forming the built environment. The industry is responsible for development of infrastructure such as roads, railways, airports, harbours and housing (McCabe, 2010). According to Thwala & Phaladi (2009) and Shakantu (2012) the small, medium and micro-enterprises (SMMEs- the emerging contractors) form the largest number of companies in any country’s construction industry. It is also a major source of job creation. Shakantu (2012) further states that, the SMMEs are mainly family businesses to self-employed and owner/manage informal or formal enterprises with low scale of size and capability. Concretely, Shakantu (2012) opines that the small, medium and microenterprises (SMMEs- Emerging contractors) comprise 95% of business entities and generate 60-70% of employment, 50% of the gross domestic product (GDP); and 55% of all technical innovation and development in any economy. However, Burns (2007) conclude that the emerging, small and growing firms have significantly contributed far better than that of larger corporations in terms of job generation, year after year. Although, Abor & Quartey (2010) note that there is common perception that majority of emerging contractors or small business would fail to grow into sustainable organisations. Burns (2007) further said that emerging small business should focus on skill building capacity to grow their firms into sustainable organisations. 1.1 Research Problem The majority of the emerging contractors’ in the South African construction industry have failed to develop and grow their businesses into sustainable and competitive organisations as a result of insufficient knowledge of the contemporary strategic management and competitive business strategies. 2.0 THEORETICAL CLARIFICATION 2.1 The New South Africa According to Ncwadi & Dangalaza (2005) government remains the biggest client of the South African construction industry. The government engenders between 40% and 50% of all domestic construction work. However, Martin &
Proceedings: 9th Built Environment Conference
2-4 August 2015, Durban, South Africa
ISBN 978-0-620-67120-0
page 269
Root (2010) posit that the new South Africa has, for two decades recorded fundamental and transformational changes in parts of its economic, social and public areas, compared to that of the apartheid regime. According to Jonas, Netshanddama & Madau (2014) this new era of democratic governmence in South Africa (SA) has re-awakened the need for building skills capacity that would reflect and impact the general market and the broader economy of the country. The arguments of Joan et al. (2014); and Martin & Root (2010) resonate the recognition and need for the transformation and regulation in the SA construction industry, which would engender the participation of the emerging contractors in the formal economy. These emerging contractors in SA are predominately owned and managed by historically disadvantaged individuals (HDIs). The South African government has created a robust mechanism that would ensure that blackowned companies (HDIs) have greater access to the construction industry, (Martin & Root, 2010) through government intervention. Some of these interventions include the promulgation of Acts such as the Broad-Based Black Economic Empowerment (BBBEE) Act of 2003, and the Preferential Procurement Policy Framework (PPPF) Act of 2000. However, whether these interventions have in any way enhanced the emerging contractors’ sustainability remains the missing link. 2.1 The Challenges Facing Emerging Contractors’ in the SA Construction Industry Thwala & Phaladi (2009) raise concern that despite almost two decades of democratic governmence in South, the capacity of the emerging contractors’ undoubtedly still unsustainable and un-competitive even with the existence of supportive programmes (such as the contractor development programme and emerging contractor development programmes). Thwala and Phaladi further stress that inspite of government intervention schemes have made it possible to continuously provide jobs for HDIs and emerging contractors, the majority of them remain unsustainable. Martins (2010); and Orozco et al. (2011) noted that the current competition forces are intense both on the global and domestic market. This has posed a major challenge for many industries including construction in that, for companies such as emerging contractors to remain competitive and economically sustained their businesses they must develop a dynamic business strategy that would embrace the changing trends and conditions in today’s business world in order to stand a chance for survival; to grow and mature. Therefore emerging contractors need to gain strategic management knowledge, have business goals and objectives and develop a competitive business strategy that would foster their sustainability and competitiveness in the construction industry (Martin & Root, 2010). Sustainability and competitiveness are are critical challenges facing the South African construction industry, especially the emerging contractors. In addition, Martin & Root (2010) confirmed that newly formed enterprises in the SA construction industry, for instance, battle to grow into sustainable and competitive firms in their first five years of business operation. The bankruptcy rate is alarming amomg the emerging companies. Bankruptcy is due to internal and external constraints such as unprofitable tender prices, abuse by main contractors, poor general management capability,
Proceedings: 9th Built Environment Conference
2-4 August 2015, Durban, South Africa
ISBN 978-0-620-67120-0
page 270
technological difficulties, difficulties in accessing finance, difficulties in securing contractors due to a high competition, and legal barriers (Martin & Root, 2010); and other are challenges such as lack of strategic resources and funding for training contractors, poor procurement systems; lack of management capacity which hinder their operation efficiency (Thwala and Phaladi, 2009), in the broader context, their performance is unsatisfactory. Given the above challenges, it is imperative to strategically develop the construction industry in South Africa, so that it can unleash the readiness and enhance the emerging contractors’ capability to compete. According to Dlungwana & Rwelamila (2004) it is imperative that the developing countries should tackle the numerous constraints in their construction industries at basic level in order to enhance the capacity of their local contractors and improve readiness to deliver effectively on local projects. In the South African context, Ngowi, Pienaar, Talukhaba, & Mbachu, 2004) revealed that the competitive force in the construction industry (CI) has presented new challenges which have an impact on all countries in different perspectives such as strategic alliances, joint ventures and recruitment and hyper-competition. A result of this new phase of the globalization is to erode competitive strengths of the local CI and undermine any protection of “local contractors”. Ngowi et al (2004) maintain that construction firms have no choice but to develop competitive business strategies that would ensure their economic sustainability. Such would also create the readiness for them to compete both in the domestic- and global market. In the same vein, Dlungwana & Rwelamila (2004) opined that not all the local and emerging contractors would thrive and be successful in the industry as success would be limited to those contractors who strive earnestly to become more sustainable, globally competitive and enhance competitiveness across the landscape of the African continent and beyond 2.2 The Strategic Management: Construction Business Perspective According to Johnson, Whittington, & Scholes (2011); Petty, Palich, Hoy, & Longenecker (2012); and Megginson, Byrd, & Megginson (2003) strategy is a basic path; a comprehensive and systemic document that focuses on a long-term direction and plan of an organisation that helps the business to navigate the marketplace and to achieve their business goals, mission and objectives. McCabe (2010) argues that the recent study of strategic business management originated from ancient military experiences and perspectives that point towards tackling challenges on the battlefield. It is on the battlefield that terms such as objectives, mission, goal, plan, strengths and weaknesses were used. However, in the middle of the nineteenth century, a Civil War veteran in the US started the systematic study and application of business strategy and strategic management concept in business organisations. This was done through the formulation and implementation of management skills such as leadership, resources management and project control, and logistics strategic planning (Augier & Teece, 2008). However, Barney & Hesterly (2006) opine that a firm’s strategy should theoretically depict how it will gain sustainable competitive advantage. Barney & Hesterly (2006) further state that only a good competitive strategy has the potential to generate such an advantage; that would the strategic management process cushions an organization to analyse and choose a
Proceedings: 9th Built Environment Conference
2-4 August 2015, Durban, South Africa
ISBN 978-0-620-67120-0
page 271
businesss strategy th hat enhance es the likelihood to gene erate a competitive advanta age and susta ainable perfo ormance. Meg ggineson et al. (2003) wa arn that an orga anisation’s sttrategies sho ould be eefe ective and efficient e in order o to generate e a competittive advantag ge in the ma arketplace. This T should b be built around tthe firm’s activities and utilise u resourcces (e.g. ma arketing, prod duction, operatio ons, research h, innovation and develop pment, financce and person nnel) in the mosst effective manner. In n addition to o this, Augie er & Teece (2008) conclude e that the prrimary purpo ose of strateg gic managem ment is to gu uide the emergin ng contractorrs’ or organizzation as it d develops and grow susta ainable competitive advantag ge. Contractors’ Developme ent of 2.3 Fundamental Ellements for Emerging C ess Strategy y Compettitive Busine Barney & Hesterly (2 2006) the strrategic mana agement (bussiness processs) is a sequenttial set of ana alyses and sttrategic choicces that form ms the capability that increase es the likelih hood of an organization n through th he developm ment of competitive scheme e. Barney & Hesterly (20 006) further claim that a firm’s strategyy can be viewed as the means on how h their ca an gain competitive advanta ages. Also, how h to explo oit the opporrtunities in a given markket and earn abo ove-average performance e and profits..
Strategic Man nagement Prrocess Figure 1: The S
Sourc ce: Adapted ffrom Barney & Hesterly (2 2006)
ategic manag gement proce ess is as follo ows: The stra Mission:: A firm’s m mission is its long-term b business stra ategy and p purpose stateme ents. It consists of what a firm aspirres to achievve in the lon ng run, such as vision, value e, performancce, profit and d brand. must be speccific, measura able targets and benchm marking Objectivves: these m tools tha at firms use to evaluate e their perforrmance and realization o of their mission;; Externall and Interna al Analysis: this strategicc manageme ent process assists firms to o identify the e critical thre eats and op pportunities in their competitive businesss environment; Strategiic Choice: ffalls into two large categories of business-levvel and corporatte-level stra ategies. The ese are strrategies tha at determine e what strategicc actions a fiirm must eng gage in to gain g competitive advantage in a single or o multiple markets orr industry such as; co ost leadership and differenttiation strate egies, verticcal integration, diversiffication stra ategies, strategicc alliance, an nd merger an nd acquisition n strategies; and a
Proceedings: 9th Built Environment Conference
2-4 August 2015, Durban, South Africa
ISBN 978-0-620-67120-0
page 272
Strategy Implementation: this occurs when a firm adopts organizational policies and practices that are consistent with its strategy (Barney & Hesterly, 2006) According to McCabe (2010) it is crucially important to consider the dynamic nature of the business environment, because it impacts hugely on the strategy being implemented. McCabe(2010) further states that the following techniques could be useful, namely (i) the market options matrix; (ii) SWOT analysis; (iii) PESTEL; (v) Scenario-based planning to analyse the environment; and (vi) Porter’s five forces framework. These strategic analysis techniques offer great potential for analysis of the business environment. The techniques can also be used in developing a competitive business strategy and colud help obtain and sustain a competitive advantage. Thus, Vorasubin & Charoenngam (2004) highlight that strategic management and competitive business strategy are a single action, but a continuous and conscious effort. Such processes must be driven through commitment and effective use of its resources in order to obtain sustainable performance (economic sustainability). It stands to reason that a strategic management process and procedure should be diligently monitored , whilst formulating and implementing business strategy. The following outline is an iterative process for formulating and implementing a competitive business strategy: 1. Identifying and analysing current mission, values, and objectives 2. Analysing external and internal environments (SWOT analysis) 3. Revising missions and objectives, selecting new strategies 4. Implementing the strategies 5. Evaluating results (Vorasubin & Charoenngam, 2004) Lambert & Davidson (2012) affirmed that strategic management approach identifies factors can contribute to an enterprise’s success and sustainable performance (economic sustainability). Some of the major factors include the choice, formulation and development of its competitive business strategy. As such this study the identified the contemporary strategic management approach and key drivers of emerging contractors’ economic sustainability in the construction business, namely: business strategy and operation; technology and innovation skills; leadership and entrepreneurship skills; education and skill training; resource base; competence and capability; and globalization and strategic alliance. In summation of this, the above identified elements of strategic management are prime and fundamental for the emerging contractors’ that long for the height to develop and grow a sustainable organization in the South African construction industry. 2.4 The Concept of Emerging Contractors’ Business and Economic Sustainability The word sustainability has recently become a keyword in research domain. According to Presley & Meade (2010); Wikstrom (2006); and Doane & MacGillivray (2001) organisation’s sustainability is built on a long-term foundation, which consists of economic, social and environmental performance. However, this study is on the economic sustainability (sustainable performance or continuous improvement of performance) aspect of emerging contractors’. According to Doane & MacGillivray (2001) sustainable performance or economic sustainability for emerging contractors’ simply refers to how they could stay and survive in the market.
Proceedings: 9th Built Environment Conference
2-4 August 2015, Durban, South Africa
ISBN 978-0-620-67120-0
page 273
Martins & Root (2010) argued that it is imperative for the emerging contractors’ to acquire strategic management knowledge in order and develop competitive business strategy that would foster their sustainability in the marketplace. In addition to this, Presley & Meade (2010) opine that the emerging contractors’ sustainability could involve a top-level competitive business strategy. Such a top-level competitive business strategy could ensure long-term financial viability and help them achieve success in reaching their business objective. Moreover, Froschheiser (2015) explains that the term sustainability in a business context refers to a firm’s ability to acquire and implement winning (competitive) business strategies that would contribute to long-term operation and continunity. Doane and MacGillivray, (2001) add that indicators of economic sustainability of an organization must reflect on; (i) the financial performance; (ii) how all their resources and assets are managed; and (iii) its influence on the economic activities. In the same luminance, Presley & Meade (2010) claim that long-term financial viability and success, sustainability should be top priority for emerging contractors’ strategic business objective if they require to compete favourably in the twenty-first century business world. Added to this, Carnall (2003) states the key to firm’s competitiveness and sustainability lie with the business leader’s (emerging contractors’/owner/manager) ability and capability to conceive competitive business strategies that will become their resource and asset base into competitive advantages.
3.0 RESEARCH APPROACH AND METHODOLOGY
The paper is conducted with an in-depth and critical review of literature relating to the construction business, emerging contractors, elements of competitive business strategy, strategic management. However, the concept of emerging contractors’ business and economic sustainability calls for intensive research study, as research on emerging contractor’s sustainability in the construction has been under researched. Thus, this study is an ongoing PhD research which aims to develop strategic business model that will heighten the emerging contractors’ competitiveness and sustainability in the South African construction industry. The current methodology falls within the qualitative research methodology.
4.0 RESULT AND DISCUSSION
The research commentators from the critical review of literature on the subject have acknowledged the important role the emerging contractors in the economic growth and development. This claim resonate with assertion of, Shakantu (2012) that emerging contractors or the small, medium and micro-enterprises (SMMEs) measure up to 95% of business entities and 6070% employment rate, 50% of the gross domestic product (GDP) as well as a major source of new job in any country’s economy; and the fast-growing
Proceedings: 9th Built Environment Conference
2-4 August 2015, Durban, South Africa
ISBN 978-0-620-67120-0
page 274
emerging contractors’ has contributed significantly than that of large firms in terms of job generation (Burns, 2007). In regard to this, the common perception that the majority of emerging contractors’ are mostly likely to fail working to grow their businesses into sustainable organisations within their first five years of the business operation (Abor & Quartey, 2010; and Martin & Root, 2010); this challenge need to be tackled with dynamic and contemporary strategic management and construction business concepts. The emerging contractors should focus on developing competitive business strategy, (Burns, 2007) that would enable them to utilise their capabilities and to grow into sustainable organisations. Barney & Hesterly (2006) conclude that emerging contractors’ business strategy should be able gain competitive advantage, in order to earn above-average performance and profits. In addition to this, Martins & Root (2010) that emerging contractors’ need to acquire strategic management knowledge in order to develop a competitive business strategy that would foster their economic sustainability and competitiveness in the marketplace.
6.0 CONCLUSION AND RECOMMENDATION
This paper reviewed and discussed various theoretical concepts and perspective relating to strategic management and construction business and economic sustainability for emerging contractors. Also, the study has illuminated the economic importance of emerging contractors job creation and development in developing countries. Owing to the fact that, the emerging contractors’/ small businesses account for 90% of the business entity, 55% of the employment as well as contributing to 60% GDP in almost all the country’s economy, is an impressive outlook which could be used to transform the economic landscape of the South Africa nation. However, the common perception that the majority of emerging contractors incessantly fails to develop and grow their businesses into competitive and sustainable ventures is becoming a reality in the South African construction industry. It is evident that business failure amongst the emerging contractors, have indeed called for intensive research study; and drastic measures need to employ strategically in order to mitigate this threat. The emerging contractors’ economic sustainability and competitiveness is of great importance as well as a concerns. Though, the organizations in the construction sectors deserve a crucial measure, as the sector is one of the most vital industry the government of any country utilize to distribute wealth and control economic activities for its sustainable development. Thus, this study was based on bridging the knowledge gap on the issue on how to potentially tackle the challenges facing the emerging contractors business. Various researchers has done study on issues confronting the emerging contractors’ in the building industry, but only limited research study gears towards strategic management perspective as potential solutions to numerous problem of unsustainable organisations. In a nutshell, this study sought potential solution of the research problem through the field of strategic management and competitive business concepts. This study add value to the concept of adopting strategic
Proceedings: 9th Built Environment Conference
2-4 August 2015, Durban, South Africa
ISBN 978-0-620-67120-0
page 275
management approach to construction industry; and as well as creating awareness on the concept of emerging contractors’ economic sustainability. Therefore, the study recommend that the an intensive industrial and academic research that related to strategic management and competitive business strategies should be conducted as incubate the potential knowledge that could eradicate the incessant business failure amongst the emerging contractors’ in the South African construction industry.
REFERENCES Abor, J., & Quartey, P. (2010). Issues in SME Development in Ghana and South Africa. International Research Journal of Finance and Economics (Issue 39), 218-228. Augier, M., & Teece, D. (2008). Editor's Introduction. In M. Augier, & D. Teece, Fundamentals of Business Strategy (pp. xxiii-xxxvi). London: SAGE Publications Ltd. Bajracharya, A., & Ofori, G. (2004). Local Capacity and Capability: A Probable Determinant For Promotion of Construction Export. In S. Ogunlana, C. Charoenngam, H. Pannapa, & H. B. W. (Ed.), International Symposium on Globalisation and Construction: CIB W107 (Construction in Developing Economies) and CIB TG23 (Culture in Construction) (pp. 288-296). Bangkok, Thailand: CIB-SCE, AIT. Barney, J., & Hesterly, W. (2006). Strategic Management and Competitive Advantage:Concepts and Cases. New Jersey: Pearson Education. Burns, P. (2007). Entrepreneurship and Small Business (2 ed.). New York: Palgrave Macmillian. Carnall, C. A. (2003). Managing Change in Organizations (4th ed.). England: Pearson Education Limited. Dlungwana, W., & Rwelamila, P. (2004). Contractor Development Models that Meet the Challenges of Globalisation – A Case for Developing Management Capability of Local Contractors. In S. Ogunlana, C. Charoenngam, H. Pannapa, & H. B. W. (Ed.), International Symposium on Globalisation and Construction: CIB W107 (Construction in Developing Economies) and CIB TG23 (Culture in Construction) (pp. 348-358). Bangkok, Thailand: CIB-SCE, AIT. Doane, D., & MacGillivray. (2001). Economic Sustainability - The business of staying in business. The Sigma Project: R & D Report. Froschheiser, L. (2015). Business Sustainability: The Strategies to Achieve, the Leadership that Makes It Happen. California: Management Action Programs, Inc. (MAP). Johnson, G., Whittington, R., & Scholes, K. (2011). Exploring Strategy: Text & Cases (11 ed.). London: Pearson Education. Lambert, S., & Davidson, R. A. (2013). Applications of the business model in studies of enterprise success, innovation and classification: An analysis of empirical research from 1996 to 2010. European Management Journal, 668681. Martin, L., & Root, D. (2012). Profiling emerging contractors for effective transformation in the South African construction sector. Development Southern Africa , Vol. 29, No.2, 209-233.
Proceedings: 9th Built Environment Conference
2-4 August 2015, Durban, South Africa
ISBN 978-0-620-67120-0
page 276
McCabe, S. (2010). Corporate Strategy in Construction: Understanding today’s theory and practice. United Kindgom: Wiley-Blackwell. Megginson, L., Byrd, M., & Megginson, W. (2003). Small Business Management: An Entrepreneur's Guidebook (4 ed.). New York: McGrawHill/Irwin. Ngowi, A. B., Pienaar, E., Talukhaba, A., & Mbachu, J. (2004). Regional Initiative as a Competing Strategy in the Global Construction Market. In S. Ogunlana, C. Charoenngam, H. Pannapa, & H. B. W. (Ed.), International Symposium on Globalisation and Construction: CIB W107 (Construction in Developing Economies) and CIB TG23 (Culture in Construction) (pp. 123134). Bangkok, Thailand: CIB-SCE, AIT. Orozco, F., Serpell, A., & Molenaar, K. (2011). Competitiveness factors and indexes for construction companies: findings of Chile. Revista de la Construcción , Volumen 10 No 1, 71-109. Petty, J., Palich, L., Hoy, F., & Longenecker, J. (2012). Managing Small Business: An Entrepreneurial Emphasis. (16, Ed.) Australia: South-Western Cengage Learning. Presley, A., & Meade, L. (2010). Benchmarking for sustainability: an application to the sustainable construction industry. Benchmarking: An International Journal Vol. 17 No. 3 , 425-451. Shakantu, W. (2012). Contractor development. In G. Ofori, New Perspective on Construction in Developing Countries (pp. 253-276). OXON: SPON PRESS. Thwala, W., & Phaladi, M. (2009). An Exploratory Study of Problems Facing Emerging Contractors in the North West Province of South Africa. Proceedings 4th Built Environment Conference (pp. 195-205). Johannesburg: University of Johannesburg. Vorasubin, P., & Charoenngam, C. (2004). Concept of Strategic Asset for Sustainability of Thai Consulting Firm. In S. Ogunlana, C. Charoenngam, H. Pannapa, & H. B. W. (Ed.), International Symposium on Globalisation and Construction: CIB W107 (Construction in Developing Economies) and CIB TG23 (Culture in Construction) (pp. 1041-1048). Bangkok, Thailand: CIBSCE, AIT.
Proceedings: 9th Built Environment Conference
2-4 August 2015, Durban, South Africa
ISBN 978-0-620-67120-0
page 277
ASOCSA2015- 024
Assessing progression in the project management profession from the past 3 decades: A Retrospective Study M. S. Mohale, C. Loggia, T. C. Haupt
[email protected],
[email protected],
[email protected] University of KwaZulu-Natal, School of Engineering, Property Development Programme, Howard College Campus, 4041 Durban, South Africa ABSTRACT AND KEYWORDS Purpose of this paper This paper presents an extended study of the project management practice progression by evaluating improvement in training and professional performance based on knowledge application. It aims to compare project management between past and current times in order to find the ‘keys’ to its progression. Design/methodology/approach The main issue discussed is the fact that progression requires integration and differentiation which calls for academic attention. Previous research demonstrated that there are factors contributing towards the development and growth rate of a profession. Findings Data collection tool used is an online questionnaire providing findings from an academic and professional perspective focused on the project manager’s actual performance. Research limitations/implications (if applicable) The research located 15 construction project management organizations as participants within the private and public sector in KZN. What is original/value of paper The results from this study indicate the criticality in adequate training in project management and implementation of knowledge through performance observation.
Proceedings: 9th Built Environment Conference
2-4 August 2015, Durban, South Africa
ISBN 978-0-620-67120-0
page 278
Keywords Rate of progression in project management, Professional performance, Integration and Differentiation. 1. INTRODUCTION In the past 30 years the construction industry in South Africa has been gradually developing and dynamically integrating. South Africa hosted for the very first time the 2010 World Soccer Tournament (FIFA World Cup) and 5 years prior to this event, the construction sector was occupied with work. Cottle and Rombaldi (2013) explained that despite the world economic crisis of 2008-2009 the top five South African construction companies benefited handsomely from the World Cup infrastructure projects raking in an average profit of 100% over the five year period (2005-2009) after making substantial losses up to 2004.The initial crisis was skills shortage to render professional services in hosting such a giant sport event, resources were put in place and many professional specialists from around the world were invited to assist South Africa’s engineers and project managers in fulfilling the challenge to complete all projects in time. For many years, project management was derided as a low-tech, low-value and questionable activity. Only recently it has been recognized as a central management discipline. Nowadays, major companies use project management as their principal management style. Smith (2008) explained that ‘management by projects’ has become a powerful way to integrate organisational functions and motivate groups to achieve higher levels of performance and productivity. The construction industry played a very important role in the whole developing process. Qi and Chen, (2014) found out the reasons and processes that made China Construction Industry developed very fast in the last 30 years. As projects become more complex, global and virtual, the project management profession continues to grow and diversify. Thus, the construction management discipline has been long searching for the correct paradigm in construction education and training that would enable the development of competence for construction project management personnel (Panas et al., 2014 cited Bernold, 2005). A survey was conducted in 15 project management servicing organisations around the Province of KwaZulu-Natal. The open and closed ended interview questions included in the questionnaire seek to reveal the project managers legitimacy in performance precision in terms of the professions’ concoction. Crawford (2005) demonstrated that competence of project managers can be seen as important as they are perceived to have significant impact on project performance and hence on organisational performance. The evaluation was implemented by means of a survey within project management firms in order to trace and measure improvement of the profession and also to clarify, how the educational training contributes and complements the growth of the project
Proceedings: 9th Built Environment Conference
2-4 August 2015, Durban, South Africa
ISBN 978-0-620-67120-0
page 279
management profession. The second step was the utilization of the current literature available to substantiate the study of performance of the advancement of project management since the 1980’s. The main purpose of this research is to explore what integration, differentiation, competency, and improvement methods contribute towards progression in the project management domain. Progression is traced through the rise in project management demand in construction firms, whereby the most revenue share is projected from the project management division.
2. BACKGROUND OF STUDY The international community has embraced the birth of the project management profession in the 1950’s. The PMI (2002) clearly stated in their policy governance manual that, ‘Project management’ is a profession. Project managers are becoming extremely important in the modern organizational structure and it is vital to understand what competences they should possess (Miranda and Ghimire, 2007). Qi and Chen, (2014) mentioned that in China they have had some hard time at the first construction project management paradigm change in 1980s because of the transformation from the old planning economic system to the new market economic system at that time. The fast development of China construction industry in last 30 years are mainly caused and dived by these paradigm changes of China construction projects management. Edum-Fotwe and McCaffer (2000) indicated that in project management the dominance in experience is relevant to dynamic growth and maintaining competence however, it should be built on sound academic background. Project managers should possess a particular skill in managerial knowledge and general skills. Patanakul and Milosevic, (2008) emphasizes the importance of technical knowledge, administrative skills, and leadership ability, including communication, problem solving, conflict resolution, integration and analysis. Qi and Chen, (2014) mentioned that China announced to build an innovative country with an international influence in 2005. However, China started its innovation technology and management in the construction sector many years before this. Qi and Chen, further argue that the innovation in the technology and management is the only effective method to increase the profits and productivity for the industry after the market competition and economies of scale. In fact, better management of technology and management innovations are very difficult, but that really can make construction companies getting more profit and higher productivity. 2.1 Training and Development Training and development is defined as a process of developing workrelated knowledge and skills in employees for the purpose of improving
Proceedings: 9th Built Environment Conference
2-4 August 2015, Durban, South Africa
ISBN 978-0-620-67120-0
page 280
performance systematically (Tabassi and AbuBakar, 2009) cited by (Panas et al., 2014). Therefore, the performance-based competency standards rather than knowledge standards have been widely adopted as a basis for assessing and credentialing construction project managers (Zhang et al., 2012) cited by (Panas et al., 2014). In essence, the Project Management Profession in construction is growing exponentially due to the fact that it is a scarce skill and for the fact that South Africa is a developing country, it therefore needs certain professions to help create a growing economy. Bowen et al., (2007) argued that a range of ethical problems are evident in the construction industry including collusion, bribery, negligence, fraud, dishonesty and unfair practices. Can these barriers stop the project management profession from contributing profusely to the economy and built environment of South Africa? Burger (2013) claimed that if project management, correctly and effectively applied, has great benefits to offer South Africa and the Construction Industry in its entirety. Therefore, knowing what knowledge is important for a project manager in the built environment to have and whether it will improve the effectiveness and success of a project is crucial. Burger (2013), emphasized that graduate professionals may choose project management because they assumably understand the knowledge that is offered in their degrees and the basic technical knowledge should give them a kick start into the project management profession. Patel, (2003) stated that in education, the key to transmitting the discipline knowledge for the purpose of developing critical learners is to enable students to become owners of the knowledge. The contribution that the approach makes is that it incorporates these recent developments and goes beyond modern education needs to cater for a society and the Industry that makes the individual responsible for their actions and gives the individual responsibility and power to act individually (Patel, 2003). This research is aimed at evaluating the effectiveness of higher education and training to prepare project managers for the future, from the perspective of professional project managers. 2.2 Project Management as a Best Practice Elias et al., (2012) found that by highlighting knowledge, skills and personal characteristics it might establish a new criterion of best practice in the project management profession. Many countries like Malaysia, have seen tremendous progress in the construction industry since the 1980’s in tandem with the growth of National and World Economy. Filippov and Mooi, (2010) added that in the last couple of years project management enhanced new technologies, new industries, and new business models powering impressive gains in productivity and GDP.The Construction Industry is one of the main sectors that contribute to national economies. However, the Industry is tarnished by the existence of failure or abandoned projects. This is where the project managers’ roles and performance become so important and hence made the project manager a key player in
Proceedings: 9th Built Environment Conference
2-4 August 2015, Durban, South Africa
ISBN 978-0-620-67120-0
page 281
the Construction Industry. Therefore, this study is an inquiry to investigate the current status of project management in terms of progression since the past 3 decades. A best practice is a proven process that delivers measurable improvements in efficiency and effectiveness. Organisations and companies look for best practices to help them speed their progress towards performance improvement and to guide them around pitfalls that might otherwise slow or halt their initiatives. Improved performance should also incorporate better quality. If project management claims the title ‘best practice’, it means it has applied optimum ways of performing work to achieve high performance.
Knowledge
Benchmarking
Project Success (high performance)
Skills Efficiency Personal Characteristic
Figure 2.1: Best Practice Conceptual Framework
2.3 Focus of study This paper focuses on the rate measurement of progression in construction project management based on the inference of performance competence (the ability to perform activities within the occupational area to the level of performance expected in employment) and attribute based inference of training competence (the knowledge and understanding, skills and abilities that person bring to a job; the core personality characteristics underlying a person’s capability to do a job). The opinion of the project management servicing organisations and companies were obtained by means of a Questionnaire survey. The questions sought to establish perspectives of the growth of the project management profession, its integration and how differentiated it is as a profession.
3. METHODOLOGICAL APPROACH In accordance with the aims and objectives of this study, a mixed methodology was applied. The Qualitative approach was used to identify the dimension and state of the project management progression while the quantitative approach was used to assess the data obtained through cross sectional survey. The stratified questionnaire survey was conducted on practicing firms. The feedback of the questionnaire was based on the respondents experience and practices.The rationale of this paper is to
Proceedings: 9th Built Environment Conference
2-4 August 2015, Durban, South Africa
ISBN 978-0-620-67120-0
page 282
determine whether the project management positively transcends as a profession and to detail a specific perspective of progression rating from the past three decades, providing a sound analysis. Surveys participants comprise consulting project managers, engineers, construction firms and municipal/government infrastructure development departments. The analysis of data determines whether performance competency in project management produces a growth rate in the professions’ integration since establishment. The structured questionnaires, include questions regarding the educational background, experience, number of years since company adopted project management services, measures of improving practice and status of project management to date.
4. THE CASE STUDY: South Africa’s economy has many challenges though strives to improve rd infrastructure development, since it is a 3 world country but also with the fastest growing economy predominantly in Africa. The success of any construction project typically depends on the soundness of project management and how well have the resources been put together for implementation. Primarily, the growth of profits in any company results from projects done well and that transcends back to project managers being competent enough to produce such outcomes. Now the major question is how legit are those assumptions? Can they be used to measure the PM progression? Below are the first five construction firms in South Africa showing rising profits in Million (ZAR) from 2004 to 2009: Table 4.1: Rising Profits in Companies Basil Read Group 5 Grinaker ‐ Lta Murray & Roberts WBHO
2004
Proceedings: 9th Built Environment Conference
2005 ‐41 118 170 415 128
2006 24 134 493 523 198
2007 57 141 788 658 305
2008 164 373 7953 1284 446
2-4 August 2015, Durban, South Africa
296 665 3321 2455 1081
2009 412 782 2910 2869 1360
ISBN 978-0-620-67120-0
page 283
Figure 4.1: Rising Profits in SA’s Construction Companies
5. RESULTS AND DISCUSSION This section of the study will examine the advancement of project management practice. It sets to analyse and present the contribution of experience, the importance of knowledge areas, the causes of project failures, number of years in existence, higher education and training in the progression of the field over the past thiry years. 5.1 Analysis and presentation of the data gathered and discussion Part 1: The number of firms that have been providing project management services as from 1980.
Figure 4.1: Project Management service experience since 1980.
As depicted above, only two out of 15 firms began practicing project management in 1980. These firms found themselves in a less perfectly competitive environment due to the social atmosphere in South Africa at that time and the project management profession was scarce, thus a few professionals paid closer attention to it. When the years advanced we see a rise from two to six firms according to the survey conducted and continuously rising to seven after 1991. The argument is that as long as we still witness building and infrastructure development, there is demand of such professions and we can not negate that there is no growth. However, we may about the rate in which the profession grows. Part 2: The number and cost of projects completed by firms since their start of project management services.
Proceedings: 9th Built Environment Conference
2-4 August 2015, Durban, South Africa
ISBN 978-0-620-67120-0
page 284
Figure 4.2: No. of projects completed and their cost range as per existence period.
With reference to figure 4.1 and 4.2, the question of experience and number of years in existence arises. The research sample simply shows that 30 years ago two companies operated, then six and seven followed. The least number of companies is more experienced than the most number of companies. The second diagram shows the worth of projects in cost and the number of projects involved by all the firms as per arrival in the three decades. The seven firms that started Project Management ten years ago have done 26 projects altogether compared to 20 projects done by two firms that started 30 years ago for a R10m to R50million project. However, the R100million and above project cost, shows that 31 projects handled by two firms and only nine projects shared amongst the seven firms. As much as more firms would enter the market, the two firms have done 31 projects above R100million. This tells us more personell should be employed with the project management skills to effectively manage projects this worth. Therefore, the profession profoundly grows and much as the reputation of experienced companies. Part 3: Are the PMC knowledge areas important for the project management profession to remain relevant in Industry?
Figure 4.3: Importance of the project management competency knowledge areas
Proceedings: 9th Built Environment Conference
2-4 August 2015, Durban, South Africa
ISBN 978-0-620-67120-0
page 285
As shown in figure 4.3 above none of the respondents found that project management competency is not mandatory in the profession. In Part 3 of the questionnaire, it was measured the importance of project management competency areas which influence project success rate. The rating is reflected in the graph above by means of averaging the total responses in each likert category (very high/very low) for each competency element. The standing of the averaged results simply represent that the overall respondent perspectives felt that 43% of the entire list of competencies are very highly important and 44% highly important and only 13% when averaged thought were of moderate rank. Finally, lack of knowledge of the PMC’s by a project manager may result in project being unsatisfactory. The PMI (2002), states that Project Integration management is assumed to be the combination of (Leadership and Knowledge management); project scope management would be assumed to be (schedule management); and project communication management would be assumed to be (relation with stakeholders). These are the critical knowledge areas in project management competency, followed by Risk, Procurement, Cost, Quality, Human resources, Stakeholders, and Project Time management. Part 4: Does Higher Education and Training contribute towards the PM profession’s advancement? Table 4.2: Formal Qualifications of project managers Higher Education and Training of current professional Project Managers Qualification None No.
Matric 0
Certificate Diploma 0
2
Degree 7
Masters 16
PhD 4
3
The table above shows the qualifications of project management staff in the different companies. Each respondent provided which qualification they possess, and therefore justifies the assumption that in order to be a project manager you should have gone through Higher Education Training. Education provides every student to become analytical and apply encoded or decoded information. The essentiality of educational training in the table above has emphasized the point that an effective project manager should have the PM knowledge theoretically, that will enable him/her incorporate with the technical skills effortlessly. Having 32 academically qualified professionals shows advancement as opposed to years in the 1980’s. Part 5: What aspects and factors may cause failure to project and disturb professionals performance?
Proceedings: 9th Built Environment Conference
2-4 August 2015, Durban, South Africa
ISBN 978-0-620-67120-0
page 286
Figure 4.4: Perspectives on reasons for project failure
The intention of this part 5 was to find out from participants at what frequency would the reasons of failure cause actual projects to fail. Figure 4.4 represents total responses to each occurrence category [never/seldom/often/always - refer to appendix A] and then they were converted into percentages as shown in the diagram. Most of the causes show to be often occurring in projects, this is represented by the 48% and 32% of them causes seldom occur, whilst 17% of them always cause projects to find it hard to reach success and finally at least 3% of them would not perpetrate failure to projects. Leadership is rated 55% very high (very important) by the respondents and is followed by 41% highly important rate. Knowledge management is rated also 55% highly important, followed by the extreme importance rate of 32% very high (very important. Secondly, schedule management projects 64% very high (very important) and the remainder was rated highly important at 36%. Finally, relation to clients shows a 55% very high (very important) followed by 44% highly important. The top eight (8) competencies projected by respondent rating were Financial resource capability with 55% extreme high importance (very high); Technical competence with 50% extremely important; Leadership with 55% extreme importance; Relation to stakeholders with 55% extreme importance; Schedule management with 64% extremely important; cost and control management with 64% extreme importance; Quality management at 41% extreme importance; and a 48% for Risk management was also ranked extremely important. Organisational investment and Human resource management were top in the category of highly important competencies according to the survey, respectfully acquiring 59% and 61% from the respondents’ point of view. 5.2 Rating project management progression within an integrated organization Below is a projection of net incomes from one of the KZN Firms that participated in this research.
Proceedings: 9th Built Environment Conference
2-4 August 2015, Durban, South Africa
ISBN 978-0-620-67120-0
page 287
Figure 5.1: Net Income Segments
The evaluation figures range from 2010 to 2015. It is blatantly project management that makes profits for this company followed by Civil; Environment and Structural Engineering. By studying the project management income segment only, it is gives us information that the profession started at 33% in 2010 and rose to 40% in 2014. There are fluctuations in the 6 segments for project management’s contribution to the revenue of the company, this may be due to changes in the economy, construction industry regulations or other extenalities that would affect the inflow of projects. In conclusion, if this company projected growth as shown above, it could call for the increase of professionals in the company, in order to manage workload efficiently.
6. CONCLUSION The project management fraternity does not focus on construction and infrastructure but can also be applied to other disciplines, using the same principles. The analysis of mechanisms contributing towards the realization that project management requires generic comprehension of resources in projects, this includes the education and training importance, competency and relevance of the practice. Developing the requisite competency ensures efficient performance on managers who run projects and it is therefore essential for projects success, project managers growth and the overall professions’ progression. This research showed how important is
Proceedings: 9th Built Environment Conference
2-4 August 2015, Durban, South Africa
ISBN 978-0-620-67120-0
page 288
the existence and magnitude of project management involvement of companies from the start of practice because that extrapolates the overall progression. Either, in terms of financial standing or reputation in the construction industry. The study conducted a survey that defined what can cause project failure or what would cause ineffectiveness in the profession. A large segment in the study analysis emphasizes the cruciality of higher education and training in order to fit in the project management puzzle. For more detail and in-depth assessment of this study, further research may be carried out to measure accurate and broaden the project management progression scope.
7. REFERENCES Arendse, J.R. 2013, Project management competency factors in the Built Environment. Masters Dissertation, University of Johannesburg. Bowen, P., Akintoye, A., Pearl, R., and Edwards, P.J. 2007, Ethical behavior in the South African Construction Industry. Construction Management and Economics Journal. University of KwaZulu-Natal, South Africa. Available: http://www.learning.ukzn.ac.za. Accessed 9th March 2015. Burger, M. 2013, Project management in the built environment: the need for industry specific knowledge. PhD Dissertation, University of the Free State. Cottle, E. and Rambaldi, M. 2013, Lessons from South Africa’s FIFA World Cup, Brazil and its Legacy for labour. Available at: http//:www.global-labouruniversity.org/fileadmin/summer_school/_2014/EddieCottleCETIMboo k2013FINAL. Accesed 12th March 2015. Crawford, L. 2005, Senior management perceptions of project management competence, International Journal of Project Management. Vol. 23 No. 1, 7 – 16. Filippov S. and Mooi H. 2010, Innovation Project Management: A Research Agenda. Delft University of Technology: Department of Innovation Systems. Fotwe, E. and McCaffer R. 2000, Developing project management competency perspectives from the construction Industry. International Journal of Project Management 18, pp 111-124. London. Miranda, T. and Ghimire, B. 2007, Desired competencies for project managers. University of Umea-Universitet, Sweden. Panas, A., Pantouvaskis, J.P., and Lambroupoulos, S., 2014, A Simulation Environment for Construction Project Manager Competence Development in Construction Management, 27th IPMA. Vol. 119, 739 – 747.
Proceedings: 9th Built Environment Conference
2-4 August 2015, Durban, South Africa
ISBN 978-0-620-67120-0
page 289
Patanakul, P., and Milosevic, 2008, A competency model for effectiveness in managing multiple projects. Portland State University, USA. Journal of High Technology Management 18(2008) 118 – 131. Patel, N.V., 2003, A holistic approach to learning and teaching interaction: factors in the development of critical learners, International Journal of Educational Management. Vol. 17 Iss 6 pp. 272 – 284. PMI 2002, Project Manager Competency Development (PMCD) Framework, PMI Inc. Pennsylvania, USA. Available: http://www.pmi.org/PMCD, Accessed 9th March 2015. Qi, A. and Chen, H. 2014, Research on China construction project management paradigms change and development in the last 30 years. 27th IPMA. Vol. 119, 321 – 328. Smith, N.J. 2008, Engineering Project Management, 3rd ed. Blackwell publishing Ltd. Malden. Tabassi, A. A., and Abu Bakar A. H., 2009, Training, motivation, and performance: The case of human resource management in construction projects in Mashhad, Iran. International Journal of Project Management, 27, 471-480. Zhang, F., Zuo, J., & Zillante, G. 2012, Identification and evaluation of the key social competences for Chinese construction project managers,International Journal of Project Management.
Proceedings: 9th Built Environment Conference
2-4 August 2015, Durban, South Africa
ISBN 978-0-620-67120-0
page 290
ASOCSA2015-52
SWOT analysis as a means for identification of project delivery objectives driven by non-monetary incentives Ruben Ndihokubwayo
[email protected] Cape Peninsula University of Technology, Department of Construction Management and Quantity Surveying, Bellville Campus, P.O. Box 1906, Bellville 7535, South Africa, Telephone: 0219596845, Mobile: 073721589) ABSTRACT Purpose The aim of this paper is to ascertain which project objectives can or cannot be achieved through the provision of non-monetary incentives to construction and consultant team members. Design A web survey was adopted by using a questionnaire nationwide to purposively selected contractors, quantity surveyors, project managers, architects, and consulting engineers. A quantitative data analysis was adopted and data was analysed using Principal Component Analysis (PCA) on project objectives aligned with non-monetary incentives. The PCA output generated a ‘component plot in rotated space’ quadrant which was then accustomed for SWOT analysis. Findings In total, 164 construction industry stakeholders participated in the survey. It was revealed that primary project objectives such quality and time have a positive effect as they constitute a ‘strength’ on project success if aligned with non-monetary incentives. It was concluded that the lack of nonmonetary incentives towards performing primary project objectives may lead to dropping from strengths to threats. Limitations – The study was confined to contractors and construction related professional entities; the inclusion of clients would have revealed more insight into the subject matter.
Proceedings: 9th Built Environment Conference
2-4 August 2015, Durban, South Africa
ISBN 978-0-620-67120-0
page 291
Practical implications The study serves as a guideline for taking informed decisions when deciding to incorporate motivational incentives into the construction project. Keywords: non-monetary incentives, PCA, project objectives, SWOT analysis.
1. INTRODUCTION At a glance, project management is likened with planning, organising, motivating, controlling resources using sophisticated skills and a variety of software to ensure a successful delivery of infrastructures. However, while motivation is embedded within project management body of knowledge, it is hardly seen as one of core features constituting procurement requirements for delivering a construction project. Motivation is a set of forces that initiates, directs, and makes people persist in their effort to perform a goal (Williams, 2009). Motivation is concerned with compelling human resources involved into the project to optimally devote their physical and intellectual abilities to use available resources to achieve project objectives. Both primary and secondary objectives can be set in infrastructure delivery. Primary objectives such as cost, time, and quality are those related to direct activities of which involved parties are naturally so eager to fulfil. Secondary objectives are those in relation with intervention measures tailored to address certain socio-economic problems. The alignment of infrastructure delivery objectives with motivational incentives can address South African socio-economic challenges. Watermeyer, Gounden, Letchmiah, and Shezi (1998) advise that the construction and procurement strategies as intervention measures can address social and economic concerns and, depending upon how they are structured, can be utilised to facilitate the economic empowerment of marginalised sectors of society, and to address unemployment in a focused manner. This can be possible through targeted procurement strategies to address specific socioeconomic objectives. While the South African government has put in place enabling policies towards the achievement of project objectives; however, no strength, weaknesses, opportunities, threats (SWOT) analysis have so far been utilised to evaluate the importance of offering non-monetary incentives to achieve infrastructure delivery objectives. The objective of this study is to ascertain which project objectives can or cannot be achieved through the provision of non-monetary incentives to construction and consultant team members.
Proceedings: 9th Built Environment Conference
2-4 August 2015, Durban, South Africa
ISBN 978-0-620-67120-0
page 292
2. PROJECT OBJECTIVES The Construction Industry Development Board (CIDB) proposes deliverymanagement guidelines for construction-procurement strategy. This procurement strategy consists of a combination of the following: Deliverymanagement strategy, contracting and procurement arrangements (CIDB, 2010), and all the involved parties in the projects. These individuals should all adhere to this strategy. The CIDB (2010) indicates that the development of a procurement strategy should consist of identification of the best way of achieving objectives and value for money, whilst taking into account the risks and the constraints. Table 2.1 Outcome driven construction procurement Project objectives Performance measurement / Intervention Primary Cost Budget To comply with standards Quality Specifications Time Planned schedule Secondary Work opportunities to SMMEs Joint venture/ subcontracting Poverty alleviation Labour based construction To address socioeconomic problems Skills transfer Mentorship Gender and racial equality Preferential procurement policy Health (HIV/AIDS) and safety Training Desired outcome
Table 2.1 depicts both primary project objectives that are concerned the compliance with desired standards directly related to the project and secondary project objectives concerned with addressing socio-economic problem though the project: Cost: Ali and Kamaruzaman (2010) indicate that cost is a major problem in project development; and it is a regular feature in the construction industry. A project is deemed successful when cost is kept within the budget. Time: Timely completion of a construction project is frequently seen as a major criterion of project success by clients, contractors and consultants alike (Bowen, Cattel, Hall & Peal, 2002). Whenever the planned schedule is not adhered to, it means something has gone wrong. Quality: Quality in construction is defined as meeting or exceeding the needs of the customer (Knutson, Schexnayder, Fiori & Mayo, 2004). Quality standards will be met when specification will not be compromised.
Proceedings: 9th Built Environment Conference
2-4 August 2015, Durban, South Africa
ISBN 978-0-620-67120-0
page 293
Work opportunities to SMMEs: The South African history is characterised by vast racial and gender inequalities in the distribution of income, due to discrimination inherited from the apartheid government. In order to redress the inequalities of the past in every sphere – political, social and economic – the National Small Business Act 102 was introduced in 1996 to provide an enabling environment for SMMEs (DTI, 2003). The growth in the small and medium enterprise sector is desirable. Hence, the creation of an enabling environment would be an essential component for small and medium enterprise development (CIDB, 2004). Poverty alleviation: Poverty alleviation aims to reduce the negative impact of poverty on the lives of poor people, but in a more sustained and permanent way. Noble, Babita, Barnes, Dibben, Magasela, Noble, Ntshongwana, Phillips, Rama, Roberts, Wright and Zungu (2006) identified five areas of deprivation from the 2001 census to determine the poverty status in various South African provinces. These areas included income and material deprivation, employment deprivation, health deprivation, education deprivation and living environment deprivation. Poverty alleviation goes along with the provision of employment to poor historically disadvantaged individuals. Skills transfer: CETA (2008) promotes and accelerates quality training and identification of critical and scarce skills with a view to addressing skills shortages in the construction sector. Training was possible by a joint effort of various stakeholders such as government departments and public entities involved in contractor skills training, CETA accredited training providers, built environment professional bodies, construction employers’ bodies, labour organisations and trainees. Gender and racial equality: Given that South Africa is a patriarchal society, motherhood is the woman’s primary role such as raising children, caring for the home and seeing to the needs of the family and women were concerned with issues such as housing, food prices, and permits (Sout African History Online, 2011). Khuthaza (2012) believes that the implementation of policies that address gender equality, including the transformation of mind sets and the opening up of formerly male dominated industries, plays a critical role in determining the rate of economic growth and in sustaining socio-economic development. Health (HIV/AIDS) and safety: The construction industry still has a poor global health and safety record and South Africa is no exception (CIDB, 2009). Construction health and safety performance is influenced by the health and safety specifications and communication of health and safety expectations and requirements from one participant to the others,
Proceedings: 9th Built Environment Conference
2-4 August 2015, Durban, South Africa
ISBN 978-0-620-67120-0
page 294
and importantly, on the effective monitoring of and compliance with these expectations (CIDB, 2009).
3. NON-MONETARY INCENTIVES While monetary incentives can be measured in terms of money, the incentives which cannot be measured in terms of money fall into the category of “non-monetary incentives”. Non-monetary incentives do not involve direct cash payment (Yavuz, 2004). Juneja and Juneja (2008) indicates that besides the monetary incentives, there are certain nonfinancial incentives, which can satisfy the ego and the self-actualization needs of employees. Whenever managers wish to satisfy the psychological needs of their subordinates, they make use of non-monetary incentives. Some examples of non-monetary incentives are: Encouraging employees by providing them with autonomy in their job and participation in decisionmaking, assigning challenging duties, improving working conditions, recognising good work through small gifts, letters of appreciation, and suchlike.
4. METHODOLOGY The Principal component analysis (PCA) was done to generate a ‘total variance explained’, ‘component score covariance matrix’, ‘rotated component and component score coefficient matrices’ and ‘component plot in rotated space’ which formed a basis for customisation of PCA results to SWOT analysis. Abdi and Williams (2010) refer to PCA as a multivariate technique that analyses a data table in which observations are described by several inter-correlated quantitative dependent variables. PCA is appropriate when one has obtained measures on a number of observed variables and wishes to develop a smaller number of artificial variables that would account for most of the variance in the observed variables (SAS, 2011). Fellows and Liu (2008) stipulate that the principal components are extracted so that the first principal components account for the largest amount of the total variation in the data. Since the distinctive characteristic of principal components analysis is its data-reduction capacity, it must determine the number of factors to be retained (Fellows & Liu, 2008). However, for the purpose of the study, PCA results have been further traslated in a strengths, weakenesses, opportunities, and threats (SWOT) analysis quadrant as indicated in Figure 4.1. Jeyaraj, Muralidharan, Senthilvelan, and Deshmukh (2012) indicate that companies conduct the SWOT analyis as part of their strategic planning before formulation of their long and short term strategy. A methodological approach where SWOT and PCA were combined has been used in a case study by Jeyaraj et al. (2012) to analyse the short and long range strategy for a textile processing
Proceedings: 9th Built Environment Conference
2-4 August 2015, Durban, South Africa
ISBN 978-0-620-67120-0
page 295
organisation in India. For the purpose of the current study, the PCA was done on project objectives aligned with non-monetary incentives. The output generated ‘component plot in rotated space’ quadrants which were accustomed for SWOT analysis. A SWOT analysis is a strategic balance sheet of an organization; that is the strengths of the organization, the weaknesses of the organization, the opportunities facing the organization, and the threats facing the organization (Lusier, 2003; Williams, 2010). Robbins and Decenzo (2004) emphases that SWOT analysis refers to analysing the organisation’s internal strengths and weaknesses as well external opportunities and threats in order to identify a niche that the organisation can exploit. In the context of the study, SWOT is used to evaluate at what extend the provision of non-monetary incentives is successful in achieving infrastructure delivery objectives.
Figure 4.1 SWOT analysis quadrants (Own figure)
Figure 4.1 depicts SWOT quadrants in which ‘strengths quadrant’ suggests that the provision of non-monetary incentives is recommended in order to achieve project objectives. ‘Opportunities quadrant’ suggests a need for improvement in the provision of non-monetary incentives towards achieving project objectives. ‘Weakness quadrant’ suggests objectives falling there cannot be prioritised when offering monetary incentives. ‘Threat quadrant’ suggests the provision of incentive may not generate any positive outcome. Kvaløy, Nieken and Schöttner (2013) indicate that monetary incentives do not always improve performance. Arguably, if monetary incentives do not always improve performance, non-monetary incentives may be used alternatively. However, it is not obvious which objectives may be achieved when using non-monetary incentives and those one which cannot be achieved. The results of the PCA output from component plot in a roted space customised in a SWOT importance-success quadrants have been interpreted as follows:
Proceedings: 9th Built Environment Conference
2-4 August 2015, Durban, South Africa
ISBN 978-0-620-67120-0
page 296
Bottom right: items falling under this quadrant indicate strengths but facing greater threat threats than opportunities (Chang & Huang, 2006). In context of the study, either the lack or excessive incentive may compromise with the optimum achievment of project objectives.
Bottom left: items falling under this quadrant indicate low strengths and face threats (Chang & Huang, 2006). In the context of the study, threats to achieve a project objective may be eliminated if incentives could be set as a priority towards higher performance.
Top left: items falling under this quadrant indicate developing opportunities (Chang & Huang, 2006). In the context of the study, the achievement of a project objective may be improved by providing incentives.
Top right: items falling under this quadrant indicate sufficient strengths to adopt developmental strategies and opportunities(Chang & Huang, 2006). In context of the study, project objectives meet required standards and they have to be maintained and sustained through the provision of incentives.
A web survey strategy was used to gather the empirical data whereby a questionnaire was distributed nationwide. The quantitative approach was adopted whereby questionnaire survey was designed with closed-ended questions grouped into two sections. Section A requested the biographic profile of respondents. Section B concerned the importance of nonmonetary incentives offered towards the achievement of project objectives. Respondents were able to indicate on a 7 point Likert-scale how important non-monetary incentives offered towards the achievement of project objectives. In all instances where the Likert response format questions were used, the scale measurement was 1 = unimportant , 2 = little important, 3 = somewhat important, 4 = important, 5 = very important, 6 = extremely important, 7 = utmost important, and U = Unsure. One hundred and sixty four (164) construction members of the Engineering Council of South Africa (ECSA), South African Institute of Architects (SAIA), South African Council for the Quantity Surveying Profession (SACQSP), South African Council for Project and Construction Management Profession (SACPCMP), and general building contractors registered by the Construction Industry Development Board (CIDB) completed and returned the questionnaire.
Proceedings: 9th Built Environment Conference
2-4 August 2015, Durban, South Africa
ISBN 978-0-620-67120-0
page 297
Likert-type or frequency scales use fixed choice response formats and are designed to measure attitudes or opinion levels of agreement/disagreement (Bowling 1997). Using a 7 point Likert response format allows the respondents more granularity and hence better decisionmaking to express how much they agree or disagree with a particular statement. When using Likert-type scales it is imperative to calculate and report Cronbach’s alpha coefficient for internal consistency reliability for any scales or subscales one may be using (Gliem, & Gliem, 2003). Reliability is the extent to which a measuring instrument is repeatable and consistent (Maree & Pietersen, 2007). For this particular paper, the internal reliability of variables was tested by using Cronbach’s alpha coefficient of reliability. Maree and Pietersen (2007) suggest the guidelines for the interpretation of Cronbach’s alpha coefficient as follows: 0.90 – high reliability, 0.80 – moderate reliability, and 0.70 – low reliability.
5. FINDINGS 5.1 Profile of respondents From Table 5.1, it is evident that out of 7,629 delivered e-mails to respondents, only 178 responded using the web survey and their responses were subsequently downloaded in Microsoft Excel. In order to avoid any duplication, responses were further screened; thus, 144 respondents were retained and 34 were cancelled. The criterion for identification of a duplicated response was: similar responses throughout on two or more consecutive rows, and same date of submission. Other 20 respondents preferred to complete the questionnaire on a soft copy, thus the total number of respondents was 164; hence the research participation was 2.1%. Reasons for not participating included retirement, too busy with work, technical problem with internet. Missing data was not reported in tables and charts. Table 5.1 Targeted population Population Sent Not delivered Architects 1,730 442 Architectural technologists 1,372 300 Architectural draughtsperson 747 153 Consulting engineer 466 122 Project/construction managers 2,825 558 Quantity surveyors 719 215 Contractor, Grade 3 529 197 Contractor, Grade 4 802 310 Contractor, Grade 5 431 142 Contractor, Grade 6 467 238 Contractor, Grade 7 197 54 Contractor, Grade 8 80 25
Proceedings: 9th Built Environment Conference
2-4 August 2015, Durban, South Africa
Delivered 1,288 1,072 594 344 2,267 504 332 492 289 229 143 55
ISBN 978-0-620-67120-0
page 298
Contractor, Grade 9 Total Percentage
29 10,394 100
9 2,765 26.6
20 7,629 73.4
Figure 5.1 shows that 73.2% (120) of respondents had experience in the construction industry over 10 years, 22.0% (36) between 5 to 10 years and 4.9% (8) less than 5 years. 42.1% (69) of respondents had been in their current position over 10 years, 31.1% (51) between 5 to 10 years and 26.8% (44) less than 5 years.
Figure 5.1 Experience of respondents
Table 5.2 shows that participant companies included mostly contractors (27.8%), project managers (19.8%), architects (16.7%), quantity surveyors (16.7%), consulting engineers (8.0%). There were 2 missing values which were not reported in the Table.
Company Contractor Grade 2 Contractor Grade 3 Contractor Grade 4 Contractor Grade 5 Contractor Grade 6 Contractor Grade 7 Contractor Grade 9 Project Manager Architect
Proceedings: 9th Built Environment Conference
Table 5.2 Participant companies No. 1 7 5 7 8 9 9 32 27
% 0.6 4.3 3.1 4.3 4.9 5.6 5.6
2-4 August 2015, Durban, South Africa
27.8
19.8 16.7
ISBN 978-0-620-67120-0
page 299
Quantity Surveyor Consulting Engineer Government Academic Agent Construction Consultant/Developer Engineering Logistics Property Consultant Parastatal Construction Regulatory Total
27 13 4 3 2 2 2 2 2 1 1 162
16.7 8.0 2.4 1.9 1.2 1.2 1.2 1.2 1.2 0.6 0.6 100.0
5.2 Test of reliability Table 5.3 reports the reliability of non-monetary incentives aligned with project objectives. It is evident the study produced highly reliable measures ranging from 0.96 to 0.98. Table 5.3 Test of reliability of non-monetary incentives towards achieving project objectives Non-monetary incentives Project objectives No. of Cronbach’s Comments items alpha 13 0.97 Highly reliable Cost 11 0.98 Highly reliable Time 15
0.98
Highly reliable
Gender & racial equality
8
0.98
Highly reliable
Provision of work opportunities to SMMEs
5
0.97
Highly reliable
Quality
10
0.98
Highly reliable
Skills transfer
7
0.96
Highly reliable
Health (HIV/AIDS) & safety
7
0.97
Highly reliable
Poverty alleviation
5.3 PCA analysis for project objectives aligned with non-monetary incentives The importance of non-monetary incentives aligned with 8 project objectives in terms of their achievement of project success were subjected to principal component analysis using SPSS version 21.
Table 5.4 Kaiser-Meyer-Oklin Measure and Bartlett’s Test
Proceedings: 9th Built Environment Conference
2-4 August 2015, Durban, South Africa
ISBN 978-0-620-67120-0
page 300
KMO and Bartlett's Test Kaiser-Meyer-Olkin Measure of Sampling Adequacy
0.80
Approx. Chi-Square
63.93
Df
28.00
Sig.
0.00
Bartlett's Test of Sphericity
The Kaiser-Mayer-Oklin value in Table 5.4 was 0.80 and the Bartlett’s Test of Sphericity reached a statistical significance (0.00), supporting the factorability of the colleration matrix. The principal component analysis, as shown in Table 5.5, revealed the presence of two components with eigenvalues exceeding 1, explaining 52.63%, and 18.69% of the variance respectively.
Comp onent
Table 5.5 Total variance explained Extraction Sums of Initial Eigenvalues Squared Loadings Cumu % of % of Cumula Total lative Total Varian Variance tive % % ce
Rotation Sums of Squared Loadings % of Cumu Total Varianc lative e %
1
4.21
52.63
52.63
4.21
52.63
52.63
2.86
35.76
35.76
2
1.50
18.69
71.32
1.50
18.69
71.32
2.84
35.56
71.32
3
0.77
9.59
80.91
4
0.48
6.04
86.94
5
0.33
4.19
91.13
6
0.33
4.15
95.28
7
0.23
2.89
98.17
8
0.15
1.83
100.00 Table 5.6 Component score covariance matrix Component 1
1
2
1.00
0.00
2
0.00
1.00
A further analysis with a two-component solution displayed the same results, explaining a total of 71.32% of the variance, with Component 1 contributing 52.63% and Component 2 contributing 18.69%. To aid the interpretation of these two components, the varimax rotation was performed in Table 5.6. Table 5.7 Rotated component and component score coefficient matrices Rotated Component Score Component Communalities component matrix Coefficient Matrix
Proceedings: 9th Built Environment Conference
2-4 August 2015, Durban, South Africa
ISBN 978-0-620-67120-0
page 301
Component 1
2
Component 1
2
Extracted
Quality
0.91
0.37
-0.10
0.88
Time
0.91
0.38
-0.14
0.84
Cost
0.72
0.35
0.25
0.00
0.64
SMMEs
0.38
0.77
0.00
0.27
0.74
Skills
-0.37
0.74
-0.33
0.42
0.68
Poverty
0.33
0.74
-0.01
0.27
0.65
Health
0.35
0.71
0.00
0.25
0.63
Gender
0.42
0.68
0.04
0.22
0.64
The varimax rotation was proposed given that it was assumed that the variables are not correlated. This is confirmed by the value of the covariance which was 0.00, meaning two variables were independent of each other, and thus the value of one does not provide any assistance in predicting the value of the other. The communalities output in Table 5.7 showed that all values were above 0.3, health displaying the lowest value of 0.63. This confirms there was no need for refining the scale (Pallant, 2010:198).
5.4 Customisation of PCA output to SWOT From Table 5.7 the rotated solution converging in 3 iterations revealed that Component 1 items such as quality, time, and cost had a positive effect (positive component coefficients) on project success if aligned with nonmonetary incentives. However, Component 2 items such as skills transfer, and poverty alleviation had a negative effect (negative component coefficients) on project success if aligned with non-monetary incentives. This suggests that non-monetary incentives have little importance in motivating construction and consultant team members to achieve skills transfer, and poverty alleviation targets.
Proceedings: 9th Built Environment Conference
2-4 August 2015, Durban, South Africa
ISBN 978-0-620-67120-0
page 302
Figure 5.2 Component plot in rotated space
From Figure 5.2 it is shown that required standards are met for both primary and secondary project objectives. However, the lack of nonmonetary incentives towards performing primary project objectives may lead to dropping from strengths to threats. While non-monetary incentives may yield little to achieve secondary project objectives such as the provision of work opportunities to SMMEs, poverty alleviation, health (HIV/AIDS) and safety, and gender and racial equality located in the right top quadrant, monetary incentives may rather be offered. Furthermore, skills transfer located in the top left quadrant indicates there might be some opportunities for improvement by providing monetary incentives. It should be concluded that quality and cost need to be prioritised and the provision of non-monetary incentives would yield positive results.
6. CONCLUSIONS The study confirms the suitability of non-monetary incentives to achieve primary project objectives in delivering projects. It is therefore important to implement a procurement system having non-monetary incentive provision in contractual conditions. The CIDB (2010) indicates that the development of a procurement strategy should consist of the identification of the best
Proceedings: 9th Built Environment Conference
2-4 August 2015, Durban, South Africa
ISBN 978-0-620-67120-0
page 303
way of achieving objectives and value for money, whilst taking into account risks and constraints. Similarly, appropriate motivational incentives may be incorporated in contractual conditions so as to achieve specific project objectives. When planning the provision of incentives, the following questions should be answered along the process:
Will incentive be required to satisfy this project objective?
If yes, which types of incentive are available?
Which project team members would require incentives, and are their demographics influenced by incentives?
Which mechanisms are available to implement the provision of incentives
7. RECOMMENDATIONS Findings confirm the provision of monetary incentives towards achievement of secondary project objectives is at its full strengths. Standards should therefore be maintained to avoid falling from strengths to threats. Further studies should explore the suitability of non-monetary incentives towards the achievement of project objectives. 8. REFERENCES Abdi, H. and Williams, L.J. 2010, Principal component analysis, Wiley Interdisciplinary Reviews: Computational Statistics, 2 (4), 433–459. Ali, A.S. and Kamaruzzaman, S.N. 2010, Cost performance for building construction projects in Klang Valley, Journal of Building Performance, 1 (1), 110 -118. Bowen, P.A., Cattel, K.S., Hall, K.A. and Pearl, R.G. 2002, Perceptions of time, cost and quality management on building projects, The Australian Journal of Construction Economics and Building, 2 (2), 48-56. CETA, 2008, Construction Education Training Authority, (Available online http://www.ceta.org.za/ [accessed on 14/06/2001]). Chang, H.H. and Huang, W.C. 2006, Application of a quantification SWOT analytical method, Mathematical and Computer Modelling, 43, 158-169. CIDB, 2004, Construction procurement – Joint venture arrangements, best st practice guideline # D2”, 1 Ed. Of CIDB documents 1013, (Pretoria: CIDB Publications). CIDB, 2009, Construction industry health and safety in South Africa – Status and recommendations, (Pretoria: CIDB Publications).
Proceedings: 9th Built Environment Conference
2-4 August 2015, Durban, South Africa
ISBN 978-0-620-67120-0
page 304
CIDB, 2010, Delivery management practice guideline 2 – Construction procurement strategy, Version 9-1, (Pretoria: CIDB Publications). Department of Trade and Industry, 2003, South Africa’s economic transformation: A strategy for broad-based black economic empowerment, (Available online http://www.dti.gov.za/economic_empowerment/bee-strategy.pdf [accessed on 23/05/2011]). Fellows, R. and Liu, A. 2008, Research Methods for Construction, 3rd ed. (West Sussex: Wiley-Blackwell). Gliem, J.A. and Gliem, R.R. 2003, Calculating, interpreting, and reporting Cronbach’s Alpha reliability coefficient for Likert-type scales”, In: 21th Annual Midwest Research-to-Practice Conference on Adult, Continuing, and Community Education, 8-10 October, Columbus OH, 82-88. Jeyaraj, K.L., Muralidharan, C., Senthilvelan, T. and Deshmukh, S.G. 2012, Application of SWOT and principal component analysis in a textile company – A case study, International Journal of Engineering Research and Development, 1 (9), 46-54. Juneja, H. and Juneja, P. 2008, Management study guide, (Available online Jan 18, 2011 from http://www.managementstudyguide.com/index.html [accessed on 18/01/2011]). Khuthaza, 2012, Women and construction, (Available online http://www.khuthaza.org.za/index.php/khuthaza/women_and_constructi on_/ [accessed on 20/09/2012]). Knutson, K., Schexnayder, C.J., Fiori, C. and Mayo, R.E. 2004, Construction management fundamentals, (New York: McGraw-Hill Higher Education). Kvaløy, O., Nieken, P. and Schöttner, A. 2013, Hidden benefits of reward: A field experiment on motivation and monetary incentives, (Available online http://www.sv.uio.no/esop/english/research/news-andevents/events/guest-lectures-seminars/esopseminar/dokumenter/kvaloy-hidden-benefits-of-reward.pdf [accessed on 10/09/2014]). Lussier, R.N. 2003, Management fundamentals – Concepts, applications, nd skill development, 2 Ed. (Ohio: Thomson South-West). Maree, K. and Pietersen, J. 2007, Surveys and the use of questionnaires, In Maree, K. 2007, First steps in research, (Ed.), (Pretoria: Van Schaik Publishers). Noble, M., Babita, M., Barnes, H., Dibben, C., Magasela, W., Noble, S., Ntshongwana, P., Phillips, H., Rama, S., Roberts, B., Wright, G. and Zungu, S. 2006, The provincial indices of multiple deprivation for South Africa, (University of Oxford, Uk). Pallant, J. 2010, SPSS Survival manual – A step by step guide to data analysis using the SPSS program, 4th Ed. (Berkshire: McGraw Hill). Robbins, S.P., Decenzo, A.D. 2004, Fundamentals of management – essential concepts and applications, 4th Ed. (New Jersey: Pearson Prentice Hall).
Proceedings: 9th Built Environment Conference
2-4 August 2015, Durban, South Africa
ISBN 978-0-620-67120-0
page 305
SAS, 2011, Principal component analysis, (available online http://support.sas.com/publishing/pubcat/chaps/55129.pdf [accessed on 26/09/2011]). South African History Online, 2011, Women in South African history, (Available online June 01, 2011 from http://www.sahistory.org.za/pages/governence-projects/womensstruggle/index.htm [accessed on 01/06/2011]). Watermeyer, R.B., Gounden, S.M., Letchmiah, D.R. and Shezi, S. 1998, Targeted procurement: A means by which socio-economic objectives can be realised through engineering and construction works contracts, Journal of South African Institute of Civil Engineers, 40 (4), 15-25. Williams, C.R. 2009, Principles of management, 5th Ed., (South-Western: Cengage Learning). Yavuz. N. 2004, The use of non-monetary incentives as a motivational tool: A survey study in a public organisation in Turkey, MSc Dissertation, (Middle East Technical University).
Proceedings: 9th Built Environment Conference
2-4 August 2015, Durban, South Africa
ISBN 978-0-620-67120-0
page 306
ASOCSA2015-46
The shortage of trained artisans in the construction industry within Port Elizabeth Devan Mulder1, Brink Botha2, Franco Geminiani3, Robert Gerber4 Mulder.
[email protected],
[email protected], 3
[email protected],
[email protected], 1,2,3 School of the Built Environment, Nelson Mandela Metropolitan University, Port Elizabeth 6031, South Africa (Tel.: +27 415042085. Cell.: 0845533367) ABSTRACT AND KEYWORDS Purpose of this paper The South African construction industry is currently experiencing skills shortages of trained artisans. Skill shortages have become evident in all generic industries, including the construction industry, and are still very real and evident in South Africa today. New legislation has changed the face of training schemes in not only Port Elizabeth, but South Africa at large. Design/methodology/approach The aim of the study will focus on the skills shortages, and the initial presumption that the construction industry in Port Elizabeth had fallen victim to a shortage of skilled artisans. The design encompasses a literature review as well as a questionnaire based approached with selected construction industry stakeholders / respondents. The findings presented will indicate in a scientific manner if the skills shortages in the Port Elizabeth area are justified. Findings From the data collected the findings indicates that a shortage of artisans in the construction industry does exist. The construction industry is unattractive with regard to working conditions and remuneration which is not attracting sufficient new artisans. The general perception of the construction industry at large is negative in terms of working conditions, and has a poor image throughout. Value
Proceedings: 9th Built Environment Conference
2-4 August 2015, Durban, South Africa
ISBN 978-0-620-67120-0
page 307
This article is focused on the training and supply of skilled artisans in the building construction sector, and highlights the cardinal elements that caused the shortage of skilled artisans and the institutional- and educational challenges in producing quality artisans. The research work reviews the problem of skills shortages in the South Africa’s building construction industry, its major causes and will attempt to provide a possible solution. Future research opportunities are identified. Keywords: Training Schemes; development; employment. 1. INTRODUCTION / BACKGROUND There appears to be evidence that challenges exists to restore or replace the skills development schemes that are intended to produce the wide range of skills required by the construction industry currently in Port Elizabeth. According to the Skills Development Act (SDA) of 1998, proposed the establishment of Sector Education and Training Authorities (SETAs) in place of the traditional apprenticeship system. Furthermore, the government’s Skills Development Strategy for Economic and Employment Growth (SDSEEG) in South Africa was released in 2001, and were intended as mechanisms for producing adequate skills that the country requires (Kraak, 2008). However, since their establishment, SETAs have been challenged by claims of non-delivery and mismanagement. The effects of the poor training schemes that have been implemented reverberate throughout the construction industry. While numbers of artisans appear to be increasing, unfortunately levels of competence are causing concerns for the construction industry. This paper intends to identify and resolve problems arising from subsequent challenges posed by a lack of properly trained artisans. Solutions and further recommendations will be proposed. 2. REVIEW OF RELATED LITERATURE AND PRESENTATION OF THE CONCEPTUAL FRAMEWORK According to Shah, Burke, & Richardson: (2007) the demand for artisans is greater than the supply of qualified artisans. (Agapiou and Dauber: 2001) states that the construction industry is renowned for shortages of qualified artisans. According to Geminiani & van Wyk: (2002:8), Questions commonly asked are; “Where have all the apprentices gone? Why are there no more opportunities for training of apprentices? Does the present system of training apprentices substantiate the needs? Where do people go to learn specific trade? Utting (2010) argues that organisations may incur difficulty in recruiting artisans even though there may be an adequate supply of skilled artisans. Employers are struggling to attract sufficient,
Proceedings: 9th Built Environment Conference
2-4 August 2015, Durban, South Africa
ISBN 978-0-620-67120-0
page 308
suitable employees due to the characteristics of the industry, and relatively low remuneration. The New Civil Engineer (NCE) cites Utting: (2010) claiming that skills shortages are not unique to generic artisans, but also include managers and professionals in construction. . Harraway (2007) cautions that the communication of a rewards strategy is as important as it’s design. “A poor communicated plan is better than the best strategy communicated poorly.” As a retention mechanism and a performance driver, long-term incentive schemes form a key component of attracting new artisans. Warne, (2009:3) claims that the construction industry has a poor image, and lacks attraction of new entrants to the construction industry. Warne further states that it is important to recruit new artisans / apprentices for the future of the construction industry. Loosemore et al., (2003: 7) states that the poor image and lack of recruitment of the construction industry include the following factors: The site-based and itinerant work patterns, that result in job insecurity; Construction workers continually having to relocate in pursuit of new project opportunities; The poor working conditions experienced on sites; Health and safety records; Poor employee welfare provision within the industry; The industry’s association with blue-collar positions, and The male-dominated and discriminatory culture that the industry commonly portrays. According to Maas (2002), there are concerns about the shortage of skilled artisans in the building industry. Deliberations and input from the Master Builders Associations (MBAs), the CETAs and various stakeholders, acknowledge that the number of artisans is lacking and dismally low. Maas further concludes that neither the Skills Development Act, nor the regulations contain any provisions, nor do they create circumstances, which facilitate education in training. MBAs will continue to communicate with all the relevant government departments and industry stakeholders. Malan (2011) added that alternative trades such as welders, electricians, fitters have to be imported from other countries. Geminiani and van Wyk, (2002:8) claim that the changes in the training systems and the introduction of the SDA have affected the construction industry. Furthermore, according to the industry, there is no clarity on the new education systems and its implications. The construction industry claims that in the past, apprenticeship systems were operational. Apprentices would after a certain period of time become skilled artisans and become master artisans of their trades. It is expected of qualified artisans working in the construction industry to perform certain duties, such as working unsupervised, and performing a full day’s work while ensuring that quality is not compromised. Kraak (2008) added that although the South African economy has dramatically improved during the period 2001 to 2005, with a
Proceedings: 9th Built Environment Conference
2-4 August 2015, Durban, South Africa
ISBN 978-0-620-67120-0
page 309
growth rate of 5 present in 2006, these positive developments have not filtered down into the education and training domains. Observations made include that the South African society has shifted form an era characterised by economic stagnation in the 1990’s to one in which the rate of economic growth is far outstripping the ability to provide the necessary quantity and quality of skills. Blaine and Le Roux (2006) claim that there is a training crisis in the construction industry Scarce skills or skills shortages are the necessary competencies that may be applied in a particular context of for a particular purpose (NACI, 2003). (NACI, 2003) further states that these scarce skills could have a negative impact on the economy of South Africa. Artisans in the built environment were in the past expected to have completed an apprenticeship training period; normally by receiving training at institutions such as those provided by the former BIFSA colleges in Cape Town, Durban, Port Elizabeth or Springs, (BIFSA, 1996). An artisan is, as described by Brookes et al., (2004: 65) as “someone who does skilled works with their hands”. It is generally expected of an artisan to produce an end-product of a quality accepted by the client, and these artisans would be expected to work unsupervised for long periods of time, be able to read and interpret drawings and to carry out instructions set out in specifications on drawings. There appears to be a sharp decline in training areas crucial to reconstruction and development relative to building and civil engineering. Questions are raised about the relevance of the training that centers provide. Structured skills development is critical to the success and need in the construction industry and no one organisation can work in isolation with another to develop skills. Larger firms have already formed joint ventures to address the need for skills development. Murray & Roberts, states in its internal bulletin that a large global publicly traded South African construction engineering and contracting firm, aims to establish a training academy that will serve as a center for excellence and will initially train its own employees, but move to assist in training others for the industry. Mahobe (2005) states that the training will target both artisans as well as specialist labour. Utting (2010) states that organisations may have trouble in recruiting artisans even through there may be an adequate supply of skilled workers. Employers are struggling though to attract sufficient suitable employees due to the characteristics of the industry, relatively low remuneration, poor working conditions, and poor image of the industry, ineffective recruitment and inappropriate advertising. According to Haupt et al (2005:87) the following were suggested in an attempt to alleviate the skills shortages: An overhaul of the role of the CTEA in facilitating construction skills training; A comprehensive review of current industry development and training strategies including learnerships;
Proceedings: 9th Built Environment Conference
2-4 August 2015, Durban, South Africa
ISBN 978-0-620-67120-0
page 310
The development and introduction of more meaningful financial incentives and funding arrangements to train and re-train construction human capital at all levels; To develop and introduce aggressive campaigns to positively promote careers in the construction industry including the provision of more attractive bursaries at high school and higher education levels; A review of the current labour legislative frameworks which has arguably contributed to the shift to informal employment and increased use of labour brokers, some of whom supply cheap labour including illegal immigrants; The promotion and development of longer term training programmes that target skills that have low and medium transferability rather than narrow, short term task-related training while encouraging improved qualifications through industry-sensitive and relative training; Construction management and construction project management training targeted, inter alia, to improve the quality of supervision, tendering and project financial management, project scheduling and SHEQ management; The inclusion in training programmes of generic skills training such as working in teams and the ability to adapt to changing environments, and Providing incentives for practices and policies that targets recruitment from non-traditional sources such as women and persons with disabilities, while improving older and experienced worker retention.
From the review of the related literature, this research evolved the following theoretical framework. The diagrammatic layout indicates the identified variables relative to negative issues linked to the image and prospects of the construction industry. Ultimately, the resultant investigation will confirm if there is a shortage of artisan skills in the Port Elizabeth area.
Proceedings: 9th Built Environment Conference
2-4 August 2015, Durban, South Africa
ISBN 978-0-620-67120-0
page 311
THEORETICAL FRAMEWORK
3. RESEARCH METHODOLOGY This research methodology was preferred in order to evaluate how the independent variables affected the numbers of trained artisans in the construction industry in Port Elizabeth. This study will consist of a questionnaire survey. The questionnaires are compiled based on the concepts identified in the literature review previously presented, which identified various contracting personnel at an upper level of management. The first section indicated the demographic information of the respondents. The second section was concerned with the unattractive nature of the construction industry. Thirdly, the research surveyed how demand for artisans, and lastly the pass rates of training programmes were questioned. The responses to the demographic questions were measured in the form of multiple-choice options and the elements within the independent variable were measured on a five point Likert Scale. The research data used to measure the independent variables that were previously mentioned is analysed in order to gain an estimated of the situation present throughout the country. The advantages of using a quantitative measurement tool is that the responses are represented on a numerical rating scale and can readily be reproduced in a statistical format, using graphs and tables, which are easily read and interpreted. This research was based from the viewpoint of the construction industry as a whole, but more specifically the focus targeted the Port Elizabeth precinct. A paradigm shift relative to the literature investigated and reviewed
Proceedings: 9th Built Environment Conference
2-4 August 2015, Durban, South Africa
ISBN 978-0-620-67120-0
page 312
identified the valid opinions of experienced industry members who have a similar viewpoint. This paradigm shift links to the purpose as it indicates that there is a shortage of skilled artisans in the construction industry and the need to improve on these numbers in order to bring about significant positive changes to the industry. . The data collected during the empirical process aimed to determine the perceptions of correctness, applicability, extent of application etc. This data was collected from the contractors, foremen, managers, quantity, surveyors, and site agents. This data was interpreted using the descriptive statistical method of data analysis. The researcher identified qualified individuals as they would be able to provide the researcher with accurate data. Selected both male and female respondents of various ages, qualifications and experience levels in order to gain an unbiased data were approached. The professionals are located in Port Elizabeth and were familiar with the present artisan’s challenges in the construction industry. 4. THE RESULTS In this section this paper reports graphically as well as interpretational on the results of the empirical process of the research conducted towards this paper. 4.1 DEMOGRAPHICAL Figure 1 indicates the field of expertise that the respondents were qualified in. According to the pie chart there appears to be an equal spread of the various respondents.
Proceedings: 9th Built Environment Conference
2-4 August 2015, Durban, South Africa
ISBN 978-0-620-67120-0
page 313
4.2 GENDER OF THE SAMPLE STRATUM (2014) Figure 2 below indicates the male and female respondents that participated as and surveyed as part of the sample stratum:
What role do you occupy within the construction Industry? Quantity Surveyor
Proceedings: 9th Built Environment Conference
[],
[],
[]
[],
Constractor Architect
2-4 August 2015, Durban, South Africa
ISBN 978-0-620-67120-0
page 314
4.3 QUALIFICATION OF THE SAMPLE STRATUM (2014) Figure 3 Indicates the highest formal qualification of the all the respondents within Built Environment as per below:
Please indicate your highest formal qualification [],
BSc
[],
[],
BSc Honours Btech Ndip
[],
Proceedings: 9th Built Environment Conference
2-4 August 2015, Durban, South Africa
ISBN 978-0-620-67120-0
page 315
4.4 GRAPH DEPICTING PROMINENT VARIABLE RESULTS FROM STATISTICS (2014) The Figure below indicates that the majority of the respondents believe that the industry is unattractive to artisans. The highest degree of correlation is indicated under the ‘Agree ba’r. This clearly indicates the majority justifying that there is a skill shortage.
Proceedings: 9th Built Environment Conference
2-4 August 2015, Durban, South Africa
ISBN 978-0-620-67120-0
page 316
4.5 GRAPH DEPICTING PROMINENT VARIABLE RESULTS FROM STATISTICS (2014) The Figure below indicates a that the majority of respondents believe that training programmes are not up to standards in terms of the number of artisans passing there trade test.
Data were selected from relevant sources, journals, reports, the World Wide Web, libraries, at institutions affiliated to the construction industry and industry members. A questionnaire was compiled using a 5 Likert scale obtaining relevant data from selected respondents. Data was used by statistical processes. Questionnaire findings correlated with the literature received, and the findings of the study. From the data collected the findings indicated that a shortage of artisans in the construction industry does exist. The construction industry is unattractive with regard to working conditions and remuneration being a reason which is not attracting sufficient new artisans. Findings indicate that Contractors need incentives so as to reach out to schools and local communities in order to actively recruit young aspiring
Proceedings: 9th Built Environment Conference
2-4 August 2015, Durban, South Africa
ISBN 978-0-620-67120-0
page 317
individuals into the industry by indicating an attractive working environment and a prosperous career path. 5. CONCLUSION The initial presumption was that the construction industry in Port Elizabeth had fallen victim to a shortage of skilled artisans. Findings indicate that the shortage is a real concern to the construction industry operating in the Port Elizabeth area. In the past, companies were responsible for the training of artisans and appeared to create a situation where the supply of skill artisans met the demand of industry. In summation, further benefits offered by leading companies for trained artisans could be even more of an incentive to get trained and qualified. Factors such as medical aid, transport assistance and housing subsidies are incentives that could draw more artisans into the industry. There is a need to analyse the current artisan training frameworks currently operating and to evolve new training process in line with previous dispensation. 6. RECOMMENDATIONS The industry is aware of the current skills shortage problem and it is time to implement remedial action and rectify the problem of a shortage of skilled artisans within the industry. The construction industry as a whole should investigate the possibility of incentives in order to actively recruit young aspiring individuals into the industry by indicating an attractive working environment and a prosperous career path. Methods such as open days and active talks in communities and school should aid in the recruitment process. FURTHER STUDIES
Seek to investigate the opinions of artisans and labourers on how improvements to their training and numbers can be achieved; Isolate the research to specific trades and compare the numbers of skilled artisans in each trade to one another; Comparing male and female trainees and skilled trained artisans to comparing the productivity relative to the younger generations;
REFERENCES
Proceedings: 9th Built Environment Conference
2-4 August 2015, Durban, South Africa
ISBN 978-0-620-67120-0
page 318
Agapiou, A., & Dauber, V. (2001). Changing skill needs and training requirements in the scottish construction industry. Proceedings of the RICS foundation – Construction and building Research conference (COBRA 2001), Glasgow Caledonian University, 3-5 September 2001, London, RICS foundation. BIFSA 1996. Building and Allied Industries Official handbook July 1996 Editions. Johannesburg. Blaine, S. ad Le Roux, M. 2006. Construction industry scrambles for staff. Business day [Online] 18 October 2006. Available from: http://www.eprop.co.za (Accessed 01 June 2009). CETA, 2000. Construction Education and Training Authority. Sector Skills Plan. Current education and training supply for the Construction Industry. Geminiani, F.L., Smallwood, J.J Van Wyk, J. J. (2005). A review of the effectiveness and appropriateness of the occupational health and safety inspectorate in South Africa. Rethinking and revitalising Construction safety, health and quality. Port Elizabeth, South Africa. Harraway, R. 2007. SA firms must get incentives in bid to retain best staff. Available from: http://www.businessday.co.za/articles/management.aspx?ID=BD4A32745 5 (Accessed 28 February 2007). Haupt, T. C., Miller, S., & Chileshe, N. (2005). Report on the profile of construction skills in the Western Cape. Southern Africa Built Environment Research Center. Kraak, A., & Press, K. (2008). Human resources development review 2008: education, employment and skills in South Africa. Loosemore, M., Dainty, A., & Lingard, H. (2003). Human resource management in construction projects: strategic and operational approaches. Taylor & Francis. Maas, N, 2005. Lack of Skills worries building trade Cape Argus [Online] 10 April 2002. Available from: http://www.12b.co.za (Accessed 30 November 2005). Malan, M. 2011. 2003 NHBRC to address skills training. SA Builder, July 7. Shah,C., & Burke, G. (2003). Skills Shortages: Concepts, Measurement and Implications. Working Paper No. 52. Centre for the Economics of Education and Training, Monash University. Utting, P.L., 2010. The risk of skills shortage in construction. Proceedings of the ASOCSA – The fifth Built Environment Conference, Southern Sun, Elangeni Durban, South Africa, 18 – 20 July, 262 -275. Warne, L. 2009. Skills in the construction industry – 2009. [Online] Available from: http://www.ciob.org/resources/research.
Proceedings: 9th Built Environment Conference
2-4 August 2015, Durban, South Africa
ISBN 978-0-620-67120-0
page 319
ASOCSA2015-55
The theoretical framework for optimising construction role-player performance Andre Hefer1, Winston Shakantu2, Franco Geminiani3, Brink Botha4 1
[email protected],
[email protected], 3
[email protected],
[email protected] 1,2,3,4 Faculty of Engineering, the Built Environment and Information Technology, Nelson Mandela Metropolitan University, Port Elizabeth 6031, South Africa (Tel.: +27 415042085. Cell.: 0741334626) ABSTRACT AND KEYWORDS Purpose In many instances, the construction industry is seemingly not living up to expectations and performance is deemed to be sub-optimal. To buck the trend, researchers have previously identified and isolated many quantifiable concepts which should be able to create better performing construction projects. Design The mentioned information in the paper flows from a comprehensive literature review on current issues in the construction industry. In search of the optimal performing project team, the paper proposes a theoretical framework and relevant concepts which will be the basis for a future PhD research undertaking. The framework incorporates Hertzberg’s Two Factor Theory and relevant performance models to guide the future research related to optimizing construction project role-player performance. Findings The noted Theoretical Framework in itself suggests certain implications for the future research, but also implies change in the way which future projects in the construction industry could be managed.
Proceedings: 9th Built Environment Conference
2-4 August 2015, Durban, South Africa
ISBN 978-0-620-67120-0
page 320
The theoretical framework combined with the embedded concepts makes a direct case for project leaders or managers to focus on certain key principles related to the construction clients, contractors and consultants in project teams. Specific focus is placed on motivation and the creation of an opportune operating environment. The future planned PhD research will relate to enhanced understanding of the sub-optimal performance phenomenon, comprehension of possible drivers of project performance, and ultimately lead to higher project success rates. Keywords: Construction, role-players, performance; project management, theoretical framework 1. INTRODUCTION AND BACKGROUND st
The manner in which business and concerns will operate in the 21 Century will differ greatly from the previous century. An entirely new and revised set of hard (methods, tools & systems) and soft skills (attitude, style, judgment & ability) will be required to manage and lead in this constantly changing and fast paced environment (Ballard & Howell 2004; Froese 2010; Lee & Yu 2012; Egan 1998; Dainty et al. 2003; Edum-Fotwe & McCaffer 2000). In an industry where the sub-optimal performance is well documented, the construction managers and leaders will have to be even more vigilant in their attempts to change and adapt to the foreseen challenges (Carr & Tah 2001; Leung et al. 2004; Meng 2012; Aibinu & Jagboro 2002; Assaf & Al-Hejji 2006; Takim & Akintoye 2002a; Xue et al. 2007; Emuze 2011; Ballard & Howell 2004). Eagan (1998) famously stated towards the end of the last century that “the industry will need to make radical changes to the processes through which it delivers its projects”. Typically the construction project team environment differs in many ways to a normal operations management situation. The construction project environment has a unique and intricate set of variables related to the industry and how these teams operate (Shelbourn et al. 2006; Herroelen & Leus 2004; Rezgui 2007; Ballard & Howell 2004; Bertelsen et al. 2007). The project teams are, in most cases, made up of individuals from a range of organisations and backgrounds, which provide multidisciplinary input (Shelbourn et al. 2006). Related to the diverse teams, Fong and Lung (2007) note that most research has focussed on factors necessary for team success rather than investigating the human and individual views of team role players. In the following sections, the readers will be guided through a summary of the future research undertaking to ensure comprehension of the need for the research and as background for the Theoretical Framework development. The creation and logic behind the Theoretical Framework will be discussed. The framework will form part of a PhD research undertaking to seek greater understanding and appreciation of
Proceedings: 9th Built Environment Conference
2-4 August 2015, Durban, South Africa
ISBN 978-0-620-67120-0
page 321
the sub-optimal performance in an industry which has specific challenges. The framework would indicate co-existence of motivation and an opportune operating environment towards an individual’s performance and argues the frameworks influence by Herzberg’s Two Factor Theory. 2. REVIEW OF THE RELATED LITERATURE Guided by the general debates on performance in the construction industry, and seeing that the discipline of construction Project Management is practiced in an industry with a defined culture and style, it is proposed that the nuances of motivation and performance environment factors be investigated. The understanding of the motivation and project environmental factors could: Enhance the Industry and Project Managers understanding of the phenomenon of sub-optimal performance experienced by the construction project teams, Be a possible driver towards better project performance, and Lead to higher project success rates. Leading from the above possibilities, the aim and direction of the future study will apply to motivation of project teams towards optimum performance to not only achieve, but exceed construction client goals in the 21st Century. It will also aim to seek understanding of the current suboptimal performance of construction role players in the project team environment, and how Project Managers could assist in noticeably moving the industry in a more positive direction. Furthermore, the future study is in line with calls to further the Project Management discipline specific theory and thus build the body of knowledge which is only applicable to this field of management (Winter et al. 2006; Söderlund 2004). The proposed research will also adapt the same approach as the Egan report (1998), which probed other industries for answers to the questions and challenges experienced in the construction industry. For clarification and for the purpose of understanding the importance of the future study further, the metaphor of a stopwatch in athletics could be used. In many instances, the outcomes of current research are adding to the complexity and accuracy of the stopwatch, measuring the various outcomes. Where the proposed research undertaking will be aimed at looking at: Why the athlete runs? What could make them faster? What inhibits their training and preparation? And, what mental state is required to run faster? Taking the above metaphor and the mentioned negative outcomes into account, the future research will endeavour to create understanding of a complex topic and probe the areas of team operation and individual functioning which is less apparent or tangible, than for example, financial,
Proceedings: 9th Built Environment Conference
2-4 August 2015, Durban, South Africa
ISBN 978-0-620-67120-0
page 322
time or quality parameters. The research and its outcomes could be a starting point to resolve the current symptoms of sub-optimal performance. 2.1 Future Research: Literature Review Summary Henning et al. (2004) notes that one of the first tasks of a literature review is to contextualise the research undertaking to be able to argue a case and identify the unique contribution that the research will make. The aim of the literature review has been: To enable readers to comprehend the manner in which constructs are viewed, used, discussed and researched in the construction industry, To examine the various issues and perspectives currently held, To enlighten the readers with regards to the broad views and themes currently being debated and researched in the Construction and Project Management fields, and Give context to the theoretical framework of the future research. The views stated in the reviewed literature can be summarised as follows: The current state of the construction industry performance is not optimal (Carr & Tah 2001; Leung et al. 2004; Meng 2012; Aibinu & Jagboro 2002; Assaf & Al-Hejji 2006; Egan 1998; Takim & Akintoye 2002b; Xue et al. 2007; Emuze 2011; Ballard & Howell 2004). There are definite calls for, and advantages seen in changing the ways that project performance is measured (Hughes et al. 2004; Takim & Akintoye 2002b; Cheung et al. 2003). Individual role-player’s performance on project teams is reliant on certain factors (McShane & von Glinow 2013; Scholl 2003; Werner et al. 2011; Herzberg 1968; Herzberg 1965). Current tender and procurement practices are not conducive to performance (Egan 1998; Eriksson & Westerberg 2011; Black et al. 2000; Meng 2012). Motivation, as one of the factors which impacts performance, is an important factor for Project Managers to influence (Chinowsky et al. 2008; Jay 2003; Peterson 2007). The manner in which human resources are managed, have a definite impact on project success (Emuze 2011; Tabassi & Bakar 2009; Tabassi et al. 2012; Raiden et al. 2004). Project success is ill-defined, but is still a specific goal in the industry (Chan et al. 2004; Deacon 2011; Barnes 1988; Hughes et al. 2004; Dainty et al. 2003; Acharya et al. 2006; Olander 2007). The construction industry is a challenging environment for role-players (Bertelsen et al. 2007; Shelbourn et al. 2006; Herroelen & Leus 2004; Rezgui 2007; Ballard & Howell 2004).
Proceedings: 9th Built Environment Conference
2-4 August 2015, Durban, South Africa
ISBN 978-0-620-67120-0
page 323
Project teams have many nuances, which makes management of these teams difficult (Fong & Lung 2007; Jay 2003; Pheng & Chuan 2006; Baiden et al. 2006). Project role-players are defined and important (Assaf & Al-Hejji 2006; Wang & Huang 2006; Meng 2012). Project Management has a major role to play in the attainment of project success (Pheng & Chuan 2006; Toor & Ofori 2008; Howell & Koskela 2000). Information Technology will change the way in which projects are managed (Lee & Yu 2012; Froese 2010; Alshawi & Ingirige 2003; Rezgui 2007). The 21st century is bound to change the management landscape and give rise to new challenges for the industry and Project Management (Dave & Koskela 2009; Rezgui 2007; Ballard & Howell 2004; Froese 2010; Lee & Yu 2012; Egan 1998; Dainty et al. 2003; Toor & Ofori 2008). Research undertaken in the industry mostly relate to technical project related matters (Peterson et al. 2011; Chinowsky et al. 2008)
Based on the above mentioned literature, the following was established as the main research problem and question for the upcoming research: Main research problem: Construction role player performance is currently sub-optimal. Main research question: How could role-players be motivated and the operating environment improved to ensure optimal performance on a construction project? 2.2 Future Research: Methodology, Approach, Design & Method Henning et al. (2004) states that “each study stands or falls on its methodological qualities”. Epistemologically, the researcher’s stance will be Subjectivist. Thus interpreting the various views and experiences of the various role-players subjectively. Ontologically, the research will identify with the internal reality of each role-players personal and subjective experience. Each person has a subjective view, interpretation and experience of their own relation within the team and what a performance environment would or could be. Each person will also have the same subjective views of what could motivate them towards optimum performance. The above mentioned aligns with an Interpretevist paradigm. The research approach would be Qualitative. The major reasons for opting for a qualitative approach could be summarised as: There is a definite move towards more qualitative approaches (Thorns 2012)(Amaratunga et al. 2002) being used which is driven by the need to comprehend material and nonmaterial issues (Thorns 2012). It is
Proceedings: 9th Built Environment Conference
2-4 August 2015, Durban, South Africa
ISBN 978-0-620-67120-0
page 324
further stated that there are clear signs of growth in the use of qualitative research approaches in the built environment (Amaratunga et al. 2002) (Adejimi et al. 2010). Currently in the construction industry, many researchers only associated research with using a quantitative approach (Adejimi et al. 2010). A journal article related to using qualitatively enriched semi-structured questionnaires, indicate that the qualitative data can give rich and meaningful results (Adejimi et al. 2010), which is exactly what is required to answer the future study’s research questions and deal with the intricate phenomenon of sub-optimal performance. Qualitative research could be a powerful tool to study the meaning that people place on events, processes and structures (Amaratunga et al. 2002). Finally, but probably the most important, the aims of the future research will be best met by a qualitative approach (Morse & Richards 2002:25). The research question and subsequent objectives in this instance will not be informed by measureable outcomes and variables, which would lead to better understanding and appreciation of the suboptimal performance phenomenon. The major desire for understanding, greater insight and future application will be met by a qualitative approach towards the research. Morse & Richards (2002:5) states that qualitative research gives the researcher the following options, which in this study could assist in meeting the objectives: Different perspectives of viewing the current reality, Different ways in which to organise chaos, Using of different types of data, and Using the above to interpret different realities.
A Multiple/Collective Case Study design has been chosen “to shed light on a larger class of cases (a population)” (Gerring 2007). The qualitative case study gives the researcher the possibilities to identify, pursue and clarify “ritualistic academic blind alleys” (Flyvbjerg 2006). Finally, the method of soliciting the data will be interviews. 2.3 Future Research: Strategy The research strategy will comprise of the following stages: First Stage – Desktop Literature Analysis Survey The first stage will encompass the extraction of data from research articles, journals and other written sources relevant to the motivation strategies and optimal performance environment elements as used in other selected industries. A list of applicable issues, observations or trends will be compiled. The industries chosen to be applicable, will be identified by using
Proceedings: 9th Built Environment Conference
2-4 August 2015, Durban, South Africa
ISBN 978-0-620-67120-0
page 325
a set of criteria which would relate their situation and context to the construction industry. For example: The motor industry, due to the fact that it also has a typical design and production function. Second Stage – Interviews The second stage will entail interviewing construction industry role players. In all cases, the interviews will focus on the context of each participant and aim to solicit detailed information regarding their perceptions and their own experiences. In both stage one and two, the literary/transcribed word data will be analysed for content through coding in order to theme the data. ATLAS.ti Qualitative Data Analysis & Research Software will be used to analyse the data. Third Stage – Expert Panel discussion The nuances in the two sets of interpreted data from stage 1 and 2, will be tabled and diagrammatically presented. The tables and diagrams will be used in an expert panel discussion to reflect on findings and ways in which the current situation can be addressed. Also, which of the motivational strategies used by other industries could influence or be adapted for use in the construction industry. Morse & Richards (2002:18) suggests that the data should be creatively played with to move beyond “tidy explanations”. See the figure 1.1 below for a graphical presentation of the above mentioned.
Proceedings: 9th Built Environment Conference
2-4 August 2015, Durban, South Africa
ISBN 978-0-620-67120-0
page 326
Research Question
Literature Review
Stage 1
Stage 2
Specific Literature Review
Qualitative Data Collection
Analyse/Interpret
Analyse/Interpret
Stage 3 Analyse/Interpret
Expert Panel Discussion
Conclusions & Recommendations Figure 1 Future Research Strategy
3. THEORETICAL FRAMEWORK Henning et al. (2004:25) makes it apparent that the theoretical framework gives the research a clear and identified position in the discipline in which the research is undertaken. Henning et al. (2004:25) further states that the chosen theoretical framework provides a lens or viewpoint from which the world is perceived. When observing the various management theories and models used in general and operational management fields, it could be seen to have had positive outcomes related to optimising team performance (Werner et al. 2011; Gerber et al. 1998). Famous motivation theorists like Abraham H. Maslow, Clayton Alderfer, David C. McClelland, Frederick Hertzberg, Lyman Porter and Edward E. Lawler, Locke & Latham, B.F. Skinner, J.S. Adams and V. Vroom has been monumental in their findings and impact, and have virtually become household names in all types of management curriculum and academic writing worldwide. It has also been clearly sited
Proceedings: 9th Built Environment Conference
2-4 August 2015, Durban, South Africa
ISBN 978-0-620-67120-0
page 327
that links are shown between being motivated, the operating environment and an individual’s performance (Werner et al. 2011; Scholl 2003; McShane & von Glinow 2013). The three constructs (motivation, environment & performance) virtually operate in tandem, but is not isolated or the soul source of individual performance (Werner et al. 2011; Scholl 2003; McShane & von Glinow 2013). The mentioned motivation theories are usually defined in two categories, namely Content or Process theories. Content theories focusing on what motivates people, and the Process theories which directs its focus to how people are motivated (Werner et al. 2011) (Gerber et al. 1998) (Verma 1996). Views and perception from both the content and process theories are seen to be of assistance in guidance towards the possible resolution of the research problem. Specific interest and focus will be placed on the theory developed by Frederick Herzberg in the 1950’s. Strongly related to Hertzberg’s Theory, both Werner (2011), Scholl (2003) and McShane & Von Glinow (2013) have created models which indicate links between motivation, operating environment and an individual’s performance. Henning et al. (2004:26) indicates that the theoretical framework provides the researcher with the space within which he or she can clearly indicate their biases towards a study. Thus, the mentioned theory and models relates strongly to the research question which is aimed at gaining insight into the motivation and project environmental factors within construction project teams. 3.1 Herzberg’s Theory Herzberg’s theory is mostly known as the “two-factor” or “motivator/hygiene” theory (Werner et al. 2011). Verma (1996:56) quotes Frederick Herzberg which famously stated that: “Motivation is an intrinsic phenomenon. Extrinsic satisfaction only leads to movements, not motivation.” Gerber et al (1998:279) notes a very close relation between Maslow’s theory and Hertzberg’s theory. Gerber et al (1998:279) indicates that Herzberg’s findings added the following valuable insights: Broadened outlook of Maslow’s theory and application to the workplace, Focus on task enrichment to motivate, Explanations related to the limited influence on motivation of money, fringe benefits and working conditions, and Managers focus mostly on hygiene factors, which will not motivate workers. All of the above are invaluable insights when leading and managing individuals in teams. Verma (1996:64) states that Herzberg’s theory is a very controversial theory due to the fact that it proposes the following:
Proceedings: 9th Built Environment Conference
2-4 August 2015, Durban, South Africa
ISBN 978-0-620-67120-0
page 328
That some work related factors could only lead to satisfaction and others would only assist a person becoming dissatisfaction which could put a person in a “neutral” position of no dissatisfaction; and That the level of the “neutral” position could escalate as people expect more.
Related to Herzberg’s theory, and of specific interest to the research outcomes are the following: What the major performance barriers could be for project role-players which would keep hindering them from being satisfied in the project team environment (Project Hygiene Factors), Possible strategies for motivating role-players towards optimum performance from the “neutral position” (Project Motivators), Enhance Project Managers capabilities on the formation of optimum performing teams, and Identifying feasible motivation strategies which have been used with success in other industries, for use in the construction project environment. 3.2 Performance models As noted in the literature review summary, Werner et al (2011) notes that performance levels of individuals can relate to the following factors: Inherent ability, Developed competencies, Opportunity, and Motivation. Scholl (2003) and McShane & Von Glinow (2013) has created very similar models and added the individual’s role perception to the above list. Individually these authors also note situational factors (McShane & von Glinow 2013) and resources (Scholl 2003) as factors to consider when looking at what enables individuals to perform. The author has related both the situational factor and resources to the “opportunity” factor in the model created by Werner et al (2011), whereas role-perception has strong links to the “developed competencies” factor in the same model. Taking into account the mentioned industry and specific Project Management challenges and the performance factors, it can be argued that motivation and the environment in which a role-player in the construction industry finds itself in, will affect their performance (McShane & von Glinow 2013; Scholl 2003; Werner et al. 2011; Herzberg 1968; Herzberg 1965). Related to the mentioned performance models, and of importance to the research outcomes are the following:
Proceedings: 9th Built Environment Conference
2-4 August 2015, Durban, South Africa
ISBN 978-0-620-67120-0
page 329
To attempt to identify the major performance barriers could be for project role-players, Possible strategies for motivating role-players towards optimum performance, Enhance Project Managers capabilities on the formation of optimum performing teams, Ascertain current and possible Project Management practices which clearly enables or hinders role player performance, and Identifying feasible motivation strategies for use in the construction project environment.
It should be noted that the future study will assume that all Project team members have the inherent ability and developed skill to operate at the required level as set out by the various professional bodies of the required disciplines when they are appointed to a project team (South African Council for the Architectural Profession, Engineering Council of South Africa & South African Council for the Quantity Surveying Profession). This assumption is made due to the following: To ensure that the future research study focuses on the issues in the research problem, and The nature of appointments as per the SACPCMP for professional construction project managers and general project constraints does not sanction for project managers to be responsible for training or inherent ability constraints found with role-players. South Africa has a skill shortage and this has been widely publicised and confirmed as a constraint towards development of the local economy and service delivery (Emuze 2011). Solutions and proposals for solving the skill shortage will not form part of the future study. An adapted model from Werner et al (2011) is shown below which highlights the discussed delimitations and assumptions.
Proceedings: 9th Built Environment Conference
2-4 August 2015, Durban, South Africa
ISBN 978-0-620-67120-0
page 330
Figure 2 Adapted performance model from Werner et al (2011)
4. CONCEPTUAL FRAMEWORK Okolie (2011) and Henning et al. (2004) notes that the theoretical framework creates a platform for the creation of a conceptual framework. Henning et al. (2004) states that the conceptual framework is “an alignment of the key concepts of the study”. As noted before, the research will be embedded in Herzberg’s theory with assistance from the models created by Werner et al (2011), Scholl (2003) and McShane & Von Glinow (2013). 4.1 Herzberg’s Motivator/Hygiene Theory – Concepts Hygiene Factors These are typically the factors that when satisfied, could assist with creating a situation where a team member is experiencing no dissatisfaction (Herzberg 1968; Herzberg 1965; Herzberg 1974; Werner et al. 2011; Verma 1996). The limitation of a hygiene factor is though, that it would not lead to a team member experiencing satisfaction (Herzberg 1968; Herzberg 1965; Herzberg 1974; Werner et al. 2011; Verma 1996). Hygiene factors are in most cases external or extrinsic to the team member (Werner et al. 2011). Gerber et al (1998) and Werner et al (2011) notes, related to Hertzberg’s theory, that management and unions in many instance focus on the hygiene factors to motivate workers, which is seldom or never the case. The satisfaction of Hygiene factors does not
Proceedings: 9th Built Environment Conference
2-4 August 2015, Durban, South Africa
ISBN 978-0-620-67120-0
page 331
automatically enhance productivity and motivation, it could only realize a neutral level of no dissatisfaction with a team member (Verma 1996). Gerber et al (1998), Werner et al (2011), Verma (1996:65) and Herzberg (1968; 1974; 1965) note the following hygiene factor examples: Quality supervision, Fair compensation, Working conditions, Company policies, Status, and Job security. Motivators Motivators would lead a team member to experience satisfaction (Herzberg 1968; Herzberg 1965; Herzberg 1974; Werner et al. 2011; Verma 1996). Motivators are mostly intrinsic or internal to the team member (Werner et al. 2011). Gerber et al (1998), Werner et al (2011), Pink (2009), Verma (1996) and Herzberg (1968; 1974; 1965) indicate that the following could be seen as motivators: Performance and success in completion of tasks, Acknowledgement of success achieved, Work design, Responsibility, Autonomy, Mastery, Purpose, Advancement or promotion opportunities, and Personal growth. 4.2 Performance models – Concepts Performance – Role Player Various performance models have been created to identify what factors influence an individual’s performance (Werner et al. 2011; Scholl 2003; McShane & von Glinow 2013). It is pertinent that motivation, opportunity, developed competence, inherent ability, role perception, situational factors and resources influence performance influence performance. Within the built environment, performance is directly related to the requirements as set out in the various contracts and service agreements. Performance – Construction Industry Performance in the construction industry is closely related to Performance Measurement. Many parameters and indicators have been developed to measure and quantify project performance. For many years the “Iron
Proceedings: 9th Built Environment Conference
2-4 August 2015, Durban, South Africa
ISBN 978-0-620-67120-0
page 332
Triangle” parameters of Time, Cost and Quality (Barnes 1988) have been the main measures of performance. Subsequently, many authors have noted the requirement for a more holistic measure of performance (Cheung et al. 2004; Hughes et al. 2004; Takim & Akintoye 2002a). Opportunity - Enabling Environment Werner et al (2011) and Herzberg (1968; 1974; 1965) indicates that as one of the factors that influences performance, opportunity would relate to a team member being afforded the opportunity in an enabling environment to demonstrate their ability to perform. As noted in the various performance models related to individuals, the individual needs the opportunity to perform. This could relate to resources required to do the work, or situational factors. For instance, a worker could be motivated, have the inherent ability (talent), develop competency (skill), but if he/she is put in an under-resourced environment, he/she will not be able to perform. If an performance enabling environment does not exist, performance is not likely to occur or be seriously restrained (Werner et al. 2011). Jay (2003) notes that if a manager is able to create the “right” environment for the team to operate within, the possibility exists that members will “effectively motivate themselves”. Construction Project Management In South Africa, the regulated overarching goal of a Project Manager is “the management of projects within the Built Environment from conception to completion, including management of related professional services” and “is the one point of responsibility in this regard”(SACPCMP 2009). Thus to be able to guide a project towards success and creating a performance enabling environment. Although Project Management is one of the many criteria impacting on project performance, Peng and Chuan (2006) note that it could be the most significant factor. Reiterating the above, the authors also concluded that “A Project Manager is vital and indispensable in any project” (Pheng & Chuan 2006). In lieu of the above mentioned regulated duties, it can further be noted that the strategies used in operation and general management has limitations when used in a construction project team environment (Shelbourn et al. 2006; Herroelen & Leus 2004; Rezgui 2007; Ballard & Howell 2004; Bertelsen et al. 2007). Many issues cannot be addressed or managed in the construction project team environment, in the same manner as is the norm in operation or general management. This is due to contractual, professional and time barriers associated with projects. Typical barriers which would have a substantial effect on how role-players operate and perform on a project could be seen as being: Specific short or medium duration of projects, Budgetary constraints, Prearranged team compilation/selection,
Proceedings: 9th Built Environment Conference
2-4 August 2015, Durban, South Africa
ISBN 978-0-620-67120-0
page 333
Assumed professional competence and ability, Contractual agreements with role-players and their respective employers, and Reward systems or initiatives for role players.
4.3 Motivation As one of the factors on which individual performance relies, it would be a Project Manager’s intent to motivate role-players on their team. Motivation can be defined as “the force within us that arouses, directs and sustains our behaviour” (Werner et al. 2011). Verma (1996) further notes that “motivation is dynamic and complex”. In this vain, major theorist have paved the way in operational and general management fields with the creation of theories to assist organisations to motivate their workforce. As one of the factors that influence performance, Herzberg’s views and outlook on motivation and motivators will be used to define the concept. 4.4 Theoretical Framework – Evolution of the Logic When Herzberg’s Theory is married with the models created by Werner et al (2011), Scholl (2003) and McShane & Von Glinow (2013) it creates a strong basis for the proposed theoretical framework. The combination of the theory and models has evolved during the literature review to show that the hygiene factors as indicated by Herzberg could have the same implication within the performance models, specifically when linked to the “opportunity” factor. A simple deduction is also made to link the motivators in Herzberg’s theory with the “motivation” factor in the performance models. The combination of the theory and models and its influence as mentioned above is shown in the figure 3.1 adapted by the author, below.
Proceedings: 9th Built Environment Conference
2-4 August 2015, Durban, South Africa
ISBN 978-0-620-67120-0
page 334
Figure 3.1 Combination of theory and models
The adaption of the created framework incorporates and modifies the initial performance models, to not only show impact on the performance of an individual, but also the flow to which Herzberg alludes in his theory, whereby a person would only be able to be motivated, once the hygiene factors have been satisfactorily handled and the person has become not dissatisfied. Only once a person is in a “neutral” position, could they be motivated to perform optimally.
Figure 3.2 Adaption of Theory and Models to show flow from Hygiene factors towards Motivators
Proceedings: 9th Built Environment Conference
2-4 August 2015, Durban, South Africa
ISBN 978-0-620-67120-0
page 335
The final proposed framework suggests: As mentioned, for the role-players, a possible flow from the bottom up from being dissatisfied, being neutral and finally aiming for satisfaction, The ability of the hygiene factors to only move a person towards neutrality, The probability that existence of three of the performance model factors, namely inherent ability, opportunity and developed competencies to only be able to create a situation where a person is either dissatisfied or neutral. Only the motivators could logically lead to motivation which will, in all probability lead to possible satisfaction and performance.
Figure 3.3 Final Proposal of Theoretical Framework for optimizing construction project roleplayer performance
5. SUMMARY AND CONCLUSION The proposed theoretical framework suggests, inline with Herzberg’s and other motivation theorists, strong links between satisfaction and role-player peformance. Performance depends on four factors, namely inherent ability, developed competence, oppurtunity and motivation. Combining the Twofactor theory with the performance models creates strong logical links between the theories motivators/hygiene factors and the models motivation/opportunity factors. The theoretical framework impresses on the reader that without any of the four performance dependants, performance cannot be achieved, not
Proceedings: 9th Built Environment Conference
2-4 August 2015, Durban, South Africa
ISBN 978-0-620-67120-0
page 336
even to imagining optimal performance. The combination of the theory and model proposes a order related to the satisfaction of the person involved linked to the performance factors, and the possibility exists that even if inherent ability, oppurtunity and developed competence are in place, that performance will not be optimal and the persons experience will be neutral. Both of which leaves the person (role-player) dissatisfied or neutral and the project owner in jeapordy due to a possible lack of performance. Both these situations leading to dismal project outcomes and will keep on enforcing the current view that project and the industry are performing suboptimally. Both motivation and oppurtunity has strong underlying roots in both the project environment and the persons employer organisation. Thus, making many of the assumptions and outcomes difficult to predict. Many of the factors could be very dependant on either the project or employer organisation environment. In essence the employer organisation applies or lacks creation of the oppurtunity and motivation towards performance. This has a direct impact on the person motivation and oppurtunity needs on a project. Herzberg (1965) equates and summarises the needs of humans by using two biblical examples of how God defined the goals of these men. Firstly, Adam, the first human being, was banished from the Garden of Eden and seemingly was set to battle unhappiness in the environment he had to navigate. The needs of Adam relates to the avoidance of physical discomfort (hygiene factors). Secondly, God calls a human towards “innate potential” and stating that this human is capable (motivators). Abraham, called by God to be exceedingly more and given a vision of a great future. Both these needs exist in humans, to have a comfortable environment and the ability or drive to show and attain our potential. The one need cannot be ignored, or exchanged for the other. If we do not create environments were humans as project team roleplayers can function as comfortable as possible, the result will be dissatisfaction, and the outcome will be low levels of performance. Furthermore, if we are not able to evoke the desires of these project team role-players to fulfill their full potential and be part of fulfilling their own and the project vision, we will always have to settle for low levels of performance. Contrary, the fulfillment of a humans hygiene factors could lead to the possibility of a hypothetical place where the role-players are ready to be motivated. If these hygiene needs are not properly addressed and comfort created, a human will always be drawn back into the fight against discomfort or dissatisfaction. The possibility of working with humans which are ready to be motivated, could and should excite any true leader. For project managers in construction this will set the scene where each team role-player could be launched into excellence. If the future research identifies ways in which the role-players potential can be unleashed, it could create teams which will
Proceedings: 9th Built Environment Conference
2-4 August 2015, Durban, South Africa
ISBN 978-0-620-67120-0
page 337
finish projects optimally. Clients will be motivated about the possibility to undertake more construction projects. Role-players would want to work together, repeatedly. The role-players could then search for more ways to not only release their own potential, but also build on the synergy and high energy levels created by role-players being highly motivated and performing optimally. Sadly, the above scenario currently almost sounds utopian, but a dream to be pursued indeed. 6. REFERENCES Acharya, N.K., Lee, Y.D. & Lee, J.C., 2006. Team Effectiveness Factors in Construction Industry. In Proceedings of the 7th Asia Pacific Industrial Engineering and Management Systems Conference. pp. 903–911. Adejimi, A., Oyediran, O.. & Ogunsanmi, E.., 2010. Employing Qualitatively Enriched Semi Structured Questionnaire in Evaluating ICT Impact on Nigerian “ Construction Chain Integration .” The Built & Human Environment Review, 3(1), pp.49–62. Aibinu, A.A. & Jagboro, G.O., 2002. The effects of construction delays on project delivery in Nigerian construction industry. International Journal of Project Management, 20, pp.593–599. Alshawi, M. & Ingirige, B., 2003. Web-enabled project management: An emerging paradigm in construction. Automation in Construction, 12, pp.349–364. Amaratunga, D. et al., 2002. Quantitative and qualitative research in the built environment: application of “mixed” research approach. Work Study, 51(1), pp.17–31. Available at: http://www.emeraldinsight.com/10.1108/00438020210415488 [Accessed May 26, 2014]. Assaf, S.A. & Al-Hejji, S., 2006. Causes of delay in large construction projects. International Journal of Project Management, 24, pp.349–357. Baiden, B.K., Price, A.D.F. & Dainty, A.R.J., 2006. The extent of team integration within construction projects. International Journal of Project Management, 24, pp.13–23. Ballard, G. & Howell, G.A., 2004. Competing construction management paradigms. Lean Construction Journal, 1, pp.38–45. Barnes, M., 1988. Construction project management. International Journal of Project Management, 6, pp.69–79. Bertelsen, S. et al., 2007. Construction physics. In Proceedings of the 15th Annual Conference of the International Group for Lean Construction. pp. 13–26. Black, C., Akintoye, A. & Fitzgerald, E., 2000. Analysis of success factors and benefits of partnering in construction. International Journal of Project Management, 18, pp.423–434.
Proceedings: 9th Built Environment Conference
2-4 August 2015, Durban, South Africa
ISBN 978-0-620-67120-0
page 338
Carr, V. & Tah, J.H.., 2001. A fuzzy approach to construction project risk assessment and analysis: construction project risk management system. Advances in Engineering Software, 32, pp.847–857. Chan, A.P.C., Scott, D. & Chan, A.P.L., 2004. Factors Affecting the Success of a Construction Project. Journal of Construction Engineering and Management, 130, pp.153–155. Cheung, S.O. et al., 2003. Behavioral aspects in construction partnering. International Journal of Project Management, 21, pp.333–343. Cheung, S.O., Suen, H.C.H. & Cheung, K.K.W., 2004. PPMS: a Webbased construction Project Performance Monitoring System. Automation in Construction, 13, pp.361–376. Chinowsky, P., Diekmann, J. & Galotti, V., 2008. Social Network Model of Construction. Journal of Construction Engineering and Management, 134, pp.804–812. Dainty, A.R.J., Cheng, M.-I. & Moore, D.R., 2003. Redefining performance measures for construction project managers: an empirical evaluation. Construction Management and Economics, 21, pp.209–218. Dave, B. & Koskela, L., 2009. Collaborative knowledge management-A construction case study. Automation in Construction, 18, pp.894–902. Deacon, T., 2011. The elusive concept of project success : Civil Engineering. Edum-Fotwe, F.. & McCaffer, R., 2000. Developing project management competency: perspectives from the construction industry. International Journal of Project Management, 18, pp.111–124. Egan, J., 1998. Rethinking the Report of the Construction Task Force. Construction, p.38. Available at: http://scholar.google.com/scholar?hl=en&btnG=Search&q=intitle:RETHIN KING+CONSTRUCTION#0. Emuze, F.A., 2011. PERFORMANCE IMPROVEMENT IN SOUTH AFRICAN CONSTRUCTION. Nelson Mandela Metropolitan University. Eriksson, P.E. & Westerberg, M., 2011. Effects of cooperative procurement procedures on construction project performance: A conceptual framework. International Journal of Project Management, 29, pp.197– 208. Flyvbjerg, B., 2006. Five Misunderstandings About Case-Study Research. Qualitative Inquiry, 12(2), pp.219–245. Available at: http://qix.sagepub.com/cgi/doi/10.1177/1077800405284363 [Accessed July 9, 2014]. Fong, P.S. & Lung, B.W., 2007. Interorganizational Teamwork in the Construction Industry. Journal of Construction Engineering and Management, 133, pp.157–168. Froese, T.M., 2010. The impact of emerging information technology on project management for construction. Automation in Construction, 19, pp.531–538. Gerber, P., Nel. PS & Van Dyk, P., 1998. Menslike Hulpbron Bestuur Fourth., Cape Town: International Thomson Publishing.
Proceedings: 9th Built Environment Conference
2-4 August 2015, Durban, South Africa
ISBN 978-0-620-67120-0
page 339
Gerring, J., 2007. Case Study Research Principles and Practice First., New York: Cambridge University Press. Henning, E., Van Rensburg, W. & Smit, B., 2004. Finding your way in qualitative research First. J. Read, ed., Pretoria: Van Schaik Publishers. Herroelen, W. & Leus, R., 2004. The construction of stable project baseline schedules. European Journal of Operational Research, 156, pp.550–565. Herzberg, F., 1968. One more time: How do you motivate employees? Harvard Business Review, 46(1), pp.53–62. Herzberg, F., 1974. Pinpointing what ails the organization. Organizational Dynamics, 3(2), pp.18–29. Herzberg, F., 1965. The New Industrial Psychology. Industrial & Labor Relations Review, 18(3), p.364. Howell, G. & Koskela, L., 2000. Reforming project management: the role of lean construction. Proceedings of the 8th Annual Conference of the International Group for Lean Construction. Available at: http://usir.salford.ac.uk/9428/. Hughes, S.W., Tippett, D.D. & Thomas, W.K., 2004. Measuring Project Success in the Construction Industry. Engineering Management Journal, 16, pp.31–37. Jay, R., 2003. How to build a great team 2nd ed., Glasgow: Pearson Eduction Limited. Available at: www.business-minds.com. Lee, S.-K. & Yu, J.-H., 2012. Success model of project management information system in construction. Automation in Construction, 25, pp.82–93. Leung, M., Ng, S.T. & Cheung, S., 2004. Measuring construction project participant satisfaction. Construction Management and Economics, 22, pp.319–331. McShane, S. & von Glinow, M.A., 2013. Organizational Behavior: Emerging Knowledge. Global Reality. Sixth., McGraw-Hill/Irwin. Available at: www.mhhe.com. Meng, X., 2012. The effect of relationship management on project performance in construction. International Journal of Project Management, 30, pp.188–198.. Morse, J.. & Richards, L., 2002. Readme First for a Users Guide to Qualitative Methods First., Thousand Oaks: Sage Publications, Inc. Okolie, K.C., 2011. Performance Evaluation of Buildings in Educational Institutions: A Case of Universities in South-East Nigeria. Nelson Mandela Metropolitan University. Olander, S., 2007. Stakeholder impact analysis in construction project management. Construction Management and Economics, 25, pp.277– 287. Peterson, F. et al., 2011. Teaching construction project management with BIM support: Experience and lessons learned. Automation in Construction, 20, pp.115–125. Peterson, T.M., 2007. Motivation: How to Increase Project Team Performance. Project Management Journal, 38, pp.60–69.
Proceedings: 9th Built Environment Conference
2-4 August 2015, Durban, South Africa
ISBN 978-0-620-67120-0
page 340
Pheng, L.S. & Chuan, Q.T., 2006. Environmental factors and work performance of project managers in the construction industry. International Journal of Project Management, 24, pp.24–37. Pink, D., 2009. The puzzle of motivation. Available at: https://www.youtube.com/watch?v=rrkrvAUbU9Y. Raiden, A.B., Dainty, A.R.J. & Neale, R.H., 2004. Current barriers and possible solutions to effective project team formation and deployment within a large construction organisation. International Journal of Project Management, 22, pp.309–316. Rezgui, Y., 2007. Exploring virtual team-working effectiveness in the construction sector. Interacting with Computers, 19, pp.96–112. SACPCMP, 2009. Registration Policies and Guidelines, Scholl, R.W., 2003. No Title. INDIVIDUAL PERFORMANCE. Available at: http://www.uri.edu/research/lrc/scholl/webnotes/Performance.htm. Shelbourn, M.A. et al., 2006. MANAGING KNOWLEDGE IN THE CONTEXT OF SUSTAINABLE CONSTRUCTION. ITcon, 11, pp.57–71. Available at: http://citeseerx.ist.psu.edu/viewdoc/download?doi=10.1.1.131.7526&rep= rep1&type=pdf. Söderlund, J., 2004. Building theories of project management: past research, questions for the future. International Journal of Project Management, 22(3), pp.183–191. Available at: http://linkinghub.elsevier.com/retrieve/pii/S026378630300070X [Accessed July 9, 2014]. Tabassi, A.A. & Bakar, A.H.A., 2009. Training, motivation, and performance: The case of human resource management in construction projects in Mashhad, Iran. International Journal of Project Management, 27, pp.471–480. Tabassi, A.A., Ramli, M. & Bakar, A.H.A., 2012. Effects of training and motivation practices on teamwork improvement and task efficiency: The case of construction firms. International Journal of Project Management, 30, pp.213–224. Takim, R. & Akintoye, A., 2002a. PERFORMANCE INDICATORS FOR SUCCESSFUL CONSTRUCTION PROJECT PERFORMANCE. In Vol. 2, 545-55. pp. 2–4. Thorns, D., 2012. Qualitative interviewing. In International Encyclopedia of Housing and Home. pp. 1–7. Toor, S. ur R. & Ofori, G., 2008. Leadership for future construction industry: Agenda for authentic leadership. International Journal of Project Management, 26, pp.620–630. Verma, V.., 1996. Human Resource Skills for the Project Manager, Wang, X. & Huang, J., 2006. The relationships between key stakeholders’ project performance and project success: Perceptions of Chinese construction supervising engineers. International Journal of Project Management, 24, pp.253–260.
Proceedings: 9th Built Environment Conference
2-4 August 2015, Durban, South Africa
ISBN 978-0-620-67120-0
page 341
Werner, A. et al., 2011. Organisational Behaviour: A contemporary South African perspective Third. A. Werner, ed., Pretoria: Van Schaik Publishers. Winter, M. et al., 2006. Directions for future research in project management: The main findings of a UK government-funded research network. International Journal of Project Management, 24(8), pp.638– 649. Xue, X. et al., 2007. Coordination mechanisms for construction supply chain management in the Internet environment. International Journal of Project Management, 25, pp.150–157.
Proceedings: 9th Built Environment Conference
2-4 August 2015, Durban, South Africa
ISBN 978-0-620-67120-0
page 342
ASOCSA2015-45
Causal Layered Analysis of Nanotechnology Developments Directly affecting the South African Construction Industry towards 2020 D.J. Rishworth¹, C.M. Adendorff², & B. Botha³. ¹Student, Built Environment and Information technology, Nelson Mandela University, Port Elizabeth. ²NMMU Business School, Nelson Mandela University, Port Elizabeth, email:
[email protected] ³Department of Construction Management, Nelson Mandela University, Port Elizabeth, email:
[email protected] ABSTRACT AND KEYWORDS Purpose of this paper Nanotechnology is the control or manipulation of materials at the nanoscale in order to improve or develop materials. The construction industry, internationally and in South Africa, has fallen behind other industries in terms of technological innovations and efficient practices. Design/methodology/approach The aim of this article was to assess the developments of nanotechnology that will directly affect the South African construction industry in terms of benefits and risks. Using Causal Layered Analysis, developments in insulation, paints and coatings, adhesives, concrete, 3D printing, lighting and developments in the energy sector were identified as areas that will positively affect the South African construction industry. Findings Improved methods and materials from nanotechnology for the construction industry which reduce energy consumption and optimise efficiency would contribute towards a sustainable environment. However, the potential risks to human health and the environment associated with nanotechnology need to be determined and avoided.
What is original/value of paper
Proceedings: 9th Built Environment Conference
2-4 August 2015, Durban, South Africa
ISBN 978-0-620-67120-0
page 343
Members of the public and the construction industry who are involved with the development of nanotechnology must ensure a safe implementation of this technology into the South African construction industry. Keywords: Nanotechnology, risks, South African construction industry, sustainability.
1. INTRODUCTION AND BACKGROUND While the meaning of nanotechnology varies from field to field and country to country and is widely used as a “catch all” description for anything very small. Nanotechnology is commonly defined as the understanding, control and restructuring of matter on the order of nanometres to create materials with fundamentally new properties and functions (NSTC, 2007; Sanchez and Sobolev, 2010: 139-148). Nanotechnology is a term that could be said to have its roots in a few key events, such as the coining of the term by Norio Taniguchi in 1974 and the publishing of Eric K. Drexler’s highly influential Engines of Creation: The Coming Era of Nanotechnology in 1986 (Adendorff, 2012: 2). Nanotechnology develops our understanding of the properties of materials and structures as well as the manufacturing processes and interactions between materials, structures, external elements and internal components (Bartos, 2009: 2). Nanotechnology can also be portrayed as improvements of current technologies and products (Lösch, 2006: 2). The international construction industry is increasingly seeking more durable, sustainable and cost effective materials (van Broekhuizen and van Broekhuizen, 2009:5). The application of nanotechnology in the construction industry will lead to better, cleaner, cheaper, faster and smarter products and processes (Zhu, Bartos, and Porro, 2004: 650). New materials and products that have developed for the construction industry as a result of nanotechnology are already found in building insulation, various coatings and solar technology (Elvin, 2007:3). Nanotechnology has the potential to create new and sustainable technologies (Schmidt, 2007: 9) and therefore the international and national construction industry may have the opportunity to benefit from such innovation. Developing countries often find themselves on the sidelines of technological innovations (Singer, Salamanca-Buentello, and Daar, 2005: 57). Despite this, developing countries, such as South Africa, see potential for nanotechnology to meet several of their needs and therefore they seek to develop, use and market these technologies (Singer, et al., 2005: 57). This realisation brought about the commissioning of the South African Nanotechnology Initiative (SANi) by the Department of Science and Technology in the Republic of South Africa to develop the South African Nanotechnology Strategy (South African Department of Science and Technology, 2006). Scientific publications and patents provide a useful indication of the nature and extent of research activities and technological advances in particular areas such as nanotechnology (Zhu et al., 2004: 650). As argued in Andrievski and Klyuchareva (2011), there has been significant
Proceedings: 9th Built Environment Conference
2-4 August 2015, Durban, South Africa
ISBN 978-0-620-67120-0
page 344
growth in the number and range of journals relating to nanotechnology. However, there is very little literature available on nanotechnology in South Africa, and even less on nanotechnology in the South African construction industry. Therefore, compared to international standards, South Africa is lacking behind in terms of nanotechnology developments and implementation. The construction industry in South Africa is an important contributor to and facilitator of socio-economic development and economic growth (Rust and Koen, 2011). The construction industry is renowned for low levels of innovation and there is a need in South Africa to enhance and focus innovation efforts as well as construct and support research and development programmes (Rust and Koen, 2011, HSRC, 2006).Nanotechnology arguably offers construction professionals the opportunity to design, engineer and build in new ways (Keyvani, 2007: 4). Nanotechnology could be the catalyst that revolutionises the construction industry to equal the technological levels of other industries, both nationally and internationally. However, new technologies often have unanticipated or unwanted consequences (Davies, 2009: 16). Davies (2009) and Van Broekhuizen et al., (2009) argue that compared to their microscale counterpart materials, nanomaterials could react and behave unexpectedly. Detailed information about nanoproduct composition and the possible nano-specific health and safety issues are lacking and as a consequence it might be very difficult for a construction company to conduct a proper risk assessment and organise a safe workplace for employees (van Broekhuizen, 2009). Therefore it is important to identify potential applications of nanotechnology in the construction industry and how to implement these applications safely. No study has yet been done to investigate/ determine how South Africa will react to the continued and increasing implementation of nanotechnology. The present article applies Causal Layered Analysis (CLA) as a theoretical framework to answer the following questions: What are the obvious applications of nanotechnology that can benefit the South African Construction Industry? What systemic factors (trends or drivers of change) are driving the need for application of nanotechnology in the South African Construction Industry? What assumptions are driving the social causes for nanotechnology in the South African Construction Industry? Whose perspectives are dominant or the most influential? Whose opinions and concerns are not being considered? What impact does the current state of the South African Construction Industry have on the future of nanotechnology in the industry? Do the benefits of implementation of nanotechnology in the South African Construction Industry outweigh the risks? If the above is true, what needs to be done to ensure an efficient implementation? If the above is false, can the implementation of nanotechnology be stopped?
Proceedings: 9th Built Environment Conference
2-4 August 2015, Durban, South Africa
ISBN 978-0-620-67120-0
page 345
2. REVIEW OF THE RELATED LITERATURE Nanotechnology developments towards 2020 under the framework of CLA Litany Under this layer the obvious applications of nanotechnology that can benefit the South African Construction Industry are analysed. International development in terms of research and patenting Patent analysis is a direct indicator for assessing development of different technology fields (Narin, 1998: 51-59; Adendorff, 2012 433; Oppenheim, 2000 145-176). There are three differences between nanotechnology and other technological inventions that make the role of patents more significant in the area of nanotechnology (Lemley, 2005: 601). Firstly, this is almost the first new field within a century in which basic ideas are being patented at the outset. Secondly, nanotechnology has a unique cross-industry structure (Lemley, 2005: 601). Finally, a large number of the basic nanotechnology patents have been issued to universities, which have become far more active in patenting in the past three decades (Lemley, 2005: 601). There has been a rapid increase of nano-related patenting activity (Zhu et al., 2004: 651). Andrievski and Klyuchareva (2011: 6221-6230) reiterates this by stating that during the past few decades the nanotechnology field has attracted overwhelming interest from scientific, business and political communities. The worldwide growth rate of the number of nanotechnology patent applications between 2000 and 2008 was about 34.5% (Dang et al., 2010: 704). To support this, the worldwide investment in nanotechnology research and development reported by government organisations increased approximately nine-fold from 1997 to 2005 (Siegel, Hu and Roco, 1999; Roco, 2005: 3). International collaboration in establishing the nanotechnology knowledge base, addressing long-term challenges for human health, clean water and energy conservation, educating the new generation, and studies on environment and societal implications will play an important role in the affirmation and growth of the field (Roco, 2005: 8). Atomic Precis Manufacturing Impact The key physical capabilities of APM-technologies include low-cost production of higher-performance materials, which will lead to higher-performance components and products of every kind (Drexler, 2013:16). This will result in stronger and lighter structures, more-efficient engines, greater safety, lower emissions, and vastly greater computational power. The nanoscale size enables extreme productivity as a result of mechanical scaling laws (Drexler, 2013:19). Small-scale, versatile and highly productive machinery, due to APM-
Proceedings: 9th Built Environment Conference
2-4 August 2015, Durban, South Africa
ISBN 978-0-620-67120-0
page 346
technologies, can collapse globe-spanning industrial supply chains to just a few links, from raw materials to refined feedstock materials, from feedstock materials to standardized microblocks and from the microblocks to various end products used in different fields. Due to the fact that precise processing embraces products and by-products, APM-based systems need not produce hazardous waste (Drexler, 2013:16). APM can reduce the demand for scarce resources in two ways: firstly, by enabling less-massive products to perform common functions, and secondly, by enabling abundant materials to substitute scarcer materials in most applications and with better performance (Drexler, 2013.19). Concrete and steel - Concrete is the most used material in the world and is a nano-structured, multi-phase, composite material that ages over time (Sanchez and Sobolev, 2010: 2061). The properties and processes at the nanoscale, define the interactions that occur between the particles and phases at the microscale and the effects of working loads and the surrounding environment at the macroscale (Sanchez and Sobolev, 2010: 2061). Ready mix concrete and concrete products have been identified as among the top 40 industrial sectors likely to be influenced by nanotechnology towards 2020 (In Realis, 2002:11; Zhu et al., 2004: 781-788). Nano-silica has been found to improve concrete workability and strength (Sobolev, Flores, Torres-Martinez, Valdez, Zarazua, and Cuellar, 2009; Sanchez and Sobolev, 2010: 2065; Li et al., 2004: 1229-1232), increase resistance to water penetration (Ji, 2005; Sanchez and Sobolev, 2010: 2065) and help control the leaching of calcium which is associated with concrete degradation (Gaitero, 2008; Sanchez and Sobolev, 2010: 2065). Nano-titanium dioxide has proven effective for the self-cleaning of concrete and it provides the additional benefit of cleaning the environment by reducing air pollution (Sanchez and Sobolev, 2010: 2065; van Broekhuizen and van Broekhuizen, 2009: 19). Nano-iron has also been found to provide concrete with self-sensing capabilities as well as improve the compressive and flexural strength of concrete (Li et al., 2004; Sanchez and Sobolev, 2010: 2065). Composite materials reinforced with nanoclay exhibit flame retardant, anti-UV and anti-corrosive behaviours (Qian and Hinestroza, 2004: 3). For concrete, the combination of an already existing good performance available at low costs is a great challenge for any successful application of nanotechnology for concrete in the construction industry (van Broekhuizen and van Broekhuizen, 2009: 16). Therefore, nanotechnology used in steel has the ability to improve the properties of steel (Tewari and Bharadwaj, 2013: 43-48). Carbon nanotubes and nanofibres have also the potential for use as nano-reinforcements in cement-based materials, which promise to greatly enhance the mechanical properties of concrete (Sanchez and Sobolev, 2010: 2066). Carbon nanotubes can be used to make nano composite steel which is about 50 times stronger and 10 times lighter than conventional steel (Sasmal et al., 2013: 117-129). Developments of the use of nanotechnology in steel therefore can lead to
Proceedings: 9th Built Environment Conference
2-4 August 2015, Durban, South Africa
ISBN 978-0-620-67120-0
page 347
increased safety, less need for inspections, less material required and less energy usage (Tewari and Bharadwaj, 2013: 43-48). Nanotechnology has great potential to benefit mankind in the area of cementitious applications. Nanotechnology has shown to produce concrete that is stronger, lighter, more durable, and more resistant to damage and that has sensory properties. Sensory properties may include the ability to monitor temperature and stress loads. Sensory properties added to concrete from nanotechnology will allow for stresses on buildings to be monitored which will improve the safety of buildings. Concrete is probably the most used product in the construction industry and is widely used across South Africa. Therefore, the use of nanotechnology in concrete within the construction industry will in all probability see far reaching benefits throughout South Africa. Due to the large quantities of concrete used in construction, concrete is currently considered reasonably cheap to use, therefore a new technology that results in a slight increase in the cost of concrete may hinder the acceptance of the use of the technology. However, the cost-benefits as a result of nanotechnology in concrete in the long term will far outweigh the marginal increase of costs at the early stages of implementation. This is a result of less quantity of concrete required due to stronger and lighter concrete, less rework and maintenance due to more durable concrete and the use of nanotechnology additives that allow for less cement to be used in concrete. Nanotechnology in concrete will result in stronger, more durable and lighter buildings. This will increase the life span of buildings and result in less maintenance costs. The use of large quantities of concrete results in significant environmental damage, therefore stronger, lighter and more durable concrete will result in a smaller quantity of concrete being carted to landfill areas. Additives such as nanotitanium dioxide can be used in concrete to break down harmful gasses emitted from industrial buildings and automotives. Coatings and Paints - Of all nanoproducts introduced in the construction industry, coatings and paints have been the most successful in entering the market (van Broekhuizen and van Broekhuizen, 2009: 17). Owing to the versatility of many nanoparticles, surfaces treated or coated with them often exhibit more than one of the properties of the nanoparticles (Elvin and Green Technology Forum, 2007: 21). Nanoparticles interact better with the underlying surface of the paints or coatings to which they are applied compared to their larger forms and they are transparent which introduces new possibilities such as scratch and UV resistance, infra-red absorption or reflection, fire resistance, electric conductivity, anti-bacterial and self-cleaning properties (van Broekhuizen and van Broekhuizen, 2009: 17). Nanotechnology is already used extensively in paints and coatings. Applications for which it is primarily used include scratch resistance, UV, fire and water resistant applications as well as self-cleaning and anti-bacterial functions. The greatest benefit that will be realised in the construction industry and South Africa as a result of nanotechnology in paints and coatings will be that of a reduction in maintenance costs and an increased building life span. The increased building
Proceedings: 9th Built Environment Conference
2-4 August 2015, Durban, South Africa
ISBN 978-0-620-67120-0
page 348
life span will assist countries such as South Africa by having infrastructure that lasts longer so that funds can be spent on new infrastructure for new development rather than maintenance of old infrastructure. Self-cleaning properties are already sought after in the construction industry. Self-cleaning properties add to the aesthetics of buildings and reduce cleaning costs. Insulation materials and adhesives - Nanotechnology applications for insulation and adhesives are among the predominant applications used in the construction industry (van Broekhuizen and van Broekhuizen, 2009). Nanotechnology promises to make insulation more efficient, less reliant on non-renewable resources and less toxic (Elvin and Green Technology Forum, 2007: 12). There are also no nano-related health risks associated with nanoinsulation materials and these materials can be 2 to 8 times more effective than non-nano insulation materials (van Broekhuizen and van Broekhuizen, 2009: 20). Adhesives have also revolutionised the construction industry, however current applications have environmentally harmful substances (Elvin and Green Technology Forum, 2007: 37) such as formaldehyde. Scientists and engineers often look to nature to solve complex problems or to develop technologies that have the capability of mimicking nature (Davies, 2009: 13). Nanotechnology for insulation has shown dramatic improvement in terms of effectiveness compared to conventional insulation. The improved effectiveness will drastically reduce energy consumption as a result of heating and cooling of buildings which will assist in environment restoration and lead towards self-sustainable buildings. There will also be a reduction in the use of bricks and concrete for the internal and external skin construction of buildings as the improved effectiveness of insulation will allow the use of construction such as dry walling to have a sufficient insulation greater than that offered by bricks and concrete. The use of other materials over bricks and concrete for the skins of buildings will reduce the quantity of construction waste that goes into landfills. Nano-insulation can also take the form of clear aerogels that can be used between panels such as glass panes for windows and doors. Heat loss in buildings occurs predominantly through doors and windows, therefore the improved insulation of windows and doors will see a further reduction in energy consumption of buildings. Nano-insulation has the added benefit that there are no nanotechnology related health issues associated with it. This assists with the rapid acceptance of nanoinsulation throughout the construction industry. Lighting - Lighting applications that use nanotechnology include: light-emitting diodes (LEDs); organic light-emitting diodes (OLEDs); and, quantum dot lighting (Elvin and Green Technology Forum, 2007: 41-47). Potential energy savings from LEDs are estimated at 83 to 93 percent over conventional incandescent and fluorescent lighting; however there is still a problem of heat generation from LED lighting (Elvin and Green Technology Forum, 2007: 41). Researchers and companies are looking at using nanotechnology in LEDs that do not produce heat (Elvin and Green Technology Forum, 2007: 41-43). OLEDs are highly efficient, long-lived natural light sources that can be
Proceedings: 9th Built Environment Conference
2-4 August 2015, Durban, South Africa
ISBN 978-0-620-67120-0
page 349
integrated into extremely thin, flexible panels, which allows objects such as cabinets, walls, floors and the like to become light sources (Elvin and Green Technology Forum, 2007: 44-45). Quantum dots are nanoscale semiconductor articles that can be tuned to bright fluoresce at any wavelength in the visible and infrared portions of the spectrum (Elvin and Green Technology Forum, 2007: 46). Lighting has improved considerably over the past decade in terms of energy consumption and life span of the light bulbs. However, there is still the issue that light sources, even energy efficient Light Emitting Diodes (LEDs) produce heat as a by-product. The development of Organic Light Emitting Diodes (OLEDs) may have solved this problem by creating a light source which uses a minute amount of energy and does not create any heat as a by-product. OLEDs have a very long life span and can be integrated into flexible panels which could make building components such as walls and floors light sources. Therefore, nanotechnology in lighting will reduce energy consumption from lighting in buildings to an even greater extent and due to no heat being produced and low electrical current required, will eliminate the risk of fires from light sources. Solar energy and energy storage - The increased cost of silicon used in solar energy conversion has slowed down the application of solar energy technologies (Elvin and Green Technology Forum, 2007: 50). Nanostructured materials such as quantum dots and carbon nanotubes are being used for a new generation of more efficient and inexpensive solar cells (Singer et al., 2005: 58). The material, graphene, which is one-atom-thick, therefore in the nanoscale, has the potential to be used as a transparent electrode in photovoltaic cells used to produce solar energy (Wu et al., 2008: 263-302). This use of graphene in solar cells may result in decreased costs of solar energy as it has potential to replace the expensive use of tin. Quantum dot technology could also play a role in the future of solar energy (Talbot, 2007, Elvin and Green Technology Forum, 2007: 54). Nanotechnology can contribute to the future of energy storage by improving efficiency for conventional rechargeable batteries, new super capacitors, advances in thermovoltaics for turning waste heat into electricity, improved materials for storing hydrogen, integrating photovoltaics into the building, and more efficient hydrocarbon based fuel cells (Walsh; 2007: 441-448, Elvin and Green Technology Forum, 2007: 56). Buildings consume almost half of the world’s energy; therefore a reduction in the consumption of energy by buildings will see extensive benefits for the environment. South Africa struggles to supply the required amount of electricity for the country. Nanotechnology can reduce the required energy load by being used in building materials as this will greatly reduce the energy required for heating and cooling of buildings. Nanotechnology is used to produce electricity from the most sustainable resource available, solar energy. The abundant resource of solar energy will be the obvious source for the world’s energy as a result of nanotechnology applications. Nanotechnology
Proceedings: 9th Built Environment Conference
2-4 August 2015, Durban, South Africa
ISBN 978-0-620-67120-0
page 350
enables this by a reduction in the costs of producing solar panels by reducing silicon used, improved efficiency of the panels, the ability to convert UV and infrared light into electricity and improved methods of storing energy, sustainable buildings and nations will become a reality. Nanotechnology in hydrogen fuel cell usage has improved the efficiency of hydrogen fuel cells, which will have revolutionary effects on the automotive industry. The construction industry depends on the automotive industry for transport of materials and personnel. Heavy machinery used in construction also uses large amount of fuels such as diesel for energy. Therefore the use of hydrogen fuel cells for construction vehicles and machinery will see a massive reduction in environmental pollution from construction activity. Dependence on fossil fuels will be greatly reduced, emissions nullified and the environment will head towards restoration. Environment and green building - The nanotechnology era could not have come at a better time for the construction industry, as the construction industry is moving aggressively towards sustainability (Elvin and Green Technology Forum, 2007: 3). Buildings consume between 30 and 40 percent of the world’s energy and waste from construction accounts for 40 percent of all landfill material in the United States also (United Nations Environmental Programme, 2007; Elvin and Green Technology Forum, 2007: 3). A new generation of highly efficient environmental technologies – from solar technologies and waterpurification systems, to sensors that detect pollution levels – is becoming a reality as a result of nanotechnology’s revolutionary properties and increased investment in this field (Schmidt, 2007: 3). Throughout the renewable-energy sector, nanotechnology has the potential to increase efficiencies and process yields, decrease costs and enable energy processes that would not normally be possible (Davies, 2009: 15). The world’s yearly cement production of 1.6 billion tons accounts for about 7% of the global loading of carbon dioxide into the atmosphere (Mehta, 2001). As mentioned in section 3.3.2.3, annual global concrete production is massive and uses a large amount of materials, which has a great environmental impact; therefore developments of nanotechnology in concrete resulting in the use of less concrete will have a benefit for the environment (Keyvani, 2007: 3-11). Nanotechnology has seen development in water purification and treatment systems which will increase the supply of clean drinking water. Buildings will be able to produce adequate quantities of clean drinking water without having to rely on the municipal water systems. This will once again lead to sustainable buildings and decrease infrastructure and maintenance costs. The construction industry also relies on good quality water for use in cementitious applications such as concrete and plaster. This is sometimes a problem on rural construction sites where water has to be trucked in. Therefore, the ability to purify water on site easily will reduce the transport costs of water and see improved quality of cementitious applications.
Proceedings: 9th Built Environment Conference
2-4 August 2015, Durban, South Africa
ISBN 978-0-620-67120-0
page 351
3D printing and nanotechnology - Automation of various parts and products has evolved considerably, but construction remains largely a manual practice (Khoshnevis and Bekey, 2003: 2). Development of nano and biotechnologies provide encouragement to develop new automated building concepts that will significantly reduce the harmful effects that current construction practises have on the environment (Rebolj et al., 2010: 175-182). 3D printing, or Additive Manufacturing, builds products layer-by-layer (Campbell et al., 2011). One of the systems used for 3D printing of buildings is that of Contour Crafting (CC), which was developed at the University of Southern California (Hwang and Khoshnevis, 2005). CC technology adapts rapid prototyping capabilities and extends them to the field of large scale construction (Hwang and Khoshnevis, 2005: 3). Some of the important advantages of CC compared with other layered fabrication processes, are better surface quality, higher fabrication speed, and a wider choice of materials (Khoshnevis and Bekey, 2003: 2). Nanotechnology may be able to assist with synchronising the filling and extrusion process used in CC, as the joining of these two processes depend on factors such as extrusion rate, pour rate, cure time and strength requirements (Hwang and Khoshnevis, 2005: 5). 3D printing can reduce or even eliminate supply chains (Campbell et al., 2011: 1) and this could have profound effects on economic and environmental sustainability for nations. 3D printing has benefited many different industries and has the potential to completely reduce the supply chain for end-products to very few processes. This has less of a carbon footprint and results in cost saving. The use of nanotechnology in concrete will see advancements in the development of 3D printing for buildings. The use of additives such as nanoclay, nanosilica and other nanosized cement particles result in faster setting times, increased workability and earlier compressive strength, which will allow for faster construction times using 3D printing type techniques for construction. The benefits of this type of construction will be seen in areas such as low cost housing projects. Nanotechnology will also enable conventional construction techniques to be completed much faster. This has potential to boost the economy as capital will not be tied up in projects for extremely longer periods of time as seen with current construction projects.
3. RESEARCH METHODOLOGY Causal Layered Analysis (CLA) is a futures research method which is concerned less with predicting a particular future and more with opening up the present and past to create alternative futures (Inayatullah, 2004: 8). Mankind’s need to know the future arises mainly from the desire to control destiny, however by knowing the future, changes to the present can be reacted to accordingly (Kotze, 2010: 26). Building a knowledge capacity and understanding of the future allows for the opportunity to move from reaction to action (Adendorff, 2012: 26). As the world has become more risky, futures studies have become more eagerly adopted by organisations and governments
Proceedings: 9th Built Environment Conference
2-4 August 2015, Durban, South Africa
ISBN 978-0-620-67120-0
page 352
throughout the world (Inayatullah, 2013). Futures studies can enable one to gain first mover advantage in securing competitive positions (Saul, 2001: 107119). Inayatullah (2013: 511) argue that CLA, being a paradigmatic method, provides a richer account of what is being studied as opposed to more common empiricist or predictive orientation, which merely skim the surface. CLA is comprised of layered philosophies, each of which assists the defining and understanding of the duality of human nature to develop personal perspectives and human experience of interaction with individuals, organisations and communities (Russo and Caloundra City Council, 2003: 55). CLA organises the reality into four mutually sustaining layers or levels, namely, litany, system, worldview and myth-metaphor (Bussey, 2009: 19-32). Table 1 summarises the four levels into a few key words or phrases to help understand the flow of the levels. Table 1: Levels of Causal Layered Analysis Level Description any antitative trends or what is obvious cial Causes stemic factors, trends or drivers of change orldview tural causes and influences th/Metaphor eper assumptions and causes affecting the other levels urce: Adapted from (Inayatullah, 2004)
The first level of CLA is the ‘litany’ level which includes quantitative trends and problems, which are often exaggerated and used for political purposes and are usually presented by the news media (Inayatullah, 2004: 16). The litany level is the most visible and obvious, requiring little analytic capability and assumptions are rarely questioned (Inayatullah, 2004: 16). The second level is concerned with systemic causes, including social, technological, economic, environmental, political, and historical factors (Inayatullah, 2004: 17). This level excels at technical explanations as well as academic analysis (Inayatullah, 2004: 17). The role of the state and other key players and interests are often explored at this level (Inayatullah, 2004: 17). The third and deeper level is concerned with discourse or worldview that supports and legitimates the second level (Inayatullah, 2004: 17). The task is to find deeper social, linguistic, and cultural processes that are not dependent on whom the actors are and are somewhat invariant (Inayatullah, 2004: 17). Discerning deeper assumptions behind the issue is crucial here, as are efforts to revise the problem (Inayatullah, 2004: 18). At this stage, the extent to which different discourses do more than cause or mediate the issue, but constitute it are explored (Inayatullah, 2004: 19). The use of the discourses is dependent on the situation and based on the varied discourses; discrete alternative scenarios can be derived here (Inayatullah, 2004: 19). The fourth level of analysis is at the level of metaphor or myth (Inayatullah, 2004: 17). This layer is about discovery of the deeply rooted,
Proceedings: 9th Built Environment Conference
2-4 August 2015, Durban, South Africa
ISBN 978-0-620-67120-0
page 353
unarticulated, highly emotional and unconscious stories behind the story (Kotze, 2010: 39). This level provides a gut or emotional level experience to the worldview under inquiry. The language used is less specific, more concerned with evoking visual images, while touching the heart instead of reading the head (Inayatullah, 2004: 17). This fourth layer takes us to the metaphorical level of identity, which takes a step back from the actual future to address the deeper assumptions about the future being discussed, specifically the irrational or post-rational (Inayatullah, 2004: 18).
4. RESULTS, RECOMMENDATIONS AND CONCLUSIONS Social causes This layer deals with analysis of systemic factors (trends or drivers of change) that are driving the need for application of nanotechnology in the South African Construction Industry. The need for nanotechnology in the South African construction industry is driven by various factors. Nanoparticles are expected to play an important role at the base of material design, development and production for the construction industry (van Broekhuizen and van Broekhuizen, 2009: 15). In construction, APM-level technologies will improve the performance of materials, structures, and functional components while reducing the cost of their production and use. Cost of assembly represents a large portion of the cost of construction, which can be reduced by the production of low-cost, prefabricated, yet precisely customised segments of larger structures which are lightweight, easy to move and designed for easy assembly (Drexler, 2013:14).Various factors influence the use of nano-products in the construction industry. These include price competition, technical performance, awareness within the industry, advantages of nanotechnology for the industry, communicating nanotechnology along the user chain and overuse of the term ‘nano’ (van Broekhuizen and van Broekhuizen, 2009: 8-13; Adendorff, 2012: 20). South Africa can be seen as a country with great potential, a country that can be an example to other African countries in terms of leadership, environmental responsibility, research, sustainability and growth. South Africa has grown tremendously since the 80s and 90s, however in recent years it appears that the growth of the nation has slowed down. Poor infrastructure is one of the factors that are slowing the country down. The quality of the country’s infrastructure influences its efficiency which in turn hinders the economy. Poor infrastructure results in costly maintenance and damages industries that depend on the infrastructure. The potential of nanotechnology to create infrastructure that is almost maintenance free is one of the drivers of change through nanotechnology. To improve or maintain infrastructure is currently very expensive and is a lengthy process. Nanotechnology allows for much quicker construction methods than current construction methods. Slow construction time adds to
Proceedings: 9th Built Environment Conference
2-4 August 2015, Durban, South Africa
ISBN 978-0-620-67120-0
page 354
increased costs and more disruptions to the economy as capital is tied up for long periods of time. 3D printing of buildings using methods such as contour crafting is an example of how construction methods that use nanotechnology will speed up the construction process. 3D printing of buildings aided by nanotechnology will be able to print a building in one day that would usually take weeks if not months to construct. This holds great potential for construction projects such as low cost housing. First world countries are constructing high rise buildings at extremely fast rates which almost seem impossible in South Africa due to the methods used in the construction industry. However, nanotechnology will enable faster construction times for conventional methods due to applications such as rapid hardening concrete, increased efficiency of insulation used in construction such as dry walling to reduce brick and concrete usage. Job creation is an important driving factor for a country with a high unemployment rate such as South Africa. When a new technology is accepted by the public, new markets are potentially created. This is evident when the Information Technology sector is considered. Nanotechnology creates the opportunity of new markets which will create more jobs. New technology, improved infrastructure and new gaps in the market add to the economy of a country. An improved economy results in an increase in employment opportunities. Other industries within South Africa are affected by the South African construction industry and the lack of acceptance to change and the poor implementation of new technologies by the South African construction industry negatively affect the other industries of South Africa. Therefore, there is pressure placed on the South African construction industry by the other industries to reach the same technological level that these industries have reached. This is one of the driving forces of the application of nanotechnology within the South African construction industry. A nation with an efficient construction industry could be considered one of the characteristics of a first world nation. South Africa is experiencing challenges to become a first world country and to be competitive. An improved economy from less capital being tied up, increased job creation and improved infrastructure are steps in the right direction towards South Africa becoming a first world country. The dependence on other countries for resources and the length of supply chains add to the cost of materials and items. Therefore, the ability to not be dependent on other countries for resources and minimisation of supply chains is another driving force for the development of nanotechnology in the South African Construction Industry. Nanotechnology has the potential to improve the efficiency of energy productions from sustainable resources such as solar energy. This will reduce if not eliminate energy production from fossil fuels such as coal and oil which will greatly reduce the emission of greenhouse gases. Worldview
Proceedings: 9th Built Environment Conference
2-4 August 2015, Durban, South Africa
ISBN 978-0-620-67120-0
page 355
This level investigates the deeper (often unconscious) assumptions underlying the theories and policies that influence challenges for any reform. These assumptions are: Risk and hazard identification of nanotechnology are driving the social causes for non-implementation of nanotechnology in the South African Construction Industry. Resistance to accept innovation.
Risk and hazard identification of nanotechnology and mitigation thereof It has become necessary to determine health risks of nanotechnology before products are introduced into the market (Satterfield, Kandlikar, Beaudrie, Conti, and Harthorn, 2009: 752-758). The kind of scientific and engineering knowledge that is mobilised to make nanoproducts potentially marketable is filled with gaps and uncertainties and these uncertainties can only be understood by taking the contexts into account, and by seriously investigating the social, cultural and environmental implications of nanotechnology (Jamison, 2009: 133). Properties of novel nanomaterials used in civil infrastructure, necessitate an evaluation and understanding of the impact that the materials may have on the environment and human health, as millions of people will come into contact with nanotechnology (Sanchez and Sobolev, 2010: 2069). In contrast to the extensive and exponential possibilities of new technologies, government agencies responsible for protecting the public from any adverse effects of these new technologies seem dilapidated and tattered (Davies, 2009: 7). Increasing awareness relative to the role of health and safety as a project performance measure has engendered focus on health and safety in construction (Smallwood and Haupt, 2005: 29-56.). Detailed knowledge of the chemical nature of a product that a construction worker is using is not of great importance to them. What is important to construction workers is technical and health and safety information of the products (van Broekhuizen and van Broekhuizen, 2009: 11). South Africa’s DST has emphasised the need for risk assessment of engineered nanomaterials used in South Africa (Gulumian et al., 2012a). Detailed information about nano-product composition and the possible nano-specific health and safety issues is lacking and as a consequence, it will be very difficult for a construction company to conduct a proper risk assessment and organise a safe workplace for the employees (van Broekhuizen and van Broekhuizen, 2009: 3). At the construction site, one could deal with exposure to nanoparticles from primary and secondary use of a nanoproduct (van Broekhuizen and van Broekhuizen, 2009: 3). Typical activities with possible high risk of exposure to nanoparticles are the application of wet and dusty nano-products, machining dried or prefabricated nano-products and cleaning or maintaining of
Proceedings: 9th Built Environment Conference
2-4 August 2015, Durban, South Africa
ISBN 978-0-620-67120-0
page 356
nanomaterials and the equipment used (van Broekhuizen and van Broekhuizen, 2009: 9). The use of nano-products in the construction industry is a reality and can be expected to grow in the future (van Broekhuizen and van Broekhuizen, 2009: 25). Therefore, these activities require a careful risk assessment (van Broekhuizen and van Broekhuizen, 2009: 14). Oversight consists of obtaining risk information and acting on it to prevent health and environmental damage (Davies, 2009: 7). It is essential to coordinate international efforts and develop standardised methods for hazard identification to provide data for the risk assessment of representative engineered nanomaterials (Gulumian, M., Kuempel, E. D. and Savolainen, K. 2012a: 1). Once information about the potential risks and hazards have been obtained about nanotechnology, it is necessary to impose requirements that prevent or minimize adverse effects from occurring (Davies, 2009: 21). The development of a risk assessment for engineered nanomaterials in South Africa has similar challenges as those experienced internationally (Gulumian et al., 2012a: 7). Due to the various applications of nanotechnology, it is inadequate to develop an overall risk assessment and also unviable to conduct risk assessments individually for each application (Gulumian et al., 2012a). Therefore, it is necessary to place application in different classes and conduct risk assessments accordingly (Gulumian et al., 2012a). For a resource-limited country such as South Africa, it is essential that best practice guidelines developed internationally be adopted and that research be conducted as a priority to provide that data needed for risk assessments specific to the situation in South Africa (Gulumian et al., 2012a: 7). Despite the overwhelming support for nanotechnology, the public and a few scientists and researchers are concerned about potential harmful effects of nanotechnology. Risks that have been identified, such as nanoparticles being able to enter into the human body due to their extremely small size, could have harmful effects on the health of people and the environment. The public often focus more on potential risks rather than benefits of new technologies. Some believe that there is not enough effort being made to identify what risks are associated with nanotechnology as the world is blinded by the benefits of nanotechnology. However it is important to not just identify the risks but to determine ways to overcome the risks and make these discoveries know. To accept innovation by the South African construction industry The construction industry in South Africa is an important contributor to and facilitator of socio-economic development and economic growth (Rust and Koen, 2011:77). The construction industry is renowned for low levels of innovation and there is a need in South Africa to enhance and focus innovation efforts as well as construct and support research and nano technology development programmes (Rust et al., 2008b; Rust and Koen, 2011, HSRC, 2006: 2-8). The technology used in construction has aged and has not kept up with advances in other sectors of the economy (Rust and Koen, 2011:18).
Proceedings: 9th Built Environment Conference
2-4 August 2015, Durban, South Africa
ISBN 978-0-620-67120-0
page 357
Current obstacles to the adoption of nanotechnology the construction industry include the high cost of many nanoproducts and nanoprocesses, risk aversion, the traditional hesitancy of the building industry to embrace new technologies, the uncertainty about the health and environmental effects of nanoparticles and the public acceptance of nanotechnology (Elvin and Green Technology Forum, 2007). Due to the large quantities of materials required in the construction industry, small price changes may play an influential role in adopting new innovations. The immediate adoption of nanotechnology into the building industry is being slowed by the mismatch between a short term costconscious industry and the high cost of most nanoproducts relative to conventional building materials (Elvin and Green Technology Forum, 2007: 91). Researchers and scientists appear to be the dominant driving forces behind these assumptions. The ability to control the building blocks of materials has been a dream of the scientific world which has now become a reality. Worldwide it appears that governments are supporting the findings of the scientific world and are encouraging them to look deeper into the further development and potential of nanotechnology. The scientific world has also identified the potential benefits that nanotechnology has to offer. Governments of first world countries are pouring funds into nanotechnology research and development in order to gain a competitive advantage over other countries and to grow their own wealth. While governments of developing countries, such as South Africa, have identified nanotechnology to be the solution to problems such as malnutrition, availability of clean drinking water, energy production, energy storage and equality. Therefore governments of the world seem to be encouraging researchers and scientists to identify potential applications that will be beneficial to them as nations. Developing countries often lack the finance required to fund developmental research for applications that will benefit them. Therefore, a collaborative goal between first world and developing countries needs to be determined. Applications that benefit both first world and developing countries need to be further developed. However, it is becoming of greater importance to look beyond the surface and determine the overall effects of the applications, to ensure that applications are developed with operational safety a priority. Myth/Metaphor This fourth and deepest layer of analysis is usually invisible to most processes of change. However, it is a crucial one to become conscious of because in a sense it is its very invisibility that gives it such power. In relation to understanding the implementation of nanotechnology into the construction industry it is imperative to dig beneath the surface.
What impact does the current state of the South African Construction Industry have on the future of nanotechnology in the industry? Do the benefits of implementation of nanotechnology in the South African Construction Industry outweigh the risks?
Proceedings: 9th Built Environment Conference
2-4 August 2015, Durban, South Africa
ISBN 978-0-620-67120-0
page 358
If the above is true, what needs to be done to ensure an efficient implementation? If the above is false, can the implementation of nanotechnology be stopped?
The South African construction industry is focused on labour intensive construction methods as this is what the South African government focuses on for job creation. This has created an attitude within the South African construction industry that is now very reluctant to change. This attitude will slow the implementation of nanotechnology into the construction industry, however it will not prevent it. Billions of Rand is spent on construction projects each year in both the public and private sectors and such expenditures play a significant role in the South African economy. The South African government therefore needs to encourage the role that the construction industry has in the growth of the South African economy. Unnecessary emphasis is placed on labour intensive construction which slows down construction projects. By not encouraging innovative construction methods and materials, the government is slowing the economy by not allowing the construction industry to reach its full potential in the shortest time possible. A stronger economy will result in more jobs throughout the economy, inclusive of the construction industry. The health and safety of all involved in the construction industry, as well as the health and safety of the public during and after construction, has become of extreme importance for the South African construction industry. Therefore, the presence of potential risks associated with nanotechnology applications in the construction industry will prevent nanotechnology being applied to the construction industry efficiently. Once there is sufficient research and information available on how to deal with the risks associated with nanotechnology, there will still be the challenge of getting the construction industry to buy into the education process of these risks. The workforce of the South African construction industry often does not see the need for health and safety practices. Therefore it is of extreme importance to the successful implementation of nanotechnology in the construction industry, especially the workforce, is educated about the benefits and the risks associated with the nanotechnology applications that the workforce is using. Risks associated with nanotechnology are a reality and may be like no other risk factors experienced before. The public tend to focus more on the risks and hazards compared to the benefits of a new technology. This can create a negative attitude towards the new technology. Due to the size of nanoparticles, current health and safety apparatus will no longer be sufficient to prevent the particles from entering the human system. The manipulation of materials at the nanoscale and the ability of materials to change properties with external stimuli such as sunlight could have devastating effects to the environment and ecosystems. However, it is widely considered that the benefits of nanotechnology used in the construction industry will outweigh the risks. Therefore, in order to ensure efficient implementation, there needs to be more funding available for research focused on working safely with the risks of
Proceedings: 9th Built Environment Conference
2-4 August 2015, Durban, South Africa
ISBN 978-0-620-67120-0
page 359
nanotechnology. Regulations for working with nanotechnology need to be developed much like those used for asbestos. Companies working with nanotechnology also need to be identified, registered and monitored. Procedures that are designed to deal with potential disaster scenarios will also need to be developed. Public involvement will also be crucial to the efficient implementation of nanotechnology in the South African construction industry. Researchers, scientists and governments will therefore need to be transparent in the development of nanotechnology. Due to the emphasis that governments and researchers have placed on nanotechnology and successful results from applications already in the industry, very little will be able to completely stop nanotechnology in the construction industry. Nanotechnology could be the only current solution to the world’s problems.
5. FURTHER RESEARCH South Africa has the potential to use nanotechnology in the construction industry to improve the situation that the country is currently in. Applications of nanotechnology and the results from these applications almost seem idealistic, however they are a reality. The time-frame of realising the full effect of nanotechnology in the South African construction industry depends on the efforts made by the academic world and government alike to determine how to safely work with nanotechnology. It is also important for the timely implementation of nanotechnology that the public of South Africa is adequately informed about the developments of nanotechnology in terms of both benefits and risks. The South African government needs to focus more on the long term benefits that can be achieved by nanotechnology. Areas of focus such as labour intensive methods for job creation will slow the implementation of nanotechnology in the construction industry which could see South Africa fall even more technologically behind first world countries.
6. REFERENCE LIST Adendorff, C. 2012. Future trends in nanotechnology and molecular assembly: conceptualising technological innovation and social impact towards 2025. International Journal of Social Entrepreneurship and Innovation, 1, 265-280. Andrievski, R. A. & Klyuchareva, S. V. 2011. Journal information flow in nanotechnology. Journal of Nanoparticle Research, 13, 6221-6230. Bartos, P. J. Nanotechnology in construction: A roadmap for development. In: Bittnar, Z., Bartos, P., Nemecek, J., Smilauer, V. & Zeman, J., eds. Nanotechnology in Construction: proceedings of the NICOM3 (3rd international symposium on nanotechnology in construction), 2009 Prague, Czech Republic. 15-26.
Proceedings: 9th Built Environment Conference
2-4 August 2015, Durban, South Africa
ISBN 978-0-620-67120-0
page 360
Bussey, M. 2009. Causal Layered Pedagogy: Rethinking Curricula Practice. Journal of Futures Studies, 13, 19-32. Campbell, T., Williams, C., Ivanova, O. & Garrett, B. 2011. Could 3D Printing Change the World? Technologies, Potential, and Implications of Additive Manufacturing. Washington, DC: Atlantic Council. Dang, Y., Zhang, Y., Fan, L., Chen, H. & Roco, M. C. 2010. Trends in worldwide nanotechnology patent applications: 1991 to 2008. Journal of Nanoparticle Research, 12, 687-706. Davies, J.C. 2009. Oversight of Next Generation Nanotechnology. Project on Emerging Nanotechnologies. Woodrow Wilson International Center for Scholars. Drexler, E. K. 2013. A Radical Future for Nanotechnology. The Futurist, 47, 1420. Elvin, G. & Green Technology Forum 2007. Nanotechnology for Green Building, Indianapolis, Indiana, United States of America, Green Technology Forum. Gulumian, M., Kuempel, E. D. & Savolainen, K. 2012a. Global challenges in the risk assessment of nanomaterials: Relevance to South Africa. South African Journal of Science, 108, 1-9. Gulumian, M., Masoka, X., Sekobe, G. & Wells, U. 2012b. Nanotechnology Research & Occupational Health and Safety in Africa. African Newsletter, 22, 56-60. Hwang, D. & Khoshnevis, B. An Innovative Construction Process-Contour Crafting (CC). 22nd International Symposium on Automation and Robotics in Construction, September 11-14 2005 Ferrara, Italy. Inayatullah, S. (Ed.) 2004. The causal layered analysis (CLA) reader: Theory and Case Studies of an Integrative and Transformative Methodology, Taipei, Taiwan, Tamkang University Press. 576p. Inayatullah, S. 2013. Futures Studies: Theories and Methods. In: Junquera, F. (ed.) There's a future: Visions for a better world. Madrid, Spain: BBVA. 511p. Jamison, A. 2009. Can nanotechnology be just? On nanotechnology and the emerging movement for global justice. NanoEthics, 3, 129-136. Keyvani, A. 2007. Huge opportunities for industry of nanofibrous concrete technology. International Journal of Nanoscience and Nanotechnology, 3, 3-11. Khoshnevis, B. & Bekey, G. 2003. Automated Construction Using Contour Crafting--Applications on Earth and Beyond. Nist Special Publication Sp, 489-494. Kotze, H. 2010. Causal layered analysis enriching the innovation process. PhD Thesis, Stellenbosch University, Stellenbosch. Lemley, M. A. 2005. Patenting nanotechnology. Stanford Law Review, 58, 601630. Lösch, A. 2006. Anticipating the future of nanotechnology: some thoughts on the boundaries of sociotechnological visions. Department of Sociology, Technical University Darmstadt.
Proceedings: 9th Built Environment Conference
2-4 August 2015, Durban, South Africa
ISBN 978-0-620-67120-0
page 361
Mehta, P. K. 2001. Reducing the environmental impact of concrete. Concrete international, 23, 61-66. Qian, L. & Hinestroza, J. P. 2004. Application of nanotechnology for high performance textiles. Journal of textile and apparel, technology and management, 4, 1-7. Rebolj, D., Fischer, M., Endy, D. & Moore, T. 2010. Nano-to-meter-scale Automated Building. 27th International Symposium on Automation and Robotics in Construction, 25-27 June 2010, Bratislava, Slovakia. 175-182. REALIS, I. (2002). A critical investor’s guide to nanotechnology. Inrealis. com. Roco, M. C. 2005. International perspective on government nanotechnology funding in 2005. Journal of Nanoparticle Research, 7, 707712. Russo, C. & Caloundra City Council 2003. The CLA questioning methodology. Journal of Futures Studies, 7, 73-82. Rust, F. & Koen, R. 2011. Positioning technology development in the South African construction industry: a technology foresight study. Journal of the South African Institution of Civil Engineering, 53, 2-8. Salamanca-Buentello, F., Persad, D. L., Court, E. B., Martin, D. K., Daar, A. S. & Singer, P. A. 2005. Nanotechnology and the developing world. PLoS Medicine, 2, e97. Sanchez, F. & Sobolev, K. 2010. Nanotechnology in concrete–a review. Construction and Building Materials, 24, 2060-2071. Sasmal, S., Bhuvaneshwari, B. & Iyer, N. R. 2013. Can Carbon Nanotubes Make Wonders in Civil/Structural Engineering? Progress in Nanotechnology and Nanomaterials, 2, 117-129. Satterfield, T., Kandlikar, M., Beaudrie, C. E., Conti, J. & Harthorn, B. H. 2009. Anticipating the perceived risk of nanotechnologies. Nature Nanotechnology, 4, 752-758. SAUL, P. 2001. This way to the future. Journal of Futures Studies, 6, 107-119. Schmidt, K. 2007. Green nanotechnology: it's easier than you think. Project on Emerging Nanotechnologies (Pen 8). Washington, DC: Woodrow Wilson International Centre for Scholars. Singer, P. A., Salamanca-Buentello, F. & Daar, A. S. 2005. Harnessing Nanotechnology to Improve Global Equity. Issues in Science and Technology, 21, 57-64. Smallwood, J. & Haupt, T. 2005. The need for construction health and safety(H&S) and the construction Regulations: engineers' perceptions. Journal of the South African Institution of Civil Engineering, 47, 2-8. Sobolev, K., Flores, I., Torres-Martinez, L. M., Valdez, P. L., Zarazua, E., & Cuellar, E. L. (2009). Engineering of SiO2 nanoparticles for optimal performance in nano cement-based materials. In Nanotechnology in Construction 3 (pp. 139-148). Springer Berlin Heidelberg. South African Department Of Science and Technology. 2006. The South African Nanotechnology Strategy. Available: http://www.dst.gov.za/publications-policies/strategiesreports/reports/Nanotech.pdf [Accessed 21 August 2013].
Proceedings: 9th Built Environment Conference
2-4 August 2015, Durban, South Africa
ISBN 978-0-620-67120-0
page 362
Tewari, Y. & Bharadwaj, R. 2013. Nanotechnology in highway engineering. Indian Highways, 41, 43-48. Van Broekhuizen, F. & Van Broekhuizen, P. 2009. Nano-products in the European Construction Industry, Amsterdam, European Federation of Building and Woodworkers. 108p. Wu, J., Becerril, H. A., Bao, Z., Liu, Z., Chen, Y. & Peumans, P. 2008. Organic solar cells with solution-processed graphene transparent electrodes. Applied Physics Letters, 92, 263-302. Zhu, W., Bartos, P. & Porro, A. 2004. Application of nanotechnology in construction. Materials and Structures, 37, 649-658. Zhu, Y. (2004). Ensemble forecast: A new approach to uncertainty and predictability. Advances in atmospheric sciences, 22(6), 781-788.
Proceedings: 9th Built Environment Conference
2-4 August 2015, Durban, South Africa
ISBN 978-0-620-67120-0
page 363
ASOCSA2015-025
Alcohol abuse and illicit drug use on construction sites: A norm or an emerging issue? Geraldine John Kikwasi Senior Lecturer, School of Construction Economics and Management, Ardhi University.
[email protected] Purpose This paper assesses the level of alcohol abuse and illicit drug use on construction sites, reasons and their effects. Design/methodology/approach The research adopted a cross sectional research design to examine the level of alcohol abuse and illicit drug use on construction sites, reasons and their effects. A sample size of 100 construction sites was earmarked and using random sampling technique sites for the study were selected. Literature review and questionnaires were used to collect the data. Thirty five questionnaires were returned out of which 22 were fairly filled. Findings Findings indicate that the level of alcohol abuse and illicit drug use on construction sites were on average. Major reasons stated were to increase endurance and performance and peer pressure. Effects frequently cited are accidents and physical injury, and, lowering work performance. Research limitations/implications The study covered few sites in Dar es Salaam; consequently the findings cannot be generalized. Hence, other regions should be surveyed. Practical implications Findings of this paper provide an insight on the use of illicit drugs and alcohol abuse on construction sites. The paper recommends initiation of training and counselling programmes relating to alcohol abuse and illicit drug use on construction sites. KEYWORDS: Construction construction sites
Proceedings: 9th Built Environment Conference
workers,
alcohol
abuse,
2-4 August 2015, Durban, South Africa
illicit
drugs,
ISBN 978-0-620-67120-0
page 364
1
INTRODUCTION
Few studies (Bywood, Pidd and Roche,2006; Laad, Adsul, Chaturvedi and Shaikh, 2013;Slavit and Reagin, 2009; Australia Safety and Compensation Council, 2007; Butler Center for Research 2009; Biggs and Williamson, 2012; Plessis and Corney, 2011; and Cook, Hersch, Back and McPherson,2004) done on this area reveal substance abuse by construction workers. Use of illicit drugs and alcohol abuse are prevalent in societies and workplaces for a number of reasons such as enjoyment, peer pressure, working or living conditions as well as availability (Laad et al, 2013; Du Plessis and Corney, 2011; Spooner, 1999; and European Foundation for the Improvement of Living and Working Conditions Report, 2012). Substance abuse have been associated with unfavourable behaviour, acts or events in societies or workplaces leading to accidents, low productivity, health problems, and absenteeism (Yung and AgyekumMensah, 2012; Graham, 2014; and European Foundation for the Improvement of Living and Working Conditions Report, 2012). However, there are studies which are not in agreement with the effects of alcohol abuse and illicit drug use at workplaces such as that of Smith (2007), Beach and Cherry (2006) and Melia and Becerril (2009). This study seeks to shade light on the substance abuse in Tanzanian construction sites, the reasons for abuse and their effects. 2
LITERATURE REVIEW
2.1
Alcohol abuse and illicit drug use in the construction industry
The construction industry is susceptible of alcohol abuse and illicit drug use. Few studies done on this area have established that construction workers are among users of alcohol and illicit drugs who are at the top of the list. Bywood et al (2006) report that construction industry workers were the second heaviest users of drugs (24.1%), followed by the retail industry (20.7%) and preceded by hospitality (31%) and the most used drug is cannabis (32.6%). Laad et al (2013) reveal that the prevalence of tobacco use (63.8%) and alcohol use (15.8%) among construction workers is very high compared to that in the general population. Slavit and Reagin (2009) report industries with some of the highest rates of illicit drug use as accommodations and food services (16.9%) followed by construction (13.7%). Australia Safety and Compensation Council (2007) found that workers in the construction and mining industries (15.7%) had the highest rates of heavy drinking followed by manufacturing (9.4%) and service (9.4%), and, in use of illicit drug construction (12.3%) was leading followed by service industry (10.8%). Butler Center for Research (2009) indicates
Proceedings: 9th Built Environment Conference
2-4 August 2015, Durban, South Africa
ISBN 978-0-620-67120-0
page 365
that use of illicit drugs among adult full time workers were high in food preparation and serving (17.4%) followed by construction and extraction (15.1%). These figures in the construction industry are alarming and call for action to be taken given the nature of the activities undertaken in the industry. Alcohol abuse and illicit drug use or substance abuse are raising concerns among researchers in the construction industry due to their potential impact on safety and productivity. Laad et al (2013) found that the prevalence of smoking and non-smoking form of tobacco was 21.6 % and 46.1% respectively. Biggs and Williamson (2012) disclose that 58% of respondents scored above the cut-off cumulative score (risky or hazardous alcohol of ≥ 8) for risky or hazardous alcohol and identified other drug use as a major issue. A study by Plessis and Corney (2011) reveal that the majority of apprentices had experimented with alcohol followed by cannabis. Although the illicit drug of choice for workers across all industries was cannabis, followed by ecstasy, amphetamines, painkiller and cocaine, there were differences in the prevalence of illicit drug use across the industries such that hospitality workers (31%) were more likely to have used an illicit drug in the past 12 months, followed by construction (24%) and retail workers (21%) (ibid). A report by Beach and Cherry (2006) discloses that the recent Canadian Addiction Survey estimated that current alcohol use among adults averaged 79.3% of the population and the prevalence of illicit drug use in the past year was at 14.1% for cannabis and 1.9% for cocaine/crack. Cook et al (2004) indicate that construction workers who participated in the initial data collection displayed relatively high levels of substance abuse drug positive rate of 19.2% and 27.5% obtained by self-reports of drug use in the past 30 days and 12 months respectively. 2.2 Reasons for alcohol abuse and illicit drug use Alcohol abuse and illicit drug use are happening for many reasons which are linked work, social life as well as availability. Many countries are directing their efforts to control drug accessibility as way of eradicating or minimizing illicit drug use, still such drugs are accessible. Laad et al (2013) report that the most common reason for first use was company of friends or peer pressure (59%) and 36% reported influence of family/friends as reason for addiction. Du Plessis and Corney (2011) found out that majority of apprentices used substances for enjoyment (“It is fun/I like it”) or social reasons (“Friends use it”). Spooner (1999) studied drug abuse among adolescents and concludes that the reasons for drug abuse vary among adolescents and across time within adolescents. She gives an example that drug abuse might begin as a result of curiosity or peer pressure, and then continue for social/recreational purposes. European Foundation for the Improvement of Living and Working Conditions Report (2012) state that the reasons for alcohol/drug use at work are:
Proceedings: 9th Built Environment Conference
2-4 August 2015, Durban, South Africa
ISBN 978-0-620-67120-0
page 366
work-related reasons such as arduous working conditions, irregular working practices and psychological stress at work; and social/personal reasons such as cultural tolerance, ease of access, social isolation, difficult living conditions and personality.
2.3 Effects of alcohol abuse and illicit drug use in construction works Alcohol abuse and illicit drug use have a number of effects to workers, supervisors, owners of firms and even users themselves. Yung and Agyekum-Mensah (2012) found that a smoker on average smokes 5.6 cigarettes, which takes a total of 73 minutes, representing 15.2 per cent of productivity loss in an eight-hour shift. Graham (2014) argues that alcoholand substance-abuse leads to lost productivity due to: drinking on the job; working with hangovers; the use of more sick days; higher accident rates; and indirect costs related to health care, employee turnover, legal issues, and the recruitment and training of replacement workers. There are other studies which are yet to establish facts on the effects of alcohol abuse and illicit drug use. Smith (2007) points out that the evidence for workplace consequences is sparse for instance despite the intuitive link, there is little clear evidence on the links between drug use and absenteeism, low productivity, poor performance and accidents at work. A report by Beach and Cherry (2006) disclose that personal use of alcohol as a social habit, at work, or immediately before work; and personal use of illicit drugs as a social habit, at work, or immediately before work are not risk factors for work-related injuries. Similarly, Melia and Becerril (2009) research reveal that the employee’s unhealthy behaviours do not appear as a direct source of micro-accidents. They define workers health to include habits or actions related to physical exercise, nutrition, smoking and drug or alcohol consumption. However, most of these studies agree that literature has established that alcohol consumption and substance abuse have been a source of accidents and injuries among construction workers. European Foundation for the Improvement of Living and Working Conditions Report (2012) lists consequences of drug/alcohol use at work to include: higher instances of sick leave/short-term absenteeism; health problems; reduced performance; labour conflicts and unsettled working environment; greater number of work accidents; other problems (company reputation, damage to equipment or products)
Proceedings: 9th Built Environment Conference
2-4 August 2015, Durban, South Africa
ISBN 978-0-620-67120-0
page 367
3. RESEARCH METHODOLOGY The study adopted a cross-sectional research design which tries to shed light on the extent of alcohol abuse and illicit drug use on construction sites. The population of the study was a number of construction sites in progress in Dar es Salaam and registered by Contractors Registration Board (CRB). At the time of the study there were 354 projects registered in 2014 out of which 116 projects met criteria to be studied. These criteria are: a project must be of building or civil engineering work, and must have a value of Tanzanian Shillings 500 million and above. The study assumed a sample size of 100 construction sites which were randomly sampled and respondents were either construction supervisors or dealing with daily activities of the site. Data was collected using questionnaires prepared and from existing literature. Hundred questionnaires were prepared out of which 30 were physically delivered and 70 were e-mailed to site supervisors of construction firms. Thirty five questionnaires were returned, of which 22 were properly filled resulting in 20% response rate. Data was analyzed using Statistical Package for the Social Science (SPSS) where frequencies were used to analyze data for respondents’ profile and extent of alcohol abuse and illicit drug use. Relative Importance Index (RII) was used to compute reasons and effects of alcohol abuse and illicit drug use. The Relative Importance Index (RII) is calculated as follows: RII = ΣW/AxN Where; W = weight given to each factor by respondents i.e. 1, 2, 3, 4 and 5 A = highest weight N = total number of respondents. For the purpose of this study A=5 and N=22 Relative Importance Indices (RII) comparison table was used to rank the results by taking into account the average scores and the RII as follows: Table 3.1 Relative Importance (RII) Table
Average Score 4.0 to 5.0 3.0 to 4.0 1.0 to 3.0
RII 0.80 to 1.00 0.60 to 0.80 0.20 to 0.60
Ranking High (H) Medium (M) Low (H)
Source: Chileshe, Haupt and Fester (2007)
Proceedings: 9th Built Environment Conference
2-4 August 2015, Durban, South Africa
ISBN 978-0-620-67120-0
page 368
4. ANALYSIS AND DISCUSSION 4.1 Respondents profile Majority of respondents were Quantity surveyors (11) followed by engineers (7). Regarding experience, a good number of respondents (13) had experience of more than five years. 4.2 Extent of alcohol abuse and illicit drug use on construction sites In assessing the extent of alcohol abuse and illicit drug use, respondents indicated their frequency of abuse and use of alcohol and drugs in a Likert scale. The results are summarized in Figure 4.1 and 4.2 below. 25 Total, 22
20 15 10
Rarely, 8Average, 9
5
Frequent, 3 Very frequent, 2 3 4 5
0 0
1
2
6
Figure 4.1 Alcohol abuse on construction site
25
Total, 22
20 15 10
Rarely, 8
5 0 0
1
2
Average, 11 Frequent, 2 Very frequent, 1 3 4 5
6
Figure 4.2 Illicit drug use on construction site
Results indicated that level of alcohol abuse and illicit drug use on construction sites are on average. This implies that there are indications of substance abuse in Tanzanian construction sites. This finding supports findings of other studies by Bywood et al (2006), Laad et al (2013), Australia Safety and Compensation Council (2007), Plessis and Corney (2011) and Beach and Cherry (2006) that substance abuse in the construction industry is evident.
Proceedings: 9th Built Environment Conference
2-4 August 2015, Durban, South Africa
ISBN 978-0-620-67120-0
page 369
4.3 Reasons for alcohol abuse and illicit drug use on construction site In examining the prevalence of alcohol abuse and illicit drug use, reasons were extracted from literature and respondents were required to assess them using 1 = unsure; 2 = rarely; 3 = sometimes; 4 = often; and 5 = always. The results are summarized in Table 4.1 and 4.2 below. Table 4.1 Reasons for alcohol abuse on construction sites
Reason
N
RII
Ranking
22 22 22
Average Score 3.82 3.18 3.14
Peer pressure For leisure To increase performance and endurance Family problems To increase concentration at work
0.76 0.64 0.63
1 2 3
22 22
3.05 2.36
0.61 0.47
4 5
Table 4.2 Reasons for illicit drug use on construction sites
Reason
N
Peer pressure
22
Average Score 4.00
RII
Ranking
0.80
1
To increase performance and endurance Family problem
22
3.55
0.71
2
22
2.95
0.59
3
For leisure
22
2.23
0.45
4
To increase concentration at work
22
2.00
0.40
5
The fact that substance abuse remains to be a threat in the industry, a number of studies have tried to put to light reasons for such habit. All reasons for alcohol abuse were ranked medium meaning that at times they contribute to substance abuse except to increase concentration at work which was ranked low. On the use of illicit drugs, peer pressure was ranked highest followed by to increase performance and endurance which was ranked medium. This finding partly is in consistence with the work of Laad et al (2013) and Du Plessis and Corney (2011) who found that peer pressure was a reason for illicit drug use. 4.4 Effects of alcohol abuse and illicit drug use on construction site Substance abuse is susceptible of effects to workers, supervisors, owners of firms and even users themselves. This part examines effects extracted from literature and those listed by respondents using 1 = unsure; 2 = rarely;
Proceedings: 9th Built Environment Conference
2-4 August 2015, Durban, South Africa
ISBN 978-0-620-67120-0
page 370
3 = sometimes; 4 = often; and 5 = always. The results are summarized in Table 4.3 and 4.4 below. Table 4.3 Effects of alcohol abuse on construction sites
Effect
N 22
Average Score 3.95
Accidents and physical injuries Lowering work performance
RII
Ranking
0.79
1
22
3.73
0.75
2
Lateness at workplace
22
3.36
0.67
3
Lack of discipline
22
3.18
0.64
4
Absenteeism
22
3.23
0.65
5
Poor economic status of the worker due to unnecessary expenditure
22
3.09
0.62
6
Table 4.4 Effects of illicit drug use on construction sites
N Accidents and physical injuries
22
Average Score 4.09
RII 0.82
Ranking 1
Lateness at workplace
22
3.45
0.69
2
Lowering work performance
22
3.41
0.68
3
Absenteeism
22
3.18
0.64
4
Lack of discipline Poor economic status of the worker due to unnecessary expenditure
22
2.95
0.59
5
22
2.91
0.58
6
Effect
All effects of alcohol abuse were ranked medium with accidents and physical injuries leading followed by lowering work performance. On illicit drug use the effect ranked high was accidents and physical injuries and those ranked medium are lateness at work place, lowering work performance and absenteeism. These findings contradict the work of Smith (2007) points out that the evidence for workplace consequences is sparse. Finding on lowering work performance supports the work of Yung and Agyekum-Mensah (2012) and Graham (2014) who found that smoking and alcohol- and substance-abuse lead to lost productivity. The finding on illicit drug use and its relation to accidents and injury is disputed by researches like that of Graham (2014) and Melia and Becerril (2009).
Proceedings: 9th Built Environment Conference
2-4 August 2015, Durban, South Africa
ISBN 978-0-620-67120-0
page 371
5. CONCLUSION ANDRECOMMENDATIONS Substance abuse is indisputable in the construction industry. A number of studies have indicated that the construction is among the industries that are prone to substance abuse. Reasons revealed for substance abuse include peer pressure, when socializing i.e. leisure and in addition to increase performance. Effects of substance abuse include accidents and physical injuries, lowering work performance and being late at work. The fact that substance abuse like in any other regions is evident in the Tanzanian construction industry it calls for employers and stakeholders at large to take action. The paper recommends that construction firms shall initiate training and counselling programmes relating to alcohol abuse and illicit drug use on construction sites. 6. REFERENCES Beach, J., Ford, G and Cherry, N (2006) A literature review of the role of Alcohol and Drugs in contributing to work-related injury. Available at: albertalabour.blogspot.com/2012/09/the-evidence-for-drug. Viewed on 31/1/2015 Biggs, H.C and Williamson A.R (2012) Safety impacts of alcohol and other drugs in construction: development of an industry policy and cultural change management program In: Smith, S.D (Ed) Procs 28th Annual ARCOM Conference, Edinburgh, UK, Association of Researchers in Construction Management, 445-454.** Butler Center for Research (2009) Substance Use in the Workplace. Available at:www.hazelden.org/web/public/document/bcrup_0109.pdf. Viewed on 31/1/2015 Bywood, P., Pidd, K and Roche, A (2006) Illicit Drugs in the Australian Workforce: Prevalence and Patterns of Use. Workplace Drug and Alcohol Use Information and Data Sheet. Available at: nceta.flinders.edu.au/files/8212/6317/9671/EN404.pdf. Viewed on 31/1/2015 Chileshe, N., Haupt, T., and Fester, F. (2007), Assessing the readiness of building diplomates for the South African construction industry. Journal for Education in the Built Environment, 2 (2). Cook,F. R., Hersch,R. K., Back, A. S and McPherson, T. L. (2004)The prevention of substance abuse amoung construction workers: A field test of a social-cognitive program. Journal of Primary Prevention, vol. 25(3) pp.337-537 European Foundation for the Improvement of Living and Working Conditions Report (2012) Use of alcohol and drugs at the workplace.Available at: www.eurofound.europa.eu. Viewed on 31/1/2015
Proceedings: 9th Built Environment Conference
2-4 August 2015, Durban, South Africa
ISBN 978-0-620-67120-0
page 372
Graham, C (2014) Reducing Alcohol and Substance Abuse: A Benefit of Workforce Housing in Oil, Gas, Mining and Construction Industries. White Paper – 04.14. Available at:www.targetlogistics.net/1_pdfs/white-paper. Viewed on 31/1/2015 Laad, P. S., Adsul B. B., Chaturvedi, R. M and Shaikh, M.(2013) Prevalence of substance abuse among construction workers. Indian Journal of research vol.2 (3) pp.280-283Medic Science Melia, J. L and Becerril, M (2009) Health behavior and safety in the construction industry. Journal of Psicothema vol.21(3) pp.427432.Available at: http://www.redalyc.org/articulo.oa?id=72711821014 Plessis, K and Corney, T. (2011) Construction industry apprentices’ substance use A survey of prevalence rates, reasons for use, and regional and age differences.Youth Studies Australia V. 30(4) pp.40-50 Slavit,W.I and Reagin, A (2009) An employer’s guide to workplace substance abuse: strategies and treatment recommendations. Available at:www.businessgrouphealth.org/pub/f3151957-2354-d714-5191. Australia Safety and Compensation Council (2007) Work-related alcohol and drug use - a fit for work issue. Available at:http://www.ag.gov.au/cca Smith, D (2007) Work-related alcoholand drug use: A fit for work issue.Australian Safety and Compensation Council.Available at:www.safeworkaustralia.gov.au/sites/swa/about. Viewed on 31/1/2015 Spooner, C. (1999) Causes and correlates of adolescent drug abuse and implications for treatment. Drug Alcohol Review, Vol.18: pp. 453 .475Alc Yung, Y and Agyekum-Mensah, G. (2012) Productivity losses in smoking breaks on construction sites: a case study. Journal of Engineering, Construction and Architectural Management Vol. 19 (6), pp. 636-646
Proceedings: 9th Built Environment Conference
2-4 August 2015, Durban, South Africa
ISBN 978-0-620-67120-0
page 373
ASOCSA2015
Model for exploring women’s Motivation for getting into business in the Tanzanian Construction industry Dr. Nyamagere Gladys Sospeter
[email protected] School of Construction Economics and Management, Ardhi University, Dar es Salaam, Tanzania ABSTRACT Purpose and objective There is limited understanding about the experiences and conduct of women entrepreneurs in traditionally male dominated sectors such as construction industry (WECI). This paper aimed at contributing to addressing this gap by providing insights about the motives that drive women to start and develop businesses in the construction industry in Tanzania. Methodology The case study research strategy was employed in which five WECI were studied. Data were collected through a combination of methods, including in-depth interviews with a range of participants such as WECI, their managers, clients and regulatory agencies. Data were subjected to qualitative analysis techniques. Findings The findings show that, unlike women in traditional industries, pull factors constituted the primary motives for women to start a business in the construction industry while push factors were secondary reasons. Findings demonstrate further that, personal and business environment had implications on women’s motives as well as involvement in business. Practical implications The paper sheds light for understanding the factors that motivate WECI. In terms of policy, the findings point to some approaches for preparing women to successfully enter and operate in male dominated sectors. These ways are both complimentary and self re-enforcing. Key words; Construction, Women, Entrepreneurship, Motives and Tanzania
Proceedings: 9th Built Environment Conference
2-4 August 2015, Durban, South Africa
ISBN 978-0-620-67120-0
page 374
1.0 INTRODUCTION While women entrepreneurship has been studied in other countries, the majority of these studies have largely focused on generic motives for women to start a business in traditional industries (Alwaryd, 2009; Lingsey, 2012; Nchimbi and Chijoriga, 2009). Furthermore, the majority of these studies have focused on developed countries with a paucity of studies within the developing countries (Lincoln, 2010; Verwey, 2005; Hakala, 2008). However, there is a growing need for specific studies on women entrepreneurship in male dominated industries such as construction industry especially within Sub Saharan Africa (SSA) including Tanzania. As with other developing countries, construction industry is a sector of economy that transforms various resources into constructed physical economic and social infrastructure necessary for socio-economic development (Rwelamila, 2009; MoW, 2003). For example, the importance of construction industry is evidenced as one of the Tanzanian pillars for socio- economic development and contributes between 5 to 9 percent of the GDP, 9 percent of employment creation and 57 percent of the gross fixed capital formation (MoW, 2003: CRB, 2013). The construction industry is one of the main economic sectors that need the skills and talents of everyone, including women. In contrast, in Tanzania, Less than 2% of 7,036 construction firms are owned by women (CRB, 2013). Out of 129 WECIs, 5 own large, 27 own medium and 68 own small construction firms. Although, women comprise 51.4% of the Tanzanian population (URT, 2012), they continue to be under-represented, marginalized and so less able than men to participate in primary sectors such as the construction industry. Women are marginalized due to social and cultural structures. However, the social structures and cultural systems that reinforce the continued subordination and marginalization of women have a major impact on their motives for their involvement in business and perception of success (Hakala, 2008; Nchimbi & Chijoriga, 2009). Partly as a result, women have limited technical educational, socialization and financial resources which are very important for business start-ups and development of businesses especially for which require high levels of professional and technical education such as the construction industry (Alwaryd, 2009). Needless to say, the number of females who take science and technical studies in higher learning institutions is low and it can explain the under representation of WECI. The fact that, women have the entrepreneurial potential as men do to contribute to wealth creation and employment by starting and developing their own businesses is beyond question (Lincolin, 2010; Nchimbi & Chijoriga, 2009; Rosa, 2013). Unfortunately, their potential has not been fully realised because of the systemic challenges that face women
Proceedings: 9th Built Environment Conference
2-4 August 2015, Durban, South Africa
ISBN 978-0-620-67120-0
page 375
entrepreneurs. In addition, globally, women who choose to pursue entrepreneurial ventures have had limited representation in the construction industry which limits their contribution to economic development (Wangle, 2009; Verwey, 2005; Dainty et al., 2007; Worrall et al., 2008). In order for countries to realise their entrepreneurial potential and for them to contribute fully to economic development, it is important to address the specific issues facing WECIs. There is no consensus as what exactly motivates women to start and develop business ventures as differences in motives exist. What motivate women to start a business? Motivation is a driving force within individuals as they attempt to achieve some goals for the purpose of meeting their expectations. There are many reasons why individuals may start a new business because the decisions people make are complex and unique. Given the fact that women are not homogeneous, they are motivated differently. It is important to examine their motives for starting a business first as this can have a major impact on the type of business they establish. Some authors have indicated that, although women and men are similar across a range of demographic characteristics, business skills and some psychological traits, there appears to be a general consensus that greater differences than similarities exist between the sexes in terms of motivations (Cromie, 1987a; Brush, 1992; Orhan and Scot, 2001). An important difference between men and women is that, for men, being an entrepreneur is a business strategy while for women it's a life strategy (Lingsie, 2012). They further suggest that men generally start a business for economic reasons while women start a business for family needs and see it as a life choice. This is consistent with the fact then that male and female entrepreneurs differ with respect to their personal and business goals and their tendency to start and run businesses in different sectors ( Fischer et al, 1993; Verheul and Thurik, 2001). Reasons for Start-up Decision Literature reveals that entrepreneur’s motivation for starting a business can be categorised in terms of push and pull factors. Pull factors as described by (GEM, 2012; Pines and Schwartz, 2008) are those which encourage potential entrepreneurs by virtue of the attractiveness of the option and include financial reward, preference for independence, the need for achievement and innovate, ambition and new challenges, and to gain social standing and recognition These pull factors are associated with the motives of choice (Orhan and Scott, 2001). Self-achievement is a major pull factor for female entrepreneurs, as women start a business because they want a challenge (Orhan and Scott, 2001; Buttner and Moore, 1997). Through entrepreneurship, women have the opportunity to stretch their skills and experience the freedom to determine their destiny (Buttner and Moore, 1997). This is consistent with the notion that women deliberately choose self-
Proceedings: 9th Built Environment Conference
2-4 August 2015, Durban, South Africa
ISBN 978-0-620-67120-0
page 376
employment, rather than be forced into it through necessity (Orhan and Scott, 2001; Verwey, 2005). Push factors are those which force an individual to start a business out of necessity or where a woman is forced into pursuing her business idea. Such factors are economic necessity, redundancy, personal circumstance, unemployment, job dissatisfaction, career frustration, the inspiration of friends, parents or co-workers and the work/life balance (Verwey, 2005; Nchimbi and Chijoriga, 2009). It has been found that one of the strongest motives for women to start a business in developing countries is the pressure to meet basic economic needs (Rutashobya, 2000;). Women are mostly found in informal, micro level and low-growth sectors, where they encounter stiff competition while earning subsistence incomes (UDEC, 2002). Goffee and Scase (1983) found that in a small number of cases women set up a business to combat male dominance. Orhan and Scott (2001) support this idea as they suggest that women enter self-employment due to a combination of male domination and push factors. In cases like this, self-employment may be the last option for many women (Catley and Hamilton, 1998). The literature further revealed that, the number of women who choose entrepreneurship because of negative pushes from their former jobs is significant, and that push factors have played a larger role in women's decisions to start a business today than in previous generations (Lincoln, 2010). Women's desire to ensure the financial security of their families has been reported as one of the motivational factors for starting a business (Coleman, 2002). Fielden et al (2003) found that women with domestic responsibilities believed that business ownership appeared to be the only way they could make a sustainable living around other family commitments. While the mentioned studies have specifically addressed the issue of motives for women entrepreneurs in their traditional industries in relation to entry barriers, progress, functions, motivation, perceptions, sources and types of opportunities and ways to leverage resources, Kapp and Hunter (2008) argue that, less is known regarding WECI where their representation has been limited.There is a need to explore the motives within African context and Tanzania in particular. In this paper a model is developed that may be used to explore WECI motivations for starting and developing businesses in the TCI. The subsequent sections of the paper are research methodology, research findings and conclusion and implications of the findings. 2.0
RESEARCH METHODOLOGY
The case study research method was used in this research as it provided the possibility of gaining insights into the experiences of WECI (Yin, 1994; 2009). Five cases of WECI were conducted. The use of multiple cases
Proceedings: 9th Built Environment Conference
2-4 August 2015, Durban, South Africa
ISBN 978-0-620-67120-0
page 377
allowed the key themes from recurring concepts, relationships and explanations to be tested in several different situations. Information about WECI was obtained from the CRB data base to establish the number and profile of the targeted firms before embarking on the case study. Dar es Salaam was chosen firstly to serve as a standard because of the availability of many WECI, as 51 out of 142 WECI are in Dar es Salaam (CRB, 2013). Secondly, there are more opportunities for expansion of construction activities than in other towns. Thirdly, it was convenient and cost effective to do repeated interviews in Dar es Salaam. This is to say, it was possible for the researcher to follow projects developments through repeated social interactions with WECI, which in turn facilitated direct observation. The firms whose owners are women (major shareholders) were considered as a potential target for case studies. The criteria set were that the firms must be registered, be owned by a woman, make key decisions, have more than 31/2 years’ experience as per (GEM, 2012; ILO, 2003) suggestion, have undertaken more than 2 projects of not less than TAS 200 million in value and also have upgraded/grown from one class to another (i.e. from a lower to a higher class). Interested respondents were selected and interviewed. WECI who expressed their perceptions, experiences and opinions on the experiences of women entrepreneurs in the construction industry were purposively selected. The cases chosen appeared to qualify based on the initial interviews and the criteria set. The interviews were conducted first with WECI and then key informants in the same firm, such as project managers, engineers and other staff members involved in the business were interviewed. The interviews were extended to outside the firm’s key informants, including representatives of the CRB, and consultants, contractors and major clients who had worked with WECI. In addition, the use of multiple sources of evidence in case studies allowed the researcher to address a broad range of historical and behavioural issues exhibited by the WECI. Data was analyzed by organizing the data into categories on the basis of the themes and concepts, after which the relationship between the concepts was then analyzed and finally linked in a sequence (Creswell, 2009). In the process, raw data was categorized into conceptual categories to generate themes and concepts. Thus, data coding had two concurrent activities, namely mechanically reducing data into manageable chunks and analytically categorizing the data. The tools of analysis explained above were applied within the case and across the case analyses. Within-case analysis is when the analytical tools focus on the phenomenon in one case. Across-case analysis is when the analytical tools target comparisons of phenomenon between two or more cases. In within-case analysis detailed case studies are written up of the represented cases. Thematic case analysis followed and formed the basis for the analysis. Across-case analysis was undertaken as a means of extending external validity or transferability by looking at multiple actors in multiple settings. This was seen as further enabling generalizability (Denzin and Lincoln, 1994; Yin,
Proceedings: 9th Built Environment Conference
2-4 August 2015, Durban, South Africa
ISBN 978-0-620-67120-0
page 378
2009). The key themes, relationships and explanations were tested in several different cases. Each case was then seen as a replication of the questions under study. Multiple cases also assisted in the identification of themes, relationships and explanations that apply in some settings but not in others (Creswell, 2009). In searching for patterns, the results were compared with patterns predicted from theory or the literature. The themes from the interviews were used to form common patterns to answer the research question. 3.0 RESEARCH FINDINGS, DISCUSION AND ANALYSIS Cases Presentations This section provides a presentation of each of the five cases participants and the current status of their enterprises. The focal data are presented in a composite table for each case. The presentation are considered by the researcher to be fundamental themes. Across the cases analysis This section attempts therefore to put together a cross-case analysis of all five cases that were studied and presented. It highlights what seems to be working for further recommendations. The idea is to capture a better understanding of women’s experience in terms of motivations for the best practices of WECI in the construction industry. The section begins by matching common themes that emerged from each of the studied cases. These themes emanated from field data rather than the reviewed literature. Matching Common Motivation Factors for WECI The five case studies revealed some common significant factors that motivated WECI to engage in the construction industry. However, these factors varied from one WECI to another according to whether an individual encountered external or internal factors, as indicated in Table: 1 below Table1: Matching Common Motivation Factors for WECI Factors Cases Egra Besty Vaney Marly Sezy X Internal (pull X X X X factors) Need for freedom √ X X X X Passion for the sector √ X √ X √ Economic prosperity √ X √ √ √ Technical education √ √ √ X X and experience Opportunity pull X √ X X X Self-confidence X √ X X X The need to assist X X √ √ X others
Proceedings: 9th Built Environment Conference
2-4 August 2015, Durban, South Africa
ISBN 978-0-620-67120-0
page 379
Conducive investment & Law reforms The need to be her own boss Identity among known WECI External (push factors) Career frustration Economic necessity Lack of inspiration from co-workers Inspiration from friends Law reforms changed the situation Need for substitute work Supporting husband
X
X
√
X
X
X
X
√
X
X
X
X
X
√
X
√ √ √
X √ X
X X X
X X X
X X X
√
√
X
X
X
X
X
√
X
X
X
X
X
X
X
X
X
X
X
√
Note: From Table 1, √ means the factor applies to a case while X does not apply to a case. From the table the major common motivating factors are passion for the sector, economic prosperity, technical education and experience, opportunity pull, economic necessity and inspiration from friends. The differences are due to personal context for example those who have technical education and experience are more likely to have a needed level of socialization, business network, confidence and passion for the sector which are motivation factors to start and develop business in construction industry. Their differences emanate from level of education, growth level, work experience as well access, use and control over resources. Discussion of the Motivating Factors for Starting a Business From the five cases studies as indicated in Table 1, it was evident that, although women’s motives for starting up a new business varied, the bottom line was that every woman, regardless of her status, had the potential to become an effective entrepreneur. The driving force within individuals to become entrepreneurs could be better explained in terms of pull and push factors, whereby push factors represent elements of necessity such as insufficient family income, dissatisfaction with a salaried job, difficulty in finding work, the need for a flexible work schedule and inspiration from friends. Pull factors, as reflected in Table 1, related to passion for the sector, technical education, need for freedom, professionalism, identity, entrepreneurial drive and the desire to accumulate wealth (economic propensity).
Proceedings: 9th Built Environment Conference
2-4 August 2015, Durban, South Africa
ISBN 978-0-620-67120-0
page 380
It is important to note that, despite WECI differences in education level, growth level and work experience, all five cases studied shared common motivational factors for venturing into the construction industry. As revealed in this study, WECI were not necessarily moved to start a business merely out of necessity. As revealed in the case studies, women basically chose to start their business in the construction industry, motivated primarily by the pull factors. The main motivation factor for WECI was economic propensity. Thus they desired to receive equitable rewards for working hard while contributing to the economic development of their family units and the nation as a whole. This finding complements the need for achievement theory advocated by McClelland (1961) and the expectancy theory (Vroom, 1964) by suggesting that need for achievement is necessary for developing successful businesses. Similarly, it falls in line with other studies, which found out that motivation factors were what caused the starting up of new businesses (Rosa, 2013; Ericson and Luther-Rune, 2012). Technical knowledge and experience of what and where an individual want to invest or venture was an essential motivational factor (Jung, 2010; Aylward, 2009). This study’s findings indicated that most WECI started business ventures had prior technical knowledge and those with neither technical education nor experience relied mainly on learning by doing at construction sites during the construction process. Due to the importance of technical knowledge, registration requirements also stipulate that one of the company directors must have had a formal technical education (CRB, 2010). The case study findings, however, contradict other studies by (GEM, 2010; Pines and Schwartz, 2007; Wangle, 2009), which indicated that women entrepreneurs did not consider their prior education when they made their decision to start their new business ventures. Other motivating factors such as; passion for the sector, the need for autonomy and confidence were also found to be paramount factors for WECI starting a business. In the study, it was observed that WECI had passion and needed freedom to run a business in the construction industry. In so doing, women enjoyed having projects, handling and managing them to completion with great delight as WECI. Correspondingly, WECI with a favourable background in terms of technical education and experience owned and managed more than one firm in the construction industry as opposed to those with a less favourable background. WECI indicated in one way or another that, apart from the pull factors they had been greatly influenced by friends, family members and peer groups to venture into the construction industry. This finding supports the socio-learning theory (Bandura, 1977), which maintains that people will learn more by seeing/doing, through having a role model, such as looking at what others did, and from their environment. Similarly, the study’s finding were consistent with the study by Kennedy and Drennan (2001) and that of Aylward (2009), which indicated that influences and similar business experience had an impact on the motives of the entrepreneur.
Proceedings: 9th Built Environment Conference
2-4 August 2015, Durban, South Africa
ISBN 978-0-620-67120-0
page 381
Conversely, having felt anger and frustration at their organization without having a voice, WECI were motivated to try on their own ventures. This led most WECI to quit formal employment and start their own companies. Moreover, the death of husbands meant that women had to care for children single-handedly. It was apparent that WECI had to sustain the business they had already established in the construction industry in order to meet basic needs. The researcher is of the view that most WECI possessed characteristics such as persistence, determination, innovativeness and growth seeking which helped them succeed. Studies by Watkins (1982) and Aylward (2009) indicate that persistence, determination, risk-taking and innovativeness qualities needed for successful entrepreneurship, in most cases are lacking in the female population. Affirming the same, Coleman (2002) points out that when women display such characteristics as aggressiveness, persistence and determination, which are fundamental for any successful business, they become unattractive and so compromise their femininity. In contrast, the findings indicate that women who successfully start and developed their construction business mostly associated themselves with masculine traits, irrespective of whether or not, by doing so, they compromised their femininity. For most WECI, the outcome in terms of success of the business and being respected by the community was their main concern. This study’s findings indicate that women who displayed masculine traits had greater intentions to start and grow successful businesses in male-dominated industries than those who associated themselves with feminine traits (Gupta et al., 2005). These factors are summarized in matrix form below (Figure: 1). Figure 1: Motivational factors for WECI to start and develop ventures in the construction industry in Tanzania Figure 1: Motivational factors for WECI to start and develop ventures in Factors for Starting a business (Entrepreneurship)
Pull factors
Freedom Passion Opportuni ty pull Economic propensity Technical education
Proceedings: 9th Built Environment Conference
Push factors
2-4 August 2015, Durban, South Africa
Necessity Inspiratio n Career frustration Death of husband Substitute work
ISBN 978-0-620-67120-0
page 382
the construction industry in Tanzania Analysis of the Motivational Factors for Women to Start and Develop Business Ventures The above discussion dwells on matching the identical factors found in the cases in order to develop a better understanding of the motives of women to start and develop businesses in the construction industry in Tanzania. The case study findings have revealed that both push and pull factors were motivators for WECI to venture on their own. Apart from the fact that WECI were motivated by a combination of both factors, pull factors constituted the primary motives as opposed to the existing literature. The literature review indicated that most studies suggest that women were being forced into entrepreneurship as they lacked other sources of income or other incomeearning options (Pines and Schwartz, 2008; Nchimbi, 2003; Rutashobya, 2000; Nchimbi and Chijoriga, 2009). Consequently, the few WECI who moved out of necessity (push factors) still had the desire to be independent, needed freedom and had a passion for construction work, which are pull factors. The researcher is therefore of the opinion that when a pull factor is combined with a push factor it becomes a strong motivation factor for WECI to start and develop a business. From the table and discussion above, the results show that women-related aspects as regards motives for starting a business are push factors. The women-related motivational factors were economic necessity, career frustration, lack of inspiration from co-workers and identity. In all cases, the support of the husband had a great influence on WECI starting and developing businesses even though both pull and push factors were present. The stronger the level of motivation of WECI, the more likely they were to succeed in developing their business ventures. Table 2 below presents the summary of research findings versus research objective and emergent factors in the Tanzanian construction industry. Table 2: Summary of Research Findings versus Research Objective and Issues (motivational factors) which are consistent with literature and the emerging factors
Proceedings: 9th Built Environment Conference
2-4 August 2015, Durban, South Africa
ISBN 978-0-620-67120-0
page 383
Encountered Motivational Factors (Pull factors) Self-confidence (Hakala, 2008; Aylward, 2009) Economic prosperity, Technical education and work experience (Lincoln, 2010; Ayward, 2009) Need for freedom (Butter and Moore, 1964) Identity and purpose Passion for the sector (Rosa, 2013; Hasson, 2009) Opportunity pull (Verwey, 2005; Fakhri et al., 2012) Conducive investment and Law reforms
Encountered Motivational Factors (Push factors) To be among few women in the industry Inspiration from friends Economic necessity, Career frustration (Verwey, 2005; Kapp and Hunter, 2008) Lack of inspiration from co-workers Death of husband Support of husband Substitute work
4.0 CONCLUSION AND IMPLICATION OF THE FINDINGS The findings indicate that education increases motivation and the confidence to start and develop a business in the construction industry in Tanzania. This demonstrates that women entrepreneurs are not homogeneous, but differ in terms of personal context, such as their roles, rights and access to, use and control over resources. Thus, women with technical education and past working experience in the sector had accumulated industrial experience which helped them to start a business. Those who did not have technical education and industrial experience were unsure if the industry was the right choice for them. They did not have a good understanding of the industry and therefore pointed out the need for it. The findings from this research contradict the existing literature that asserts that women do not consider their technical education prior to starting a business in NTIs (Aylward, 2009; Jung, 2010). The findings from this research conclude that technical education and industrial experience were viewed as key motivating factors for WECI prior to starting a business. The government needs to reform the education system and use it to promote women entrepreneurship more than it is currently doing. Efforts should be made to foster greater awareness of the benefits of entrepreneurship among women to build a strong economy and, to acknowledge and promote the positive impact of WECI involvement in improving the living conditions of their families and the nation as a whole. The education system needs also to make it flexible to accommodate females in technical education to allow more WECI to emerge. The government needs to take a lead in promoting an entrepreneurial, risk-
Proceedings: 9th Built Environment Conference
2-4 August 2015, Durban, South Africa
ISBN 978-0-620-67120-0
page 384
taking spirit as well as providing support structures for these emerging women entrepreneurs. Consequently, successful female role models should be at the forefront to encourage others to consider becoming entrepreneurs and, to build self-confidence. This could be effectively achieved through setting up seminars and conferences where entrepreneurial topics could be articulated. 5.0 REFERENCES Arlward, E. (2009). "Traditional and Non-Traditional Female Entrepreneurs: An Exploration into what Influences their Selection of Industry Sector." Master's degree in Business Studies, Waterford Institute of Technology. Buttner, H. E. (1993). "Female entrepreneurs: how far have they come?" Business Horizons, vol. 36, no. 2: pp. 59-66. Chetty, S. (1996). "The Case Study Method for research in small and Medium Sized firms." International Small Business Journal, Vol. 15 (1) pp 173 – 185. Contractors Registration Board (CRB). (2013). What is the way forward? Building capacity to local contractors. Tanzania. Creswell, J. W. (2009). Research Design: Qualitative, Quantitative, and Mixed Methods Approaches. London., SAGE Publications, Inc;. Cromie, S. (1987a). "Motivations of aspiring male and female entrepreneurs." Journal of Occupational Behaviour, 8 (3) pp 251-261. Cromie, S. (1987b). "Similarities and Differences between Women and Men Who Choose Business Proprietorship." International Small Business Journal, vol. 5, (3) pp. 43-60. Denzin, N. K., and Lincoln, Y. S. (1994). Handbook of Qualitative Research. London, Sage Publishers Fakhri, K. P., Ghanimat, P., Koopahi, M. and Behnie, S. (2012). "The study of the Effects of Personality and Psychological Traits Approach on the Rate of Entrepreneurship." Journal of Basic and Applied Scientific Research, 2(4): 4159 4166. Fischer, E., Reuber, R., and Dyke L. (1993). "A Theoretical Overview and Extension of Research on Sex, Gender and Entrepreneurship. ." Journal of Business Venturing, vol. 8, (2) pp. 151-168. Global Entrepreneurship Monitor (GEM, 2012). Global Entrepreneurship Report Goffee, R., and Scase, R. (1983). "Business ownership and women's subordination: a preliminary study of female proprietors." Sociological Review, vol. 31, (4) pp. 625-648. Hakala, T. (2008). Barriers to women in the non-traditional industries. Published, USA. Hanson, S. (2009). Gender and entrepreneurial networks. Regional Studies, 43, 135–149.
Proceedings: 9th Built Environment Conference
2-4 August 2015, Durban, South Africa
ISBN 978-0-620-67120-0
page 385
Hisrich, R. and Peter, M. P (2002). Entrepreneurship London: The McGrawHill Companies. Hunter, S. A. and Kapp, J. M. (2008). Women Entrepreneurs Across Racial Lines: Issues of Human Capital, Financial Capital and Network Structures. Edward Elgar Publishing, Cheltenham, UK and Lyme, US. ILO. (2007). Entrepreneurship in Economic Development, ILO. Lincolin, W. P. (2010). Impact of Gender on Economic Development. Paper presented at the Women’s development Conference, Addis Ababa, Ethiopia, 23rd – 25th of March, 2010. McClelland, D. (1961). The Achieving Society. The Free Press, New York. Moore, D. P., and Buttner, E.H. (1997.). "Women Entrepreneurs: Moving Beyond the Glass Ceiling" Sage Publications, United States of America MoW. (2003). Construction Industry Policy development. Dar es Salaam. Tanzania, Government Printer, 2003 Nchimbi, M. and Chijoriga M. (2009). African Entrepreneurship. Business management journal, 2, 237-256. Nchimbi, M. I. (2003). Gender and entrepreneurship in Tanzania: A comparative Analysis of male-female’s start-up motivation, individual characteristics and perceptions of business success. Orhan, M. and Scott, D. (2001). Why women enter into entrepreneurship: an explanatory model. Women in management Review 16(5) pg 232. Pines, A. and Schwartz., D. (2007.). "Why women enter into entrepreneurship: an explanatory model." Women in management Review, vol 16, (No.5) pp 232. Rosa, P. (2013.). The Rationale for Developing Modern Entrepreneurship and Management Skills for Starting and Growing Entrepreneurs. The Concept of the Entrepreneurial Career Lader. Rutashobya, L. K. (2000). Female Entrepreneurship in Tanzania and Strategic considerations. Business Management Review, Vol. 7(No. 1). Rwelamila, P. D. (2009). Built Environment Research in SADC in a Suffocating Status?The Dilema of Implimenting Research Findings. Paper presented at the 4th Built Environment Conference, Livingstone, Zambia. UDEC-ILO. (2002). "Jobs, Gender and Small Enterprises in Africa: Women Entrepreneurs in Tanzania. A Preliminary Report ." (: ILO, IFP/SEEDWEDGE, October, 2002.). Verwey, I. (2005) A comparative analysis of women entrepreneurs in construction-measure of success, A case of USA and SA. Verheul, I., and Thurik, R. (2001). "Start-Up Capital: Does Gender Matter? ." Small Business Economics, vol. 16 (4) pp. 329-345. Weeks, J. (2001). Women’s Entrepreneurship in Latin America: An Exploration of Current Knowledge”. Washington, DC, The Inter-American Development Bank. Wickam, P. A. (2001). Strategic Entrepreneurship. A Decision making Approach to New Venture Creation and Management. . London., Pearson Education Limited
Proceedings: 9th Built Environment Conference
2-4 August 2015, Durban, South Africa
ISBN 978-0-620-67120-0
page 386
Yin, K. R. (1994). Case Study research design and methods, Sage Publications. Yin, K. R. (2009). Case Study Research: Design and Methods 4th edition, (Applied social research methods v.5)Thousand Oaks, CA:, Sage Publications, Inc.
Proceedings: 9th Built Environment Conference
2-4 August 2015, Durban, South Africa
ISBN 978-0-620-67120-0
page 387
ASOCSA2015-074
Accident Cost Estimating: The Relationship between Direct and Indirect Costs Theo C Haupt1, Robin Pillay2 and Elke Hefer3 School of Engineering, Property Development Department, University of KwaZulu-Natal, Howard College, Durban 4041, South Africa. (Tel.: +27 312602712. Cell.: +27 826863457)–
[email protected] 2 ESKOM Holdings and 3Durban University of Technology ABSTRACT AND KEYWORDS Purpose: This study investigates the relationship between the direct and indirect costs of accidents to establish whether they can be used to estimate the total cost of construction accidents. Design/methodology/approach: A case study approach was used where the cost data was extracted from the accident reports of a selection of 100 construction accidents in an organization with a major annual construction spend. Research limitations: There were considerably more accident reports given the historic poor construction health and safety (H&S) performance track record of the organization. However, these were not readily available for examination. Only certain cost categories were used to calculate the total costs based on what was available for extrapolation. Findings: In all categories of accidents the indirect costs always exceeded the direct costs but by varying degrees. Using known or estimated direct costs in the cost equations it is possible to calculate the total accident costs. Response to conference theme: The outcomes of the study highlight the importance of preventing construction accidents on all types of construction projects given the magnitude of their overall costs and impact on the cost of construction. Practical implications: The various cost estimation equations can be used to estimate the total cost of various categories of accidents especially when the
Proceedings: 9th Built Environment Conference
2-4 August 2015, Durban, South Africa
ISBN 978-0-620-67120-0
page 388
direct costs are known. These estimates can be used to direct resources and remedial actions to improve overall construction health and safety performance. Keywords: Direct costs, indirect costs, accidents. Conference sub-theme: Inappropriate construction practices and ethics 1. INTRODUCTION While the construction industry contributes significantly to national economic growth and offers substantial opportunities for job creation, the industry has historically and continually been plagued by workplace accidents. Moreover, these accidents represent a considerable economic and social burden to employers, employees and to society as a whole. Given the high rate of construction accidents experienced, employers are not entirely aware of the actual costs of these accidents, especially when considering the hidden or indirect costs of accidents. According to the Health and Safety Executive in the United Kingdom (2005) many organisations were largely concerned about the potential costs of major incidents, but less concerned about the actual costs incurred as a result of minor events, which occurred more frequently. Most respondents reported that they did not know what the cost effect of accidents or work-related illnesses was on their business. Evidently, not many attempts had been made to estimate the cost of health and safety failures. The most commonly cited barriers to conducting accident/work-related ill health cost assessments were limited time and resources, perceived complexity and lack of expertise. Further, the avoidance or reduction of accident and work-related ill health costs per se were not primary motivating influences for effective health and safety management. A combination of other interlinked factors emerged as being more influential in driving the health and safety agenda in most organisations such as, for example:
avoidance or reduction of liability claims; potential legal exposure; concern over the cost of insurance premiums; external pressures from insurance companies; maintenance of corporate image and reputation; customer and client expectations; government targets; moral obligations; staff morale; absence, recruitment and retention; and impact on productivity, efficiency and quality of service delivery.
Proceedings: 9th Built Environment Conference
2-4 August 2015, Durban, South Africa
ISBN 978-0-620-67120-0
page 389
However, it was generally acknowledged that health and safety failures might ultimately impact on the financial performance of an organisation through any of these higher level factors.
2. COSTS OF ACCIDENTS Several researchers have suggested that the true costs of construction accidents can be computed in a variety of ways. Everett and Frank (1996) suggested three types of costs that were relevant to owners in terms of evaluating the costs of jobsite accidents, injuries and fatalities, namely:
direct costs of injuries and fatalities that included workers’ compensation, public liability and property insurances; indirect costs of injuries and fatalities that included loss of productivity, disruption of schedules, administrative time for investigations and reports, training of replacement personnel, wages paid to the injured workers and others for time not worked, clean up and repair, adverse publicity, thirdparty liability claims, and equipment damage; and costs of H&S programs that include salaries for H&S, medical and clinical personnel, H&S meetings, inspections of tools and equipment, orientation or induction sessions, site inspections, personal protective equipment, health programs, and miscellaneous supplies and equipment.
Waehrer, et al., (2007) suggested that the costs of occupational injuries and illnesses could be divided into three broad categories used in other areas, namely:
direct costs that include the costs of hospitalization, physician, and allied health services, rehabilitation, nursing home care, home health care, medical equipment, burial costs in case of fatalities, insurance administrative costs for medical claims, payments for mental health treatment, police, fire, emergency transport, coroner services and property damage; indirect costs that refer to victim productivity losses that include wage losses and household production losses, and administrative costs that include the cost of administering workers’ compensation wage replacement programs and sick leave; and quality of life costs that refer to value attributed to the pain and suffering that victims and their families experience as a result of the injury, fatality or illness. Loss of quality of life costs were six times greater than the workplace disruption costs.
Proceedings: 9th Built Environment Conference
2-4 August 2015, Durban, South Africa
ISBN 978-0-620-67120-0
page 390
Rikhardsson, Impgaard, Mogenson and Melchiorsen (2002) developed the systemic accident cost analysis (SACA) methodology. In the SACA approach the following four cost categories were used, namely time, materials and components acquired or lost, external services bought, and other costs such as fines and rehabilitation. However, the most typical means used in the construction industry has been to express the costs by way of direct and indirect costs (Tang, Ying, Chan and Chan, 2004; Gosselin, 2004; LaBelle, 2000; Corcoran, 2002). As long ago as 1956, Simonds and Grimaldi proposed that the relationship between direct and indirect costs as well as that between insured and uninsured costs should be used.
3. COST COMPUTATION Many cost calculating models and calculators have been developed. These models and cost calculators principally utilise fixed costs determined by means of case studies and illustrate mean indicative cost values based on rigorous approximated calculations. For example, Jallon, Imbeau and de Marcellis-Warin (2011) developed an indirect-cost calculation model given that indirect costs far exceeded direct costs of accidents. Tang, Yong, Chan and Chan (2004) attempted to calculate social costs of construction accidents while evaluating the impact of social H&S investments. Rikhardsson and Impgaard (2004) used the systematic accident cost analysis (SACA) approach to evaluate the corporate cost of accidents. Everett and Frank (1996) used direct, indirect and cost of H&S programs in their study. Waehrer, et al., (2007) used direct costs, indirect costs and quality of life costs in their analysis of the cost of occupational injuries in construction. When quantifying the costs in relation to construction accidents, many aspects need to be taken into consideration. These include, for example, the type of accident, the extent of the injuries suffered and the length of time the unfortunate victim suffered physically and emotionally. All of these have significant impacts on the cost computations. Financial loss could be due to, inter alia, the treatment cost to injuries; cost of rehabilitation; lost income from days off work; pain and suffering; emotional distress; and physical losses. The average costs of accidents are typically determined through various costing studies for different types of accidents to produce a representative cost for each accident type. The following costs are typically focused on, namely:
Proceedings: 9th Built Environment Conference
2-4 August 2015, Durban, South Africa
ISBN 978-0-620-67120-0
page 391
Time lost Investigation Cost Details Replacement Cost Details Productivity Cost Details
4. DIRECT COSTS The direct costs of accidents are those costs incurred due to the treatment of an injury that are normally reimbursed by workers’ compensation insurance – sometimes referred to as insured costs. These may include medical costs, premiums for workers, compensation insurance, liability and property losses (Kapp et al., 2003). According to Griffin (2006) direct costs were those costs that were directly associated and payable by the employer or the insurance carrier on the employer's behalf. These costs were typically fairly easy to establish and quantify.
5. INDIRECT COSTS Construction accidents were more expensive than most people realised because of the associated indirect costs also described as the hidden or uninsured costs of accidents. Unless organizations systematically and accurately evaluate the true costs of accidents that occur, they most likely do not know how costly these accidents actually are. According to Griffin (2006), indirect costs of accidents consist of uninsured losses from damage to buildings, equipment, tools and products and materials; interruption of business operations; lost productivity required overtime to make up for delays caused; inefficiency of backup employees; cost of training new employees; increased insurance premiums; and damage to a company's reputation. Indirect costs are usually non-recoverable. For example, if the direct costs of an accident total R10,000 and indirect costs are five times greater, the total cost would be in the region of R60,000. Consequently, a contractor would need to generate an additional R60,000 in profit to offset the loss. Further, indirect costs are generally those costs attributed to the loss of productivity of the injured worker and the crew, transportation costs to the nearest medical treatment facilities and time expended to complete various forms related to the injury (Hinze & Appelgate, 1991). The indirect costs also included all other costs resulting from the injury that were not recovered through various insurance coverages. Most indirect costs could be categorized as being related to the cost of lost productivity, damaged materials and/or equipment, and added administrative effort. Most known studies confirm that the indirect costs of accidents are greater than the direct costs of accidents. Head and Harcourt (1998) conducted a study to estimate the Direct and Indirect Costs of Workplace
Proceedings: 9th Built Environment Conference
2-4 August 2015, Durban, South Africa
ISBN 978-0-620-67120-0
page 392
Accidents in New Zealand for 1995 and subsequently concluded that the ratio of indirect to direct costs was 1:2.9. This ratio is peculiar, given the substantially lower figure than those of all the other studies reviewed. This disparity can be attributed to the fact that the direct costs of occupational accidents in New Zealand contain what are indirect costs in various other countries. They, however, acknowledge that the indirect costs could have been more because several costs were omitted due to unreliable data and conservative estimations. Some costs, like lost workdays or lost income, are clearly visible and can readily be expressed in monetary terms. However, other costs such as, for example, administrative activities after an accident may be forgotten, the negative impact on the company’s image may be hard to quantify and placing a value on human suffering and health damage may be subject to debate. However, it is possible to get an adequate insight into the costs of accidents and the potential benefits of accident prevention (European Agency for Safety and Health at Work, 2003). Indirect costs can be associated with or consequential and due to a wide array of complexities and indefinite dynamics relative to a construction accident may not necessarily take the form of direct monetary outlays. Insurance premiums, wages, and direct payment to medical practitioners are examples of direct costs within an organisation. Arguably, indirect costs are just as tangible, but they must be quantified from close observation and comprehensive calculation. If an apparatus has a shorter lifespan because it was involved in an industrial accident, the accident is an economic cost. It may be one that goes unnoticed unless someone measures and allocates amounts for the damage. A list of possible indirect costs at the company level can be far-reaching and extensive, given the knock-on effect an accident could have. There are numerous hidden costs associated with construction accidents. Many of these costs are difficult and occasionally impossible to quantify (Jallon, Imbeau and de Marcellis-Warin, 2011). A basic list of potential indirect costs as a consequence of construction accidents includes, inter alia, the following, namely: inevitable interruption in production immediately after the accident; Lower morale effects on co-workers; Staff allocated to investigating and writing up the accident report; Recruitment and training costs for replacement workers; Damage to equipment and materials if not identified and allocated through routine accounting procedures; Loss in product quality after the accident; Reduced productivity due to injured workers being on light duty; Damage to products; Damage to plant and equipment; Costs of possible litigation; Delays in production; Transportation of injured person; Decreased efficiency of workers; Need for overtime working and use of temporary staff; Investigation costs; Administrative and clerical efforts; and Potential loss of expertise and experience. Being unable to identify and consider these indirect costs could have a profound impact on an organisation. Estimates of indirect costs as a proportion of direct costs have ranged from ratios that are 1:1 to more than
Proceedings: 9th Built Environment Conference
2-4 August 2015, Durban, South Africa
ISBN 978-0-620-67120-0
page 393
20:1, depending on the specific industry and methodology utilised by the researcher. If a company fails to tally the full cost it pays for poor health and safety conditions, the true costs will not be immediately realised and perhaps concealed. Without realizing it, organisations may be undermining their economic position and continued existence. Given that indirect costs of accidents always exceed the direct costs, it makes business sense to give greater attention to the indirect costs of worker injuries. Even where indirect and direct costs are similar, indirect costs balloon exponentially when liability litigation is instituted for a worker's injury. The following example illustrates how much an injury could potentially affect the output or bottom-line of a company trying to achieve a three percent profit margin. If a company sustained a R50,000 loss due to injury, illness or damage and still tries to make a three percent profit, the company theoretically must increase sales of services by an additional R1,667,000 (adapted from eLCOSH, 2001).
6. RELATIONSHIP BETWEEN DIRECT AND INDIRECT COSTS Many researchers, when studying the concepts of direct and indirect cost, express a ratio of indirect costs to direct costs. Heinrich (1979) estimated the ratio of the indirect costs of injuries to the direct costs to be approximately 4:1 using data gathered from various industrial facilities in the United States. The problem with this ratio was that it did not take into account the steep escalation of the direct costs of health care. However, this ratio has been used for many years because of its simplicity. A study by Sheriff (1980), found the ratio of indirect and direct costs to be as high as 10:1. Bird and Loftus (1976) in their seminal work found the ratio to be even higher at 50:1. Irrespective of the variations in the ratios, in all cases the indirect costs were significant when examining the costs associated with an injury, and typically exceeded the direct costs substantially. In South Africa more than 7.3 million working days were lost during 2000 and 2001 as a result of workers taking time off because of these injuries.
7. RESEARCH APPROACH According to Welman and Kruger (2001), the design of any research study is concerned with the plan to assemble suitable data for investigating and testing the research hypotheses. Further, the methods used to gather information depend on the type of data and the problem to be researched (Leedy, 1993; Leedy and Ormrod, 2001).
Proceedings: 9th Built Environment Conference
2-4 August 2015, Durban, South Africa
ISBN 978-0-620-67120-0
page 394
7.1. CASE STUDY METHOD The case study method of research is one used when a contemporary phenomenon such as accident causation is examined against very specific research questions attempting to identify a correlation between the phenomenon and the context or real-life situation in which it has occurred. To advance knowledge and understanding of a phenomenon, case studies should be placed in an appropriate literature review (Yin, 2003). Case studies are further useful as empirical research into specific scenarios where the boundaries between the phenomenon and the context are not clearly evident. According to (Shuttleworth, 2008) the case study method is used to examine a broad scope of research within a single topic available for research. In Schramm’s (1971, cited in Yin 1989: 22–23) words, “The essence of a case study is that it tries to illuminate a decision or set of decisions with reference to why they were taken, how they were implemented and with what result”. Cases could include individuals, organizations, processes, programs and events (Yin, 2009). This particular study is a combination of explanatory and collective case study approaches, whereby a course of events is examined from multiple cases to estimate the cost of accidents. The preferred form of data collection is left to the researcher to decide (Yin, 2003). When a researcher is considering “how” or “why” questions, a contemporary set of events using primary and secondary documents, over which the researcher has little or no control, the case study approach is feasible (Yin, 2009). A statistical determination of the validity and reliability of the approach or strategy was not conducted. The authors consulted a statistician, who advised that for a study of this type a sample size of 100 cases would contribute to the validity of the study. A comprehensive review of construction related accidents was done using the accident database of one of the divisions within a large energy utility in Southern Africa, where major capital expansion was being undertaken of approximately R150 billion (about $15 billion) over the next 5 years. 1 The period of review was 1 April 2006 to 31 March 2008 , where 872 accidents namely fatalities, first aid, medical and lost time incidents 2 (LTIs) were reported and recorded. A random sample was then drawn using systematic random sampling, where an accident was randomly chosen and then every 8th accident was selected in order to obtain 100 accidents for selection and analysis for this study.
Table 1. Distribution of Types of Accidents including Fatalities 1
The period 1 April 2006 to 31 March 2008 was selected because these records were readily available to the researcher given the confidentiality restrictions of the organization involved in the study 2 A work-related injury that arises out of and in the course of employment and renders the injured worker unable to perform normal duties
Proceedings: 9th Built Environment Conference
2-4 August 2015, Durban, South Africa
ISBN 978-0-620-67120-0
page 395
Nature of Accident Burn Cut/Caught Electrical Exertion/Ergonomics Fall Falling Object Struck Total
Fatalities 0 0 6 0 6 0 2 14
% 0% 0% 43% 0% 43% 0% 14% 100%
Accidents 2 17 18 3 35 2 23 100
% 2% 17% 18% 3% 35% 2% 23% 100%
7.2. ACCIDENT REPORTING PROCEDURE All incidents are in the first instance reported to the Corporate Health and Safety department. All Incident information received via the initial notification report are confirmed and captured onto the data management system, namely Systems Applications and Products – Environment, Health and Safety (SAP EHS). The organization uses this management software as the electronic data management system to support the management of occupational health and safety and industrial hygiene processes. A SAP EHS system generated flash report is sent immediately or within 24 hours after the incident as internal incident notification to internal stakeholders of the organization such as, for example, the relevant managers within the defined structure of the operating/business unit and other relevant individuals within the Service and Strategic functions. Typically a preliminary investigation takes place and depending on the incident the Corporate Health and Safety department decides whether a corporate legal investigation should take place or not. A representative from the Corporate Health and Safety department attends significant portions of the fatal and LTI incident investigations. Initial reports are brief and limited to an outline of the known facts which include the following information, namely: date and time of accident; entry type; plant; work area; accident location; short description of accident; severity of injuries; likelihood of occurrence; immediate causes; and involved persons, etc. The incident report that is produced following the corporate legal investigation is highly confidential and is archived by the corporate legal department of the organization. In most cases selected SHE personnel have access to the SAP EHS system and are responsible to add and update information related to the incident on the SAP EHS system. The Corporate Health and Safety department conducts verification of the data regularly. In the event of any incident involving an employee, contractor or member of the public, the responsible manager must ensure that all legal aspects and the requirements are carried out, such as, for example, reporting, notification, and investigation.
Proceedings: 9th Built Environment Conference
2-4 August 2015, Durban, South Africa
ISBN 978-0-620-67120-0
page 396
For the purposes of this study, analysis of the costs were essentially based on the incident investigations participated in by one of the authors as well as the investigation reports received for the others from the database. The focus was on LTI, fatalities and disregarded near-misses, first-aid, and medical accidents. Consequences of these accidents ranged from fatalities to severe lost time injuries and major medical treatment.
8. FINDINGS Because of their highly confidential nature, the findings have been aggregated and presented in summary form. The full description of the accident as recorded in the actual corporate accident investigation report was not reproduced but examined in detail and used to calculate the costs associated with each of the accidents. Data for the following direct costs were extracted from accident reports, namely Medical (ambulance, doctor, medication, hospital); and Wages for injured person/s (Refer to Appendix A). In the case of a fatality, unless otherwise stated, a standard value of medical expenses for the deceased worker was used, namely R500,000 because no accurately recorded costs were available for further examination. The following indirect costs were analyzed, namely: Overtime costs; Time lost by injured employee and co-workers; Injured employee’s productivity loss costs; Supervision & Management lost time; Incident investigation costs; Training of replacement employee; Additional medical costs; Damage to equipment, plant, tools, or other property; Idle plant and equipment; and Other (including Consumables, Legal and Funeral Costs) (Refer to Appendix B). 8.1. CALCULATION OF EACH COST CATEGORY The value of each cost category was arrived at for each accident in the sample as follows, namely:
Overtime costs were derived from the records of the Human Resources department and the payroll records using the actual scales of income for each worker involved for the number of days actually lost, excluding light duty upon return of the injured worker/s. The costs of time lost by injured employee and co-workers were extracted directly from the respective accident investigation reports from which the list of names of workers who were off work was drawn. The costs were obtained from the records of the Human Resources department and the payroll records of each workers. Fatality costs were pre-determined at R1.1m.
Proceedings: 9th Built Environment Conference
2-4 August 2015, Durban, South Africa
ISBN 978-0-620-67120-0
page 397
The costs of Supervision & Management lost time were calculated by using the M14 to M16 salary grading scales of managers and attendance records. Additional medical costs were established from medical records kept by the organization in-house COID office. This office also provided prescribed costs for various medical treatments. Where external ambulance services were used these were charged out at R800. The costs involved with incident/accident investigation were derived from the organizational investigation process by someone from the Corporate Health and Safety department office. An investigation panel is constituted that includes both internal and external members. In the case of the latter these were typically attorneys. The costs of the internal members were calculated based on the time they spent on the investigation, together with all related costs such as travel, accommodation and subsistence. The costs of external members were extracted from the accounts submitted by attorneys. Costs of training of replacement employees, where required, were derived from the records of either temporary employment services or technical related labour brokers. Typically the same rates as employees of the organization were used. Where contractors were utilized their rates were used. The costs associated with damage to equipment, plant, tools, or other property were derived for hire fees or replacement costs, depending on type of equipment and plant, since these costs are captured by each site. The costs associated with idle plant and equipment are similarly derived. Other (including Consumables, Legal and Funeral Costs) are derived from actual records kept in the organization offices or sites themselves (Refer to Appendix B).
From Table 2 it appears that the accidents involving the highest average costs were electrical (R670,567), falls (R448,609) and struck by (R187,930). In almost all cases the average indirect costs were more than twice the direct costs except for accidents involving falling objects. Electrical accidents (R212,733; R457,833) and accidents involving falls (R132,999; R315,610) incurred both the highest direct and indirect costs per accident and therefore the highest total average cost per accident. The direct costs of accidents involving falling objects (47.81%) and exertion/ergonomics (34.62%) and the indirect costs of accidents involving falls (70.35%), struck by (70.22%) and burns (70.02%) had the highest proportion of the total costs of the respective accident types. Therefore, for this organization the total costs of the various types of accidents in Table 2 may be represented as: ≅ . ≅ . exertion/ergonomics accidents: = total cost of exertion/ergonomics accidents where = direct costs burn accidents: ≅ . ≅ . = total cost of exertion/ergonomics accidents where
Proceedings: 9th Built Environment Conference
2-4 August 2015, Durban, South Africa
ISBN 978-0-620-67120-0
page 398
= direct costs accidents involving falling objects: ≅ . ≅ . where = total cost of accidents involving falling objects = direct costs cut/caught accidents: ≅ . ≅ . = total cost of cut/caught accidents where = direct costs ≅ . ≅ . struck by accidents: = total cost of struck by accidents where = direct costs ≅ . ≅ . electrical accidents: = total cost of electrical accidents where = direct cost ≅ . ≅ . accidents involving falls: where = total cost of accidents involving falls = direct cost Table 2. Nature of Incident Exertion/ Ergonomi cs Burn Falling Object Cut/Caug ht
Average Costs by Nature of Accident
Qty
% Direct Cost
Average Direct Cost (R’s)
3 2
34.62 29.98
11,033
2
47.81
39,300 9,612
17
33.33
20,550
% Indirect
23
29.78
Electrical Fall
18 35
31.72 29.65
Avg Total Cost (R’s)
65.38 70.02
20,833
31,867
48,000
68,550
52.19
42,900 19,224
82,200 28,835
131,974
187,930
457,833
670,567
315,610
448,609
66.67 55,957
Struck
Average Indirect Cost (R’s)
70.22 212,733 132,998
68.22 70.35
Therefore, from Table 3 for this organization the total costs of non-fatal ≅ . ≅ . accidents may be represented as: where = total cost of non-fatal accidents = direct costs and the total costs of all accidents may be represented as ≅ . ≅ . = total cost of all accidents where = direct costs
Proceedings: 9th Built Environment Conference
2-4 August 2015, Durban, South Africa
ISBN 978-0-620-67120-0
page 399
Table 3. Comparison of Costs Including Fatalities and Excluding Fatalities (%) Item Direct Costs Indirect Costs Incl. NonFatal Incl. NonFatalities Fatal Fatalities Fatal Medical 6.96 27.02 0.08 Wages 93.04 72.98 99.92 Overtime 6.40 33.20 Time lost by injured 1.40 3.70 & co-workers Supervision & 2.60 3.20 Management lost time Incident 10.30 18.20 investigation costs Training of 0.40 1.50 replacement worker Damage to 2.30 6.60 equipment, plant, tools, or other property Item Direct Costs Indirect Costs Incl. NonFatal Incl. NonFatalities Fatal Fatalities Fatal Idle plant and 1.30 4.10 equipment Other 77.90 32.70
Fatal
1.30 0.90 1.00 8.80 0.10 1.50
Fatal 0.70 86.70
8.2. ANALYSIS OF FATAL ACCIDENTS Table 4. Direct costs vs. Indirect Costs Comparison (%) Including Non-Fatal Fatalities Fatalities Direct Costs 30.59 38.92 28.70 Indirect Costs 69.41 61.08 71.30 Ratio of direct to 1:2.27 1:1.57 1:2.48 indirect costs Table 4 shows that indirect costs made up 61.08% of the total costs of nonfatal accidents. Therefore, for this organization the total costs of fatal ≅ . ≅ . accidents may be represented as where = total cost of fatal accidents = direct costs 9. CONCLUSION It is evident from the analysis of the accident cost data extrapolated from the 100 accident records examined that in all categories of accidents, the indirect
Proceedings: 9th Built Environment Conference
2-4 August 2015, Durban, South Africa
ISBN 978-0-620-67120-0
page 400
costs exceeded the direct costs to varying degrees. The study has shown that it is possible to calculate the costs of accidents by using the relationship between direct and indirect costs. By inputting the direct costs, which are typically fairly easy to establish and quantify, it is possible by using the derived multipliers to calculate the indirect costs and therefore an estimate of the total expected costs of various categories of accidents. Armed with this knowledge construction companies can based on their H&S performance track record implement appropriate preventative interventions and allocate the necessary resources to reduce the types of accidents that have historically occurred on their construction sites. As a result not only will their overall H&S performance improve but the bottomline will also improve as the costs of construction are reduced. 10. REFERENCES Bird, F. and Loftus, R. 1976. Loss Control Management. Loganville, Gainsville: Institute Press. Corcoran, D. The Value of estimating the hidden costs of accidents, Occupational Health and Safety, 71 (9), 26–30 Electronic Library of Construction Occupational Safety and Health (eLCOSH) ( 2001). Improving safety can save you money. Occupational Health and safety,1. http://www.elcosh.org/en/index.php?module=Search&filters%5B%5D=14] [accessed 05.2013]. European Agency for Safety and Health at Work. 2003. Fact Sheet 36 − Accident prevention in the construction sector. http://www.ethicalcorp.com/content.asp?ContentID=2984 [accessed 03.2010]. Everett, J.G. and Frank, P.B. 1996. Costs of accidents and injuries to the construction industry, Journal of Construction Engineering and Management, 122 (2), 158-164 Gosselin, M. 2004. Analyse des avantages et des coûts de la santé et de la sécurité au travail en entreprise: Développement de l'outil d'analyse, Rapport de recherche R-375IRSST, Montréal, QC Griffin, J. 2006. The true cost of accidents – Underground Construction. Head, L. and Harcourt, M. 1998. The direct and indirect costs of workplace accidents in New Zealand. Asia Pacific Journal of Human Resources 36 (2), 46-58. Health and Safety Executive. 2005. Perceptions of the cost implications of health and safety failures. Report 403 Heinrich, H.W. 1979. Industrial accident prevention, McGraw-Hill Books Company, Inc. Hinze, J. and Appelgate, L. 1991. Costs of construction injuries, Journal of Construction Engineering and Management, 117 (3)
Proceedings: 9th Built Environment Conference
2-4 August 2015, Durban, South Africa
ISBN 978-0-620-67120-0
page 401
Jallon, R., Imbeau, D. and de Marcellis-Warin, N. 2011. Development of an indirect-cost calculation model suitable for workplace use, Journal of Safety Research, 42 (3), 149-164 Kapp, A., Smith, M.J., Loushine, T.W. and Hoonakker, P. 2003. Safety and quality management systems in construction: some insight from contractors. Journal of Management and Engineering, 13 (5), 70-75. LaBelle, J.E. 2000. What do accidents truly cost? Determining Total Incident Costs Professional Safety, 45 (4), 38–42 Leedy, P.D. 1993. Practical research: Planning and design. 5th ed. New York: Macmillan. Leedy, P.D. & Ormrod, J.E. 2001. Practical research: Planning and design. 5th ed. Upper Saddle River, NJ: Merrill Prentice Hall. Rikhardsson, P.M. and Impgaard, M. 2004. Corporate cost of occupational accidents: an activity-based analysis, Accident Analysis & Prevention, 36 (2), 173–182 Rikhardsson, P., Impgaard, M., Mogensen, B., Melchiorsen, A.S., 2002. Virksomhedens Ulykkesomkostninger (The Corporate Costs of Occupational Accidents). The Aarhus School of Business and Pricewaterhouse Coopers. Sheriff, R. 1980. Loss control comes of age. Professional Safety, 15-18. Shuttleworth, M. 2008. Case study research design. http://explorable.com/case-study-research-design. [accessed 11.2013]. Simonds, R. and Grimaldi, J. 1956. Safety management: Accident cost and control. Homewood, Ill: Richard D. Irwin. Tang, S.L, Ying, K.C, Chan, W.Y and Chan, Y.L. (2004), Impact of Social Safety Investments on Social Costs of Construction Accidents, Construction Management and Economics, 22(9): 937-946. Waehrer, G.M., Dong, X.S, Miller, T., Haile, E. and Men, Y. 2007. Costs of occupational injuries in construction in the United States, United States. Welman, J. C. and Kruger, S. J. 2001, Research methodology - for the business and administrative sciences, 2nd ed, Oxford University Press, Southern Africa, Cape Town, South Africa. Yin, R.K. 1989. Case study research: Design and methods (Rev. ed.). Newbury Park, CA: Sage Publishing. rd Yin, R.K. 2003. Case study research: Design and methods, 3 ed. London, England: Sage Publications. Yin, R.K. 2009. Case study research. Design and methods 4th ed. London, England: Sage Publications.
Proceedings: 9th Built Environment Conference
2-4 August 2015, Durban, South Africa
ISBN 978-0-620-67120-0
page 402
APPENDIX A: DIRECT COSTS OF 100 ACCIDENTS Accident number
Accident cause from investigation report
53
Burn
R2,600
11.02
R21,000
88.98
R23,600
30.10
56
Burn
R1,500
8.57
R16,000
91.43
R17,500
29.81
2
Cut/Caught
R800
13.79
R5,000
86.21
R5,800
28.02
4
Cut/Caught
R2,100
53.85
R1,800
46.15
R3,900
26.90
5
Cut/Caught
R700
12.73
R4,800
87.27
R5,500
27.50
14
Cut/Caught
R3,000
25.00
R9,000
75.00
R12,000
33.99
15
Cut/Caught
R5,000
62.50
R3,000
37.50
R8,000
32.39
16
Cut/Caught
R14,000
53.85
R12,000
46.15
R26,000
43.77
19
Cut/Caught
R1,700
48.57
R1,800
51.43
R3,500
12.32
21
Cut/Caught
R3,400
41.46
R4,800
58.54
R8,200
16.77
27
Cut/Caught
R2,000
23.81
R6,400
76.19
R8,400
28.19
28
Cut/Caught
R1,600
26.67
R4,400
73.33
R6,000
30.77
34
Cut/Caught
R1,200
19.35
R5,000
80.65
R6,200
36.69
36
Cut/Caught
R4,400
25.29
R13,000
74.71
R17,400
53.54
48
Cut/Caught
R1,800
8.26
R20,000
91.74
R21,800
62.46
71
Cut/Caught Cut/Caught
R700
14.89
R4,000
85.11
R4,700
26.40
R1,800
18.37
R8,000
81.63
R9,800
23.44
R3,200 R600
21.05 60.00
R12,000 R400
78.95 40.00
R15,200 R1,000
38.78 16.95
R2,400
61.54
R1,500
38.46
R3,900
17.41
R1,800
0.36
R500,000
99.64
R501,800
29.79
R5,000
10.64
R42,000
89.36
R47,000
39.13
84
Direct Costs Medical (ambulance, doctor, medication, hospital)
Wages for injured person/s
Total Direct
89 98
Cut/Caught
10
38
Electrical Electrical – Fatality Electrical
42
Electrical
R9,500
34.55
R18,000
65.45
R27,500
33.99
43
Electrical
R9,000
34.62
R17,000
65.38
R26,000
47.27
46
Electrical
R9,500
24.05
R30,000
75.95
R39,500
45.77
58
R1,600
0.32
R500,000
99.68
R501,600
29.74
60
Electrical – Fatality Electrical
R1,500
9.68
R14,000
90.32
R15,500
39.34
63
Electrical
R2,300
7.35
R29,000
92.65
R31,300
47.50
64
Electrical
R1,500
14.29
R9,000
85.71
R10,500
40.86
66
Electrical
R3,900
11.85
R29,000
88.15
R32,900
33.99
73
Electrical
R2,400
5.17
R44,000
94.83
R46,400
50.88
R1,200
0.24
R500,000
99.76
R501,200
28.25
R1,600
10.26
R14,000
89.74
R15,600
42.39
R184,000
35.11
R340,000
64.89
R524,000
56.89
R1,800
0.36
R500,000
99.64
R501,800
28.67
R1,500
0.30
R500,000
99.70
R501,500
28.28
37
78 100 31 41 79
Cut/Caught
Electrical – Fatality Electrical Electrical Electrical – Fatality Electrical – Fatality
Proceedings: 9th Built Environment Conference
2-4 August 2015, Durban, South Africa
ISBN 978-0-620-67120-0
page 403
7
Exertion/ Ergonomics Exertion/ Ergonomics Exertion/ Ergonomics Fall
R1,400
25.93
R4,000
74.07
R5,400
22.78
R1,700
43.59
R2,200
56.41
R3,900
21.91
R1,800
7.56
R22,000
92.44
R23,800
43.99
R2,800
70.00
R1,200
30.00
R4,000
34.04
R4,600
24.73
R14,000
75.27
R18,600
41.52
32
Fall Fall
R1,800
20.00
R7,200
80.00
R9,000
35.57
35
Fall
R148,000
33.04
R300,000
66.96
R448,000
26.90
39
Fall
R1,500
10.34
R13,000
89.66
R14,500
40.62
40
Fall
R1,800
12.16
R13,000
87.84
R14,800
38.24
44
Fall
R3,200
31.37
R7,000
68.63
R10,200
44.35
47
Fall
R2,800
28.57
R7,000
71.43
R9,800
34.63
49
Fall
R900
11.39
R7,000
88.61
R7,900
38.92
50
Fall
R2,600
9.77
R24,000
90.23
R26,600
47.25
51
Fall
R7,800
13.98
R48,000
86.02
R55,800
54.39
52
Fall
R9,500
12.75
R65,000
87.25
R74,500
59.41
54
Fall
R11,500
24.73
R35,000
75.27
R46,500
53.26
57
Fall
R850
17.53
R4,000
82.47
R4,850
30.22
59
Fall
R2,600
17.22
R12,500
82.78
R15,100
49.19
61
Fall
R2,800
3.74
R72,000
96.26
R74,800
57.06
62
Fall
R700
21.88
R2,500
78.13
R3,200
30.19
67
Fall
R2,000
22.22
R7,000
77.78
R9,000
32.14
69
Fall
R1,200
12.37
R8,500
87.63
R9,700
37.31
72
Fall
R700
3.95
R17,000
96.05
R17,700
52.21
74
Fall
R600
14.29
R3,600
85.71
R4,200
30.43
76
Fall –Fatality
R800
0.16
R500,000
99.84
R500,800
29.04
77
Fall –Fatality
R1,500
0.30
R500,000
99.70
R501,500
28.81
83
Fall
R1,200
11.76
R9,000
88.24
R10,200
39.23
86
Fall
R1,700
8.63
R18,000
91.37
R19,700
43.88
87
Fall –Fatality
R43,000
3.58
R1,158,000
96.42
R1,201,000
29.03
90
Fall
R500
14.29
R3,000
85.71
R 3,500
32.11
93
Fall
R2,200
18.80
R9,500
81.20
R11,700
34.62
94
Fall
R400
40.00
R600
60.00
R1,000
8.47
95
Fall
R1,200
46.15
R1,400
53.85
R2,600
17.93
96
Fall
R1,200
37.50
R2,000
62.50
R3,200
26.89
97
Fall
R2,200
13.58
R14,000
86.42
R16,200
40.30
20
Fall –Fatality Fall –Fatality
R1,800
0.36
R500,000
99.64
R501,800
26.79
R1,500 R1,500
0.30 0.30
R500,000 R500,000
99.70 99.70
R501,500 R501,500
29.50 28.23
R48,000
66.67
R24,000
33.33
R72,000
56.83
R1,800
27.27
R4,800
72.73
R6,600
17.51
29 88 9 22
65 82 25 26
Fall –Fatality Falling Object Falling Object
Proceedings: 9th Built Environment Conference
2-4 August 2015, Durban, South Africa
ISBN 978-0-620-67120-0
page 404
1
Struck
R2,000
17.39
R9,500
82.61
R11,500
31.08
3
Struck
R8,400
46.93
R9,500
53.07
R17,900
43.66
6
Struck
R600
37.50
R1,000
62.50
R1,600
10.32
8
Struck
R4,500
39.13
R7,000
60.87
R11,500
43.89
11
Struck
R4,500
36.00
R8,000
64.00
R12,500
24.22
12
Struck
R1,600
44.44
R2,000
55.56
R3,600
15.25
13
Struck
R1,400
14.89
R8,000
85.11
R9,400
30.82
17
Struck
R1,600
26.23
R4,500
73.77
R6,100
34.46
18
Struck
R1,600
53.33
R1,400
46.67
R3,000
12.15
23
Struck
R4,000
21.05
R15,000
78.95
R19,000
37.77
24
Struck
R3,600
10.71
R30,000
89.29
R33,600
21.82
30
Struck
R7,500
18.99
R32,000
81.01
R39,500
50.71
33
Struck Struck
R26,000
41.94
R36,000
58.06
R62,000
61.08
R1,500
23.08
R5,000
76.92
R6,500
21.38
R1,200
75.00
R400
25.00
R1,600
17.58
45
Struck Struck
R4,600
26.14
R13,000
73.86
R17,600
46.93
55
Struck
R1,800
16.67
R9,000
83.33
R10,800
35.18
68
Struck
R800
47.06
R900
52.94
R1,700
31.48
70
Struck
R1,200
15.58
R6,500
84.42
R7,700
45.03
R1,200
0.24
R500,000
99.76
R501,200
28.42
R1,600
0.32
R500,000
99.68
R501,600
28.59
R600
16.67
R3,000
83.33
R3,600
32.73
R500
14.29
R3,000
85.71
R3,500
30.70
R701,750
6.96
R9,385,600
93.04
R10,087,350
30.59
85 99
91
Struck – Fatality Struck – Fatality Struck
92
Struck
75 81
Total
Proceedings: 9th Built Environment Conference
2-4 August 2015, Durban, South Africa
ISBN 978-0-620-67120-0
page 405
APPENDIX B: INDIRECT COSTS OF 100 ACCIDENTS
No
Time lost by injured & co‐ workers (ZAR)
Supervisi on & Manage ment lost time (ZAR)
23 .7
1,4 00
2. 6
2,2 00
4. 0
13, 20 0
29 .1
1,3 00
3. 2
1,6 00
2. 9
6,0 00
Overtime costs (ZAR)
Incident investiga tion costs (ZAR)
56
13, 00 0 12, 00 0
2
4,5 00
30 .2
1,4 00
9. 4
4,2 00
7. 7
7,0 00
4
1,8 00
17 .0
1,3 00
12 .3
4,2 00
7. 7
5,4 00
5
4,1 00
28 .3
1,5 00
10 .3
3,5 00
6. 4
6,8 00
14
7,0 00
30 .0
1,6 00
6. 9
90 0
1. 6
9,5 00
15 .0
1,4 00
8. 4
60 0
1. 1
8,9 00
16
2,5 00 10, 00 0
29 .9
1,9 00
5. 7
80 0
1. 5
19
1,8 00
7. 2
1,6 00
6. 4
4,8 00
8. 8
21
4,8 00
11 .8
2,7 00
6. 6
4,8 00
8. 8
7,5 00 18, 70 0 24, 30 0
27
5,0 00
23 .4
1,2 00
5. 6
1,8 00
3. 3
5,2 00
28
3,5 00
25 .9
1,3 00
9. 6
1,5 00
2. 7
5,5 00
44 .9
1,3 00
12 .1
3,6 00
6. 6
3,2 00
36
4,8 00 7,0 00
46 .4
1,3 00
8. 6
2,8 00
5. 1
5,2 00
2 4. 1 1 4, 6 4 7. 0 5 0. 9 4 6. 9 4 0. 8 5 3. 3 2 2. 5 7 5. 1 5 9. 7 2 4. 3 4 0. 7 2 9. 9 3 4. 4
48
53
1,3
9.
2,5
4.
3,4
2
53
15
34
Proceedings: 9th Built Environment Conference
Traini ng of replac emen t worke r (ZAR) 5 0 0 7 0 0 8 0 0 6 0 0 8 0 0 7 0 0 8 0 0 8 0 0 6 0 0 7 0 0 7 0 0 6 0 0 5 0 0 5 0 0
0 . 9 1 . 7 5 . 4 5 . 7 5 . 5 3 . 0 4 . 8 2 . 4 2 . 4 1 . 7 3 . 3 4 . 4 4 . 7 3 . 3
5
3
Damage to equipme nt, plant, tools, or other property (ZAR) 24, 4 00 3. 0 8 19 4 00 6. 0 1
Idle plant and equipme nt (ZAR)
Other (incl.Add itional Medical, Consum ables & Funeral Costs) (ZAR)
1,2 00
2. 2
1,5 00
2. 7
1,2 00
2. 9
1,0 00
2. 4
Total Indirect (ZAR)
60 0
2. 4
1,8 00
4. 4
6,4 00
4. 8 1 2. 8 2 9. 9
1,6 00
4. 4
50 0
3. 7
1,5 00
7. 5 1 1. 1
0
0. 0
20 0
1. 9
70 0
6. 5
0
0. 0
0
0. 0
1,1 00
7. 3
54, 80 0 41, 20 0 14, 90 0 10, 60 0 14, 50 0 23, 30 0 16, 70 0 33, 40 0 24, 90 0 40, 70 0 21, 40 0 13, 50 0 10, 70 0 15, 10 0
0
0.
0
0.
90
6.
13,
0
0. 0
30 0
2. 0
90 0
6. 0
0
0. 0
70 0
6. 6
80 0
7. 5
0
0. 0
40 0
2. 8
90 0
0
0. 0
1,9 00
8. 2
2,6 00
0
0. 0
60 0
2,5 00
0
0. 0
7,7 00
3. 6 2 3. 1
5,5 00
6. 2 1 1. 2 1 5. 0 1 6. 5
40 0
1. 6
1,2 00
1,2 00
2. 9
5,2 00
1,3 00
6. 1
60 0
2-4 August 2015, Durban, South Africa
69. 90 70. 19 71. 98 73. 10 72. 50 66. 01 67. 61 56. 23 87. 68 83. 23 71. 81 69. 23 63. 31 46. 46 37.
ISBN 978-0-620-67120-0
page 406
89
7,0 00 3,0 00 6,0 00 11, 00 0
98
40 0
8. 2
50 0
10 .2
60 0
1. 1
10
1,2 00
6. 5
1,4 00
7. 6
1,2 00
2. 2
0. 7
2,7 00
0. 2
23, 00 0
4 2. 0
30 .1
3,5 00
4. 8
4,0 00
7. 3
59, 40 0 16, 00 0
18 .7
1,8 00
3. 4
3,6 00
6. 6
8,9 00
34 .5
1,8 00
6. 2
3,6 00
6. 6
46
8,0 00 22, 00 0 10, 00 0 10, 00 0 25, 00 0
53 .4
1,6 00
3. 4
2,8 00
5. 1
8,8 00 11, 80 0
58
8,0 00
0. 7
2,2 00
0. 2
12, 00 0
2 1. 9
63, 00 0
9,0 00 24, 00 0
37 .7
1,2 00
5. 0
1,6 00
2. 9
4,0 00
69 .4
1,1 00
3. 2
1,2 00
2. 2
6,5 00
5,0 00 24, 00 0 32, 00 0
32 .9
1,2 00
7. 9
1,4 00
2. 6
37 .6
7,0 00
11 .0
2,0 00
3. 6
5,7 00 19, 00 0
71 .4
1,6 00
3. 6
1,6 00
2. 9
5,5 00
71
84
37
38
42
43
60
63
64
66
73
.4
00
9
00
6
00
22 .9
1,4 00
10 .7
1,0 00
1. 8
18 .8
4,5 00
14 .1
1,5 00
45 .8
3,5 00
14 .6
Proceedings: 9th Built Environment Conference
2. 7
3,5 00 13, 00 0
6. 0 2 6. 7 4 0. 6
0 0 5 0 0 7 0 0
. 8 3 . 8 2 . 2
1,4 00
2. 6
1,8 00
7. 5
8 0 0
2,9 00 11, 80 0
5 9. 2 6 3. 8
5 0 0 8 0 0
3 . 3 1 0 . 2 4 . 3
5. 0 2 1. 9 1 6. 7 3 0. 3 2 5. 2
7 0 0 7 0 0 5 0 0 7 0 0 5 0 0
0 . 1 1 . 0 0 . 9 2 . 4 1 . 1
5. 3 1 6. 7 1 8. 8 3 7. 5 2 9. 7 1 2. 3
5 0 0 7 0 0 7 0 0 7 0 0 7 0 0 5 0 0
0 . 0 2 . 9 2 . 0 4 . 6 1 . 1 1 . 1
0
4,0 00
3 0. 5
70 0
5. 3
4,5 00
0. 0 1 4. 1
2,0 00
6. 3
1,3 00
4. 1
10 0 13, 10 0 32, 00 0
1,2 00
5. 0
4,0 00
1 6. 7
1,7 00
7. 1
24, 00 0
0
0. 0
0
0. 0
60 0
1 2. 2
60 0
3. 2
1,1 00
5. 9
8. 6
4,6 00 24, 00 0 27, 00 0
7,0 00
0. 6
2,0 00
2. 7
4,9 00
6. 7
3,4 00
6. 4
1,8 00
3. 4
4,0 00
0. 4 3 2. 8 5 0. 6 1 3. 8
1,6 00 1,1 00, 00 0
2,1 00
7. 2
1,6 00
5. 5
4,5 00
9. 6
1,3 00
2. 8
4. 5
0. 9 3 1. 4
60 0
0. 1
2,1 00 1,1 00, 00 0
60 0
2. 5
90 0
3. 8
0
0. 0
2,3 00
6. 6
0
11, 00 0 7,5 00
0
0
9
9 3. 0
9 2. 8
0
0. 0
40 0
2. 6
9,0 00
0. 0 1 4. 5 1 4. 1
2,5 00
3. 9
1,7 00
2. 7
2,6 00
5. 8
70 0
1. 6
1,9 00
4. 2
0 2,2 00
2-4 August 2015, Durban, South Africa
4,9 00 18, 50 0 1,1 82, 40 0 73, 10 0 53, 40 0 29, 00 0 46, 80 0 1,1 85, 30 0 23, 90 0 34, 60 0 15, 20 0 63, 90 0 44, 80 0
54
73. 60 76. 56
61. 22
83. 05 82. 59
70. 21 60. 87 66. 01 52. 73 54. 23
70. 26 60. 66 52. 50 59. 14 66. 01 49. 12
ISBN 978-0-620-67120-0
page 407
78
100
8,0 00 10, 00 0
0. 6
16, 00 0
47 .2
1,2 00
1. 3
18, 00 0
3 2. 8
11 4,0 00
5. 7
1,8 00
3. 3
4,2 00
Proceedings: 9th Built Environment Conference
9. 0 1 9. 8
2, 2 0 0 6 0 0
0 . 2 2 . 8
27. 00 0
2. 1
6,0 00
0. 5
1,1 00, 00 0
1,2 00
5. 7
80 0
3. 8
3,2 00
2-4 August 2015, Durban, South Africa
8 6. 4 1 5. 1
1,2 73, 20 0 21, 20 0
71. 75 57. 61
ISBN 978-0-620-67120-0
page 408
ASOCSA2015-64
Gender Perception on the Effects of Substance Abuse: A Case of Students at a Comprehensive University Justus N. Agumba¹; ¹Department of Construction Management and Quantity Surveying, University of Johannesburg corner Siemert and Beit Streets, Doornfontein, 2028, Johannesburg, South Africa,
[email protected], Tel No. +27 11 559 6488
ABSTRACT Purpose Substance abuse among youths is a worldwide epidemic that impacts negatively on the health sector as well as the family and society. Substance abuse has been identified to interfere with the students’ physical, cognitive and affective development. Therefore, the main aim of this study was to determine the perception of gender on the effects substance abuse on their physical, cognitive and affective development. Methodology The research philosophy adopted was positivism and the approach was deductive. A self-administered questionnaire containing items developed from literature review was administered to 199 built environment and civil engineering students at a South African university. The data was analyzed using the Statistical Package for the Social Sciences (SPSS) version 21. The reliability for internal consistency of the measured constructs i.e. physical, cognitive and affective development was determined using Cronbach’s alpha test. Item correlation identified the correlation of the measures of physical, cognitive and affective development. T-test was further conducted to test gender perception on the effects of substance abuse on the physical, cognitive and affective development. Findings The measures of physical, cognitive and affective development had a strong relationship and were reliable measures. Furthermore, the results suggest that there was no statistical significant difference on the perception of the effect of substance abuse on cognitive development as informed by
Proceedings: 9th Built Environment Conference
2-4 August 2015, Durban, South Africa
ISBN 978-0-620-67120-0
page 409
male and female students. However, there was a significant difference on their perception on substance abuse on physical and affective development. Value It is recommended that the scale of physical, cognitive and affective development can be used in future studies. These scales are reliable and the measures have strong relationship. Furthermore, male students should be informed of the effects of substance abuse on their physical and affective development. Keywords: Correlation, Effects, Engineering, University, Substance Abuse.
1.
INTRODUCTION
It is probably uncontroversial to state that all university campuses struggle with containing and controlling alcohol and drugs consumption by their students, this was highlighted in a discussion with the vice chancellor and members of staff of this university being researched (Vice-Chancellor university campus visit, 2014). This sentiment is supported by the study of Dlamini et al., (2012) which inferred that alcohol is still freely available on campus. Substance abuse could be exacerbated with the age at which students first enter such institutions. An age of freedom and experimentation, where young students have the opportunity to test the limits previously set by parents and schools. Parents expect a university to provide a nurturing environment for their children which would be conducive to studying. It is expected that a university should provide a safe, enriching and rewarding educational experience for a student. This will ensure that students would develop their social and intellectual skills without any hindrances. However, recent news reports about South African university campuses have led to speculation about the safety of students on campus (Flanagan, 2011). According to Towl (2004) alcohol consumption has been described as a core component of student culture and is seen as a defining feature of tertiary education lifestyle. Alcohol is among the most abused substances in South Africa. Furthermore, substance indulgence has prompted students to lose focus on their primary reason for embarking on a study in higher education. Students normally enter university to further their studies and acquire knowledge so they can improve their chances of entering the job market. Students’ fees are a substantial expense for parents and guardians especially when no bursaries are secured. Students aspire to obtain qualifications which would equip them with skills to follow noble career paths. These students would expect to have a positive experience that will contribute towards successfully completing their studies. Many students
Proceedings: 9th Built Environment Conference
2-4 August 2015, Durban, South Africa
ISBN 978-0-620-67120-0
page 410
believe that higher education is a genuine place for one to enjoy academic bliss. Aside from the high colour paraphernalia and sophisticated digital media used for promoting students enrolments, students need to understand that university is another community within which advantages and disadvantages exist. Every university in South Africa faces challenges and students ought to be aware of these challenges. Students should not be deceived into thinking that they have entered an ideal educational environment which is free from the influences of drugs and alcohol abuse and similar vices (Dlamini et al., 2012). According to Botvin et al., (1990) some students who have experimented on substances such as tobacco, alcohol eventuates in compulsive patterns of use characterized by psychological and physical dependence. This paper examines measures of the perception of gender on the effects of substance abuse, on their- physical, cognitive and affective development.
2.
CREATING A SUBSTANCE ABUSE FREE ENVIRONMENT
The ambience of a “watering hole” is entirely different from that of a library or learning centre. Any attempts to merge these two environments would be a certain recipe for disaster. Universities need to take a firm stand to ensure that such calamities are prevented. According to the Shellenbarger (2011), survey conducted in Purdue University showed a sharp drop in drinking among students from 48% in 2006 to 37.3% in 2009. Much of this success is attributed to a new trend in alcohol free events on or around campus grounds. According to the Higher Education Centre (2011) a comprehensive approach has been developed to assist students with alcohol use, which addresses the issues not only through educational channels but also by bringing about change at the institutional, community, and public policy level. The premise of this approach is grounded in the principle that people’s attitudes, decisions, and behaviour and those that relate to alcohol use are shaped by the physical, social, economic, and legal environments. This Centre argues that many aspects of this environment can be shaped by campus and government officials.
3.
THE EFFECTS OF SUBSTANCE ABUSE
The effects of substance abuse on the development of tertiary students can occur in the following areas: Their physical development; and Psychological development i.e. cognitive and affective development.
Proceedings: 9th Built Environment Conference
2-4 August 2015, Durban, South Africa
ISBN 978-0-620-67120-0
page 411
3.1 Effects of substance abuse on students’ physical development Physical development of a person concerns the growth of the body. This entails changes in the proportions between different parts of the body and changes in the internal structure and functioning of the body (Gouws and Kruger, 2003; Very, 1996). Substance abuse has, amongst other, the effects on the physical development of the student. Smoking drugs such as marijuana causes various respiratory problems and diseases such as daily coughing, acute chest illness and risk of lung infections (National Institute on Drug Abuse, (NIDA, 2014; South African National Council for Alcohol and Drug Dependence (Sanca, 2004). Furthermore, smoking can aggravate asthma and prevent enough oxygen and nutrients from nourishing the skin, giving rise to bad skin and a disease called psoriasis (Life scope, 2004). Furthermore, continued smoking causes breakdown of lung tissue and clogging of the air sacs (Izenberg and Lyness, 2002). Based on the aforementioned discussion the researchers infer that student will be less active in sports performance. The student will suffer from increased heartbeat, poor blood circulation and shortness of breath making it difficult for him to engage in activities that students of his age group engage in. Drug abuse may make the student giddy, stagger, lose balance and will affect his motor co-ordination (Sanca, 2004). Motor dysfunction (especially dysfunction regarding fine motor co-ordination as required for articulation, writing and eye movements) may cause students to experience speaking, writing and reading difficulties (Jeram, 2009). Substance abuse robs the body of essential vitamins and minerals and interferes with the digestion of food (Sanca, 2004). 3.2 Psychological development Psychological development refers to the development of mental characteristic or attitude of a person with specific emphasis on those factors affecting behaviour in a given context (Allen, 1993). The psychological development of the student will be discussed by distinguishing between the cognitive and affective aspects. 3.2.1 Cognitive development The term cognitive development refers to the continuous and cumulative development of the intellect and has to do with thinking skills, creatively, perception, conceptualization, insight, knowledge, imagination and intuition (Jeram, 2009). According to Du Toit and Kruger, (1994) and Vrey, (1996) secondary school learners display different characteristics during their cognitive development. The authors believe that these characteristics will also be experienced by university students. The student will have a
Proceedings: 9th Built Environment Conference
2-4 August 2015, Durban, South Africa
ISBN 978-0-620-67120-0
page 412
conscious focus on the world and acquires knowledge of the world in a cognitive and formal manner. They acquire further new skills in calculation of mathematics, physics and also incorporate new concepts in his knowledge structure. Furthermore, the student is expected to remember information and apply the information when solving problems and be able to reproduce it a later stage. The student can communicate effectively and his vocabulary is large enough to follow teaching. Perceptually, the student can assign meaning to sensation and can recognize, memorize, integrate, differentiate and imagine. The student learns by personal experience and by active participation. His attention span improves and he is able to concentrate for longer periods. The student is capable of devoting himself seriously to his tasks and completing them properly. Furthermore the student is willing, eager and ready to learn (Jeram, 2009). 3.2.2 Effects of substance abuse on students cognitive development Substance abuse can affect the cognitive development of the students. According to Bezuidenhout, (2004) this can occur when substance being abused interferes with a good nutrient supply to the brain and may result in brain damage, which is done in a cognitive and formal manner. Excessive alcohol use causes the brain to age prematurely. Brain disorders commonly associated with alcoholism are Weenicke’s Syndrome, Koraskoff’s Psychosis and Marchiafava’s Disease. The use of addictive substance over a long period of time may impair the memory and problem solving abilities of the student (NIDA, 2014). This has serious consequence on academic achievement as well as appropriate life decisions that a student has to make. Furthermore, it erodes the self-discipline necessary for learning. The student may experience problems with reading, calculating, writing and incorporating new concepts into his knowledge structure. Ultimately, the student may experience falling grades and may drop out of school (Jeram, 2009). The student who abuse alcohol finds it more difficult to be cautious and to use good judgment to protect him/herself. They find it more difficult to think clearly because the more they drink, the more slowly their brain works (Lifescope, 2004). This in turn can lead to difficulty in reading, calculating and writing skills. Marijuana smoking may result in the loss of short-term memory and impairs a person’s ability to learn and concentrate, which in turn affects his problem solving abilities and the ability to reproduce information at a later stage. The marijuana user experiences a lack of initiative, motivation and concern about the future (Ravesafe, 2003). 3.3 Affective development
Proceedings: 9th Built Environment Conference
2-4 August 2015, Durban, South Africa
ISBN 978-0-620-67120-0
page 413
The affective development is an emotional development concerned with emotions, feelings, passion, moods, sentiments and whims and determines the students’ personality (Van den Aardweg and Van den Aardweg, 1990). The students emotions are aroused by internal rather that external factors. The student shows a greater understanding for the feelings of others and simultaneously displays a greater degree of empathy and sympathy. They also express, control, suppress or hide emotions according to social rules thus meeting the requirements of his cultural groups, his peer group and his community. The students express aggression (anger, rage, stubbornness) becomes more refined and he/she uses the social skills that he/she has acquired to cope, i.e., communication and co-operation. Anger and rage make him moody and he/she will sometimes tend to use force to solve his/her problems or relieve his frustrations (Jeram, 2009). Happiness and cheerfulness is expressed within the confines of his peer group to which he constantly strives to be accepted. The student often prefers to gloat at a friend’s defeat rather than express happiness outwardly for social reasons. They understand moods and mood changes and the positive and negative feelings with which they leave him. Furthermore the student learns to suppress his emotions leading to stress, depression, feelings of discontent and bad moods. They also learn to rid themselves of unpleasant feelings by having a good cry, doing rigorous exercise or having a good laugh (Jeram, 2009). 3.3.1 Effects of substance abuse on students affective development The following are some of the effects that substance abuse may possibly have on the affective development of the students: Alcohol intake can lead one being talkative and friendly or aggressive and angry. It can also alter emotions, movement, vision and hearing. In addition to this it can make people do embarrassing things like throwing up or urinating on themselves (Rutherford, 2004). Furthermore, alcohol intake causes a student to become more angry and stubborn or get into a rage without much provocation. The student has not learnt to express control, suppress or hide his emotions in line with expectation of his peer group, his cultural group and his community. Substance abuse can weaken a person’s inhibitions, dull the common sense, bring out sexually aggressive behaviour and make the student more egocentric (Rodgers, 2011). Students sometimes attempt to hide feelings and emotions by abusing substances. The “high” that the substance abuser experiences can be a very happy or “spaced out” feeling or a feeling that he has special powers like the ability to fly or get rid of all his problems (Brown, 2004). Since substance abuse has interfered with the students’ ability to suppress his emotions, the student may display anger, rage, stubbornness and jealousy in an open and less refined manner (Jeram, 2009).
Proceedings: 9th Built Environment Conference
2-4 August 2015, Durban, South Africa
ISBN 978-0-620-67120-0
page 414
Marijuana use has been noted for blunting emotions and for making the student paranoid. The student will most probably end up becoming suspicious and fearful of the people around him causing him to bed-wet, stammer, boast, be anxious or engage in noisy behaviour, which are symptoms of suppressed fear (Bowman, 2002). Jealousy may be displayed by anger, rage and the use of force rather than by teasing, lying and bullying. Substance abuse and addiction may cause stress and anxiety, which in turn may cause the user to increase the substance dosage to cope with the situation. When this fails, the individual may suffer from uncontrolled depression and may commit suicide (Rodgers, 2011). Once the student becomes psychologically dependent on drugs and alcohol they find it difficult to stop. Bezuidenhout, (2004) inferred that 90% will experience some degree of relapse. Even if the student wishes to stop they will not know how to because they have relied on substance abuse to resolve problems and escape from the reality. The student may become less co-operative, less friendly and less sensitive to others who may want to assist him.
4.
PROBLEM STATEMENT
It has been indicated that substance abuse is rampant among university students in South Africa. This could lead to health problems of the students and poor performance in their studies. Coupled with this problem, the measures for physical, cognitive and affective development have differed in different studies. In order address the stated problems the research questions posed were: What is the reliability of the measures of physical, cognitive and affective development? What relationship exists between the measures that measure the physical, cognitive and affective development? Do male and female students differ on the effects of substance abuse on their physical, cognitive and affective development? Furthermore, the following null hypotheses were tested: (H1) The measures measuring affective, cognitive and physical development are not reliable; (H2) There is no relationship within the measures that measure substance abuse effect on physical, cognitive and affective development; and (H3) There is no significant difference on the perception of the effect of substance abuse on physical, cognitive and affective development between male and female students.
Proceedings: 9th Built Environment Conference
2-4 August 2015, Durban, South Africa
ISBN 978-0-620-67120-0
page 415
5
RESEARCH METHODOLOGY
The research philosophy of the study was positivism and adopting a deductive approach. Based on the research philosophy and approach adopted in this study the review led to the identification 23 items measuring three constructs i.e. physical, cognitive and affective depicting the effect of substance abuse on students. The use of structured questionnaire survey in an in-depth exploration of the constructs underlying the subject matter of the research was used. Creswell (1994) describes a survey as a quantitative or numeric description of some fraction of the population – the sample, which enables researchers to generalize their findings from a sample of respondents to a population within the limitations of the sampling method. A purposive sample was used where the researchers selected sample members to conform to some or other criterion in this case university students. The respondents were reading for the qualifications on Baccalaureus Technologiae (BTech) Civil Engineering, Construction Management or Quantity Surveying programs. Furthermore, those who were reading for National Diploma in Civil Engineering and Building were also included. A total of 199 usable questionnaires were gathered of which 51 were reading for National Diploma in Civil Engineering, 137 pursing National Diploma in Building and 11 were reading for BTech in Construction Management, Quantity Surveying and Civil Engineering. This sample size was sufficient to meet the statistical test requirements for group statistical testing. As part of the delimitation process (Creswell, 1994) of this research, few respondents reading for BTech in quantity surveying, civil and construction management did not complete the questionnaire. This limits the generalization of the sample. Purposive sampling is a non-probability method of sampling it is impossible to evaluate the extent to which such samples are representative of the relevant population (Welman & Kruger, 2001). In some respects purposive sampling gives the research qualities of a case study (Creswell, 1994). These problems with generalizing from the sample to the whole population of built environment and civil engineering students are limitations of the research design and fully acknowledged in this research. The questionnaire surveys were administered under controlled lecture room conditions to ensure the standardization of data gathering, to decrease non-response errors and to increase response rates (Cooper & Schindler, 1998). The data was gathered using self-administered questionnaires (Leedy, 1997). Furthermore, as the questionnaires were completed anonymously, the collection of the data and the presentation of this report cannot harm the respondents or their organization in any way. The need for content validity was not established as no, pilot study and pre-testing was done on the questionnaire. The structured questions
Proceedings: 9th Built Environment Conference
2-4 August 2015, Durban, South Africa
ISBN 978-0-620-67120-0
page 416
were analyzed using the Statistical Package for the Social Sciences (SPSS) version 21. This resulted in the computation of frequencies, parametric statistics in the form of independent sample t-test to test the hypotheses of gender perception on the effects of substance abuse. The mean scores of the male and female students in the t-test were interpreted using the bands; strongly disagree (1.00-1.80); disagree (1.81-2.60); uncertain (2.61-3.40); agree 3.41-4.20; and strongly agree 4.21-5.00. The reliability for internal consistency of the constructs of physical, cognitive and affective development was determined using Cronbach’s alpha test (Cooper & Schindler, 1998). Hair et al., (2006) advocated for a cut-off value of 0.70 and above as sufficient in achieving internal consistency of a construct. This cut-off value was adopted for this present study.
6
RESULTS AND DISCUSSIONS
The demographic result indicates that majority, i.e. slightly over 61% of students were male and 38 % were female. This is an indication that gender transformation is taking place in the faculty of the built environment and engineering. It can be indicated that this particular university is adhering to the South Africa government policy of allowing female to purse built environment and engineering qualification. Furthermore majority of the students were Blacks (92.0%), Whites (5.0%), Indians (1.5%) and Coloureds (1.5%). As per the qualification 25.6% of the students were pursuing National Diploma in Civil Engineering, 68.8% pursing National Diploma in Building and 5.5% were reading for Baccalaureus Technologiae (BTech) in Construction Management, BTech Quantity Surveying and BTech Civil Engineering. The result also suggests that slightly over 40 percent of students in this university are not aware of the substance abuse policy in the university. This might be the reason why students are using drugs and abusing substance in the campus. The results in Table 6.1 indicate the reliability of the effects of substance abuse. The results found that the measures of physical development were reliable, as the group Cronbach alpha was greater than 0.70 at 0.86. The result also found that cognitive and affective development measures were reliable as the Cronbach alpha was above 0.70 as advocated by Hair et al., (2006). The Cronbach alpha was o.91 and 0.92 respectively. These results do not support the null hypothesis (H1). Table 6.1 Reliability statistics of the substance abuse factors Variables
Cronbach alpha
Physical development Cognitive development
0.864 0.913
Proceedings: 9th Built Environment Conference
Cronbach alpha based on standardized measures 0.866 0.914
2-4 August 2015, Durban, South Africa
Number of measures 6 8
ISBN 978-0-620-67120-0
page 417
Affective development
0.920
0.920
9
According to Pallant (2013), it is ideal to analyze and report the mean interitem correlation when the measures of each construct is less than 10 items. The physical, cognitive and affective development measures had less than 10 items. The result in Table 6.2 suggests that physical development attained mean inter-item correlation value of 0.513 with values ranging from 0.348 to 0.661. This indicates a strong relationship between the measures measuring physical development. Cognitive development attained mean inter-item correlation value of 0.57 with values ranging from 0.413 to 0.703. This indicates a strong relationship between the measures measuring physical development. Lastly affective development attained mean inter-item correlation value of 0.562 with values ranging from 0.364 to 0.744. This indicates a strong relationship between the measures measuring physical development. The null hypothesis (H2) is not accepted. Table 6.2 Mean inter-item correlation for substance abuse factors
Physical development Cognitive development Affective development
Mean
Minimum
Maximum
Range
Maximum/ minimum
Variance
0.518
0.348
0.661
0.312
1.898
0.005
Number of measure 6
0.570
0.413
0.703
0.290
1.702
0.005
8
0.562
0.364
0.744
0.381
2.046
0.008
9
The result in Table 6.3 indicates that the physical development construct was measured using six items. The measures were reliable and can be reused in other similar studies. A t-test was therefore conducted to compare the physical development scores of male and female students. There was significant difference in scores for male students (M=3.18, SD=1.05) and female students (M=3.52, SD =1.07, t(169)= 2.00, p = 0.05, two tailed). Therefore, rejecting the null hypothesis (H3) stated. Male students were highly uncertain than female students on the effect of substance abuse on their physical development. Female students agreed that substance abuse affects their physical development. The groups mean score was 3.52 for female students and 3.18 for male students. In relation to this finding male students might be in denial that substance abuse affects their physical development. The result in Table 6.3 further indicates that the cognitive development was measured using eight items. The measures (items) for cognitive development are reliable and hence reused in other similar studies. Furthermore, an independent sample t-test was conducted to compare the cognitive development scores of female and male students. There was no significant difference in the mean scores of female students (M=3.48, SD=1.02) and male students (M=3.20, SD =0.98; t(165)= 1.78, p = 0.08, two tailed) as the p-value was greater than 0.05. Therefore, accepting the
Proceedings: 9th Built Environment Conference
2-4 August 2015, Durban, South Africa
ISBN 978-0-620-67120-0
page 418
null hypothesis (H3) stated. This is an indication that the effect of substance abuse on cognitive development of the students was not different. However, the groups mean score for female and male students was 3.48 and 3.20 respectively. These mean scores suggest that the female students agreed that substance abuse had an effect on cognitive development, whereas male students were uncertain. Male students need to be more informed of the effects of substance abuse on their cognitive development. Finally, the result in Table 6.3 indicates that the affective development construct was measured using nine items. The measures (items) for affective development are reliable and can be reused in other similar studies. An independent sample t-test was conducted to compare the affective development scores of male and female students. There was significant difference in scores for female students (M=3.25, SD=1.02) and male students (M=2.92, SD =0.99; t(165)= 2.06, p = 0.04, two tailed). Therefore, rejecting the null hypothesis (H3) stated and accepting the alternative hypothesis. However, both female and male students were uncertain on the effect of substance abuse on the affective development. These finding suggests that both and female students should be informed of the effects of substance abuse on their affective development. Table 6.3 T-test of gender on the physical, cognitive and affective development Physical development
Items=6
Variable
Levene test of equality of variances
t-value
Sig.(p)
Physical development
0.68
2.00
0.05
Cognitive development
Items=8
Variable
Levene test of equality of variances
t-value
Sig.(p)
Cognitive development
0.88
1.78
0.08
Affective development
7
Items=9
Variable
Levene test for equality of variances
t-value
Sig.(p)
Affective development
0.81
2.06
0.04
CONCLUSIONS
The research established that measures for physical, cognitive and affective development were reliable and had strong relationship. Female students perceived that substance abuse affected the physical and cognitive development. However, male students were uncertain of the effects of substance abuse on their physical and cognitive development.
Proceedings: 9th Built Environment Conference
2-4 August 2015, Durban, South Africa
ISBN 978-0-620-67120-0
page 419
Both male and female students were uncertain in relation to the effects of substance abuse on their affective development. It is interesting to note that despite of the uncertainty male students were less uncertain than the female students. It is recommended that the scale of physical, cognitive and affective development can be used in future studies that will include all the universities in South Africa in the department of construction management and quantity surveying. These scales are reliable and the measures have strong relationship. The researchers further recommend that this university and others in South Africa should develop a policy to inform students of the dangers of substance abuse on their affective, physical and cognitive development.
REFERENCES Allen, R. E. (1993). The concise Oxford dictionary of current English. Delhi: Rekha Printers. Bezuidenhout, T. J. (2004). A reader on selected social issues: Pretoria: Van Schaik Publishers. Botvin, J.G., Baker, E., Dusenbury, L., Tortu, S., and Botvin, M.E., (1990). Preventing adolescent drugs abuse through a multimodal cognitivebehavioral approach: Results of a 3-year study, Journal of Consulting and Clinical Psychology 58(4):437-446. Bowman, W., (2002). Teen’s health and drugs: what you should know. http://www.kidshealth.org/PageManager.sp?dn=Kidshealth&lic=18P S=207&catid=2014 accessed 05/03/2014 Brown, T., (2004). Understanding the psychological effects of street drugs. http://www.mind.org..../understanding+the+sychological+effects+of+ street+drugs.ht. Accessed 01/03/2014 Cooper, D.R. and Schindler P.S., (1998). Business research methods. Boston: McGraw Hill. Creswell J.W. (1994). Research design, qualitative and quantitative approaches. London: Sage. Dlamini, J.B., Rugbeer, H., Naidoo, G.M., Metso, R.M., and Moodley, P., (2012). The effects of alcohol consumption on student life at rural campus, Inkanyiso Journal of Human and Social Sciences, 4(1):4957 Du Toit S. J. and Kruger, N. (1994). The child: an educational perspective: Durban: Butterworth. Flanagan, L. (2011). What makes protests turn violent? IOL News. http://www.iol.co.za/news/south-africa/gauteng/what-makesproteststurn-violent-1.1102375 Accessed 03/03/2014 Gouws, E. and Kruger, N. (2003). The adolescent: an educational perspective. Johannnesburg: Heinemann.
Proceedings: 9th Built Environment Conference
2-4 August 2015, Durban, South Africa
ISBN 978-0-620-67120-0
page 420
Hair, J.F., Black, W.C., Babin, J.B., Anderson, R.E. and Tatham, R.L. (2006). Multivariate data analysis, 6th Edition. Upper Saddle River, New Jersey: Pearson/Prentice Hall. Higher Education Centre, (2011). Addressing Alcohol Use on Campus. http://www.higheredcenter.org/high-risk/alcohol/addressing Accessed 10/03/2014 Izenberg, N. and Lyness, D. (2002). Kid’s health – date rape: what you should know? http://kidshealth.org/Pagemanager.jsp?dn=Kidshealth&Lic Accessed 03/03/2014 Jeram, H.R., (2009). Substance abuse amongst secondary school learners. Unpublished Masters Dissertation University of Zululand Leedy P.D. (1997). Practical Research: Planning and Design. Sixth Edition, Published by Prentice-Hall, Inc. Simon and Schuster/A Viacom Company, Upper Saddle River, New Jersey, USA. Lifescope. (2004). Children and drugs: part 2. http://www.lifescope.Com/pages/How2s/Drug Child_2.html. Accessed 15/03/2014 Rodgers, K. (2011). Health and disease in society; substance use and abuse 1st edition Published by Britannica Educational Publishing in association with Rosen Educational Services, LLC 29 East 21st Street, New York, NY 10010. Rutherford, K. (2004). Kid’s health: dealing with addiction http://www.kidshealth.org/kid/grow/drugs_alcohol/alcohol_P2.html Accessed 20/03/2014 Shellenbarger, S. (2011). College Parties minus the Beer Binges, Wall Street Journal, http://online.wsj.com/article/SB100014240527487033129045761462 32117046602.html Accessed 11/03/2014 South African National Council for Alcohol and Drug Dependence (Sanca 2004). Everything you always wanted to know about alcohol and other drugs. Durban: Printermaster. Towl, D. (2004). Alcohol Use and Tertiary Students in Aotearoa - New Zealand. ALAC Occasional Publication 21:pp1-40. Van den Aardweg E. M and Van den Aardweg E. D. (1990). Dictionary of Empirical Education / Educational Psychology. Pretoria: E & E Enterprises. Vrey J. D. (1996). The self-actualising educand. Pretoria: University of South Africa. Welman J.C, and Kruger S.J. (2001), Research methodology. Cape Town:Oxford.
Proceedings: 9th Built Environment Conference
2-4 August 2015, Durban, South Africa
ISBN 978-0-620-67120-0
page 421
ASOCSA 2015-037
Influences of Stakeholders’ Power on their Participation in Health and Safety Risk Management in Construction projects in Tanzania Sarah Phoya1, Harriet Eliufoo2 1
[email protected],
[email protected] 1&2 School of Construction Economics and Management, Ardhi University, P.O. Box 35276, Dar es salaam, Tanzania
ABSTRACT AND KEYWORDS Purpose: To report findings of a study that examines the power attributes and how they influence stakeholders’ participation in health and safety risk management in construction projects in Tanzania. Research Design: A case study strategy was adopted, and, involved four large on-going construction projects in Dar es Salaam Tanzania. Data were collected through in-depth interviews with a range of stakeholders: clients, consultants, contractors, workers and regulatory agencies. Research limitations/implications: The use of case study strategy confined to the small sample size. Survey methods could be used to collect data from a bigger sample and therefore would have generated more insight on the subject matter. Findings: This study indicates that power remains a predominant factor in stakeholders’ participation in risk management. In fact, the different sources of power such as technical expertise, legitimate or position, political and resource control created opportunities for stakeholders to participate in health and safety risk management. Response to conference theme and outcomes: This study demonstrates the importance of improved project management in risk management by involved key project stakeholders and their power attribute. Practical implications: Effective stakeholders’ participation in health and safety risk management requires the analysis of different stakeholders’
Proceedings: 9th Built Environment Conference
2-4 August 2015, Durban, South Africa
ISBN 978-0-620-67120-0
page 422
powers attributes and implementation in the participation programme and policies Originality/value: Influences of power on stakeholders’ relationship and subsequent effects of this relationship upon project performance underscored the potential of power as a tool for promoting effective stakeholders’ participation and engendering higher levels of risk management performance in construction projects. Keywords: Construction Project, Health and Safety risks Management, Power influences, Project Stakeholders 1.0 Introduction The nature of construction activities are associated with high health and safety risk factors; this being the case, there is high spate of accidents in construction projects. Managing risk factors in construction project has been a challenge for a long time. Nevertheless, it has become apparent that risk management is collective responsibility and requires effort of all stakeholders such as clients, consultant teams, contractors and workers (Lingard and Rowlison, 2005). In some contexts, terms and the means for stakeholders’ participation on health and safety risk management are specified and guided by regulations (Construction Design and Management Regulations (CDM) of 2007 in the UK, (HSE, 2007); the South African Construction Regulation of 2003 (CIDB, 2008), and the Swedish Work Environment Act of 2009). In other contexts in particular Tanzania, the issue of health and safety risk management are vested to Contractors, while other stakeholder such as client, designers and workers have no legal power to influence health and safety risk management (OSHA, 2003). Power, as stated by Jasperson et al., (2002) is an ability to influence decisions of a particular event. On the health and safety perspective, the influence should based on identification of risk factors, analysis, evaluation, control risk, communication, consultation, monitoring and review of the level of risk in construction projects The influence can be either from legal, professional or position perspective (Lunenburg, 2012). Nonetheless, in most cases people depend much on legal power and neglecting the potential of other powers which can influence decisions. This has been the case in construction sectors, where there is a limited knowledge on how stakeholders’ power influence their participation on health and safety risk management in construction projects. This paper therefore contributes to the understanding of types of power in which stakeholders hold, the use of such power on health and safety risks management from briefing, design, procurement and construction phases.
Proceedings: 9th Built Environment Conference
2-4 August 2015, Durban, South Africa
ISBN 978-0-620-67120-0
page 423
2.0 Literature Review 2.1 Definition of Power Generally, power has been defined as the measure of the amount of authority a particular stakeholder can exercise (Arnstein 1969). Other scholars have defined power as an ability to influence the intentions and actions of other stakeholders (Jasperson et al., 2002). Moreover, Etzioni (1978) ascertained that, power is an actor’s ability to induce or influence another actor to carry out his directives or any other norms he supports. In the similar vein, Folger, et al., (1993) defined power as "the capacity to act effectively". In generally, what emerge in these definitions revealed that power has to do with possession of control, authority or influence over others. One can say that, power is a potential energy that exists and only awaits realization through being acted upon by either being a driver of activity or active resource as decision makers. 2.2 Sources of Power Different researchers have identified different sources of powers. As maintained by Lunenburg (2012), there are three main sources of powers: legitimate or position power, personal or expert power and political power. Accordingly, position power is derived from statutory or organisational authorities where there is formal authority to reward, punish and control information. Personal power is derived from the individual’s personal attributes or human relationship influences such as expertise power (special knowledge and experiences), traits and loyalty. Furthermore, resourcing is also inevitably linked with power, since power can be seen as concerning control over resources (Scott, 1992), whether physical, intellectual or emotional. This source of power is derived from ownership or control over resources. Resource rights are exemplified by the ability to assign people offices, space and financials success. Political power on other hand is derived from the exercise of strategic processes. Politics is typified by the use of creeping commitment as a strategy for drawing cautious practitioners into taking revolutionary actions. A good example is when workers join a trade union or elect their representatives in workplaces. Possession of information has been found to constitute an additional source/element of power (Liu et al, 2003) and a socio-political connection (who is known) has been suggested by Hersey et al. (1996) to constitute another source. Status, in terms of social prestige, may also be an important consideration to provide greater power to those with higher status. The discussion above transpires that there are different sources of power among actors. These include position, personal, political, resources, information, status and connections. Needless to say, these sources of power have a potential to provide opportunity for one to act in one way or another in health and safety risk management.
Proceedings: 9th Built Environment Conference
2-4 August 2015, Durban, South Africa
ISBN 978-0-620-67120-0
page 424
2.3 Stakeholders Power and Risk management process Risk has been defined as the chance of something happening that will have an impact on objective, and it is specified in term of event and their consequences. According to Chapman and Ward (2003), the essential purpose of risk management is to improve project performance via systematic identification, appraisal and treat or control risk and communication of risk information. The management of health and safety risk factors is embedded in the roles and responsibilities of various stakeholders and vary from inception to construction stage. For example, different authors have discussed the role of clients in managing health and safety issue (Smallwood (2008), Lingard, et al., (2009), Kikwasi (2010) Musonda and Haupt (2011) and Musonda (2012). They maintained that, clients have a major role in project implementation, and therefore, they should push for the safety requirements from idea to completion of projects. This has been reflected in different regulations in different countries which require clients to ensure health and safety is managed throughout the projects (Construction Design and Management (CDM) Regulations, of 2007; South Africa construction regulation of 2003, Swedish Work Environment Act of 2009). The core issues which require clients to have responsibilities on health and safety include his position (position power) in selecting consultant team and contractors. Further, Huang and Hinze (2006) ascertain that a client is the financier who has resource control power. This is demonstrated in the way clients encourage designers to address safety issues in the designs, and how they inspire contractors to implement safety management during construction. Project managers (PMs) on the other hand, are viewed as the single point of responsibility for all key decisions of the project where they play a vital role in the execution of project excellent (Rwelamila and Asalan, 2010). Indeed, the PM is involved in planning, organising, staffing, motivating, directing, leading, tracking, measuring, and controlling of all aspects of a project (Weaver, 2007) which need commitment and necessary skills. On the other hand conditions of contracts have vested much of the power to PMs, specifically, issue instruction, approval payments, and issuing certificates. In this regards PMs possess, position, expertise and information power to control health and safety in construction projects. Such control is achieved through forward thinking and the provision of good information and communication which are the basis for decisions for both the project managers, clients and contractors. The architects, engineers and quantity surveyors do consider health and safety aspects in their design (Smallwood, 2004). Moreover, they identify, appraise and control all the risk from a design perspective. Quantity surveyors warrant health and safety aspects in the BOQ by drawing up specifications and ensure principal contractors incorporate adequate allowances for health and safety (Niemandt, and Crafford, 2011). Contractors, especially site managers have traditionally and legally borne the largest portion of health and safety risk responsibility in
Proceedings: 9th Built Environment Conference
2-4 August 2015, Durban, South Africa
ISBN 978-0-620-67120-0
page 425
construction (OSHA, 2003). They highly influence on-site safety because they monitor, co-ordinate and direct the work of the sub-contractors. On the other hand, workers have to comply with the safety and health law, instructions and procedures in the health and safety policy. Furthermore, they have to use safety devices and protective equipment as required. They are obliged to report to their immediate supervisor of any incident which they believe is likely to cause a hazard which they cannot rectify. In addition, they have power to select safety protective equipment, to join trade unions (employment and labour relation Act 2004) and elect their representative for health and safety risk management (OSHA, 2003). 3.0 Methodology Four on-going construction projects in Dar es Salaam were included in the case study. All projects were selected because they showed some element of multi-stakeholders participation in health and safety risk management. Face-to-face Interviews were conducted with key stakeholders such as clients, project managers, architects, engineers, Quantity surveyors, Site managers and workers. Key informers from legal institution such as Contractor registration board (CRB), Architect and Quantity surveyor registration board (AQRB), Occupational safety and health Authority (OSHA), and Public Procurement Authority (PPA) were interviewed. The interview began by asking stakeholders to rate their perceived level of power in various activities in the construction project where responses range from low, medium and high. Also they were asked to rate their power influence in health and safety risk management. The possession and the use of powers of these stakeholders were assessed at four stages of a project: Briefing, Designing, Procurement and Construction phase. The briefing phase in this context refers to the early stages of a scheme; from the time a client conceives an idea to the point where a client communicates ideas to the consultant. Design stage, on the other hand is when the designer start conceptual drawings through its development and up to production of BOQ. Procurement stage include when a contractor is selected. The construction stage is the time the contractor(s) carry out work on site. Table 3.1 indicate the nature of project selected and stakeholders involved in the interview.
P1
P2 P3
P4
Table 3:1 Stakeholders interviewed and nature of the project Interviewees Type of Nature of project project Private Construction of two Client, project manager, Architect, Quantity storey warehouse surveyor, engineers, site manager, and 10 building workers Client, , Architect, Quantity surveyor, Public Construction of five engineers, site manager, and 10 workers storey maternity ward public Construction of 36 Client, , Architect, Quantity surveyor, storey commercial engineers, site manager, project manager, and residential clerk of work and 15 workers Client, , Architect, Quantity surveyor, Private Construction of 10 engineers, site manager, project manager, storey building for
Proceedings: 9th Built Environment Conference
2-4 August 2015, Durban, South Africa
ISBN 978-0-620-67120-0
page 426
clerk of work and 15 workers commercial NB: P1= Project one; P2= project two; P3= Project three; P4= Project Four
4. Data Analysis 4.1 Stakeholders’ power relation during the briefing stage Qualitative content analysis was applied to discern the perception and the used of power among stakeholders in different activities. Three activities were used in this analysis: setting the project’s requirements, employment of consultants, and communicating project requirements. The respondents were asked to rate these attributes as high, moderate or low. Counting was used to determine the number of stakeholders who perceived low, moderate or high power at different project stages. The results are presented in Table 4.1. Activity performed
Table 4.1: Perceived and the uses of powers in the briefing stage. Stakeholders Perceived power The use of power L
Setting project requirements which emphasises health and safety aspects
Clients Legal authorities Professional Registration Bodies
Employment of consultant based on safety merits
Clients Legal authorities Professional Registration Bodies
Communicating project information with emphasis on health and safety aspects
Clients Project managers
H
P1 H M L
P2 M M L
P3 M M L
P4 M M L
H M M
M H M
M H M
H M M
H H M M
H N/ A M L
H M
H N/ A M L
L
L
L
L
Architects Quantity Surveyors Engineers
M
M L
Legal authorities L L L L L L L L Professional Registration Bodies NB: L =low, M=Moderate, H =High, N/A= Not applicable, P1, P2, P3, P4 are Project one to Project four respectively
As Table 4.1 illustrates, all clients from four projects perceived having high power during the briefing stage. Although they have high power, only project one has used effectively his power to influence health and safety aspect. In project two, three and four, the clients used moderate power to influence health and safety risk decision. A further discussion revealed that in project two the client was not a financier; therefore, he had to adhere to
Proceedings: 9th Built Environment Conference
2-4 August 2015, Durban, South Africa
ISBN 978-0-620-67120-0
page 427
the financier’s requirements. Accordingly, this client had less resource control power. During the employment of consultant teams and in communicating the projects requirements, the clients retained high power in project one and four respectively while in case two and three, clients’ power was moderately used. It was further informed that project two and three, clients had less power as consultants employment processes were guided by procurement regulations. The procurement regulations provide a procedure for employing consultants without any emphasis on health and safety risk management. In the communication of project’s requirements, the project manager in Project one had high powers as he was in a position to discuss and advice on various aspects of the project’s requirements. Either way, the project manager had to ensure that the clients understood the decisions to be made and that there was a balanced opinion in making those decisions. 4.2 Stakeholders’ power relation during the design stage Three activities were used to analyse perceived and uses of stakeholders’ power in implementation health and safety risk management during design stages. These activities involved design concepts such as the generation of the general layout and outline proposal, production of full design details, establishing specifications and preparation of the BOQ and cost estimates
1
2
3
Table 4.2: Perceived and the uses of powers of stakeholders in the design stage Perceived power The use of power in Activity Stakeholders different projects performed L M H P1 P2 P3 P4 M M M M Design Client Concepts H N/A N/A L Project manager which M L L L Architect incorporate L L L L Quantity Surveyor health and safety L L L L Engineers L L L L Legal authorities L L L L Professional Detail Design which incorporate health and safety
bodies Client Project Manager Architect Quantity Surveyor Engineers
BOQ and cost
Legal authorities Professional bodies Client Project Manager
Proceedings: 9th Built Environment Conference
L L L L M
L N/A L L L
L N/A L L L
L L L L L
L M
L M
L M
L M
M H
M N/A
M N/A
M M
2-4 August 2015, Durban, South Africa
ISBN 978-0-620-67120-0
page 428
estimates which incorporate health and safety
Architect Quantity Surveyor Engineers
M
M
M
M
H M
M M
M M
M M
M M M M Legal authorities L L L L Professional bodies NB: L =low, M=Moderate, H =High, N/A= Not applicable, P1, P2, P3, P4 are Project one to Project four respectively
Table 4.2 reveals that, during the inception design, the architects and the project managers had high power, whereas the quantity surveyors and the structural engineers had moderate powers. During the detail design, the powers of the structural engineers increased. On the other hand, when BOQ and cost estimate were prepared, the power of the architects and that of engineers decreased while quantity surveyors power increased. This underscores the fact that there was high expertise power in performing tasks in construction projects. The project managers maintained considerable power throughout the design stage. The fact that the project managers interpret the plan and specifications, the BOQs and the cost estimates to ensure they met the client’s requirements is interpreted by the researcher as a source of his high power throughout the design stage. After a long discussion, it was revealed that although designers acknowledged having high power during the design stage, they did not use it. For example, in project two, three and four the uses of power were low. This was contributed by perception that it cost and time consuming, lack of regulation requirements and lack of knowledge. This underscores the fact that someone may have power but fails to use it due to the perception or legal requirement or knowledge. 4.3 Stakeholders’ power relation during the procurement stage Three activities were used to analyse perceived and uses of stakeholders’ power in implementation health and safety risk management during procurement stage as indicated in Table 4.3.
1
Table 4.3: Perceived and uses of powers of stakeholders during procurement stage Activity Stakeholders Perceived power The use of power in performed different projects L M H P1 P2 P3 P4 Client M M M M Preparation of tender Project Manager H N/A N/ M documents A which Architect M M M M H emphasis the Quantity H H H aspect of Surveyor health and Engineers M M M M safety Legal authorities M M M M Professional M M M M bodies
Proceedings: 9th Built Environment Conference
2-4 August 2015, Durban, South Africa
ISBN 978-0-620-67120-0
page 429
2
3
Tender Evaluation which considered contractor’s capability and commitment on health and safety aspects Awarding the contract
Client Project Manager
M M
H H
M N/ A M H
M
M
M
M
M M
M M
M M
M M
H
H
H
H
M M
M M
M M
M M
M
M
M
M
L
L
L
L
Architect Quantity Surveyor Engineers Legal authorities Professional bodies Client Project Manager Architect Quantity Surveyor Engineers
M H
M N/A
M H
M H
M H H M Legal authorities M M M M Professional bodies NB: L =low, M=Moderate, H =High, N/A= Not applicable, P1, P2, P3, P4 are Project one to Project four respectively
Table 4.3 indicates that the project managers and the quantity surveyors perceived to have high powers throughout project procurement stage. They were actively involved in the tender document preparation as well as in the tender evaluation. Architects who acted as team leaders perceived to have high power in document preparations and tender evaluation. Although these stakeholders perceive to have high power, in some cases (Projects two and three) evaluation of health and safety aspect measures were lacking. The reason reported was that the evaluation process was governed by procurement regulations which do not have these criteria, testing the commitment of contractors for awarding the projects. During the awarding of the contract, the clients’ powers were high as they had to make final decisions on selection. Therefore, at this stage, the clients had an opportunity and authority to emphasize and ensure health and safety risks are adequately accommodated within the contract clauses. 4.4 Stakeholders’ power relation during the construction stage Two activities were used to analyse perceived and uses of stakeholders’ power in implementing health and safety risk management during design stage. These activities included safety induction training, provision of PPE, Welfare facilities and site safety inspection/ monitoring. Table 4.4: Perceived and uses of powers of stakeholders during construction stage Activity Stakeholders Perceived power The use of power in performed different projects L M H P1 P2 P3 P4
Proceedings: 9th Built Environment Conference
2-4 August 2015, Durban, South Africa
ISBN 978-0-620-67120-0
page 430
Safety induction training, provision of PPE, Welfare facilities.
Site safety inspection/ monitoring / safety audit
Clients Project managers Architects Quantity Surveyors Engineers Legal authorities Professional Registration Bodies Site foreman/Site managers Workers Clients Project managers Architects Quantity Surveyors Engineers Legal authorities Professional Registration Bodies Site foreman/Site manager Workers
H H M M M M M
M N/A M M M M M
M N/A M M M M M
M M M M M M M
H
H
H
H
M
M
M
M
H H M M M H M
H N/A H M M H M
H N/A H M M H M
M H M M M H M
M
M
M
M
L M M L NB: L =low, M=Moderate, H =High, N/A= Not applicable, P1, P2, P3, P4 are project one to Project four respectively
Table 4.4 indicates that the clients, project managers, architects, site managers, safety officers and the clerk had moderate power during the induction training and welfare facilities in the project construction. They influenced worker training as well as induction on health and safety risk by requesting monthly reports from contractors. During site inspections and audit onsite safety, the clients and the consultant teams had high power. On the other hand, workers had moderate power during the safety induction training and in provision of PPE and welfare facilities. In projects two and three, workers elected their representatives to attend safety committee meetings. Further discussion revealed that in safety committee meetings, workers were able to raise health and safety concerns at the site. Resolutions from these safety committee meetings were presented during the monthly site meetings. This observation suggests that safety committee meetings seem to empower and enhance workers engagement, especially on health and safety matters.
5.0 Discussion Evidences from this study establish that majority of stakeholders perceive high or moderate power and were able to participate in health and safety risk management because of different powers they held. For example, clients employed services of both consultants and contractors. Thus, clients had legitimate or position power to influence the works of consultant
Proceedings: 9th Built Environment Conference
2-4 August 2015, Durban, South Africa
ISBN 978-0-620-67120-0
page 431
teams and contractors. The contract between clients and consultant/ contractor gave clients the authority to reward and punish if the contract is bleached. In a contract, a client can state clearly health and safety clauses in which contractors and consultants have to adhere to. Furthermore, the client initiates the project as he/she has personal power of ownership or control over the resources at the disposal of the construction projects. Also, clients have the ability to provide financing for health and safety risk management. Project managers and team leaders had both legitimate power and expert power. Through supervision, the project manager/team leaders were empowered by conditions of contracts to issue instructions, inspect the contractor’s work and advise clients in terms related to payment claims. They also exercised their expertise power during project supervision. Supervision works require necessary skills in project management. Nonetheless, both position and expert power hold a significant positive influence upon health and safety risk management. Thus, they managed to influence other stakeholders to make better decisions on health and safety risks. For example, they ensured that designers incorporated health and safety risk aspects in their design. Consultant team members such as architects, quantity surveyors and engineers had expert power. For example, designers implemented a safety aspect in their design as this was their area of expertise. Likewise, the QSs included safety items in the BOQ and cost estimates. This underscores the fact that there was high expertise power in performing a task in construction projects. The implementation of health and safety risk management is an area of expertise. On the other hand, workers had moderate power during the safety induction training, provision of PPE, and welfare facilities provision. It was revealed that workers possessed political power. Workers exercise their political power when they elect their representatives on safety committee meetings. One can say that power remains a predominant attribute in stakeholders’ participation in risk management, and subsequently, has a potential to influence health and safety performance. This observation converges with the theoretical framework that power is the central to participation (Arnstein, 1969). The implication is that, effective stakeholders’ participation in health and safety risk management requires the analysis of different stakeholders’ powers and its implementation in participation programme. Influences of power on stakeholders’ relationship and subsequent effects of this relationship upon project performance underscored the potential of power as a tool for promoting effective stakeholders’ participation and engendering higher levels of risk management performance. This performance benefit induced stakeholders to take a second look at their power within the project and encouraged a more conscious and considerate use of power.
Proceedings: 9th Built Environment Conference
2-4 August 2015, Durban, South Africa
ISBN 978-0-620-67120-0
page 432
Nonetheless, most of the stakeholders did not utilize fully their power to influence risk management. This was due to the shortcoming in the legal system, low level of health and safety knowledge among stakeholders and individual perception that their participation would lead to increased cost, time consuming and that it is not their responsibility. The legal system has also provided some challenges as it does not stipulate the role and responsibility of different stakeholders with regard to health and safety as well as there was no employment criteria which test the health and safety commitments for contractors and consultants in procurement regulation.
6.0 Conclusion This study demonstrates that power is a predominant factor in stakeholders’ participation in risk management, and it was found to have the potential to influence health and safety performance. In fact, the different sources of power such as technical expertise, legitimate position, political position, and resource and information control among project stakeholders created opportunities for them to participate in health and safety risk management in different construction project stages. While clients and projects managers acknowledged having high power throughout project stages, other stakeholders such as architects, engineers and quantity surveyors had high power when they executed their duties. Thus, they have expertise power. However, despite the fact that some stakeholders acknowledged having high powers in some aspects, the uses of power were generally low. This was due to insufficient in appreciation of other power such as position, expertise and information/political power. This was also due to low level of knowledge on health and safety risk management among stakeholders, stakeholders’ perception that their participation would lead to increased cost, time consuming and that it is not their responsibility. The legal system has also provided some challenges such as lack of stipulation of roles and responsibilities for different stakeholders in matters related to health and safety and the absence of employment criteria which test the health and safety commitments for contractors and consultants. In order to have an ideal form of uses of stakeholder’s power to influence health and safety risk management, there is a need to review health and safety regulations to ensure strategic responsibilities are assigned to stakeholders involved in the projects. There is also a need for training institutions to include Health and safety modules for professionals who are involved in construction projects (Architects, Engineers and Quantity Surveyors). Further, there is a need to ensure that workers are sensitized on the health and safety issues before they start working (modality of handling toolbox and safety committee meetings). Lastly, there
Proceedings: 9th Built Environment Conference
2-4 August 2015, Durban, South Africa
ISBN 978-0-620-67120-0
page 433
is need to include criteria to test the knowledge, experience and commitment of contractors to improve occupational health and safety
References Arnstein, S., 1969, A ladder of Citizen Participation. Journal of the American Institute of Planners, 35, 4, 216–24. Chapman, C. and Ward, S. 2003, Project Risk Management: Processes, Techniques and Insights, 2nd edition, (Chichester: Wiley). CIDB. 2008. Construction Health and Safety in South Africa – Status and Recommendations. Pretoria: Construction Industry Development Board. Etzioni, A., 1978, Comparative analysis of complex organizations. In D. Hampton, C. Summer, & R. Weber (Eds.),Organizational behavior and the practice of management, (Glenview, IL: Scott Foresman & Co). Folger, J., Poole, M. and Stutman, R., 1993, Working through conflict,(New York: Harper Collins). Fuqua, H. E., Payne,K E., and Cangemi,J. P., 1998, Leadership and the Effective Use of Power, National FORUMS Journals, 15E, 4 Hersey, P., Blanchard, K.H. and Johnson, D.E, 1996, Management of organisational behaviour: Utilize human resource, Prentice Hall. Health and Safety Executive. 2007. Managing Health and Safety in Construction: Construction (Design and Management) Regulations 2007 Approved Code of Practice. London ,HSE Huang, X. and Hinze, J., 2006, Owner’s Role in Construction Safety. Journal of Construction Engineering and Management, 132, 164-173. Jasperson, J.S., Carte, T.A., Saunders, C.S., Butler, B.S., Croes, H.J.P. and Zheng, W., 2002, Review: Power and Information Technology Research: A Meta triangulation Review, MIS Quarterly 26, 4, 397-459 Lingard, H and Rowlinson, S.M., 2005, Occupational Health and Safety in construction project management; London, Taylor & Francis Liu, A, Fellow, R and Fang, Z. (2003). The power paradigm of project leadership, construction Management and Economics 2; (8) 819-829 Lunenburg, F., 2012, Power and Leadership: An Influence Process. International Journal of Management, Business, and Administration 15, 1, 2012. Niemandt, P.S. and Crafford, G.J., 2011, The influence of Quantity Surveyors on the Construction Industry’s Occupational Health and Safety. Proceeding 6th Built Environment Conference, 31-2 August 2011 Johannesburg South Africa, 168-180. Rwelamila, P.M.D. and Asalan, R., 2010, Understanding of Project Management Good Practices by Construction Project Managers: The Case of ABCD. In: Egbu, C. (Ed) Proceeding 26th Annual ARCOM Conference, 6-8 September 2010, Leeds, UK, Association of Researchers in Construction Management,1189-1198. Scott W.R., 1992, Organisations: Rationals, Natural and open systems, (Presntice Hall, Englewood Cliffs).
Proceedings: 9th Built Environment Conference
2-4 August 2015, Durban, South Africa
ISBN 978-0-620-67120-0
page 434
Smallwood J.J. and Venter, D., 2002, The Influence of Project Managers on Construction Health and Safety in South Africa. The Australian Journal of Construction Economics and Building, 2, 57- 69. Smallwood, J.J., 2004, The Influence of Engineering Designers on Health and Safety During Construction, Journal of the South African Institution of Civil Engineers, 46,1, 2-8. The United Republic of Tanzania. 2003. Occupational Health and Safety Act 2003. Dar es salaam. Govenment printer. The United Republic of Tanzania. 2004. Employment and Labour Relation Act 2004. Dar es salaam. Govenment printer Weaver, P., 2007, A simple View of Complexity in Project management. Proceeding of 4th World Project Management Week Singapore.
Proceedings: 9th Built Environment Conference
2-4 August 2015, Durban, South Africa
ISBN 978-0-620-67120-0
page 435
ASOCSA2015- 065
“Louisiana is under stench” - An investigation into the tender process for dry sanitation units in the Ugu municipal district R.N Chetty 1 and Nishani Harinarain 2
[email protected], 2
[email protected] 1 Construction Management & Quantity Surveying, Mangosuthu University of Technology, P.O. Box 12363 Jacobs, 4026 Tel.: +2731-907-7558 2 Property Development Programme, School of Engineering, College of Argiculture, Engineering & Science. University of KwaZulu-Natal, King George V Avenue, Durban,4041, South Africa. Tel.: +27312602687 1
ABSTRACT AND KEYWORDS Purpose of this paper This paper investigates the tender process for dry sanitation units in the Ugu municipal district. Design/methodology/approach This study is a reflective case study located within qualitative research. Data was collected by means of reflective notes and structured interviews with partners from one of the tenderers and twenty community members who were purposively selected. Data was analysed using thematic analysis. Research Limitations/implications This paper is based on the views of the tenderer and the community. Interviews with the municipality did not form part of this study. Findings In this case the authors’ involvement in a dry sanitation project in the Ugu municipality uncovered key areas that contributed to the failure of the Louisiana Dry Sanitation project. The key factors were corruption and
Proceedings: 9th Built Environment Conference
2-4 August 2015, Durban, South Africa
ISBN 978-0-620-67120-0
page 436
nepotism. The concepts of integrity, transparency and accountability were identified in this paper as the key performance areas that required further involvement by stakeholders in order to ensure a successful and open tender process. Practical implications This paper endeavours to place discrete constructs that contribute to corruption in the tender process, and also places solutions to address these negative constructs. In the construction industry, the issue of corruption is both damaging and nebulous, thus poorly understood. Originality/value of the paper The value of this paper is that it addresses the issue of corruption from a reflexive stance, where the researcher delves deeply into his own views, pre-conceived ideas and experiences first-hand of the effects of corruption during a tender process. The feedback to the professional fraternity about self-reflection is of value in order to open the dialogue for further research efforts, and for an increase in best practice in the construction industry. Keywords: construction industry, corruption, dry sanitation units. 1. INTRODUCTION “The globe is littered with failed water and sanitation projects.” (Moe and Rheingans, 2006:53) Only thirty six percent of the population in Sub-Saharan Africa have regular access to improved sanitation (McDaniel, Prebil, Swap, et. al., 2011), leaving the remaining population to live with unsanitary, unhygienic conditions which perpetuates morbidity and mortality amongst the world’s most vulnerable citizens. The right to adequate shelter and proper hygienic surroundings is one of the most fundamental human rights. The World Health Organisation recognises that the provision of good quality sustainable homes with adequate sanitation and water for individuals will greatly enhance the health, well-being and growth of a positive society (World Health Organization, 2015). The Constitution of the Republic of South Africa (1996) recognises that proper hygienic settlement and housing is a basic human right, and thus makes provision for housing of citizens, most especially the vulnerable poor and those of low income. Section 26 of the Constitution (1996) states that all citizens, regardless of income have a right to have “access to adequate housing”. Adequate housing refers to a viable and stable structure for shelter, as well as the provision of support services for proper sanitation and hygiene (Gounden, Pfaff, Macleod & Buckley, 2006). Driven by the attempts to address the imbalances and inequities of the apartheid government, policy and legislation in South Africa underpins the
Proceedings: 9th Built Environment Conference
2-4 August 2015, Durban, South Africa
ISBN 978-0-620-67120-0
page 437
great value attached to these support services, as a means to address basic human needs and challenges in society (Gounden, et. al., 2006). Adequate sanitation techniques needs to be placed at the forefront of government agenda’s and policies because millions of people contract water-related diseases such as cholera, due to a direct result of poor sanitation (McDaniel, et. al., 2011). 2. LITERATURE REVIEW The lack of adequate sustainable sanitation efforts have far reaching consequences in the attainability of human dignity, proper public health and environmental health. The removal and sustainable treatment of human excreta has been a challenge for developing countries without access to proper infrastructure within low income communities (Montgomery, Bartram & Elimelech, 2009). Sewage removal by waterborne methods has conventionally been accepted as means to adequate sanitation (Cordova & Knuth, 2005). But waterborne sewage removal regularly leach nutrients and pathogens into already stressed water resources within semi-rural low income housing projects (Black, 1998). Wastewater treatment plant failures, overloads and sewage system leaks are common occurrences worldwide (Otterpohl, Grottker, & Lange, 1997). 2.1 Sanitation review: A South African perspective The South African National Sanitation Policy states that sanitation is the “principles and practices relating to the collection, removal or disposal of human excreta, refuse and waste water” (Republic of South Africa (RSA), 1996a). The societal imbalances of apartheid left a country flailing in its basic infrastructure. In the National Sanitation Policy (RSA, 1996a) the right to sanitation was recognised and addressed as a means to improving the quality of life and health of South African citizens, who had borne the burden of the atrocities of apartheid, and whose rights to health and hygiene were direct corollaries of the perpetuation of a poverty cycle (Ekane, Nykvist, Kjellen, et. al., 2014). a) Pre-1994 Prior to the election of the democratic government, sanitation provision happened on a decidedly unequal basis. Limited or no services were provided to the Black African population of the country (Department of Water Affairs and Forestry (DWAF), 2000) as a result of the old apartheid regime to prevent the formation of Black African settlements. The areas with no formal sewage and water systems were forced to use the bucket system to relieve themselves in the surrounding bushes and vegetation, thus fostering unhygienic conditions. The other option used in informal settlements were rudimentary pit latrine toilets (DWAF, 2002).
Proceedings: 9th Built Environment Conference
2-4 August 2015, Durban, South Africa
ISBN 978-0-620-67120-0
page 438
b) 1994 – 2001 Following the democratic government election in 1994, the provision of adequate sanitation became a strong focus (DWAF, 2003). In 1996, the Constitution of the Republic of South Africa set the target for government to provide hygienic, usable and onsite sanitation facilities in “operational order’ (RSA 1996b). The Health and Sanitation Policy outlined in the Constitution aimed at improving health for all South African citizens, most especially those that had been disempowered by the apartheid regime, and specifically planned to “get rid of human excreta, dirty water and household refuse as well as to ensure that people practice hygienic and healthy habits” (RSA, 1996b). This was a bold and ambitious statement that was not implemented as planned. The DWAF recognised that the funding and infrastructure began to trend towards the provision of electricity rather than hygiene, thus sanitation took a “back-seat” (Hoossein, 2014), resulting in poor delivery of this essential health service. The government thus contradicted its own White Paper on the provision of sanitation to its vulnerable poor and failed to develop, implement and maintain an integrated sanitation and pollution and waste management system which contributes to sustainable development and a measurable improvement in the quality of life of South African citizens (RSA, 2000). c) 2001 – present date The National Sanitation programme was launched in 2002 to address the eradication the backlog in sanitation efforts in 3 million households in South Africa in informal settlements and low income housing projects (DWAF, 2002). Implementation of this policy took place at a community level, where government engaged with non-governmental organisations and community stakeholders in this initiative. Although this initiative was a step forward in engaging the communities most affected, black water sewage treatment was still insufficient as it lead to negative and unhygienic environmental effects (Department of Water Affairs (DWA), 2012). Solutions were then sought to address and improve the sanitation service delivery in order to improve health and hygiene for all and reduce the negative environmental efforts (Hoossein, et al, 2014). The result of the programme was the consideration of the ventilated pit latrines for use in low income housing settlements and informal settlements. However, the DWA recognised that such efforts still had the drawbacks of incorrect installation, maintenance and usage, as well as the leaching of pathogens and chemicals from the pit latrine continued to affect the surrounding groundwater and posed a hazard to end-users as well as the environment (Bhagwan, et. al., 2008). Alternative sewage disposal systems were also looked at in collaboration and consultation with efforts in Mexico and other countries in Sub-Saharan Africa (Cordova & Knuth, 2005; Ekane, et. al., 2014). Dry sanitation (DS) as proposed by Cordova & Knuth (2005) was one such alternative. Theoretically, dry sanitation was identified as one
Proceedings: 9th Built Environment Conference
2-4 August 2015, Durban, South Africa
ISBN 978-0-620-67120-0
page 439
methodology to manage the problems that face informal settlements and low income housing projects. Although these standpoints form a yardstick to the eradication of poor sanitation efforts within South Africa, the challenges met by the attempts to implement such efforts within the various district municipalities bear objective assessment. The author’s involvement in the dry sanitation project in the Ugu municipality uncovered the constructs of the corruption and nepotism practices in the project, which were identified as the key areas that contributed to the failure of the Louisiana dry sanitation project. Corruption, inclusive of bribery, kickbacks and nepotism, in construction projects undermines the delivery of infrastructure services (Sohail & Cavill, 2008). According to a World Bank Report on corruption in the construction industry of developing countries of which South Africa is noted as one of them, Kenny (2007) iterates that the construction industry is consistently ranked as the one of the most corrupt, where nepotism and large payments to secure contracts and circumvent regulations commonly occurs. This is especially harmful because of the significant role construction of basic amenities and infrastructure plays in the development and delivery of services to the most vulnerable of citizens (ibid). 3. RESEARCH METHOD This study is a reflective case study located within the qualitative research method that focuses on the tender process for dry sanitation units in the Ugu municipal district. Qualitative research responds to the researcher’s ability to interpret and make sense of what he/she sees is critical for understanding the particular phenomenon (Leedy & Ormrod, 2005). New understanding can be developed when one explores personal experiences because reflection is the process of engaging with learning. A reflective case study was the most appropriate approach for this research as the authors wanted to make explicit the challenges that were experienced in the tender process for dry sanitation units in the Ugu municipal district. The tender was a closed negotiated tender between the Ugu municipality and ABC Agencies. No other agencies or persons were approached to tender for this project. Data was collected by means of reflective notes and interviews with the original tenderer and twenty members of the community who were purposively selected. The community members chosen were semi-skilled artisans from the local Louisiana area. ABC Agencies had indicated to the community leader that they required skilled or semi-skilled artisans to whom they could instruct the process of erecting the dry sanitation units. The twenty members of the community were purposively selected from this sample. Data was analysed using thematic analysis.
Proceedings: 9th Built Environment Conference
2-4 August 2015, Durban, South Africa
ISBN 978-0-620-67120-0
page 440
3.1 Background to study Louisiana is a low income housing area within the Ugu municipality, KwaZulu-Natal, South Africa. The Louisiana Housing Project is approximately 305,000 square metres, with a population of 2,748 occupants at the time of this study. The Ugu municipality chose to implement dry sanitation projects in some key areas as an alternative to traditional sanitation methods. It was with this decision of the municipality that the author and his partners of ABC Agencies decided to approach the Ugu municipality with the Amalooloo dry sanitation units. ABC Agencies were given access to a new and innovative dry sanitation unit developed by a patent developer in Johannesburg, South Africa. This unit was called the Amalooloo dry sanitation unit (ADSU). The partner of ABC Agencies met with the developer of this product in Johannesburg and was given full-scale training on how to install and maintain the unit. Thus, all areas were well covered by ABC Agencies, ensuring that they were fully versed in the use and maintenance of the product. The Ugu municipality informed the public via governmental tender bulletins that they intend installing dry sanitation units in the Louisiana low income housing area. ABC Agencies then set up a meeting with the Ugu municipality, which was attended by six members of the Ugu municipality. ABC Agencies showed the officials a YouTube video of the ADSU, and indicated to them that they were trained in the installation and maintenance of the unit and were therefore the ideal choice to train the local people of Louisiana in installing and maintaining this unit. ABC Agencies also provided the officials with the details of the supplier, and indicated to the officials that the suppliers would be able to supply these ADSU’s to the Ugu municipality within a stipulated time frame. ABC Agencies left this meeting feeling confident in their approach, and awaited the response. 4. RESULTS AND DISCUSSION After ABC Agencies’ initial meetings with the developer of the toilets, and a joint meeting with the stakeholders at the Ugu municipality, they remained confident that their strong pitch would give them a chance to attain the project. They were never informed of anything regarding their stance and after various telephone calls to the relevant stakeholders; they learnt that the project had been awarded to a private consultancy. It was only six months later that they learned via a newspaper article (Louisiana toilets create a stink, South Coast Herald, 10 June 2011) that the project had failed. ABC Agencies were keen to discover the reasons for this failure, as they knew the product well enough to recognise that it had a low level of failure in terms of its design. The author then began to question the issues of corruption and nepotism on a deeper level because of the belief that the Louisiana Project was simply a microcosm of a deeper issue at hand. The author then visited the site, and conducted informal interviews with the community at Louisiana to investigate why the project had failed. The
Proceedings: 9th Built Environment Conference
2-4 August 2015, Durban, South Africa
ISBN 978-0-620-67120-0
page 441
following is an excerpt from such an interview. The interview was recorded in the native language of the respondent, and later transcribed and translated by a Zulu speaking assistant: Researcher: I am a construction manager. I am interested to find out why the Amalooloo Project failed. Community member: Yes. Very bad failure. The toilets worked for less than two weeks. After that, it was all broken and stinking. Researcher: Explain to me what happened please. Community member: The agent came here to the community and asked for us to help build the toilets. We asked him if we need to know about building. He said no. He said he will teach us everything. Researcher: Did he teach you? Community member: Yes, maybe for two hours he showed us one toilet. Then he left us to do it and went away. Researcher: So, did you all experience difficulty in doing the job? Community member: When we had questions, no one was there to show us. So we put it the way we thought. It was wrong. But he didn’t come to check. Researcher: Did you and the users know how to use the toilets? Community member: No. He didn’t tell us all the details. He didn’t explain and then he went away.
The following is an excerpt from a semi-structured interview conducted with the business partner from ABC Agencies. Researcher: What happened about the Louisiana project and Amalooloo? ABC Agencies: The project failed badly. It was in the local papers. Researcher: Please explain. ABC Agencies: We approached the officials from the Ugu municipality. They were very interested in the ADSU. They took down the details of the supplier from us, and we trusted them enough to give out these details. We did not hear from them again. The next we heard, someone else had taken over the project, contacted the supplier and had started putting up the toilets in Louisiana. The patent owner of Amalooloo had been contacted, and he worked directly with Ugu municipality. It was clear to us, that we had been cut out, and the tender to provide these units had been given to a local associate of the officials at Ugu municipality. Researcher: What happened next? ABC Agencies: 500 units were put up in Louisiana. One per household. Within a month, all the units had failed dismally. The entire project had failed and the toilets had malfunctioned, creating a massive sanitation dilemma.
Proceedings: 9th Built Environment Conference
2-4 August 2015, Durban, South Africa
ISBN 978-0-620-67120-0
page 442
Researcher: When you visited the site after the failure of the project, what do you think was the reason for this failure? ABC Agencies: The people who had obtained the tender to provide these toilets to the community had not been properly trained in how to install them.
After interviewing 20 community members, both male and female the following reasons for the projects failure was discerned: The toilets were installed on poor soil for drainage. The soil conditions were not assessed before installing the units; The toilets were incorrectly installed by the local communities because they were incorrectly trained on how to install them properly. The training was hastily done where the semi-skilled and unskilled local people were shown one demonstration on how to install it and then left with the hardware to install it; The agent who supplied the products did not come to the site to ensure the installation was done correctly; The local community were not educated in adequate end-product (waste) management; The local community as end-users were not consulted prior to the installation, and educated about the benefits of this type of sanitation usage; The local community were not educated on the maintenance of the unit; The local community were not educated on refraining from disposing of non-biodegradable items such as sanitary pads and nappies in the unit. After discussion with the partners from ABC Agencies and self-reflection it was evident that the tender to provide these units to the Louisiana Community had not been awarded on a merit basis. This assumption was made because ABC Agencies were properly trained in this operation, but were ignored when it came to awarding the tender. As stated above the process was a closed negotiated tender. After the need for the DS Units were identified by the UGU Municipality, the Municipality contacted ABC Agencies and asked them to take on the project. ABC Agencies then took on the sole task of drawing up all business plans, Bills of Quantity as well as compiling comprehensive instructional material such as DVD’s and face to face training tutorials. After all this was elicited by ABC Agencies, and with the knowledge that they were the sole provider of this service, they were then denied the contract. ABC Agencies tried to discover why they had been denied this contract after all the negotiations and work had been successfully implemented but were not given any information. All communication was then cut off from ABC Agencies. Their skills and expertise would clearly have covered the areas in which the problems arose. Their extensive business plan encompassed all these areas, and seeing that the project had failed, they believed that the wrong person had been awarded this tender. The issue of corruption began to enter the frame of reference as the author reflected on the entire experience. A study conducted by Vee and Skitmore (2003) found that corruption and nepotism was pervading and
Proceedings: 9th Built Environment Conference
2-4 August 2015, Durban, South Africa
ISBN 978-0-620-67120-0
page 443
strong in all areas of construction which often resulted in project failures. Further, Bowen, Edwards & Cattell (2012: 887) alludes to corruption being the red-flag that points to a project failure as “trained consultants are no longer involved in tender evaluations and recommendations. Municipalities refuse to be transparent as to how they award tenders”. The following is an excerpt of the interview with the partner of ABC Agencies: Researcher: Do you think ABC Agencies were adequately qualified to conduct the Louisiana Project? ABC Agencies: Yes, definitely. I attended all the training workshops that the patent owner held. Researcher: So, do you believe that the project would have not failed had ABC Agencies run it? ABC Agencies: I believe so. We had a proper project management plan in place. The researcher then attempted to gain an insight into the emotions behind being sidelined by way of nepotism for a contract by asking further questions: Researcher: When ABC Agencies didn’t get the contract, how did it feel? ABC Agencies: It was a big blow. We had put a lot of work into it. Researcher: What do you think was the worst aspect of this rejection? ABC Agencies: In my opinion, it was the fact that a project that was so simple and easy to elicit, failed because of it being given to the wrong people. Researcher: Do you believe all governmental agencies are corrupt? ABC Agencies: No. I think that some are more susceptible than others to it (corruption). Researcher: Why? ABC Agencies: methods.
I think the poorer municipalities indulge in more corruption
Researcher: Why do you think this is? ABC Agencies: I think they are trying to level the playing fields. Create more jobs for very poor people. They don’t necessarily give the jobs to rich entrepreneurs. Maybe it is their way of giving the community people some work.
The issue of empowerment was foremost in my mind. While the authors agreed that it is important to empower previously disadvantaged communities by creating jobs, the jobs should not be awarded only to friends and contacts. The authors believes strongly that expensive mistakes can be made, and much resources that would really empower the impoverished communities are lost when the wrong people get the contract.
Proceedings: 9th Built Environment Conference
2-4 August 2015, Durban, South Africa
ISBN 978-0-620-67120-0
page 444
The causes of corruption are multi-fold and cannot be looked at as a microcosmic plethora event that has simply resulted in a poorly planned government. As Pillay (2004) outlines it is clear that many societal inequities result in people resorting to corruption as a method. Pillay reminds us that “antiquated laws” from the apartheid era still govern many construction related projects, and that bureaucratisation that have been a construct of a colonial governance may contribute towards a marginalised and disempowered people resorting to corruptible means. The practice is not simply bad governance, it is a multi-edged sword that cannot discount the past and its effects. The United Nations has identified three key concepts that collectively and individually must be espoused in order to address the negative impacts of corruption in the construction and public service sector. These are integrity (honesty and trustworthiness); transparency and accountability (United Nations Development Program (UNDP), 2002). Transparency forms the keystone towards eradicating corruption in all sectors. As long as secrecy is maintained, the circle of corruption and nepotism draws tighter and tighter. Abdul-Rahman et. al. (2010) highlights the need for a transparent and open environment from planning to implementation to awarding of tenders in the governmental sectors. Ethics sometimes is not just a question of accountability, but an issue of personal openness, where the circle of people “in the know” is broken open. A transparent environment in discussing awarding of contracts can become a place where learning, collaboration and eventual healing of previously held racism, disempowerment and atrocities of separation fostered by apartheid can be found. The authors believe that a middle ground could have easily been fostered in the Louisiana project. This middle ground would have been to award the contract to the person that the municipality had developed a nepotistic relationship with, but a consultant with good knowledge of the workings, such as ABC Agencies, should have been called in during the earlier stages. This method, although unconventional would have probably ensured a multi-level consultation environment with the sharing of ideas and plans for the mutual benefit of all stakeholders. Of late, I have re-visited the Louisiana area and found that the problems have been sorted out. But this was only after a large loss, a huge financial outlay, human resources, as well as pollution of the grey water and soil following the incorrect usage of the units. Cordova & Knuth (2005:253) clearly outlines the authors’ thoughts at the time in stating that “failures are repeated around the world until they become too obvious to ignore – at which time their wastefulness is deplored”. 5. CONCLUSION This paper investigated the corruption in the tender process for dry sanitation units in the Ugu municipal district. The apartheid regime was a
Proceedings: 9th Built Environment Conference
2-4 August 2015, Durban, South Africa
ISBN 978-0-620-67120-0
page 445
divisive and secretive one. To move beyond such secrets, it is incumbent on the construction industry to open up the processes of how contracts and projects are handled. This is one of the ways forward, and a positive direction to grow the industry in. The effect of corruption in governmental contracts has far reaching consequences to both independent contractors, governmental agencies, non-governmental organisations and to the community at large. The psychological effects that contractors feel after being turned down for projects despite being highly competent and qualified are an infringement on basic human rights. In addition, the economic and developmental constraints advance upon a government that is already straining at the seams. Poor information about the construct of corruption and the theory surrounding why corruption becomes a viable solution to the current society needs to be further addressed with deeper research enquiry. 6. REFERENCES Abdul-Rahmhan, H., Wang, C., and Yap, X.W. 2010. How professional Ethics impact construction quality: Perception and Evidence in a fast developing country. Scientific Research and Essays 5(23), 3742-3749. Bhagwan J.N., Still D., Buckley C. and Foxon K. 2008. Challenges with upscaling dry sanitation technologies. Water Science Technology. 58, 2127. Black, M. 1998. Learning what works. A 20 year retrospective view on International water and Sanitation cooperation. UNDP – World Bank Water and Sanitation Program, Washington DC. Available at: www.wsp.org [Accessed 19 May 2015]. Bowen, P.A., Edwards, P.J. and Cattell, K. 2012. Corruption in the South African Construction Industry: A Thematic analysis of verbatim comments from survey participants. Construction management and Economics. 30, 885-901. Cordova, A. and Knuth, B.A. 2005. Barriers and strategies for dry sanitation in large scale and urban settings. Urban Water Journal. 2(4), 245-262. Department of Water Affairs (DWA) [South Africa]. 2012. Sanitation services – quality of sanitation in South Africa: Report on the status of sanitation services in South Africa. National South African Department of Water Affairs. Available at: http:/www.gov.za/documents/downloads. php?=178714 [Accessed 19 May 2015]. Department of Water Affairs and Forestry (DWAF) [South Africa]. 2002. Sanitation for a healthy nation: Sanitation technology report. South African National Department of Water Affairs and Forestry, Pretoria: Government of South Africa. Available at: http://wwwdwaf.gov.za/dir_ws/contentt/lids/PDF/Technical.pdf. Accessed 19 May 2015]. Department of Water Affairs and Forestry (DWAF) [South Africa]. 2003. A protocol to manage the potential of groundwater contamination from
Proceedings: 9th Built Environment Conference
2-4 August 2015, Durban, South Africa
ISBN 978-0-620-67120-0
page 446
onsite sanitation. South African National Department of Water Affairs and Forestry. Pretoria, South Africa. Available at: http://www.dwa.org.za/groundwater/documents/GWprotocolMar03.pdf [Accessed 19 May 2015]. Department of Water Affairs and Forestry (DWAF) [South Africa]. 2000. Sanitation for a healthy nation: sanitation technology options report, South Africa National Department of Water Affairs and Forestry, Pretoria, South Africa. Available at: http://www.dwaf.gov.za/dir_ws/content/ lids/PDF/Technical.pdf [Accessed 19 May 2015]. Ekane, N., Nykvist, B., Kjellen, M., Noel, S. and Weitz, N. 2014. Multi-level sanitation governance: understanding and overcoming challenges in the sanitation sector in Sub-Saharan Africa. Waterlines. 33(3), 243-256. Gounden, T., Pfaff, B., Macleod, N. and Buckley, C. 2006. Provision of free basic sanitation: The Durban Experience. Sustainable development of nd water resources, water supply and environmental sanitation. 32 WEDC International Conference, Colombo Sri Lanka: 22-26. Kenny, C. 2007. Construction, Corruption and Developing Countries. World Bank Policy Research Working Paper 4271. Available at: http://econ.worldbank.org [Accessed 19 May 2015]. Leedy, P.D. and Ormrod, J.E. 2005). Practical Research. Planning and Design. Pearson: Merrill Hall. McDaniel, M., Prebil, E., Swap, R., Berinyuy, C., Chapman, D., Eilerts, H. and McDaniel, J. 2011. Community led sanitation in Simoonga Zambia. International Journal for Service Learning in Engineering. 6(2), 55-77. Moe, L.C and Rheingans, R.D. (2006) Global Challenges in water, sanitation and Health. Journal of water and Health 4 (Suppl1), 41-57. Montgomery, M.A., Bartram, J. and Elimelech, M. 2009. Increasing functional sustainability of water and sanitation supplies in rural SubSaharan Africa. Environmental Engineering Science. 26(5), 1017-1023. Otterpohl, R., Grottker, M. and Lange, J. 1997. Sustainable water and waste management in urban areas. Water Science Technology. 35, 121-133. Pillay, S. 2004. Corruption - The Challenge to good governance: A South African perspective. The International Journal of Public Sector Management. 17(7), 586-605. Republic of South Africa (RSA). 2000. The White Paper on integrated pollution and waste management. Parliament of South Africa, Cape Town, South Africa. Available at:www.gov.za/documents/downloads. php?f=68787 [Accessed 19 May 2015]. Republic of South Africa (RSA). 1996a. White paper for the national sanitation policy. National Sanitation Task Team, Department of Water Affairs and Forestry, Pretoria, South Africa. Available at: www.dwaf.gov.za/documents/policies.pdf [Accessed 19 May 2015]. Republic of South Africa (RSA). 1996b. Constitution of the Republic of South Africa (108 of 1996). Parliament of South Africa. Cape Town,
Proceedings: 9th Built Environment Conference
2-4 August 2015, Durban, South Africa
ISBN 978-0-620-67120-0
page 447
South Africa. Available at: www.justice.gov.za/legislation/constitution.html [Accessed 19 May 2015]. Sohail, M. and Cavill, S. 2008. Accountability to Prevent Corruption in Construction Projects. Journal of Construction Engineering and Management. 134(9), 719-738. United Nations Development Program (UNDP). 2002. Human Development Report. Available at: www.undp.org/content/undp/en/ home.../undp_in_action_ 2002.html [Accessed 19 May 2015]. Vee, C. and Skitmore, R.M. 2003. Professional ethics in the Construction Industry. Engineering, Construction and Architectural Management. 10(2), 117-127. World Health Organisation (WHO). 2015. Sanitation. Available at: www.who.int/topics/sanitation/en/ [Accessed 20 May 2015].
Proceedings: 9th Built Environment Conference
2-4 August 2015, Durban, South Africa
ISBN 978-0-620-67120-0
page 448
ASOCSA2015-73
How much is enough? A pilot study of the cost of construction health and safety Theodore C. Haupt1 and Elke Hefer2 1
[email protected], 2
[email protected] 1 Property Development Programme, School of Engineering, College of Argiculture, Engineering & Science. University of KwaZulu-Natal, King George V Avenue, Durban,4041, South Africa. Tel.: +27312602687 ABSTRACT AND KEYWORDS Purpose of this paper This paper presents the findings of a pilot study to determine how much contractors allow for construction health and safety. Design/methodology/approach A small sample of contractors and sub-contractors were surveyed to determine the level of financial provision that they made for construction health and safety on their projects. Research Limitations The research is limited because the findings are based on a small convenience sample of contractors and sub-contractors in the KwaZuluNatal Province. Findings The findings provide an indication of the trend in financial allowance by industry practitioners for construction health and safety on their projects. The findings confirm that standard forms of contract do not require specific allowance to be made for health and safety. Further, in the absence of specifically accounting for all associated costs related to health and safety it is difficult to accurately determine what the financial provision is and whether the allowances are adequate. Originality/value of the paper The findings of this study have implications for the level of financial provision that is adequate for effective management of construction health and safety.
Proceedings: 9th Built Environment Conference
2-4 August 2015, Durban, South Africa
ISBN 978-0-620-67120-0
page 449
Keywords: construction health and safety, financial provision, forms of contract 1. INTRODUCTION Construction and maintenance is dangerous by its nature, and increased emphasis needs to be placed on occupational health and safety (OH&S) in order to reduce the cost to the industry (Lin and Mills, 2001). Cost has a role in reducing accidents and improving efficiency. According to Tang (2004) there is a general consensus that construction contractors should increase their health and safety (H&S) investment on their construction projects. The higher the investment in H&S, the better the H&S performance. However, determining the extent or how much is enough is the challenge. Further, time and economic constraints influence the way individuals perceive risks and consequently risks should be identified prior to construction. Hinze (2006) argues that construction managers should consider H&S from a purely economic perspective. It is common practice for contractors to discount their jobs just to win the tender, as a result H&S often suffers. H&S is more often than not the first item to face cost cutting because they believe that implementing a H&S management system will cost more. In addition, managerial focus tends to concentrate on production “at cost.” Since H&S is perceived not to improve production, the investment is reduced when a project runs over budget. Contractors prioritise production criteria, regarding resources dedicated to occupational safety as expenditures that have nothing to do with the production aims of the organization - costs rather than an investment (Fernández-Muñiz, Montes-Peón and Vázquez-Ordás, 2009).
2. INVESTMENT IN HEALTH AND SAFETY Studies have shown that the true costs of construction injuries can have a substantial impact on the financial success of a construction organization and may increase overall construction costs by as much as 15% (Everett & Frank, 1996). Therefore, it makes business sense to invest in accident/injury prevention not only for H&S management but also for decreasing overall costs of construction projects. Tang (2004) found in a study in Hong Kong in response to the question: ‘What is the optimal level of H&S investment?’ that the minimum H&S investment should be about 0.80% of the contract sum and that a greater percentage would produce intangible benefits. While very few definitive studies have been done to determine what the level of investment should be, a range between 1% and 10% of project cost has been suggested (Hinze, 2006). Arguably, this variance may be as a result of different interpretations of which costs should be included as investments in H&S.
Proceedings: 9th Built Environment Conference
2-4 August 2015, Durban, South Africa
ISBN 978-0-620-67120-0
page 450
3. COST OF HEALTH AND SAFETY (COHS) MODEL The cost of health and safety model illustrated in Figure 1 was developed by Chalos (1992) to conceptually describe the cost–benefit analysis of accident/injury prevention. According to the COHS model, there is a theoretical equilibrium point at which the total costs of prevention and detection are equal to the total costs of injuries, and this point reflects the optimum investment. The model also supports the presumption that some level of H&S risk must be considered as acceptable to maintain an organization's financial stability. There exists some level of inherent risk in most of construction work processes and that the costs of mitigating this risk can be overwhelming (Manuele and Main, 2002). Subsequently, in practice, beyond the optimum equilibrium point the cost of prevention will exponentially exceed the costs of injuries to the organization. 4. BENEFITS OF HEALTH AND SAFETY INVESTMENT Investment in construction H&S has several positive effects, such as, for example, Improved H&S performance, since it reduces the accident rate, and consequently personal injuries and material damage, and simultaneously improves working conditions, which raise employee motivation and reduce their absenteeism; Improved organization competitiveness, due to its positive influence on the image, reputation, productivity and innovation of the organization; and Improved economic-financial performance, due to its positive influence on the profits and profitability of the organization (Fernández-Muñiz, Montes-Peón and Vázquez-Ordás, 2009).
Proceedings: 9th Built Environment Conference
2-4 August 2015, Durban, South Africa
ISBN 978-0-620-67120-0
page 451
Figure 1. Cost of health and safety model (Chalos, 1992) These assertions are supported in Figure 2 which shows the influence of H&S measures on H&S performance and overall organization performance.
Figure 2. Benefits of H&S Investment
5. RESEARCH APPROACH According to Welman and Kruger (2001), the design of any research study is concerned with the plan to assemble suitable data for investigating and testing the research hypotheses. Further, the methods used to gather information depend on the type of data and the problem to be researched (Leedy, 1993; Leedy and Ormrod, 2001). For this pilot study a short quantitative questionnaire was developed to determine the extent to which standard forms of contract used in South Africa addressed or referred to construction H&S, which of them included a provision for the cost of H&S, opinions on various approaches to costing for H&S, and whether contractors computed the percentage H&S constituted of estimates and project costs. The convenience sample comprised of 21 contractors and sub-contractors in the KwaZulu-Natal Province of South Africa. The data was analysed using SPSS version 22.
Proceedings: 9th Built Environment Conference
2-4 August 2015, Durban, South Africa
ISBN 978-0-620-67120-0
page 452
6. FINDINGS AND DISCUSSION Respondents were presented with statements under each of the subsections and asked to respond on a 6-point scale as follows: Extent of reference to H&S in contracts and documents where 0 = unsure, 1 = nothing, 2 = limited, 3 = neutral, 4 = somewhat and 5 = extensive; Extent of agreement with perceptions of costing of and financial provision for H&S where 0 = unsure, 1 = strongly disagree, 2 = disagree, 3 = neutral, 4 = agree and 5 = strongly agree; and Importance of project parameters where 0 = unsure, 1 = not important, 2 = somewhat important, 3 = neutral, 4 = important and 5 = very important. The degree of internal consistency or Cronbach Alpha scores for the scale used for the various constructs is shown in Table 1. All constructs were found to have statistically high levels of internal reliability, namely Cronbach Alpha values greater than 0.700. The One-Sample T-test when applied to all the constructs showed that the sample means for all items differed significantly from the neutral value of 3.00 at the 99% confidence interval level. Table 1. Reliability test Construct Reference to H&S in contracts and documents Approaches to costing H&S Importance of project parameters
Cronbach Alpha 0.846
No of items 6
0.874 0.911
13 6
Respondents were asked to indicate to which extent H&S was addressed or mentioned in the most prevalent standard forms of contract and documents used in the South African construction industry using a 6-point scale where 0 = unsure, 1 = nothing, 2 = limited, 3 = neutral, 4 = somewhat and 5 = extensive. Their responses are shown in Table 2. Table 2. Reference to H&S in contracts and documents (%) N=21 Document/Contract 0 1 2 3 4 5 Mean Standard System 23.8 33.3 14.3 19.0 0.0 9.5 1.67 of Measurement (SSM) JBCC 28.6 28.6 14.3 9.5 14.3 4.8 1.67 GCC 42.9 14.3 14.3 19.0 0.0 9.5 1.48 Model Preambles 28.6 28.6 28.6 9.5 0.0 4.8 1.38 NEC 47.6 19.0 4.8 19.0 0.0 9.5 1.33 FIDIC 57.1 19.0 14.3 4.8 0.0 4.8 0.86
Proceedings: 9th Built Environment Conference
2-4 August 2015, Durban, South Africa
SD 1.53
1.59 1.66 1.28 1.68 1.31
ISBN 978-0-620-67120-0
page 453
It is evident that H&S was either not addressed or mentioned at all or addressed on a limited basis in contracts and documents. The SSM was the document and the JBCC was the standard form of contract that made the most mention of H&S. This finding is indicative of the dominance of the usage of these in the industry. However, more telling is the large proportion of respondents who were unsure about whether H&S was addressed or mentioned at all (range 23.8% in the case of SSM to 57.1% in the case of FIDIC). It is possible that because H&S was not given prominence or importance in construction contracts and documents that respondents were uncertain about reference to H&S. Respondents were requested to indicate for the periods 2013/2014 and 2014/2015 what percentage of contract documents had included financial provision for H&S and if so whether in the form of a provisional sum or a detailed H&S preliminaries section. Their responses are shown in Table 3. Table 3. Form of provision for H&S in contracts N=21 Form of provision Mean SD Inference Provisional sum – 2013/2014 1.67 2.58 10%20%