The Normalized Compression Distance and Image Distinguishability Nicholas Tran Santa Clara University, 500 El Camino Real, Santa Clara, CA 95053, USA ABSTRACT We use an information-theoretic distortion measure called the Normalized Compression Distance (NCD), first proposed by M. Li et al., to determine whether two rectangular gray-scale images are visually distinguishable to a human observer. Image distinguishability is a fundamental constraint on operations carried out by all players in an image watermarking system. The NCD between two binary strings is defined in terms of compressed sizes of the two strings and of their concatenation; it is designed to be an effective approximation of the noncomputable but universal Kolmogorov distance between two strings. We compare the effectiveness of different types of compression algorithms? in predicting image distinguishability when they are used to compute the NCD between a sample of images and their watermarked counterparts. Our experiment shows that, as predicted by Li’s theory, the NCD is largely independent of the underlying compression algorithm. However, in some cases the NCD fails as a predictor of image distinguishability, since it is designed to measure the more general notion of similarity. We propose and study a modified version of the NCD to model the latter, which requires that not only the change be small but also in some sense random with respect to the original image. Keywords: image similarity, Kolmogorov complexity, information distance.
1. INTRODUCTION Is it possible to model the phenomenon of two images being perceived by humans as visually similar, either mathematically or computationally ? Such a model would be useful in many applications such as web search engines and digital watermarking. In this paper, we review the development of modern theories of image similarity, starting with an empirical study in 1936 involving human subjects evaluating sets of variations of a standard image, carefully chosen to reveal the principles behind the observed results and ending with the recent information-theoretic formulation of mathematical distance functions which have been shown to be universal in the sense that they minorize all computable functions measuring similarity between two objects. We then repeat the study using the same sets of test images, but this time their similarity is evaluated by the information distance (or rather its effective approximation, since the information distance is not Turing computable). It is shown that the information distance performs well on variations involving addition or subtraction of parts, it fails to capture similarity that involves the form, material, or structure of images. We also study the information distance in the context of digital watermarking, where the players must deal with images similar to the point of being visually indistinguishable. We show that the information distance is not a good predictor of image distinguishability and suggest that a suitable measure for this purpose must correctly predict small or random changes as imperceptible. The rest of this paper is organized as follows. Section 2 reviews modern theories of image similarity. Section 3 describes the information distances and their effective approximations. Section 4 summarizes Goldmeier’s groundbreaking Gestalt study; the test images used in this study are reproduced in Appendix A. Sections 5 and 6 discuss our experiment using the information distance to evaluate similarity between the Goldmeier test images. Section 7 studies the information distance in the context of digital watermarking, and Section 8 concludes this paper with some observations and open questions. E-mail:
[email protected]
2. THEORIES OF IMAGE SIMILARITY The concept of visual similarity is empirically well-established: given two images and a set of evaluation criteria, there is clear consensus among human observers whether they look similar or not. It seems reasonable to ask whether visual similarity can be modeled either mathematically or computationally. Indeed, various theories of image similarity have been proposed by researchers working in the field of computer vision, mathematics, psychology and optical engineering. In this section, we give a brief survey of some of the main approaches to formalizing human vision; interested readers are referred to Palmer’s book1 for a comprehensive treatment of vision science. The Gestalt theory is unique in its position that human visual perception must be treated as a whole and not decomposable into locally related simpler units; rather, it is the global relationship among all parts that determines many aspects of perception (such as a perceived circle emerging from uniformly spaced dots equidistant from a center point). A fascinating qualitative study of image similarity in this manner was performed by the Gestalt psychologist E. Goldmeier in 19362 in the form of a series of experiments, where three figures A, B, and C were displayed and the subjects were asked to determine whether C is more similar to A or to B. Goldmeier concluded that similarity is not partial identity, nor is it identity of relations or proportions. In contrast, similarity does relate to preservation of interrelationship of the parts and general structure. Among distortions, he found that some values, which he called singular, produce much more perceptible changes; e.g., rotation by 90 degrees produces a less similar result than, say, by 78 degrees). Other theories are based on the physiology of the human visual system and how it processes information received from the outside world. Light first goes through the cornea (filled with aqueous humor), enters the pupil, then passes through the lense (filled with vitreous humor), and finally reaches the retina, which is lined with photoreceptors, at the back of the eye. There are two types of photoreceptors, called rods and cones for their shapes. Cones are found mostly at the center of the retina (fovea) and are responsible for vision under normal lighting conditions and for color perception. Rods populate the rest of the retina and are responsible for low-light vision. The photoreceptors convert light into neural activity and transmit information along the optic nerve to the lateral geniculate nucleus and then to the primary visual cortex. The simplest theory of this type models the retina as a rectangular array of pixels and states that similarity between two images can be computed from their pixel representations. In particular, the engineering community has been using various distortion metrics to quantify numerically dis-similarity based on differences between corresponding pixels of the compared images. These metrics range from simple but fast-to-compute measures such as mean squared error to sophisticated but computationally expensive “perceptual” methods that take into account psychological phenomena such as contrast sensitivity and masking. In general, they are mathematical formulae constructed to satisfy certain axiomatic requirements imposed by empirical observations3 and are useful in practice despite the fact that the perceived image can be quite different from its retinal image. More sophisticated theories take into account the fact that perception depends on information processing taking place at the visual cortex. Neuroscientist and Nobel laureates D. Hubel and T. Wiesel discovered in a series of studies starting in 1959 what appear to be specialized cells in the cortex to detect edges and lines/bars at particular orientations, positions, and contrasts.4 D. Marr and other researchers in the computer vision community made the theory more concrete in the 1980’s by proposing computational models for the edge/line detection mechanisms purportedly carried out by these Hubel-Wiesel cells.5, 6 They theorized that retinal images are encoded in terms of lines, edges, blobs and terminations, along with attributes such as position, size, orientation, contrast, color, by the brain to make up the so-called raw and full primal sketches. Hence two images are similar if their primal sketches are similar. On the other hand, the spatial frequency theory, first proposed by C. Blakemore and F. Campbell of the psychophysical community7 in 1969, argues that the Hubel-Wiesel cells do not detect edges and lines; instead their purpose is to carry out a process similar to Fourier analysis, albeit in a local fashion, where the retinal image is decomposed into sinusoidal gratings (two-dimensional patterns where the luminance is constant in one direction and varies according to the sine function in the other). In this view, two images are similar if their corresponding Fourier decompositions are similar. Since the mathematics behind this theory is fully and rigorously developed, if not intuitive, and there is plenty of empirical evidence to support its claim regarding
the actual purpose of the Hubel-Wiesel cells, the spatial frequency theory has become favored over the line/edge detector theory. Palmer pointed out in his text that it is still possible that line/edge detection is carried out in the brain, but at a higher level rather than at the cell level. Indeed, since we perceive images as consisting of distinct parts, and a Fourier analysis results in a global spectrum rather than individual spectra, it appears that the brain must carry out further processing of visual information beyond the retinal stage. The structural information theory proposed by psychologist E. Leeuwenberg8 in 1971, specifies that the retinal image is encoded as a LOGO-like program (although it does not explicitly specify the exact list of command primitives) and then reduced to its most compact representation; the program can be used to regenerate the image later on. This dynamic view of the encoding process contrasts with Marr’s static theory, which posits that the retinal image is reduced to an approximated version consisting of lines, edges, blobs, and terminations. Classifications of images that can be encoded with computationally restricted devices such as finite-state automata have been studied in the theory community.9, 10 Very recently computer scientists M. Li and P. Vitanyi and others have made Leeuwenberg’s idea precise by replacing the unspecified LOGO-like language with a universal Turing machine. In a series of papers11–14 they have proposed an (absolute) information distance and a (relative) normalized information distance to measure how closely two objects are related based on the size of a smallest Turing machine that transforms one into the other. These measures are universal in the sense that they minorize every effective metric and hence can be applied to questions regarding similarity in any domain; on the other hand, they are not computable and hence have no practical values. To overcome this problem, Li et al. have proposed to substitute the smallest Turing machine to transform one object A to another object B with the result of compressing B relative to A using an efficient compression algorithm (such as Ziv-Lempel). They called this approximate version the normalized compression distance and have demonstrated its effectiveness in various applications including plagiarism detection, computational biology, linguistics and music.
3. THE NORMALIZED COMPRESSION DISTANCE The information distances defined in12 and13 make use of Kolmogorov complexity of binary strings, which measures their algorithmic information content. More precisely, Definition 3.1 (11 ). Let U be a fixed universal Turing machine. The Kolmogorov complexity of a binary string x, denoted by KU (x) is the length of a shortest program x∗ that prints x when run on U . The conditional Kolmogorov complexity of a binary string y given a binary string x, denoted by KU (y|x) is the length of a shortest program that prints y when run on U with input x. It can be shown that the choice of the universal Turing machine U in Definition 3.1 is not important modulo an additive constant, and hence U is usually dropped from the notations. Definition 3.2 (12 ). The information distance E(x, y) between two binary strings x and y is defined as E(x, y) = max{K(x|y), K(y|x)}. E() possesses many nice properties besides being a metric. Most importantly, it minorizes all so-called admissible metrics, where at most 2d strings are at distance d from any string x. In other words, the number of images similar to a given decreases as the level of similarity increases, as in the case of the human visual system. Definition 3.3 (13 ). The normalized information distance d(x, y) between two binary strings x and y is defined as max{K(x|y ∗ ), K(y|x∗ )} d(x, y) = . max{K(x), K(y)} The information distance E() measures absolute distance between two strings and thus does not reflect how similar the two strings are to each other; E(0, 1) = E(01111, 11111), but clearly the second pair of strings are more similar to each other than the first. The normalized information distance is designed to capture this notion of similarity. d() is also a metric, and again it can be shown to minorize all normalized admissible metrics.
Unfortunately, both versions of information distance between two strings have no practical values, since they depend on the noncomputable Kolmogorov complexity function K(). Li et al. proposed an effective version of d(·, ·) by replacing K() (which can be viewed as the optimal compressed version of a string) with C(), the compressed length of a string using some efficient compression scheme. Since K(xy) = K(x) + K(y|x∗ ) = K(y) + K(x|y ∗ ) up to an additive logarithmic term, we have K(y|x∗ ) = K(xy) − K(x) K(x|y ∗ ) = K(xy) − K(y) and max K(y|x∗ ), K(x|y ∗ ) = K(x, y) − min K(x), K(y). An effective analog of d(·, ·) can be obtained by substituting C() for K(x): Definition 3.4 (12 ). The normalized compression distance N CD(x, y) between two binary strings x and y is defined as C(xy) − min{C(x), C(y)} . N CD(x, y) = max{C(x), C(y)} The NCD has been applied successfully in diverse areas such as construction of phylogeny trees of related genomes and of Euro-Asian languages, detection of plagiarism in student programming assignments, clustering music, and performing handwriting recognition.14 The last application requires extensions of the distance definitions to cover m × n binary images. The row-order one-dimensional representation of images seem to work well for many efficient compression schemes. The concatenation of two m × n images is obtained by placing the two images side by side to form an m × 2n image.
4. GOLDMEIER’S EXPERIMENT In 1936 E. Goldmeier published a groundbreaking study2 designed to uncover principles governing the phenomenon of visual similarity as experienced by humans. The study consists of a series of 79 experiments, where about ten subjects were shown simultaneously a number of drawings, one of which was called the standard, and the rest were called comparison figures. The subjects, selected from diverse backgrounds and occupations, were asked to select the comparison figure that appeared most similar to the standard. Appendix A reproduces the figures used for the first 36 experiments from Goldmeier’s paper. In almost every experiment, there is an overwhelming consensus among the responses from the subjects. The first eight experiments, where the comparison figures were obtained from the standard by adding or subtracting some parts, confirms the intuitive connection between similarity and having identical parts, more precisely stated as “the degree of similarity of two objects varies directly with the number of common parts and inversely with the extent of changes in the modified parts.” However, experiments 9-11 show that the above principle is violated in some cases and suggest that proportionality should be taken into account: more proportional changes of all parts of a figure result in a more similar figure. Unfortunately experiments 12-13 show the modified principle doesn’t always hold either; they demonstrate that proportional changes to all parts of a figure sometimes lead to less, not more, similar results. Based on experiments 14- 25, Goldmeier proposed that proportionality should be maintained only for the form of a figure and not its material, which instead should be kept constant. He also suggested how to identify form and material of a figure: characteristics which are relatively small or occur in large numbers are relegated to the role of material. Finally, experiments 26-36 suggest that similarity also depends on preservation of the structure (or grouping of parts) of a figure.
5. APPLYING THE NCD TO THE GOLDMEIER TEST SETS We apply the normalized compression distance to the sets of images used for the first 36 experiments in the Goldmeier study and compare its prediction to the actual observed consensus. The test sets were scanned from Goldmeier’s monograph and stored in Microsoft bmp format (200 pixels × 200 pixels ×8 bits). They were then converted to pgm (ascii) format, and the NCD was computed for the standard and each comparison figure using four compression schemes: paq7 (representative of the context mixing family), gzip (representative of the LZ family), bzip2 (representative of the block sorting family), and jpg. These calculations were performed on a Sony Vaio workstation with dual 3.2 GHz Pentium 4 processors, 2G of RAM and running Mandriva Linux 2007, free version. The --best option was selected for gzip and bzip2; the -5 option was selected for paq7. Table 1 compares the comparison figures judged to be most similar to the standards by Goldmeier’s subjects and the ones selected by the NCD.
6. DISCUSSION From Table 1, the rate of failure is 41 when gzip is used (9 out of 36), 13 when bzip2 is used (12 out of 36), slightly less than 12 when paq7 is used (16 out of 36), and slightly more than 21 when jpg compression is used (20 out of 36). There seems to be a qualitative difference between the performance of jpg compression and those of paq7, gzip and bzip2, despite the fact that the former was designed especially to take advantage of human visual perceptual biases. It is apparent that the NCD method in general is not a completely accurate model for visual similarity as perceived by humans. Although it performs flawlessly on the first group of experiments (variations by addition and subtraction) and some experiments involving grouping structures (experiments 12, 23, 24, 36) for paq7, gzip and bzip2, the remaining experiments exposes its weakness in recognizing similarity in form and material between images (experiments 9, 13, 14, 20, 21, 22, 27).
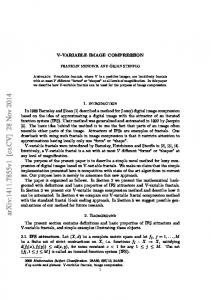
7. THE NCD AND IMAGE DISTINGUISHABILITY Players in the image watermarking context cannot modify images perceptibly; this is a special case of image similarity, which we term image distinguishability. It is easy to see that the both the information distance E(x, y) and normalized information distance d(x, y) does not measure visual distinguishability: an image x and its rotated version x0 by 90 degrees are in general clearly distinguishable and yet E(x, x0 ) and d(x, x0 ) are very small (it’s the constant size of a program that performs rotations plus the size of the angle). In addition, the effective versions of these distances often fail to capitalize on the shared information between two very similar images and hence produce misleading results. We present an experiment to illustrate this problem. Figure 37 shows four grey-scale square images in pgm format used in this experiment; the original (leftmost image) is compared against a watermarked copy, a rotated copy, and graffitized copy (top left corner). We use gzip in our calculations of the NCD’s values.
Figure 37. Test images (left to right) in pgm format: original, watermarked, right-shifted, graffitized, and rotated.
Among the four copies, it is clear that only the watermarked and right-shifted ones are visually indistinguishable to the original. This fact is not supported by the collected data in Table 2, which suggests that the graffitized version is the one most similar to the original image.
Table 1. Actual Results vs. NCD predictions for the Goldmeier’s Experiments.
01 02 03 04 05 06 07 08 09 10 11 12 13 14 15 16 17 18 19 20 21 22 23 24 25 26 27 28 29 30 31 32 33 34 35 36
Observed b d b b b b b b c c c c c b b c c c b b b d c/d c b c c b c b b b b c c b
paq7 b d b b b b b b b b b c b c c c c c b c c c c c b b b c c b c b d b b b
gzip b d b b b b b b b c c c b e d c c c b c c b c c b b b b b b b b b c c b
bzip2 b d c b b b b b b c c c b e b c c c b c c c c c b b b b c b c c b b c b
jpg c d b b c c b b b b b c b c d c c c c c c b c c b c b b b c c c c b c b
Table 2. NCD fails to predict image indistinguishability.
Image Watermarked copy Right-shifted copy Graffitized copy Rotated copy
NCD(x, y) 0.403 0.025 0.038 0.880
NCD(d) 5049 535434 8943 581922
It might be argued that when two images are very similar, the quantity max{K(x|y ∗ ), K(y|x∗ )} might be better approximated by C(d), where d is the pixel-by-pixel image difference between x and y, than by C(xy) − min{C(x), C(y)} as in the definition of the NCD. Unfortunately, this modification does not remove the difficulty. As seen in the third column in Table 2, the modified version of NCD now incorrectly predicts that the right-shifted copy is visually distinguishable from the original image. The quandary described in the above example underlies Goldmeier’s observation about singular distortions: noticeable changes are either large or easy to describe. We are thus motivated to give a an informal definition of two images being visually indistinguishable: Definition 7.1. Two images x and y are visually indistinguishable if K(x, y) is either small or close to the size of the pixel-by-pixel difference d between x and y.
8. CONCLUSIONS We reviewed the development of modern theories of visual similarity, starting with Goldmeier’s Gestalt study and ending with Li et al.’s information-theoretic formulation of information distances and their approximations. We closed the circle by repeating Goldmeier’s study but this time using the normalized compression distance (NCD) as the subject. While the NCD performed well on those comparison figures that had been varied from the standard by adding or subtracting parts, it struggled when the variations involved the form, material, and structure of the standard image. Players in the context of image watermarking must deal with images similar to the point of visually indistinguishable from one another. We showed that the NCD is also not a good predictor of image distinguishability and suggested that a suitable measure for this purpose must correctly predict small or random changes as imperceptible. For future work we plan to test the NCD on all 79 Goldmeier image sets as well as devise new test sets for color images to gain further insight into when it does or does not perform well. We will also look into alternative formulations of the NCD that will serve as a predictor of image distinguishability.
REFERENCES 1. S. E. Palmer, Vision Science: Photons to Phenomenology, MIT Press, 1999. 2. E. Goldmeier, Similarity in Visually Perceived Forms, International Universities Press, Inc., 1972. 3. N. Tran and L. Wang, “Asymptotic analyses of visual distortions: A new approach to defining transparency,” in Proceedings of the 3rd IEEE Pacific-Rim Conference on Multimedia, 2002. 4. D. H. Hubel and T. N. Wiesel, “Receptive fields of single neurons in the cat’s striate cortex,” Journal of Physiology (London) 148(574-591), 1959. 5. D. Marr and E. C. Hildreth, “Theory of edge detection,” in Proceedings of the Royal Society of London, B 200, pp. 269–294, 1980. 6. J. F. Canny, “A computational approach to edge detection,” IEEE Transactions on Pattern Analysis and Machine Intelligence 8, pp. 769–798, 1986. 7. C. Blakemore and F. W. Campbell, “On the existence of neurons in the human visual system selectively responsive to the orientation and size of retinal images,” Journal of Physiology 203, pp. 237–260, 1969.
8. E. L. J. Leeuwenberg, “A perceptual coding language for visual and auditory patterns,” American Journal of Psychology 84(3), pp. 307–349, 1971. 9. A. Rosenfeld, Picture Languages (Formal Models for Picture Recognition), Academic, New York, 1977. 10. N. Tran, “Hiding functions and computational security of image watermarking systems,” in Proceedings of the 15th IEEE Computer Security Foundations Workshop, 2002. 11. M. Li and P. Vi´ anyi, An Introduction to Kolmogorov Complexity and Its Applications, Springer, 2nd ed., 1997. 12. C. Bennett, P. Gacs, M. Li, P. Vitanyi, and W. Zurek, “Information distance,” IEEE Transactions on Information Theory 44, pp. 1407–1423, July 1998. 13. M. Li, X. Chen, X. Li, B. Ma, and P. Vitanyi, “The similarity metric,” IEEE Transactions on Information Theory 50, pp. 3250–3264, December 2004. 14. R. Cilibrasi and P. Vitanyi, “Clustering by compression,” IEEE Transactions on Information Theory 51, pp. 1523–1545, April 2005.
APPENDIX A. THE GOLDMEIER TEST SET
Figure 7. Figure 1.
Figure 8. Figure 2.
Figure 3. Figure 9.
Figure 4. Figure 10.
Figure 5. Figure 11.
Figure 6. Figure 12.
Figure 13. Figure 19.
Figure 14. Figure 20.
Figure 15. Figure 21.
Figure 16. Figure 22.
Figure 23. Figure 17.
Figure 24. Figure 18.
Figure 31. Figure 25.
Figure 32. Figure 26.
Figure 27. Figure 33.
Figure 28. Figure 34.
Figure 29. Figure 35.
Figure 30. Figure 36.