Ocean Appliance, as well as the holistic properties of a multi- ... Security. The appliance must not rely on access to user credentials on remote .... OpenBSD.
The Ocean Appliance: Complete Platform Provisioning for Low-Cost Data Sharing Bill Howe1 Nicholas Hagerty3 Ethan Van Matre1 Charles Seaton1 Antonio Baptista1 1
Center for Coastal Margin Observation and Prediction Oregon Health & Science University 20000 NW Walker Rd Beaverton, OR, USA 97006 USA
2
Portland State University Department of Computer Science 1900 SW 4th Avenue Portland, OR, USA 97201
Abstract-We report on our progress towards an Ocean Appliance – envisioned as a complete, pre-built "server-in-abox" equipped with an ocean observation database, a forecast engine, a web server publishing an extensible web interface, a suite of web services establishing interoperability, and a library of data ingest and processing functions. Collectively, these services allow efficient ingest, organization, analysis, and distribution of observations and model results with minimal onsite configuration. By packaging the hardware as well as the software, the effort required to install and adapt the tools to the environment of the local data provider is minimized, streamlining the adoption of interoperability standards and simplifying environmental data management. We report results from a pilot project using the appliance to support cruise operations and describe preparations for an upcoming multi-ship experiment involving real-time telemetry and coordinated, simultaneous analysis of forecasts and observations.
I.
INTRODUCTION
The vision of the Integrated Ocean Observing System (IOOS) [20] as a "system of systems" that interoperate via standard protocols has been well-articulated in the literature [3] [14][17][20][26]. However, implementation and deployment of production systems has thus far been primarily a grassroots effort, with individual Regional Associations working to balance their customers’ immediate needs against long-term goals of national interoperability. Observing that these providers do not necessarily have the resources to erect and maintain a standards-compliant data server, RA data managers frequently must (unilaterally) write software on their behalf. In this paper, we propose a model for managing this relationship between software providers and data providers in the oceanographic community by provisioning a complete package of hardware and software in order to reduce development, deployment, and maintenance costs. The software provided by the Regional Associations and other data aggregators is intended to “IOOS-enable” their constituent local data providers: data files produced by the instruments and data loggers are published in IOOS-compliant formats; e.g., Web Feature Service (WFS) [24], Web Mapping Service (WMS) [25], Sensor Observation Service (SOS) [3], Sensor Model Language (SensorML) [23], Simple Object
David Maier2 Paul Turner1 3
Brown University Department of Physics 75 Waterman Street Providence, RI, USA 02912
Access Protocol (SOAP) [39]. The question of interest to us is this: Where and how should such software be deployed? A natural choice is to collect raw data in a central clearinghouse before processing, but the poor scalability of this centralized approach directly motivated the IOOS design of a system of systems. An alternative is to disseminate software to the data providers for installation on their local platforms. We have directly encountered at least two problems with this latter approach. First, the cost of supporting and maintaining software in multiple unfamiliar and uncontrolled environments is prohibitively high. For example, must the authors ensure that their code runs properly on both Linux and Windows? Which distributions of Linux? What versions of various libraries must the user have installed? Second, local data providers may raise legitimate security concerns about running unfamiliar software on protected platforms, especially when the software could potentially interfere with data acquisition. To solve these problems, we carry the idea of software distribution one step further, and propose to distribute complete platforms known as appliances [4][17][40]. The appliance model of system provisioning is a delivery model in which hardware, software, and interfaces are built and bundled as a complete package that contains no “user-serviceable components.” When failure occurs, the entire appliance is replaced as a unit with a new, pre-configured system. This approach limits the uncertainty implied by installing software in heterogeneous environments, which in turn limits the cost of maintenance, either by the customers themselves or by the software suppliers in the form of technical support. Further, system administrators are able to “quarantine” the appliance to assuage security concerns. That is, local computers can read from and write to the appliance, but the appliance cannot read from or write to any network resources. Perhaps a familiar example of an appliance is a digital video recorder for your television [32]. These devices contain a conventional computer of minimal performance, a hard drive, a network interface, and some specialized peripherals such as an infrared for responding to commands from a hand-held remote. In addition to the hardware, these devices provide
We report on our experience using the appliance model to manage a cruise integrating real-time observations with the predictive capabilities of the CORIE forecasting system [1]. Finally, we describe an upcoming experiment involving three coordinated vessels linked by Ocean Appliances. II.
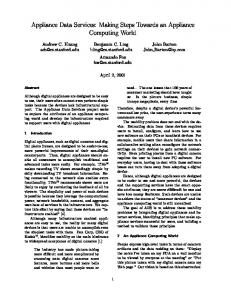
Figure 1: A cast profile product displaying multiple variables simultaneously. This product is dynamically generated, reusable in many contexts, and parameterized by cast number, vessel, and cruise. It is encoded with one SQL statement and 25 lines of Matlab-style code, most of which was derived from an existing, simpler product.
specialized software – a streamlined operating system, a user interface, network communications for downloading television schedules, and little else. The same capabilities are available in a laptop computer quipped with the proper software (and a remote), but packaging them as an appliance lowers the cost of technical support and reduces the installation effort for the consumer. Similar appliance models of service deployment are used by Rackable, Inc. [26] and Sun Microsystems, Inc. [30] and for managing massive data centers – thousands of cores are packaged into one ready-to-deploy shipping container and managed as an atomic unit. The observation is that this approach can alleviate configuration and administrative burdens normally associated with maintenance of distributed systems. The appliance model is also projected to become the dominant model of computing resource provision, according to a report by the Gartner Group [28]. In this paper, we present the design and architecture of the Ocean Appliance, as well as the holistic properties of a multiappliance system. The capabilities of the Ocean Appliance are currently modest but demonstrably satisfy our requirements for previous and planned experiments. Each unit can 1) ingest data in a variety of common formats, 2) communicate and share data with other appliances, 3) serve observations and model results via relevant standards, and 4) generate and serve a variety of data products and visualizations. The appliance provides a local abstraction to the national IOOS system of systems without requiring data providers to be individually responsible for implementing the evolving IOOS standards.
DESIGN PRINCIPLES
The design of the Ocean Appliance is informed by the following guiding principles: Ubiquity of Information. Data ingested into one Ocean Appliance will be publicly available to other Ocean Appliances; the system is not intended for use as a private server. Ubiquity of Services. Products and services available on one Ocean Appliance can be transferred to another Ocean Appliance and executed without adaptation or reconfiguration. Extensibility. New products and services should be easy to develop and trivial to deploy. For example, the multi-variable depth profile plot in Figure 1 was derived from a related single variable profile plot. Both are parameterized by vessel, cruise, and cast ID, and published to the web as dynamic, interactive, reusable products. Further, both products can be transferred to other appliances in keeping with the Ubiquity of Services principle. Besides new products, we specifically encourage the reuse of existing products in new product ensembles. We envision rapid development of task-specific interfaces. For example, we developed the Cast Dashboard (Figure 2) by assembling a selection of existing products useful for decision support and CTD cast analysis. We adopt a “factory” model of product generation: users do not define products themselves, but rather product specifications that can be used to generate many related products. The built-in extensibility lowers the barrier of entry and allows adopters to "pay as they go", expending incremental effort for incremental returns; this approach is increasingly recognized as a crucial criterion of success in large-scale data management projects [10]. Interactivity. The appliance should supply data products for immediate consumption by end user in addition to programmatic interfaces. That is, the appliance will consider the needs of end users and application developers equally. For example, the cast profile plot in Figure 2 is a visualization and therefore intended for human eyes. However, all observation products, including this one, are equipped with a simple “Download as ASCII” link (upper right) providing programmatic access to the exact dataset displayed in the plot. Low Cost. The total cost of ownership of the appliance should be low enough to be installed and maintained by small observatories. Specifically, we strive for minimal on-site configuration. Once attached to power and network resources, data ingest can begin by attaching a serial cable, by copying files, or configuring a periodic download.
Security. The appliance must not rely on access to user credentials on remote machines, shared file systems, or other secure resources for typical operation. Unobtrusiveness. The appliance should have a small physical footprint and not require a monitor or keyboard to be connected for initial installation and ongoing operation. Further, it should not exhibit unusual power requirements or make excessive noise, allowing it to be installed anywhere. Robustness. The appliance should recover from faults and inadvertent power cycling without user intervention. The appliance should be able to be deployed in harsh environments – e.g., on a research vessel or in an open-air base station. We do not require that the appliances survive immersion or direct weather. Open Source. Our appliance design serves an exemplar and demonstration of the appliance model. We encourage other groups to unilaterally experiment with and extend our design. Commensurately, the appliance has been developed using open source software exclusively. III.
MANAGING DIVERSITY
We consider diversity to be the primary challenge in managing oceanographic data. Although the appliance model combats diversity by eliminating several potential sources (computing environments, hardware, configurations), the challenge is still formidable. Consider the following sources: A. Diverse Variables We think of the Conductivity Temperature Depth (CTD) assemblages and the Acoustic Doppler Profiler (ADP) or equivalent .as the workhorses of observational physical oceanography. Considering only these two devices, we already generate a broad set of requirements for a common “data model.” The CTD reports a timeseries of point observations, while the ADP reports a timeseries of an array of 3-d vectors. The temperature sensor inside a CTD is robust, reliable, and requires modest maintenance, while the conductivity sensor can become severely bio-fouled in estuarine environments, requiring estimates of quality for proper interpretation [1]. These physical observations are increasingly augmented with biological observations, including the concentration of dissolved oxygen, nitrate, chlorophyll, and other ecological variables to provide a more complete picture of the state of the ocean, its effect on ecology and, ultimately, its effect on human health. These quantities are often linked to water samples, which in turn generate electrophoresis gels, DNA sequences, and annotations derived from genomic databases. B. Diverse Sensor Platforms Oceanographic sensors can be deployed on a variety of platforms, including fixed moorings for long-term coverage of strategic locations, moorings with vertical profiling capabilities, anchored buoys, passive drifters, vessels, undulating gliders, unmanned underwater vehicles (UUVs),
Figure 2: Dynamic product ensemble crafted for CTD cast analysis and ship-board decision support. Upper left: Context information for the slected cruise providing current time, current location, most recent cast location. Upper right: Map showing cruise trajectory against the bottom salinity as reported by the best available forecast. This quadrant also displays a tide chart extracted from a NOAA website. Bottom left: A table of observations reported by the selected CTD cast. Bottom right: One of several real-time plots available based on cast observations.
aircraft, and satellites. For a fixed mooring, the location of the measurements rarely or never changes, so re-transmitting latitude and longitude with each individual measurement is wasteful and potentially misleading (in relational terms, the functional dependency between the sensor identifier and the coordinates is not captured.) However, other platforms generate observations following more dynamic trajectories in time and space; for example, vessels, (and prospectively, UUVs and gliders) may break pre-defined cruise plans to follow a strong salinity gradient to its source. Observations may not even be points in space and time: Satellites and landbased High Frequency Radar systems are capable of measuring wave height and surface velocity over a wide area simultaneously. Measurements are in this case reported as a "grid" of data, a data structure that carries a challenging set of requirements in its own right [8]. The diversity of platforms leads to a diversity in requirements: even a "lowest common denominator" data model must thus be rather sophisticated. C. Diverse Applications The appropriate interface to ocean observation data, as with any other kind of data, should be driven by the requirements of the applications that will exercise it. Here again, though, we find remarkable diversity. Long-term, gapless, qualitycontrolled coverage of a point or region is most useful for scientific applications to gain insight into low-frequency signals such as the effect of climate change on salmon habitability. However, decision support applications such as search and rescue often require real-time access to any and all
Figure 3: The external chassis of the Ocean Appliance.
observations that might be useful (wind, surface velocity, temperature), even if their quality is not fully known. D. Diverse Data Providers Although some operators of oceanographic sensors have established budgets for building and maintaining sophisticated data management software, this situation is far from universal. Many sensor platforms are operated by small colleges or local government agencies with limited information technology resources. A successful data management system should accommodate both extremes of sophistication: it should be easy to implement a minimally compliant programmatic interface (basic search, browse, and query), but it should be sufficiently extensible to accommodate advanced features when required. A poor example of a good standard for data access and exchange is a rich query language, perhaps based on Structured Query Language (SQL). Local observatories may not have the resources to design and deploy a relational database system, nor can they be expected to parse, plan, optimize, and execute complex queries over their native files. Consumers of these observation streams would need to fall back on old habits; e.g., downloading and parsing ASCII files via FTP and custom scripts, respectively. IV.
ARCHITECTURE
There are five components to the appliance architecture: the basic platform stack (hardware, operating system, database, web server), ingest procedures, visualization capabilities, telemetry, and standards-compliant web services for data access.
A. Platform Stack: Hardware, Operating System, Database, Web Server The chassis is shown in Figure 3. The current appliance platform is based on commodity hardware. The Antec NSK1300 enclosure is rugged, compact and has sufficient cooling to support modern motherboards and peripherals. The footprint is modest: 12.5" x 7.5" x 7.5" high. Included in the enclosure is a 350 watt power supply with a 100mm variable speed fan. In keeping with the idea to use commercial hardware selected to work in shipboard environments this enclosure houses an Intel D102GGC2 motherboard. This motherboard is in the MicroATX form factor and includes onboard USB, SATA, IDE, and 10/100 Ethernet interfaces. We outfit the motherboard with 2 GB memory and a Dual Core 3.0 GHz Pentium CPU. Storage devices include 250 GB SATA disk drive and a CDROM or DVD for data loading. The total cost of the hardware is approximately $550. For connectivity with instruments, we installed 2 dual port serial cards based on 16C550 compatible UARTs. This gives us 4 serial ports without requiring software support from the operating system. The first port is configured to allow a user to login to the system in case of network failure (we cannot rely on a keyboard, mouse, or monitor available for attachment.) The other three reserved for serial I/O devices. The operating system is Fedora Core 6, since it is widely supported by hardware vendors, it is licensed under GPL, and since the open source community provides timely updates consisting of both security patches and functional enhancements. Initially we deployed the x486-based “bricks” with OpenBSD. This OS required a license fee be paid and had limited community support. Additionally, it came preconfigured with extensive security features, which limited our ability to respond in the field to changing mission requirements. The database system is implemented with PostgreSQL [30] with geographic extensions supplied by PostGIS [26]. The database design is two-tiered: There is an integrated schema capturing observations in a generic manner that we refer to as Ocean Observing System Database (OOSDB) [11]. Observations are grouped into a single table regardless of their source. Metadata providing provenance for the observations are organized in a similarly generic manner: each observation is linked to a mission and a sensor configuration. The sensor configuration identifies the variable, the units, the rank (i.e., vector or scalar), and any calibration information needed for proper interpretation. Unit conversion formulas can be explicitly recorded in the database, allowing transparent conversions to avoid queries that return nonsensical mixed units. The mission identifies the platform, the experiment, the owning agency and other operational metadata. An entityrelationship diagram for the integrated schema appears in Figure 4.
To address the diversity of variables, each stream of observations is decomposed into individual measurements, each recorded at a unique space and time. Specifically, each observation is keyed on three attributes: time, location, and depth. The time attribute has type TIMESTAMP WITH TIME ZONE as described in the SQL standard and as implemented in PostgreSQL. This data type physically represents all times in UTC but allows ingest and transparent conversion of data from any time zone. The location attribute has type GEOMETRY, a data type supplied by the PostGIS extensions to manage geographic coordinate transformations and map projections, allowing data to be properly projected onto maps in arbitrary coordinates. The depth column is a user-defined type consisting of a numeric value and a datum. We have not yet implemented transparent datum conversion functions for depths. The value attribute of the observation table is represented as an array of floating point numbers. Despite apparent violation of normalization rules requiring that each attribute hold an atomic value, this feature has been a part of PostgreSQL for many years, and has proven its utility. We use the array to model vectors so that velocity components can be stored (and therefore retrieved) together. In addition to the integrated schema, we have a handful of platform-specific schemas. For example, we have a mooring schema tailored for simplified ingest and query of data acquired from fixed mooring. These observations are stored in separate tables corresponding to each instrument type: ADP, CTD, and a handful of others. Data loaded into a platformspecific schema is automatically inserted into the integrated schema via the rule system of PostgreSQL. Rules allow incoming queries to be rewritten on the fly to change their behavior. The platform-specific schemas exist for two reasons: First, users who only work with specific platform types find the integrated schema difficult to understand, and therefore, difficult to query when developing new data products. Second, the platform-specific schemas provide a layer of indirection between user applications and the integrated schema, allowing us freedom to evolve the integrated schema as we see fit. These schemas therefore provide what is known as logical data independence, one of the hallmark benefits of the relational model. The web applications are served by the extremely popular open source Apache web server, and the site is powered by Drupal, an open source content management system oriented toward community development with a strong network of developers and a satisfied customer base. Drupal allows users to dynamically create and edit their own pages, blogs, forums, and much more. Content can be authored in HTML under
various levels of restricted syntax, or in PHP itself, allowing rich applications to be “branded” and formatted automatically. For mapping applications, we rely extensively on MapServer [15], a reliable open source GIS workhorse that integrates tightly with PostGIS. We have deployed more interactive, dynamic mapping applications using Google Maps [6] and OpenLayers [26], but find the reliability and consistency of MapServer are highly desirable for rapid development of new applications, a feature mandated by our design principle of extensibility. B. Observation Ingest The diversity in variables, sensors, and manufacturers makes it difficult to homogenize the streams from different platforms. One solution developed by the Monterey Bay Aquarium and Research Institute is the PUCK [8], a programmable hardware device inserted between the sensor and the acquisition computer that fills in missing metadata (instrument information, time, location, etc.). We consider the PUCK to be an excellent use of the appliance model, where capabilities are deployed in a self-contained hardware and software package for simplified installation. Unfortunately, though, we do not always have access to the “final mile” in the telemetry pipeline – i.e., the connection between the sensor and the acquisition system. We therefore must be able to properly interpret data from a variety of sources, including ASCII files in custom formats, raw NMEA feeds, and proprietary binary formats interpretable only by manufacturer’s software. Beginning over 10 years ago with the CORIE project, our group has generated a suite of tools for processing a variety of these heterogeneous data formats. A first step in building the appliance was to gather these tools into a common library, refactoring, updating, and rewriting them as necessary. Our ingest library is written in Python and includes handlers for CTD cast data, ADCP ping data, and NMEA streams from ship-board navigation systems. Much of our CTD cast data is acquired through technology from Seabird, Inc. To interpret the output of a Seabird sensor, it is imperative to use the Seabird software directly, as the processing routines are attenuated to the specific details of the sensor itself. Unfortunately, this software was not designed with external programmatic interfaces in mind. We are forced to run their DOS-based programs on a virtual machine, and then analyze the ASCII output. In addition to comprehension of CTD cast data from Sea-Bird Electronics, Inc.[35], we also have ingesters written for ADCP ping data from SonTek [36] and RDI [37] devices, as well as an interface to the excellent University of Hawaii Data Acquisition System (UHDAS) [11] for processing and quality control of ADCP ping data.
Figure 4: A fragment of the integrated schema used by the Ocean Appliance to model observations originating from arbitrary sources.
Parsing, along with several other tasks, is the responsibility of the ingester. The ingester is a streaming query engine allowing complex filtering pipelines to be composed from simpler functions. There are two extensible Python classes that interoperate to manage parsing, logging, cleaning, metadata attachment, and database insertion. A Scanner monitors a directory (recursively) for files that satisfy some condition. Matching files have their contents extracted and their current size recorded. When the files are modified, the Linux kernel sends a signal to the scanner indicating that another read is required. The scanner reads the newly appended portion of the file and passes the block of unparsed data along to a pipeline of filters. Each filter object performs a specific task on a single unit of data: we have filters that log messages, parse blocks of output, query the database, etc. Each filter operates in its own thread. A chain of filters are linked by synchronized queues, so time-consuming or I/O intensive tasks can overlap with each other, improving overall performance. For example, the filter that processes the Seabird output is not particularly efficient due to its dependency on the original Seabird software. When a new cast is being parsed by the seabird filter, the previous cast can simultaneously be loaded into the database; an I/O intensive operation. Processing pipelines consisting of chained scanners and filters have been developed for processing data streams from several instruments on several vessels. Although there are a few cases where custom scanners were mandated by the nonstandard file formats encountered on the vessel, the pipelines are usually specific only to a manufacturer, suggesting that they can be re-used at other institutions. We plan to release our ingest routines as an open-source library once upcoming tests are complete. C. Telemetry and Communications A core concept of our appliance design is agnosticism with respect to the underlying network protocols. Our initial network design was based on 900 MHz “serial modem” radios running SLIP for point to point connectivity. Routing rules needed to be configured precisely; mistakes require hands-on correction.
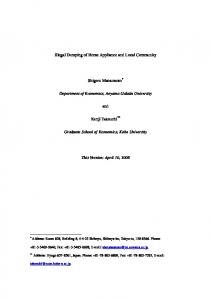
With the advent of SWAP radios standards based routing became feasible. Appliances connected to a SWAP radio obtained network connectivity as they joined a SWAP network. Making and breaking connection as dictated by ships movement. SWAP is based on the 802.11b wireless standard providing up to 11 mbps connectivity. Using a combination of antennas and power amplifiers we have seen connectivity up to 40 nautical miles offshore (Figure 4), though typical connectivity limits are 20 nautical miles offshore with 1 mbps throughput. SWAP radio systems are designed as firewalls and do not allow external connections into the SWAP radio systems. This limits our appliance to originating network connections. To address this problem, we have deployed a Cisco ASA5510 Virtual Private Network appliance. When an appliance appears in range, the client establishes a secure tunnel to the shore-side network infrastructure. This tunnel is independent and isolated from the intervening network devices and is able to allow direct automated or manually initiated network access to the appliances. Transfer of application data across the network to remote appliances is achieved in one of three ways: via FTP of the raw files, through the web services, and through subscriptions to relational tables. The subscription service is the primary mechanism for appliance-to-appliance transfer, for three reasons. Applications are not intended to access the raw files; they are included for provenance purposes only. The web services are not ideal for this purpose for two reasons. First, although these services provide uniform programmatic access to all data sources, this uniformity can incur a loss of information for complex data types. For example, a CTD cast can be decomposed into individual observations for compatibility with applications that only understand point observations. However, the cast structure is important for cruise-oriented applications: biological samples are labeled with the "surface," "bottom," and "middle" of the cast during which they were collected. Labeling the samples with specific observations does not provide a complete context. Second, web services do not provide the transactional semantics of a
relational database, incurring a durability risk, where the data is acknowledged as received, but has not necessarily been committed to permanent storage. For these reasons, we implement our primary telemetry mechanism using subscriptions to relational tables directly. A target appliance subscribes to a table on a host appliance using a Subscription Broker. The Subscription Broker accepts two domain names representing two appliances and a table name as arguments. The first argument is the “source” and the second argument is the “target.” The Subscription Broker establishes connections to each database and provides several methods for manipulating the Subscriptions. In the current implementation, the Subscribe method creates a new Boolean column on the table (if necessary) named unsent_to_target, where target is the name of the target host. The new column can have three values: NULL, True, and False. NULL indicates the record was inserted at a time when the subscription was not active. True indicates the record has not yet been uploaded to the host. False indicates that the record has been successfully transmitted from source to target. In addition to creating the column, the Subscribe method sets the default to True, meaning that all subsequently inserted records will be marked for upload to the target host. Existing records, however, do not have their values updated, for two reasons: First, updating every record of a large table takes significant time and can generates many holes that need to be vacuumed; Second, the subscription semantics are more flexible this way, since only those tuples that are inserted while the subscription is active are marked for upload. This design allows the Unsubscribe method to simply remove the default value from the column -- it does not need to touch any data. The Unsubscribe method simply erases the default setting (at negligible cost), meaning that subsequently inserted records will default to NULL. The Subscription Broker also provides methods to drop the subscription columns. However, since relational databases cannot efficiently drop columns, this method is rarely used. We plan to develop a different implementation of the Subscription Broker that uses triggers on source tables rather than flag columns. The current approach, however, is more amenable to schema changes, which are still rather frequent during prototyping and initial testing. The Subscription Broker is instructed to retrieve and transmit unsent tuples by the Transfer method. Since individual tuples rather than complex objects are transmitted, there is a possibility that tuples may be transmitted before other tuples on which they depend, incurring a foreign key violation in the target database. If foreign keys are violated during upload, then an exception is raised (thanks to the integrity constraints enforced by the relational database) and the tuples are not marked as sent. It is important to therefore transfer table content in manner that respects the topology of the schema -- parents should be uploaded before children. A more sophisticated broker is not difficult to implement: for each tuple to be uploaded, make sure that any other tuples
(a)
Washington
Oregon
Figure 5: Cruise path for the April 2007 cruise of the Center for Coastal Margin Observation and Prediction. The higlighted portions indicate connectivity with the shore. (a) 20km theoretical limit radio range.
referenced via foreign keys are uploaded first. We are currently exploring this design. Transmission in unreliable network conditions exposes starvation and fairness issues: when serving subscriptions for multiple tables that are all receiving constant updates, all tables must eventually have their tuples transmitted, and at more or less the same rate. The Subscription Broker therefore adopts a simple round-robin scheme, where a configurable number of tuples are transmitted for one table before moving onto the next. The subscription service is agnostic with respect to "push" or "pull" semantics, and can therefore be run on either host. In our testbed application, we run the service on the vessels, since each vessel can see the server without relying on the VPN. D. Products and Visualization We have recently augmented an extensive suite of “standard” products with dynamic, interactive products, product ensembles, and full-featured applications. For the Pilot Experiment in April 2007, we tested the Cruise Mapper, a MapServer application integrating model results from a variety of forecasts with nautical charts, bathymetry charts, and dynamic cruise information. Observing that the number of products we are capable of providing to users can be overwhelming we have recently begun to focus on task-specific interfaces that arrange specialized products to provide context and information for scientists to efficiently complete specific tasks. One such interface is the Cast Dashboard for real-time vessel decision support.
Figure 6: A data product written in 13 lines of code using the gridfield algebra. Right pane: Plume of fresh water at the mouth of the Columbia River. Left pane: areas of maximum salinity gradient illustrating the plume front.
The Cast Dashboard (Figure 2) is a single-screen interface bringing together a small set of task-specific products and tools for taking, reviewing and planning CTD casts. Most of these products and tools either existed previously or were easily derived from existing ones. The screen is divided into four quadrants: The top left displays context information about the current time, vessel and cruise, and the results of the last cast. The top right can display a small map showing the cruise path, location of casts, current location, and forecasted bottom salinity. Clicking on this map redirects the user to the full controls of the Cruise Mapper. A short menu can change the top right to a tide chart extracted from a NOAA web site, or a animation showing forecasted bottom salinity over 72 hours. The bottom left can display tables of time and location of all casts or CTD data of one selected cast, or a form for entering data about water samples and other non-automated cast metadata. Finally, the bottom right can display one of several products from the “product factory,” including: a single- or multi-variable individual cast profile, a cast-model comparison profile, a timeseries of cast profiles colored by a selected variable, and a salinity/temperature mixing plot for a selected cast. Contrast the task-specific Dashboard with the alternative model of a comprehensive directory of all available products; under the constrained conditions of a research cruise, users cannot waste time browsing for a particular product. The Cast Dashboard was first deployed on a cruise in July 2007 and was received with enthusiasm.
for the Sensor Observation Service [23]. The SOS standard specifies a core API of the following three methods: • GetCapabilities returns information about the data inventory and supported access methods. This method is used in support of discovery services. • DescribeSensor returns metadata of varying detail about a given sensor. The description format follows a separate standard that is rapidly gaining momentum: SensorML [23]. • GetObservation is the basic query primitive for returning the latest value of a given variable for a given sensor platform. Additional arguments can be supplied to filter results by space and time. As part of our collaboration on OOSTethys, we have developed PySOS, a pure-Python SOS server for publishing data from an arbitrary relational database. This service is not dependent on the OOSDB schema and can be configured to work with any relational schema by writing just four SQL queries. The system has been released as open source on the OOSTethys site [11]. The SOS service hosted at the Center for Coastal Margin Observation and Prediction (CMOP) is consumed by several projects, including a real-time water quality pilot project [33] between the National Association of Networked Ocean Observing Systems (NANOOS) [18] and the National Estuarine Research Reserve System (NERRS) [19]. In contrast to point observations, model results of nontrivial scope cannot be effectively managed in a relational database due to their size and use of mesh-oriented data structures and algorithms [8]. We therefore use two strategies to provide programmatic interfaces to our model results. First, we have defined a set of web services that emulate real-world observational platforms, but provide access to the “virtual ocean” delivered by the model. Specifically, we provide a web service that returns a depth profile for an arbitrary variable at arbitrary lat/lon coordinates representing a virtual CTD cast over the side of a virtual vessel. Using this basic web service, we derive additional services emulating the flowthrough sensor packages on our research vessels, fixed moorings including those with vertical mobility, and additional platforms such as UUVs and autonomous gliders. Second, we provide a flexible language for expressing more complex 2-d and 3-d products and serve them over WMS [25]. Using the gridfield language [9], we can efficiently generate stratification products (surface salinity - bottom salinity), upwelling metrics (surface temperature – bottom temperature)/bottom temperature, aggregates over depth, virtual moorings, and emulate fixed stations. V.
E. Interoperability via Web Services Ingested observational data is automatically published via web services. Specifically, we have been working closely with the OOSTethys project [3] to develop servers and clients
PILOT EXPERIMENT
In April 2007, CMOP conducted its inaugural cruise with the R/V Wecoma. Cruise goals were to retrieve and deploy shelf buoys and to collect water samples from CTD casts along five coastal transects to investigate microbial population diversity across salinity gradients generated by the Columbia
River plume. This cruise also served as a pilot test of the Ocean Appliance. Figure 5 displays a map of the cruise path annotated with (a) the theoretical limit of the SWAP radio network, and (b) the locations of successful connectivity between ship and shore. The fact that connectivity was achieved outside the theoretical maximum range of the radio technology is attributable to cloud cover providing a reflective surface. Gaps in connectivity within the 20 km limit are attributable to areas of unreliable SWAP coverage. The intermittent nature of ship-to-shore communications requires design consideration at the application level. Specifically, as model results are pushed to the vessel and observations are pushed to the shore, limited bandwidth must be allocated carefully. These priority decisions are non-trivial: For example, the data stream from the navigation computer is crucial, but can be aggressively down sampled from its source rate of one observation every three seconds. However, observations from the CTD device must be packaged as a unit to guarantee that important features of the profile (e.g., sea state at sample depths) are preserved for collaborative analysis. The communication of model results admits more complex strategies. The results themselves are large: 5 GB for one simulation day of five primary physical variables (salinity, temperature, horizontal velocity, vertical velocity, elevation). Apart from bandwidth considerations, having these unprocessed results available on the ship is ideal, as the complete suite of analysis tools are then applicable. However, the bandwidth of the SWAP network can at times narrow to 15-20 kb/sec, requiring more time to transmit the results than the period being simulated! Several alternatives exist: First, the relevant products from the standard product inventory may be sent to the vessel rather than the raw output. Isoline animations of the type shown in Figure 6 are useful for inspecting the gross behavior of features such as the Columbia River plume; these products represent several days of simulated time and are 652kB each. Model-data comparisons are necessary to assess model skill; these products depend on successful upload of ship observations. Distributing products only precludes custom analysis: users and administrators must predict which products will be most useful. The spatial and temporal regions of interest are somewhat easier to predict than the nature of the scientific questions that might arise, so a second communication strategy is to transmit only those regions of the model’s domain that are relevant to the cruise. This approach is conceptually simple, but requires a sophisticated infrastructure. Specifically, every software artifact that handles the model results must be designed to transparently tolerate arbitrary subsets of the full results regardless of size or shape. Our progress with this approach has been accelerated by the gridfield algebra [8], a language for manipulating simulation results as first class citizens, without regard to their internal structure. Using gridfields as a subsystem, model results can
be efficiently broken up on the server, selectively and incrementally delivered to the vessel, and then reassembled as needed. The system provides a framework in which to explore and optimize spatio-temporal distribution and prioritization policies. For example, the region around the vessel’s planned track can be pre-fetched using the gridfield system, as can regions of scientific focus, such as the Columbia River plume and hypoxic zones. Beyond data delivery optimization, gridfields provide an expressive language for rapidly developing complex data products. The product in Figure 6 is expressed in 13 lines of code. The right pane displays salinity in the region of the plume (the mouth of the Columbia River is just visible at center-right). The left pane shows isolines of salinity gradient subjected to a threshold. The regions of high gradient clearly illustrate the plume front. A third strategy for exchanging data with the vessel, and the one we adopt in our current pilot experiments, is to pre-load an extended (7-day) forecast on each vessel, then update them incrementally during port calls. This approach is clearly the most primitive, but it ensures that a viable model is available for all regions and all times. Beyond the upload of observations and download of forecasts, the April Cruise allowed us to assay our initial analysis interfaces. The Cruise Mapper was exercised in a dynamic cruise planning decision. Ahead of schedule, an extra cast near the plume was considered as a course change. However, the forecasts displayed in the Cruise Mapper indicated that the plume had turned northward and was unlikely to be caught in the allotted time. The on-board availability of model results visible through the Cruise Mapper saved significant time and effort. VI.
MULTI-SHIP EXPERIMENT
We envision the Ocean Appliance to support cruises of evolving complexity, including, starting in 2008, CMOP cruises requiring the coordination of multiple vessels, an airplane, two gliders, an UUV, an observation network with adjustable vertical profiling capabilities, and near-real time model forecasts. Towards this goal, the next test will be a coordinated threevessel cruise, to be conducted in August 2007. This will be the first CMOP river-to-ocean cruise, and will include in-context characterization of microbial communities and activity in high gradient regions such as estuarine turbidity maxima, plume fronts, coastal eddies and upwelling regions. The three vessels will be outfitted with an Ocean Appliance, each differing only in the “final mile” of the data acquisition procedures. Informed by the success of the ExView system tested during the 2006 Shallow Water Survey [14], we plan to provide near-real time broadcast of a range of observations (from vessels, the CORIE observation network, and airborne sensors) and of model simulations to all vessels using appliance-to-appliance communications. The ExView system
itself was not re-deployable in our environment, as it is tightly coupled to the specific platforms and equipment in use at Woods Hole Oceanographic Institute. Our goal is to not only satisfy the science goals of the cruise, but to test a reusable, redeployable system for data ingest and management. ACKNOWLEDGMENTS Funding for CORIE and extensions thereof, as well as for CORIE-based science, has been provided in part by various programs within the National Science Foundation, National Oceanic and Atmospheric Administration, US Army Corps of Engineers, Bonneville Power Administration, US Fish and Wildlife Service, Office of Naval Research, Oregon Department of Geology and Mineral Industries, and the City of Astoria. Funding for the Ocean Appliance has been provided in part by the National Science Foundation (OCE0424602 and ACI-0121475) and the National Oceanic and Atmospheric Administration through the Northwest Association of Networked Ocean Observing Systems. REFERENCES [1] [2] [3]
[4] [5] [6] [7] [8]
[9] [10] [11] [12] [13]
[14]
Archer, C., Baptista, A., Leen, T., Fault Detection for Salinity Sensors in the Columbia Estuary, Technical Report CSE-02-011, OGI School of Science & Engineering at Oregon Health & Science University, 2002. Baptista, A.M., "CORIE: the first decade of a coastal-margin collaborative observatory," presented at Oceans'06, MTS/ IEEE, Boston, MA, 2006 Bermudez, L.E., Bogden, P., Bridger, E., Creager, G., Forrest, D., and Graybeal, J., "Toward an Ocean Observing System of Systems", in Proceedings of the Oceans'06 MTS/IEEE-Boston September 18-21, 2006. Codd, E. F., The Relational Model for Database Management: Version 2. Addison-Wesley Longman Publishing Co., Inc., 1990. Drupal, http://drupal.org/ Google Maps API, http://www.google.com/apis/maps/ Google search appliance. http://www.google.com/ enterprise/. Headley, K.L., Davis, D., Edgington, D., McBride, L., O'Reilly, T.C. Risi, M., Managing sensor network configuration and metadata in ocean observatories using instrument pucks, The 3rd International Workshop on the Scientific Use of Submarine Cables and Related Technologies, 2003. Howe, B. and Maier, D., “Algebraic Manipulation of Scientific Datasets.” VLDB Journal, 14:4, 2005, pp. 397-416. Howe, B., Maier, D., “Smoothing the ROI Curve for Scientific Data Management Applications” Third Biennial Conference on Innovative Data Systems Research (CIDR), 2007. Howe, B., PySOS: Generic Sensor Observation Service for Relational Database Management Systems, released May 2007, http://www.oostethys.org/ downloads/sos-cookbook-python Hummon, J., Firing, E., Shipboard ADCP Systems and Heading Sensors — Status Reports In Proceedings of the International Marine Technicians Symposium, 2006 Myers, E., A. Zhang, F. Aikman, Y. Zhang, A. Baptista, P. Turner and C. Seaton. Evaluation and Transition of a Columbia River Nowcast/Forecast Circulation Model to NOAA’s National Ocean Service,” extended abstract, Coastal Zone ‘07, Portland, OR, July 2007 Maffei, A., Lerner, S., Lynch, J., Newhall, A., Sellers, C., Glenn, S., Fall, K., Exview: A Real-Time Collaboration Environment For Multi-Ship Experiments.
[15] MapServer, http://mapserver.gis.umn.edu/ [16] Martin, James N. “Modeling and Architecture Considerations for Systems of Systems.” 2004 Systems and Software Technology Conference, Salt Lake City, UT, 21 Apr. 2004 [17] MBX Systems, MBX Leads Quest Software Into Uncharted Territory – Appliances, http://www.motherboardx.com/oem/success_stories/Quest_Software/ind ex.cfm, viewed August 2007 [18] The National Association of Networked Ocean Observing Systems, http://www.nanoos.org/ [19] The National Estuarine Research Reserve System, http://www.nerrs.noaa.gov/ [20] The National Office for Integrated and Sustained Ocean Observations, Data Management and Communications Plan for Research and Operational Integrated Ocean Observing Systems, Ocean.US Publication No. 6, March 2005; Part I: Overview; Section 3: Governance, Oversight, and Coordination, IOOS/DMAC Standards Process, page 49 [21] OpenBSD, http://www.openbsd.org/ [22] Ocean.US, 2002. An Integrated and Sustained Ocean Observing System (IOOS) for the United States: Design and Implementation. Ocean.US, Arlington, VA. [23] Open Geospatial Consortium Inc., OpenGIS Sensor Model Language (SensorML), OpenGIS Specification, Document # 07-000, http://www.opengeospatial.org/standards/sensorml/, viewed August 2007 [24] Open Geospatial Consortium Inc., OpenGIS Web Feature Service Implementation Specification (WFS), OpenGIS Specification, Document # 04-094, http://www.opengeospatial.org/standards/wfs, viewed August 2007 [25] Open Geospatial Consortium Inc., OpenGIS Web Mapping Service Implementation Specification (WMS), OpenGIS Specification, Document # 03-109r1, http://www.opengeospatial.org/standards/wfs, viewed August 2007 [26] OpenLayers, http://www.openlayers.org/ [27] PostGIS, http://postgis.refractions.net/ [28] Prentice, S. “From Computers to the Appliance Model: Is 2007 the Tipping Point?”, Gartner Group White Paper, March 14 2007. [29] Rackable, Inc., Concentro Modular Data Center, http://www.rackable.com/solutions/Concentro_datasheet.pdf, viewed August 2007 [30] Stonebraker, M., Rowe, L., and Hirohama, M.,. The Implementation of Postgres. IEEE Transactions on Knowledge and Data Engineering, 2(1):125–142, 1990. [31] Sun Microsystems, Inc., Project BlackBox, http://www.sun.com/emrkt/blackbox/index.jsp, viewed August 2007 [32] Tivo, Inc, http://www.tivo.com/ [33] Real-time Water Quality Data for Shellfish Growers in the Pacific Northwest, A pilot project between NANOOS and the National Estuarine Research Reserve System, http://unsc-design.mindfly.net/ [34] Vorthman, R. G., Jr., Linn, J. W., III and Klein, F., Managing IOOS Regional Association Development with Today’s Systems Engineering Approach, MTS/IEEE OCEANS ’06 Conference in Boston, MA, September 18-21, 2006. [35] Sea-Bird Electronics, Inc., http://www.seabird.com/Index.htm [36] SonTek, Inc., http://www.sontek.com/ [37] Teledyne RD Instruments, http://www.rdinstruments.com/ [38] Vorthman, R. G., Jr. and Holt, S. M., Towards a Rational Approach to Standards for Integrated Ocean Observing Systems (IOOS) Development [39] W3C, Simple Object Access Protocol (SOAP), version 1.2, W3C Recommendation, April 2007. [40] XAP Server Appliance, http://xornet.net/html/appbenefits.html, viewed August 2007